DOI:10.32604/biocell.2022.018117
| BIOCELL DOI:10.32604/biocell.2022.018117 | |
| Article |
Molecular mechanisms of Tanshinone IIA in Hepatocellular carcinoma therapy via WGCNA-based network pharmacology analysis
1School of Medicine, Jianghan University, Wuhan, 430056, China
2Department of Mechanics and Engineering Structure, Wuhan University of Technology, Wuhan, 430070, China
*Address correspondence to: Meng Fang, fangmeng@jhun.edu.cn
Received: 30 June 2021; Accepted: 01 September 2021
Abstract: Hepatocellular carcinoma (HCC) is a worldwide malignant tumor that caused irreversible consequences. Tanshinone IIA has been shown to play a notable role in HCC treatment. However, the potential targets and associating mechanism of Tanshinone IIA against HCC remain unknown. We first screened out 105 overlapping genes by integrating the predicted targets of Tanshinone IIA from multiple databases and the differentially expressed genes of HCC from the Cancer Genome Atlas (TCGA) database. Then, we performed weighted gene co-expression network analysis (WGCNA) using the RNA-seq profiles of overlapping genes and HCC-related clinical information. 23 genes related to clinical tumor grade in the important module were imported for Gene Ontology (GO) enrichment, Kyoto Encyclopedia of Genes and Genomes (KEGG) analysis and protein-protein interaction (PPI) analysis. Comparing the key genes in the important module from WGCNA with the high connectivity nodes from the PPI network, we identified three hub genes, AURKB, KIF11, and PLK1. For further verification, we tested the binding of Tanshinone IIA to three hub genes. The survival curve, receiver operating characteristic (ROC) curve, mRNA expression, and protein expression were also used to validate the hub genes. In the study, WGCNA revealed grade-specific gene modules, and the following KEGG pathway analysis indicated that Tanshinone IIA probably plays therapeutical effect in the development of HCC, especially in the cell cycle. Our result partially explained the pharmacological mechanism of Tanshinone IIA against HCC.
Keywords: Tanshinone IIA; Hepatocellular carcinoma; Network pharmacology; WGCNA; Molecular docking
| List of abbreviations | |
| HCC: | Hepatocellular carcinoma |
| TCGA: | The Cancer Genome Atlas |
| GO: | Gene Ontology |
| KEGG: | Kyoto Encyclopedia of Genes and Genomes |
| PPI: | Protein-protein interaction |
| AURKB: | Aurora kinase B |
| KIF11: | Kinesin family member 11 |
| PLK1: | Polo like kinase |
| ROC: | Receiver operating characteristic |
| TCMSP: | Traditional Chinese Medicine Systems Pharmacology |
| ADME: | Absorption, distribution, metabolism, and excretion |
| MW: | Molecular weight |
| OB: | Oral bioavailability |
| BBB: | Blood brain barrier |
| DL: | Drug-likeness |
| FASA: | Fractional negative surface area |
| TPSA: | The polar surface area |
| DEGs: | Different expression genes |
| MM: | Module membership |
| GS: | Gene significance |
| AUC: | Area under curve |
| BP: | Biological process |
| CC: | Cell component |
| MF: | Molecular function |
| GEO: | Gene Expression Omnibus |
Hepatocellular carcinoma (HCC), the leading kind of liver cancer, is a heterogeneously distributed malignant tumor (Longerich, 2020). Risk factors, such as chronic hepatitis B/C virus, genetic and epigenetic factors, have been identified as the causes of HCC (Forner et al., 2018; Llovet et al., 2016). Despite the development of surgical treatment and immunotherapy (Khemlina et al., 2017), the survival rates remain low (Torre et al., 2015). The prognosis of HCC is very poor because of the recurrence rate and metastasis rate. Liver transplantation is the most effective treatment in early-stage liver cancer therapy (Forner et al., 2018; Grandhi et al., 2016). However, the donor resources are quite scarce and limited. The persistently high recurrence rate and metastasis rate and inadequate liver function after surgery also challenged the effect of liver transplantation. This makes the treatment less curable although the surgery seems to be considerably successful in a sense. Sorafenib is the only effective drug that was approved by the Food and Drug Administration (FDA) for advanced stage HCC (Knudsen et al., 2014). However, it causes many side effects (Deng et al., 2015; Llovet et al., 2008). In addition, the patient’s prognosis remains dismal (Llovet et al., 2008), because of the low response rate of sorafenib and the low median overall survival. Therefore, the development of innovative treatments for HCC is of paramount clinical importance. We must consider many aspects to find a more effective and safer treatment for HCC.
Tanshinone IIA is extracted from Chinese medicine Salvia miltiorrhiza Bunge (Gao et al., 2012). It has been reported that Tanshinone IIA participates in numerous biological functions, containing widely accepted antiangiogenic function (Lee et al., 2017), antioxidant (Gao et al., 2008) and anti-inflammatory effect (Yin et al., 2012). From clinical cases, Tanshinone IIA has been used for the treatment of cancer. The studies reported that the patient with acute promyelocytic leukemia achieved complete remission after nearly 8 weeks or 8–12 weeks of Tanshinone IIA treatment by different administration methods and doses (80 mg, i.v. once per day, or 30 mg, oral, twice per day) (Yang et al., 2010; Yang and Liu, 2006). The above case reports suggest that Tanshinone IIA is a promising clinical anticancer drug candidate. Meanwhile, more and more experimental studies have also indicated that Tanshinone IIA has a new use in anticancer (Lu et al., 2009; Shi et al., 2019; Wang et al., 2005). In recent years, its positive effects in anti-HCC have been studied in clinical (Ting et al., 2017) and more in experiments (Dai et al., 2012; Hu et al., 2016; Liu et al., 2020; Long et al., 2011; Ma et al., 2013). The experimental studies found that Tanshinone IIA inhibits HCC by inhibiting proliferation, and inducing apoptosis of cancer cells (Lin et al., 2016; Ren et al., 2017), through arresting the cell cycle in the G0/G1 phase (Dai et al., 2012; Tang et al., 2003), G1 phase (Ren et al., 2017), and G2/M phase (Cheng and Su, 2010). Additionally, Tanshinone IIA inhibits HCC cell migration, invasion and metastasis, which may be related to targeting of the TGF-β1/Smad pathway (Zhong et al., 2017), inhibition of the NF-κB pathway, decreased expression of matrix metalloproteinase (MMP)-2 and MMP-9 (Xu et al., 2009) and promoting VEGFR1/PDGFR-related vascular normalization (Wang et al., 2012). Previous studies indicated that Tanshinone IIA can exert anticancer activity probably through a multi-target and multi-pathway pattern. However, the exact targets of Tanshinone IIA against HCC are unclear, and so is its anti-HCC mechanism. Thus, it is necessary to reveal and discover the therapeutic target and mechanism of Tanshinone IIA in HCC therapy.
Network pharmacology is becoming a popular approach for drug target prediction against disease (Boezio et al., 2017; Chen and Cui, 2017; Huo et al., 2017). It offers a comprehensive understanding of the new drug or complex mechanisms of an existing drug against a new disease. Moreover, network pharmacology provides a systematic method to promulgate the interaction between a drug and a disease via the overlapping genes. Weighted gene co-expression network analysis (WGCNA), which was an analysis method to set up a gene co-expression network among the interested genes to extract the associations between gene modules and specific clinical properties (Chi et al., 2020).
In our work, we obtained the overlapping target genes of Tanshinone IIA against HCC by integrating data from databases containing TCMSP, BATMAN-TCM, SymMap, STITCH, SEA, Swiss, and PharmMapper, the Cancer Genome Atlas (TCGA). RNA-seq data of the overlapping genes and the related clinical information of HCC from TCGA were used for WGCNA. To further estimate the genes connections, the genes of the important module were analyzed for the PPI network using Cytoscape. Compared with the key genes from WGCNA and the high connectivity nodes from the PPI network, we screened out the hub genes. Then, we further verified the potential hub targets, which may explain the mechanism of Tanshinone IIA against HCC to some extent.
Our workflow chart is shown in Fig. 1.
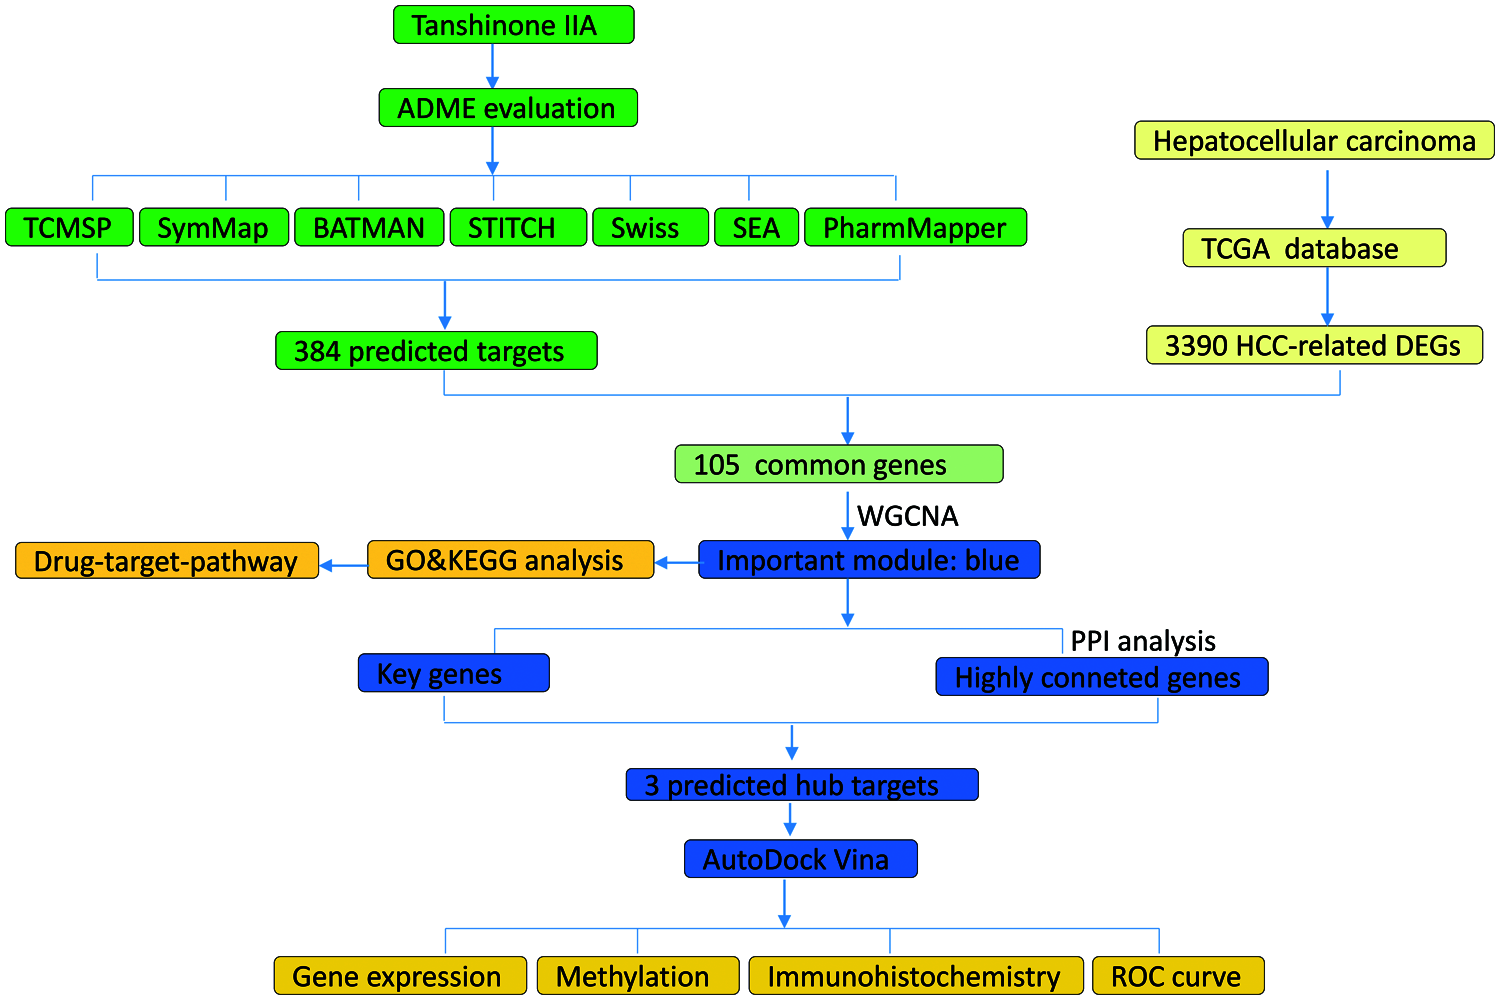
Figure 1: The whole framework of targets prediction and verification.
The ADME-related characters assessment of Tanshinone IIA
As Tanshinone IIA will be used as a drug in HCC treatment, we need to evaluate whether Tanshinone IIA has a druggable property at first. From the TCMSP database (https://tcmspw.com/tcmsp.php), we obtained the absorption, distribution, metabolism, and excretion (ADME) related properties. The specific parameters we used include molecular weight (MW), oral bioavailability (OB), intestinal epithelial permeability (Caco-2), blood brain barrier (BBB), drug-likeness (DL), fractional negative surface area (FASA−), the polar surface area (TPSA), and RBN (Ru et al., 2014). From which, OB ≥ 30% and DL ≥ 0.18 were common used as the criteria to screen out the druggable compounds (Tao et al., 2013).
Overlapping target genes of Tanshinone IIA against HCC
First, we identified the targets related to Tanshinone IIA from database. TCMSP (https://tcmspw.com/tcmsp.php), SymMap (https://www.symmap.org/), BATMAN-TCM (http://bionet.ncpsb.org/batman-tcm/) database were searched using the name “Tanshinone IIA”. Then we obtained the corresponding “smiles” or 2D/3D structure of Tanshinone IIA from PubChem (https://pubchem.ncbi.nlm.nih.gov/). Then, the targets of Tanshinone IIA were also screened by uploading the required structure to STITCH (http://stitch.embl.de/), SWISS(http://swisstargetprediction.ch/), SEA(http://sea.bkslab.org/) and Pharmmapper (http://www.lilab-ecust.cn/pharmmapper/) database according to the chemical similarity (Daina et al., 2019; Keiser et al., 2007; Kuhn et al., 2014; Liu et al., 2010). The small molecule of the drug can target specific proteins and predicted interaction genes were obtained. By removing the duplicated targets, we acquired the predicted targets. Second, we got the different expression genes (DEGs) of HCC through downloading the whole mRNA expression profile data (372 HCC vs. 50 paracancerous) using SangerBox software (http://sangerbox.com/). Further, we obtained the DEGs between the HCC tissue and paracancerous tissue by edgR analysis. Tanshinone IIA targets and HCC related DEGs were imported to the Venn diagram (https://bioinfogp.cnb.csic.es/tools/venny/) to obtain the overlapping targets. Finally, these overlapping genes were the targets of Tanshinone IIA against HCC used in the subsequent analysis.
Important module and key genes sorted by WGCNA
WGCNA is a specific technique to analyze the genes correlation with the clinical phenotypes. Here, we used WGCNA to seek for the genes related with tumor stage or grade. We prepared the matrix of the RNA-seq of the above 105 overlapping genes at first, the corresponding clinical data were screened according to the expression matrix. The analysis procedure was performed, as described previously (Chi et al., 2020). First, there was constructed the co-expression network of overlapping genes; then, the the screening of gene modules. Last, there were identified the key genes. Module membership (MM) and gene significance (GS) represent the importance of genes included in modules and the degree of association between genes and traits, respectively. The gene with a higher MM plays a more important role in the corresponding module (Bao et al., 2020; Tang et al., 2018), thus, we set MM > 0.9 and GS > 0.3 for the screening criteria.
Functional enrichment analysis of genes in the important module
From the WGCNA results, we obtained the genes in the important module. Furthermore, we performed functional annotation analysis on genes of important module using DAVID v6.8 (https://david.ncifcrf.gov/). Three terms of GO enrichment were classified into biological process (BP), cell component (CC), and molecular function (MF) to reflect the functional annotation. To understand the high-level functions of the sorted genes, we also analyzed KEGG pathways. GO terms and KEGG analysis with P-values < 0.05 is regarded as significant. Further, we constructed a drug-target-pathway network to reveal the interaction of Tanshinone IIA, target genes, and involved pathway intuitively in Cytoscape3.6.1.
Protein-protein interaction (PPI) analysis of genes in the important module
To explore the gene interactions, we input the genes of the important module into the STRING (https://string-db.org/). Although the proteins network with nodes and edges was shown in STRING, we still needed the visualization and operability of the network. The medium interactions with score >0.4 were selected for the next analysis in Cytoscape3.6.1. We analyzed the network after importing the nodes and the interaction information in Cytoscape3.6.1. The degree information of genes represents the genes’ connectivity, which reflects the importance of the genes. Genes with a degree above 10 were chosen as highly connected genes. The plug-in CytoHubba was used to predict and explore important nodes and subnetworks in a given network by topological algorithm (MCC).
By intersecting the key genes in the important module from WGCNA, and genes with the degree >10 from PPI network analysis, we obtained the hub genes. The hub genes coming from Tanshinone IIA, meanwhile with the highest correlation with HCC were obtained.
Molecular docking was conducted using AutoDock Vina (version: 1.1.2) to verify the binding affinity of hub genes to Tanshinone IIA. Molecular docking can help us predict the interaction of the ligand and macromolecules, providing the possibility that the ligand might be effective for the macromolecular proteins (Nguyen et al., 2020; Seeliger and de Groot, 2010; Trott and Olson, 2010). In our work, we predicted that the protein molecular (AURKB, KIF11, PLK1) interacted with Tanshinone IIA in the bound state. Firstly, the required files lig.mol2 and rep.pdb were obtained. We downloaded the 3D structure of Tanshinone IIA from PubChem, saving as lig.mol2. Then, the structure of protein molecular was downloaded from RCSB PDB (https://www.rcsb.org/). PyMOL portable edition (version: 2.4.0) was used to remove solvent and organic of the protein molecular, saving as rep.pdb for the second step. Then, the files of rep.pdb and lig.mol2 were converted to rep.pdbqt and lig.pdbqt, respectively. Meanwhile, the grid.gpf was obtained in AutoDock. At last, we used the three files that were obtained in step two in Vina docking process, and the results were visualized in PyMOL soon afterwards. For AURKB, the space coordinate of the molecular docking is as follow: center_x = 15.553, center_y = −16.602, center_z = −3.528. For KIF11, the space coordinate of the molecular docking is as follow: center_x = 41.755, center_y = 49.181, center_z = −23.861; For PLK1, the space coordinate of the molecular docking is as follow: center_x = −6.357, center_y = 35.159, center_z = 67.051. The size of the docking box is size_x = 40, size_y = 40, size_z = 40 for all the three docking boxes.
To further validate the probability, we then collected related information from several databases. UALCAN (http://ualcan.path.uab.edu) is a powerful and comprehensive resource providing the expression of genes, methylation level, and its survival analyses in cancer (Chandrashekar et al., 2017). ROC curves were plotted with R package to test the diagnostic significance of the hub genes according to the area under curve (AUC) value. Oncomine (www.oncomine.org) is an enormous platform that can analyze gene expression profiles of a specific tumor (Rhodes et al., 2004). Here, we validated the expression of hub genes in different livers using Oncomine resource. To further verify protein expression of the three hub genes, we used the Human Protein Atlas (http://www.proteinatlas.org) to compare the immunohistochemistry slices (Uhlen et al., 2015).
ADME-related characteristic of Tanshinone IIA
From the TCMSP results, the OB value of Tanshinone IIA is 49.89% and Tanshinone IIA showed a superior DL value 0.40, indicating that Tanshinone IIA can be absorbed effectively and has good druggability. The other properties of Tanshinone IIA, such as MW, AlogP, FASA, TPSA, and RBN were shown (Table 1). Therefore, it is reasonable to use Tanshinone IIA as a drug in HCC treatment.

Overlapping genes of Tanshinone IIA against HCC
We predicted the targets of Tanshinone IIA by TCMSP, SymMap, BATMAN-TCM, STITCH, SWISS, SEA, Pharmmapper servers. The first three databases were searched using the name “Tanshinone IIA”, while the last four databases were obtained according to the structure of Tanshinone IIA. The numbers were 38, 25, 7, 9, 100, 20, and 256, respectively. Furthermore, set union and removed the duplicated genes of all the predicted targets, of which we obtained 384 targets for the next analysis. The mRNA related genes were screened out from the downloaded HCC expressed profile. Further, we obtained a total number of 3391 DEGs between the HCC tissue samples and paracancerous tissue using the edgR method. In other words, the predicted targets of Tanshinone IIA were 384, and there are 3391 DEGs. Then, Venn diagram showed the intersection genes. Finally, 105 overlapping genes were predicted (Fig. 2).

Figure 2: Venn diagram of overlapping genes of Tanshinone IIA and HCC-related DEGs from TCGA. Blue: Tanshinone IIA predicted genes. Yellow: HCC-related DEGs in TCGA.
Important module and key genes screened by WGCNA
The expression matrix of 105 DEGs overlapping genes and the related clinical data were prepared for WGCNA analysis. With the module selection criteria (cut height: 0.1, minimum module size: 5), we obtained four modules. The correlation between the blue module and tumor grade was the most important (correlation coefficient = 0.37, P = 2e−13) (Fig. 3). There are 23 genes in the blue module, in which four key genes (PLK1, KIF11, AURKB, EZH2) were contained in the blue module with a strict criterion of MM > 0.9 and GS > 0.3.

Figure 3: Exploring important modules related to target genes and clinical features through WGCNA. (A) Analysis of the scale-free fitting index (left) and average connectivity (right) of various soft threshold weights. (B) Tree map of all DEGs clustered based on dissimilarity measures. (C) Heatmap of the correlation between modular feature genes and clinical features. Each unit corresponds to a correlation coefficient and a P-value. (D) Scatter plot of module eigen genes in blue module and box plot in other modules.
Functional enrichment analysis of genes in the important module
There are 46 terms involved in BPs, 15 terms in CCs and 10 terms in MFs. In details, the BPs were enriched in mitotic nuclear division, G2/M transition of mitotic cell cycle, cell division, cell proliferation, regulation of cell cycle, spindle organization, response to drug, etc. The CCs were enriched in cytosol, spindle microtubule, nucleoplasm, spindle midzone, nucleus, and chromosome passenger complex, etc. The MFs were enriched in protein kinase binding, protein kinase activity, kinase activity, ATP binding, phosphoprotein phosphatase activity, drug binding, protein serine/threonine kinase activity, etc. We showed the top 10 of BPs, CCs and MFs (Fig. 4), and all the BPs, CCs and MFs with P < 0.05 (Table 2). KEGG pathway analysis showed seven enriched pathways (Fig. 5, Table 3), involving in the cell cycle, progesterone-mediated oocyte maturation, MicroRNAs in cancer, pyrimidine metabolism, viral carcinogenesis, etc. (Table 3). Then, we analyzed the drug-target-pathway interactions in Cytoscape (Fig. 6). The relations of Tanshinone IIA, the genes in blue module, and involved pathway analyzed in KEGG analysis were directly perceived through the senses. We suggested that Tanshinone IIA exerted a protective role in the HCC therapy by multi-target and multi-pathway.
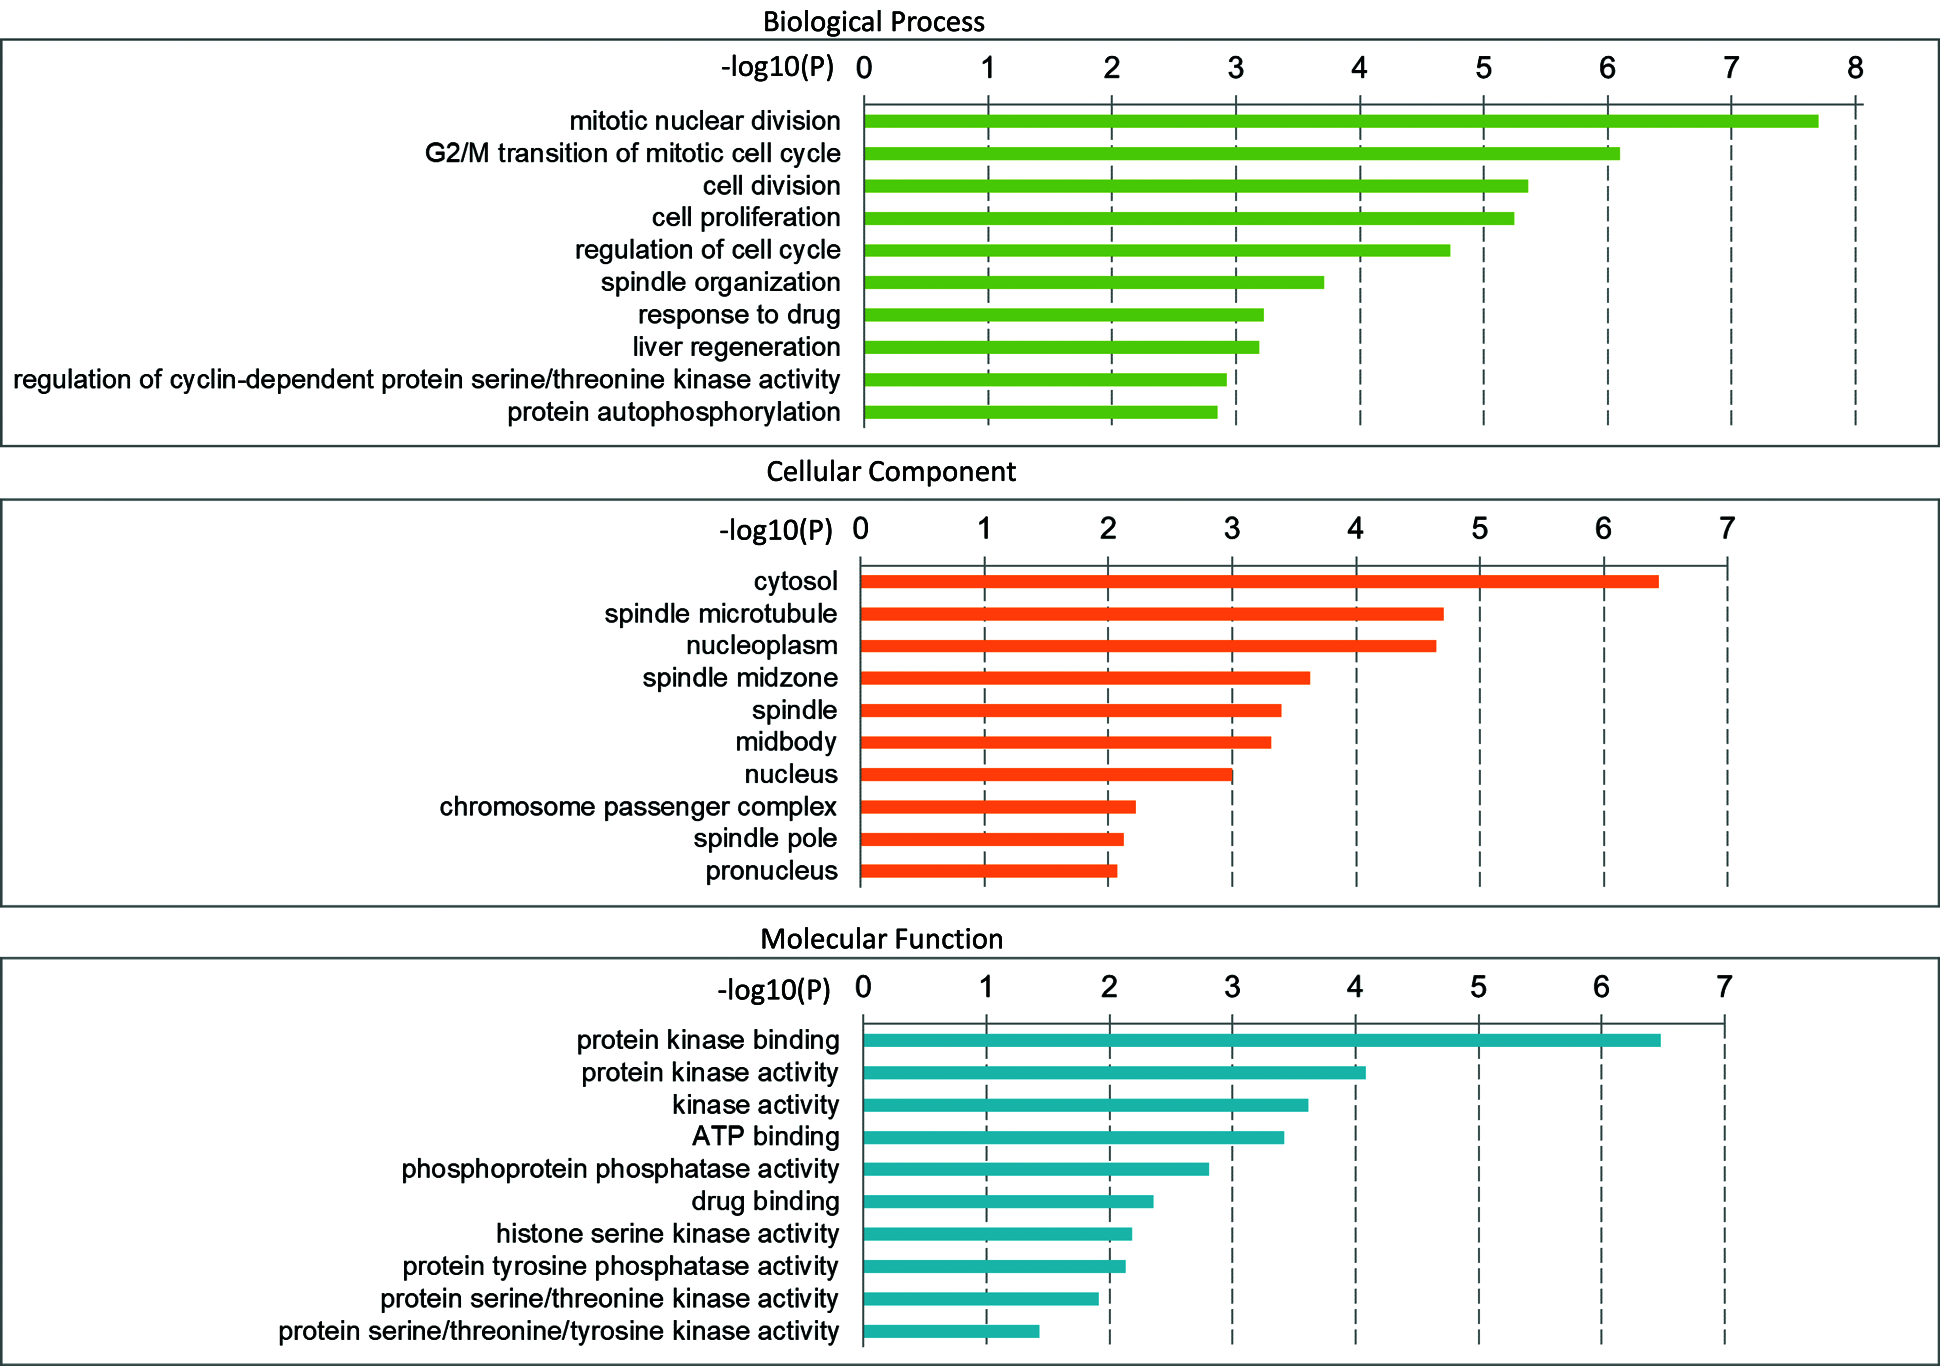
Figure 4: GO enrichment analysis of 23 genes in important module. Different categories of biological process, cellular component, and molecular function were represented by a green, orange, and blue bar, respectively. The length of the bar represented the number of genes observed in the category.

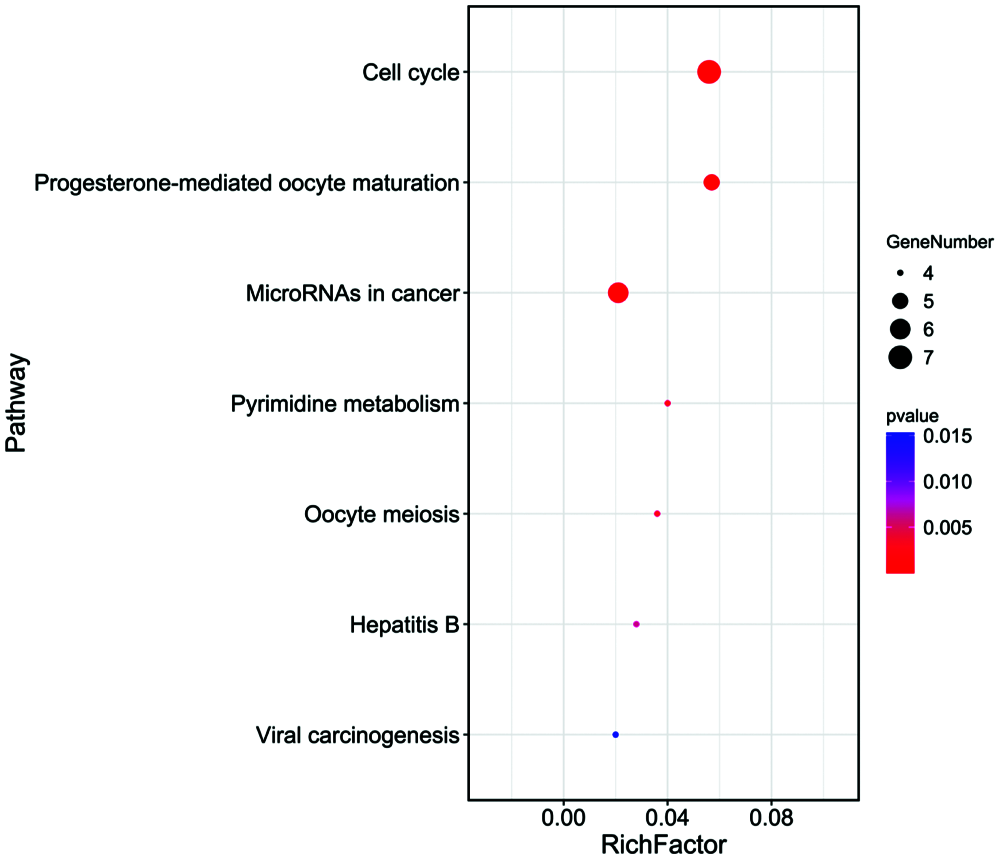
Figure 5: KEGG enrichment analysis of 23 genes in the important module. The larger the bubble, the more enriched genes contained in the pathway.
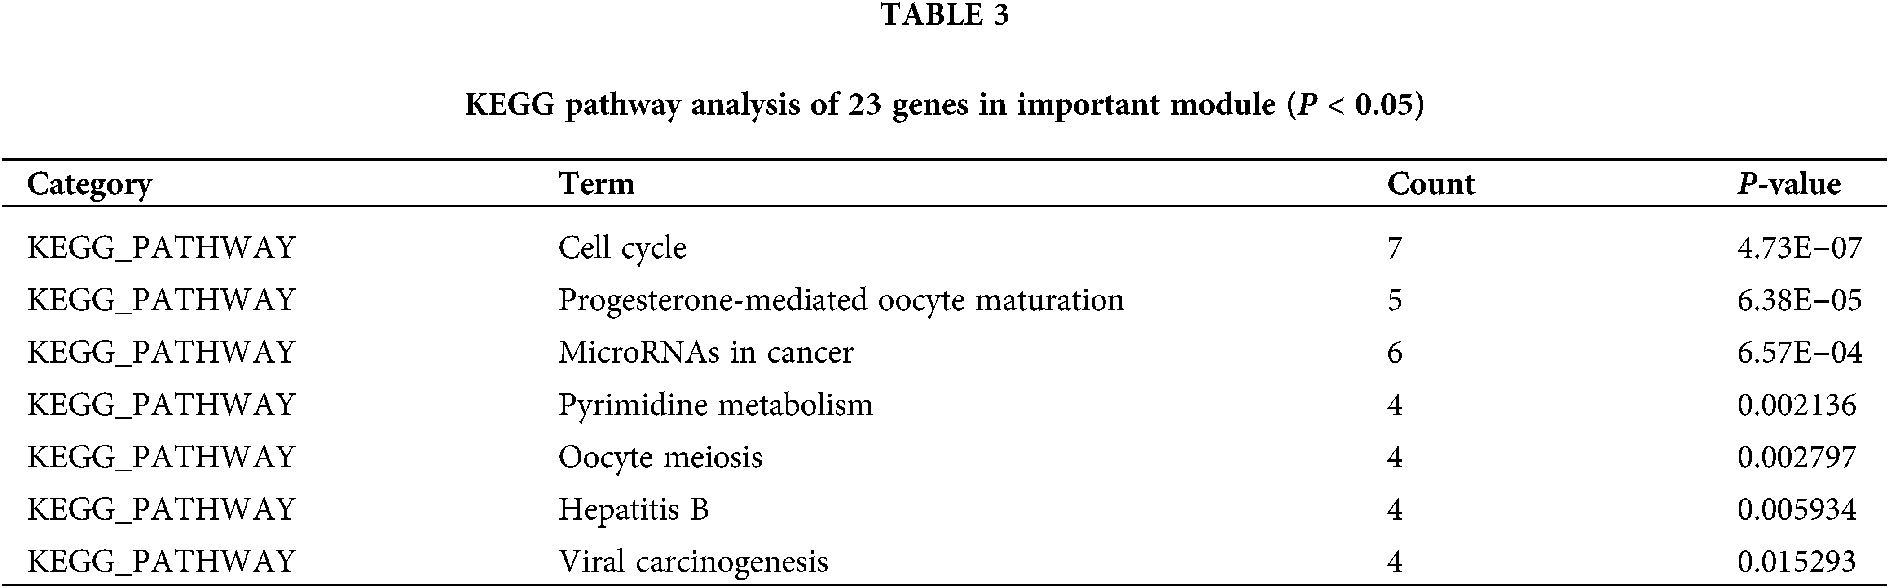
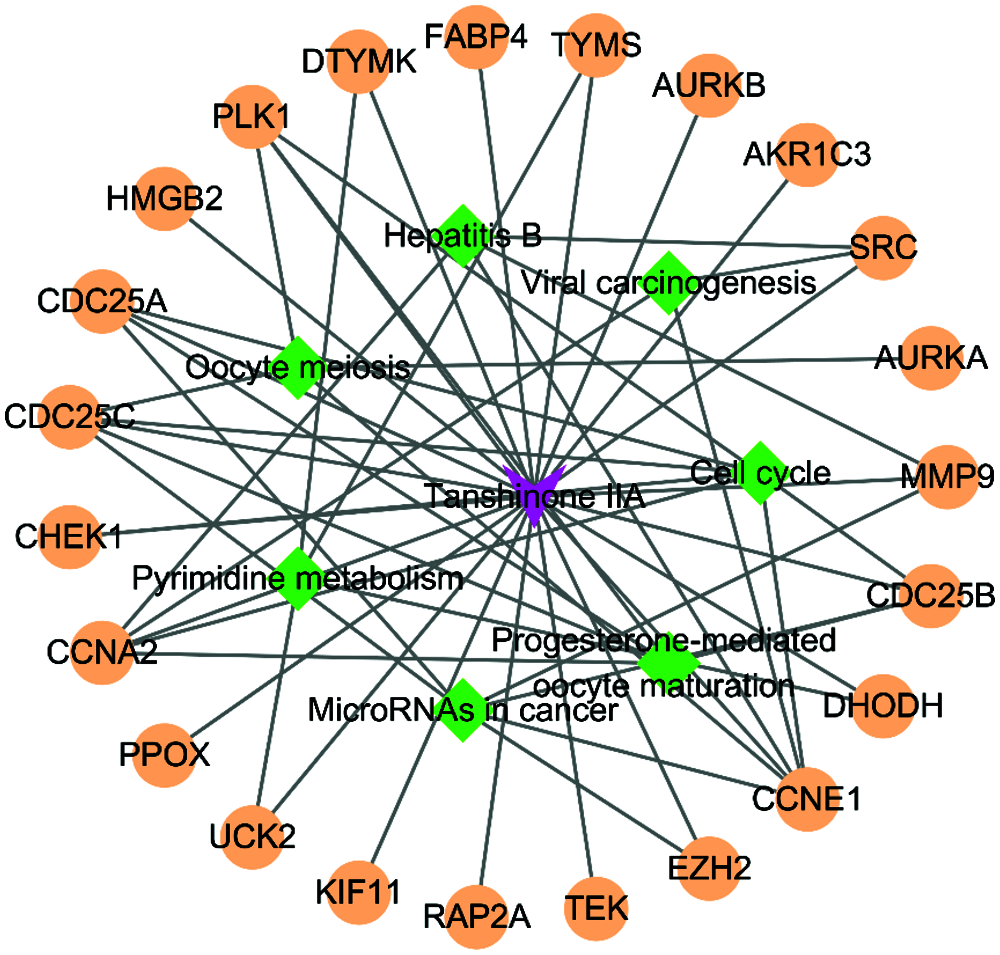
Figure 6: The drug-target-pathway interactions.
PPI network of genes in the important module and identification of hub genes
The network of 23 genes with the medium interactions score >0.4 from STRING were screened for the next visualized analysis in Cytoscape3.6.1 (Fig. 7A). From the network analysis, we chose the parameter of the degree as a screening criterion. Firstly, genes with a degree above 10 were regarded as high connectivity genes in the network. As a result, only 10 genes met the requirement (Fig. 7B). Then, the important nodes and the relative subnetworks were analyzed in the network by the plug-in CytoHubba. We obtained top 10 important nodes (Fig. 7C).
The final hub genes were obtained from the intersection between the four key genes from the blue module and the ten genes with a degree above 10 from PPI network analysis, namely PLK1, KIF11, and AURKB.

Figure 7: PPI network visualized by Cytoscape. (A) The PPI network of 23 genes in the important module. (B) The PPI network of top 10 nodes with degree ≥10. The bigger the node size, the larger the degree value. The darker color of the node (orange), the larger the degree value. (C) The construction of submodule by the plug-in of CytoHubba in Cytoscape. The left panel represents the whole network. The right panel represents the top 10 most important nodes. The red color represents the more important of the gene, while orange color represents less important in the right panel.
The computational docking simulation is based on the structure to explore the interaction between ligand and proteins (Geppert et al., 2010). In this study, the number of docking modes was set as 20, so there were 20 docking modes for the interactions between Tanshinone IIA and a target (AURKB, KIF11 or PLK1) using AutoDock Vina. The first mode, with the highest affinity, indicated a strong binding capacity between Tanshinone IIA and relative protein. We selected the candidate mode for further visualization. The affinity is −10.3 kcal/mol between Tanshinone IIA and AURKB. The affinity is −8.8 kcal/mol between Tanshinone IIA and KIF11. The affinity is −10.9 kcal/mol between Tanshinone IIA and PLK1. Then we obtain the visual results of the docking pictures in PyMOL (Fig. 8).

Figure 8: Molecular docking validation by AutoDock Vina. (A) AURKB. (B) KIF11. (C) PLK1. (D), (E) and (F) is the enlarge pictures, respectively. Green represents the structure of Tanshinone IIA, cyan represents the target molecular.
To further validate the importance of AURKB, KIF11, and PLK1, we explored the mRNA expression, protein levels, survival curve, and ROC curve. Comparing with the normal tissues, the mRNA expression of AURKB, KIF11 and PLK1 was increased in the HCC as shown by UALCAN (Fig. 9A). The DNA methylation levels of AURKB, KIF11, and PLK1 were decreased in cancer (Fig. 9B). By comparing the survival curves, the three hub genes showed significant prognostic effects for HCC (Fig. 9C). The expression levels increased in the advanced tumor stages and pathological grades (Fig. 10). Time-dependent ROC curves of AURKB (1 year AUC = 0.674, 3 years AUC = 0.616, 5 years AUC = 0.579) KIF11 (1 year AUC = 0.711, 3 years AUC = 0.645, 5 years AUC = 0.586) and PLK1 (1 year AUC = 0.735, 3 years AUC = 0.667, 5 years AUC = 0.611) were drawn from the TCGA database (Fig. 11). ROC curve indicated that AURKB, KIF11, and PLK1 demonstrated good diagnostic biomarkers. The gene expression levels were also validated using Oncomine4.5 platform. As a result, the expression was increased significantly in the two cancer livers than that in the normal (Fig. 12). Besides, we validated the protein levels using the HPA database, and the cancer tissues showed stronger immunohistochemical staining (Fig. 13).

Figure 9: Box plot and survival curve of gene expression in HCC obtained by UALCAN. (A) Differential expression of AURKB, KIF11, PLK1 in normal tissues and liver cancer tissues. (B) Methylation analysis of AURKB, KIF11, PLK1 in normal tissues and liver cancer. (C) The effect of differential expression of AURKB, KIF11, PLK1 on survival rate of patients with liver cancer.

Figure 10: The expression of genes based on individual cancer stage and tumor grade obtained by UALCAN. (A) Differential expression of AURKB, KIF11, PLK1 based on individual cancer stage. (B) Differential expression of AURKB, KIF11, PLK1 based on tumor grade.

Figure 11: Time dependent ROC curve of hub genes. (A) AURKB (1 year, AUC = 0.674, 3 years, AUC = 0.616, 5 years, AUC = 0.579), (B) KIF11 (1 year, AUC = 0.711, 3 years, AUC = 0.645, 5 years, AUC = 0.586), (C) PLK1 (1 year, AUC = 0.735, 3 years, AUC = 0.667, 5 years, AUC = 0.611).

Figure 12: Gene expression in HCC and normal tissues from the Oncomine 4.5 database. (A) Expression of AURKB, KIF11 and PLK1 in Wurmbach Liver. (B) Expression of AURKB, KIF11 and PLK1 in Chen Liver (P < 0.05).

Figure 13: Immunohistochemistry of the three hub genes based on the Human Protein Atlas. (A) Protein levels of AURKB in normal tissue (upper panel) and in tumor tissue (down panel). (B) Protein levels of KIF11 in normal tissue (upper panel) and in tumor tissue (down panel). (C) Protein levels of PLK1 in normal tissue (upper panel) and in tumor tissue (down panel). The arrows represent the stronger staining protein in tumor tissue.
In our work, we predicted the targets of Tanshinone IIA, and then analyzed HCC-related DEGs. Further, we imported the 105 overlapping genes between Tanshinone IIA and HCC-related DEGs to construct a co-expression network for sorting important modules and key genes. AURKB, KIF11, and PLK1 were identified based on WGCNA results and PPI network analysis. Then, the validation of the hub genes was conducted by molecular docking, the expression level, the prognostic significance, diagnostic value, and the protein level. In total, we revealed that Tanshinone IIA had a protective role in the HCC therapy.
Studies have reported that Tanshinone IIA played a protection role in HCC. For instance, the usage of Tanshinone IIA inhibited the cell migration and invasion (Chiu et al., 2018). Tanshinone IIA treatment promoted cell death through the p53 pathway (Ren et al., 2017), calcium-dependent apoptosis (Dai et al., 2012), by inhibiting CYP2J2 activity (Jeon et al., 2015), by inhibiting the specific protein activities (Lin et al., 2016), in caspase-3 dependent apoptosis and CD31 related immune reaction (Chien et al., 2012). These studies of Tanshinone IIA and HCC are focused on cell death and apoptosis. However, does Tanshinone IIA exert its protective role in the opposite way, such as inhibiting cell proliferation? It provided us an opposite thought about Tanshinone IIA against HCC, though the direct evidence is insufficient. Our results of GO and KEGG pathway analysis demonstrated that most genes in the important module identified by WGCNA were involved in the cell cycle, suggesting that the Tanshinone IIA probably acted its protection role through inhibiting cell proliferation.
The analysis results suggested that AURKB, KIF11, and PLK1 are hub targets that Tanshinone IIA binding. AURKB (Aurora kinase B) is a mitotic kinase involved in the mitotic process, especially in various cancers, such as clear cell renal cell carcinoma (Wan et al., 2019), chronic myeloid leukemia (Zhou et al., 2020), acute lymphoblastic leukemia (Moreira-Nunes et al., 2020), and HCC (Sistayanarain et al., 2006). The selective AURKB inhibitor was evaluated as a treatment in human HCC cell lines (Aihara et al., 2010). KIF11 (kinesin family member 11), a member of the kinesin family, participates in chromosome navigation in the cell cycle (Muretta et al., 2018; Rath and Kozielski, 2012). Previous studies have demonstrated that kinesins might act as oncogenes in several cancer types (de et al., 2009; Lucanus and Yip, 2018; Rath and Kozielski, 2012). Silencing KIF11 with a specific small-molecule inhibitor would block the glioblastoma cells’ proliferation and reduced invasion in glioblastoma (Venere et al., 2015). Even targeting kinesin therapy for tumor have conducted (Liu et al., 2013). PLK1 (Polo like kinase 1), a Ser/Thr kinase, plays a pivotal role in cell division (Sun et al., 2014a). PLK1 played a role in cancer development and progression, such as breast cancer, ovarian cancer, lung cancer (Ahr et al., 2002; Lee et al., 2014; Takai et al., 2005). PLK1 presented abnormal increase in HCC (He et al., 2009; Takai et al., 2005). Moreover, PLK1 is involved in regulating the cell cycle and apoptosis (Sun et al., 2014b). Our results indicate that AURKB, KIF11, and PLK1 were abnormally increased in HCC samples. The hub genes were largely associated with the cell cycle, indicating that Tanshinone IIA might exert a protective effect in HCC therapy by regulating the cell cycle. The three hub genes were identified as treatment targets of Tanshinone IIA against HCC by WGCNA prediction and further verification.
Though the three hub genes screened out are AURKB, KIF11, and PLK1, some genes in the other modules analyzed by WGCNA may also be effective in HCC therapy. We may get different hub genes when using different screening criteria.
In our work, we chose seven databases to predict the targets of Tanshinone IIA, so the predicted targets were very comprehensive. However, the HCC-related DEGs used above were only downloaded from the TCGA database, so the gene expression data from Gene Expression Omnibus (GEO) were also downloaded (GSE101685, GSE117361, GSE101728) for supplementary notes. In the three GEO data, we obtained 1958 DEGs genes. The 77 overlapping genes (Suppl. Fig. S1) between Tanshinone IIA and HCC-related DEGs from GEO were imported into Cytoscape for the following PPI analysis. By analyzing the network, we calculated the degree of each node. Results showed that overlapping genes involving ALB, ESR1, AR, IGF1, CCNA2, CYP3A4, PLK1, CCNE1, FOS, EZH2, CYP1A1, AURKA, TYMS, REN, CDC25A, CHEK1, CYP1A2, JAK2, CCNE2, AURKB, KIF11 have a degree above 10 (Suppl. Fig. S2A). Topology analysis was carried out to identify functional clusters of the overlapping genes in the co-expression network by the plug-in MCODE. According to previous research, we chose the parameter k-core = 2 to extract subnetwork in the co-expression network (Zhang et al., 2013). Furthermore, we obtained four subnetworks (Suppl. Fig. S2B). Interestingly, the score of cluster 1 was 11.636, containing the main 12 genes, CCNA2, PLK1, AURKA, CCNE1, CDC25A, EZH2, CHEK1, CDC25C, TYMS, CCNE2, AURKB, KIF11, in which KIF11 was the seed, suggesting that KIF11 may be a hub node in the cluster 1. From the results, we concluded that HCC-related DEGs from GEO might have similar common essential genes compared with TCGA, though with a different method.
Our current research still has some shortages. Although we had completed the verification of the hub genes from the online database, follow-up experiments should be implemented to validate our findings with/without Tanshinone IIA. Furthermore, we did not explore upstream or downstream of AURKB, KIF11, and PLK1 in HCC. Future studies should investigate the mechanisms of AURKB, KIF11, and PLK1 in HCC cell lines.
Our study shows that Tanshinone IIA may inhibit mRNA expression of AURKB, KIF11, and PLK1 to arrest cell cycle for exerting its protective role in HCC, which partly explains the pharmacological mechanism of Tanshinone IIA in HCC.
Availability of Data and Materials: The datasets used and/or analyzed during the current study are available from the corresponding author on reasonable request.
Author Contribution: HZ analyzed and interpreted the data of Tanshinone IIA and HCC. JG was a major contributor in writing the manuscript. QC revised the manuscript. MF provided the idea of the study. All authors read and approved the final manuscript.
Funding Statement: This study was supported by Health Commission of Hubei Province Scientific Research Project [WJ2021M217]; the Scientific Research Program of Jianghan University (2021yb131); and the Scientific Research foundation of Jianghan University (No. 2020010).
Conflicts of Interest: The authors declare that they have no conflicts of interest to report regarding the present study.
Ahr A, Karn T, Solbach C, Seiter T, Strebhardt K et al. (2002). Identification of high risk breast-cancer patients by gene expression profiling. Lancet 359: 131–132. DOI 10.1016/S0140-6736(02)07337-3. [Google Scholar] [CrossRef]
Aihara A, Tanaka S, Yasen M, Matsumura S, Mitsunori Y et al. (2010). The selective Aurora B kinase inhibitor AZD1152 as a novel treatment for hepatocellular carcinoma. Journal of Hepatology 52: 63–71. DOI 10.1016/j.jhep.2009.10.013. [Google Scholar] [CrossRef]
Bao L, Guo T, Wang J, Zhang K, Bao M (2020). Prognostic genes of triple-negative breast cancer identified by weighted gene co-expression network analysis. Oncology Letters 19: 127–138. [Google Scholar]
Boezio B, Audouze K, Ducrot P, Taboureau O (2017). Network-based approaches in pharmacology. Molecular Informatics 36: 1700048. DOI 10.1002/minf.201700048. [Google Scholar] [CrossRef]
Chandrashekar DS, Bashel B, Balasubramanya SAH, Creighton CJ, Ponce-Rodriguez I et al. (2017). UALCAN: A portal for facilitating tumor subgroup gene expression and survival analyses. Neoplasia 19: 649–658. DOI 10.1016/j.neo.2017.05.002. [Google Scholar] [CrossRef]
Chen SJ, Cui MC (2017). Systematic understanding of the mechanism of salvianolic acid A via computational target fishing. Molecules 22: 644. DOI 10.3390/molecules22040644. [Google Scholar] [CrossRef]
Cheng CY, Su CC (2010). Tanshinone IIA inhibits Hep-J5 cells by increasing calreticulin, caspase 12 and GADD153 protein expression. International Journal of Molecular Medicine 26: 379–385. [Google Scholar]
Chi Q, Geng X, Xu K, Wang C, Zhao H (2020). Potential targets and molecular mechanism of miR-331-3p in hepatocellular carcinoma identified by weighted gene coexpression network analysis. Bioscience Reports 40: 674. DOI 10.1042/BSR20200124. [Google Scholar] [CrossRef]
Chien SY, Kuo SJ, Chen YL, Chen DR, Cheng CY et al. (2012). Tanshinone IIA inhibits human hepatocellular carcinoma J5 cell growth by increasing Bax and caspase 3 and decreasing CD31 expression in vivo. Molecular Medicine Reports 5: 282–286. [Google Scholar]
Chiu CM, Huang SY, Chang SF, Liao KF, Chiu SC (2018). Synergistic antitumor effects of Tanshinone IIA and sorafenib or its derivative SC-1 in hepatocellular carcinoma cells. Onco Targets and Therapy 11: 1777–1785. DOI 10.2147/OTT. [Google Scholar] [CrossRef]
Dai ZK, Qin JK, Huang JE, Luo Y, Xu Q et al. (2012). Tanshinone IIA activates calcium-dependent apoptosis signaling pathway in human hepatoma cells. Journal of Natural Medicines 66: 192–201. DOI 10.1007/s11418-011-0576-0. [Google Scholar] [CrossRef]
Daina A, Michielin O, Zoete V (2019). SwissTargetPrediction: updated data and new features for efficient prediction of protein targets of small molecules. Nucleic Acids Research 47: W357–W364. DOI 10.1093/nar/gkz382. [Google Scholar] [CrossRef]
de S, Cipriano R, Jackson MW, Stark GR (2009). Overexpression of kinesins mediates docetaxel resistance in breast cancer cells. Cancer Research 69: 8035–8042. DOI 10.1158/0008-5472.CAN-09-1224. [Google Scholar] [CrossRef]
Deng GL, Zeng S, Shen H (2015). Chemotherapy and target therapy for hepatocellular carcinoma: New advances and challenges. World Journal of Hepatology 7: 787–798. DOI 10.4254/wjh.v7.i5.787. [Google Scholar] [CrossRef]
Forner A, Reig M, Bruix J (2018). Hepatocellular carcinoma. Lancet 391: 1301–1314. DOI 10.1016/S0140-6736(18)30010-2. [Google Scholar] [CrossRef]
Gao J, Yang G, Pi R, Li R, Wang P et al. (2008). Tanshinone IIA protects neonatal rat cardiomyocytes from adriamycin-induced apoptosis. Translational Research 151: 79–87. DOI 10.1016/j.trsl.2007.11.005. [Google Scholar] [CrossRef]
Gao S, Liu Z, Li H, Little PJ, Liu P et al. (2012). Cardiovascular actions and therapeutic potential of Tanshinone IIA. Atherosclerosis 220: 3–10. DOI 10.1016/j.atherosclerosis.2011.06.041. [Google Scholar] [CrossRef]
Geppert T, Proschak E, Schneider G (2010). Protein-protein docking by shape-complementarity and property matching. Journal of Computational Chemistry 331: 1919–1928. DOI 10.1002/jcc.21479. [Google Scholar] [CrossRef]
Grandhi MS, Kim AK, Ronnekleiv-Kelly SM, Kamel IR, Ghasebeh MA et al. (2016). Hepatocellular carcinoma: From diagnosis to treatment. Surgical Oncology 25: 74–85. DOI 10.1016/j.suronc.2016.03.002. [Google Scholar] [CrossRef]
He ZL, Zheng H, Lin H, Miao XY, Zhong DW (2009). Overexpression of polo-like kinase1 predicts a poor prognosis in hepatocellular carcinoma patients. World Journal of Gastroenterology 15: 4177–4182. DOI 10.3748/wjg.15.4177. [Google Scholar] [CrossRef]
Hu B, An HM, Wang SS, Chen JJ, Xu L (2016). Preventive and therapeutic effects of Chinese herbal compounds against hepatocellular carcinoma. Molecules 21: 142. DOI 10.3390/molecules21020142. [Google Scholar] [CrossRef]
Huo MQ, Wang ZX, Wu DX, Zhang YL, Qiao YJ (2017). Using coexpression protein interaction network analysis to identify mechanisms of danshensu affecting patients with coronary heart disease. International Journal of Molecular Sciences 18: 1298. DOI 10.3390/ijms18061298. [Google Scholar] [CrossRef]
Jeon YJ, Kim JS, Hwang GH, Wu Z, Han HJ et al. (2015). Inhibition of cytochrome P450 2J2 by Tanshinone IIA induces apoptotic cell death in hepatocellular carcinoma HepG2 cells. European Journal of Pharmacology 764: 480–488. DOI 10.1016/j.ejphar.2015.07.047. [Google Scholar] [CrossRef]
Keiser MJ, Roth BL, Armbruster BN, Ernsberger P, Irwin JJ et al. (2007). Relating protein pharmacology by ligand chemistry. Nature Biotechnology 25: 197–206. DOI 10.1038/nbt1284. [Google Scholar] [CrossRef]
Khemlina G, Ikeda S, Kurzrock R (2017). The biology of Hepatocellular carcinoma: Implications for genomic and immune therapies. Molecular Cancer 16: 3. DOI 10.1186/s12943-017-0712-x. [Google Scholar] [CrossRef]
Knudsen ES, Gopal P, Singal AG (2014). The changing landscape of hepatocellular carcinoma: Etiology, genetics, and therapy. American Journal of Pathology 184: 574–583. DOI 10.1016/j.ajpath.2013.10.028. [Google Scholar] [CrossRef]
Kuhn M, Szklarczyk D, Pletscher-Frankild S, Blicher TH, Von Mering C et al. (2014). STITCH 4: Itegration of protein-chemical interactions with user data. Nucleic Acids Research 42: D401–D407. DOI 10.1093/nar/gkt1207. [Google Scholar] [CrossRef]
Lee HP, Liu YC, Chen PC, Tai HC, Li TM et al. (2017). Tanshinone IIA inhibits angiogenesis in human endothelial progenitor cells in vitro and in vivo. Oncotarget 8: 109217–109227. DOI 10.18632/oncotarget.22649. [Google Scholar] [CrossRef]
Lee SY, Jang C, Lee KA (2014). Polo-like kinases (plksa key regulator of cell cycle and new potential target for cancer therapy. Development & Reproduction 18: 65–71. DOI 10.12717/DR.2014.18.1.065. [Google Scholar] [CrossRef]
Lin CY, Chang TW, Hsieh WH, Hung MC, Lin IH et al. (2016). Simultaneous induction of apoptosis and necroptosis by Tanshinone IIA in human hepatocellular carcinoma HepG2 cells. Cell Death Discovery 2: 700. DOI 10.1038/cddiscovery.2016.65. [Google Scholar] [CrossRef]
Liu TL, Zhang LN, Gu YY, Lin MG, Xie J et al. (2020). The synergistic antitumor effect of Tanshinone IIA plus Adriamycin on human hepatocellular carcinoma xenograft in BALB/C nude mice and their influences on cytochrome P450 CYP3A4 in vivo. Advances in Medicine 2020: 1–15. DOI 10.1155/2020/6231751. [Google Scholar] [CrossRef]
Liu X, Gong H, Huang K (2013). Oncogenic role of kinesin proteins and targeting kinesin therapy. Cancer Science 104: 651–656. DOI 10.1111/cas.12138. [Google Scholar] [CrossRef]
Liu XF, Ouyang SS, Yu BA, Liu YB, Huang K et al. (2010). PharmMapper server: A web server for potential drug target identification using pharmacophore mapping approach. Nucleic Acids Research 38: W609–W614. DOI 10.1093/nar/gkq300. [Google Scholar] [CrossRef]
Long X, Zhang J, Zhang Y, Yao J, Cai Z et al. (2011). Nano-LC-MS/MS based proteomics of hepatocellular carcinoma cells compared to Chang liver cells and Tanshinone IIA induction. Molecular BioSystems 7: 1728–1741. DOI 10.1039/c0mb00343c. [Google Scholar] [CrossRef]
Longerich T (2020). Hepatocellular carcinoma. Pathologe 41: 478–487. DOI 10.1007/s00292-020-00801-z. [Google Scholar] [CrossRef]
Lu Q, Zhang P, Zhang X, Chen J (2009). Experimental study of the anti-cancer mechanism of Tanshinone IIA against human breast cancer. International Journal of Molecular Medicine 24: 773–780. DOI 10.3892/ijmm_00000291. [Google Scholar] [CrossRef]
Lucanus AJ, Yip GW (2018). Kinesin superfamily: Roles in breast cancer, patient prognosis and therapeutics. Oncogene 37: 833–838. DOI 10.1038/onc.2017.406. [Google Scholar] [CrossRef]
Llovet JM, Ricci S, Mazzaferro V, Hilgard P, Gane E et al. (2008). Sorafenib in advanced hepatocellular carcinoma. New England Journal of Medicine 359: 378–390. DOI 10.1056/NEJMoa0708857. [Google Scholar] [CrossRef]
Llovet JM, Zucman-Rossi J, Pikarsky E, Sangro B, Schwartz M et al. (2016). Hepatocellular carcinoma. Nature Reviews Disease Primers 2: 87. DOI 10.1038/nrdp.2016.18. [Google Scholar] [CrossRef]
Ma H, Fan Q, Yu J, Xin J, Zhang C (2013). Anticancer activities of tanshinone microemulsion against hepatocellular carcinoma in vitro and in vivo. Molecular Medicine Reports 7: 59–64. DOI 10.3892/mmr.2012.1129. [Google Scholar] [CrossRef]
Moreira-Nunes CA, Mesquita FP, Portilho AJS, Mello Junior FAR, Maues J et al. (2020). Targeting aurora kinases as a potential prognostic and therapeutical biomarkers in pediatric acute lymphoblastic leukaemia. Scientific Reports 10: 518. DOI 10.1038/s41598-020-78024-8. [Google Scholar] [CrossRef]
Muretta JM, Reddy BJN, Scarabelli G, Thompson AF, Jariwala S et al. (2018). A posttranslational modification of the mitotic kinesin Eg5 that enhances its mechanochemical coupling and alters its mitotic function. Proceedings of the National Academy of Sciences of the United States of America 115: E1779–E1788. DOI 10.1073/pnas.1718290115. [Google Scholar] [CrossRef]
Nguyen NT, Nguyen TH, Pham TNH, Huy NT, Bay MV et al. (2020). Autodock Vina adopts more accurate binding poses but Autodock4 forms better binding affinity. Journal of Chemical Information and Modeling 60: 204–211. DOI 10.1021/acs.jcim.9b00778. [Google Scholar] [CrossRef]
Rath O, Kozielski F (2012). Kinesins and cancer. Nature Reviews Cancer 12: 527–539. DOI 10.1038/nrc3310. [Google Scholar] [CrossRef]
Ren X, Wang C, Xie B, Hu L, Chai H et al. (2017). Tanshinone IIA induced cell death via miR30b-p53-PTPN11/SHP2 signaling pathway in human hepatocellular carcinoma cells. European Journal of Pharmacology 796: 233–241. DOI 10.1016/j.ejphar.2016.11.046. [Google Scholar] [CrossRef]
Rhodes DR, Yu J, Shanker K, Deshpande N, Varambally R et al. (2004). ONCOMINE: A cancer microarray database and integrated data-mining platform. Neoplasia 6: 1–6. DOI 10.1016/S1476-5586(04)80047-2. [Google Scholar] [CrossRef]
Ru J, Li P, Wang J, Zhou W, Li B et al. (2014). TCMSP: A database of systems pharmacology for drug discovery from herbal medicines. Journal of Cheminformatics 6: S82. DOI 10.1186/1758-2946-6-13. [Google Scholar] [CrossRef]
Seeliger D, de Groot BL (2010). Ligand docking and binding site analysis with PyMOL and Autodock/Vina. Journal of Computer-Aided Molecular Design 24: 417–422. DOI 10.1007/s10822-010-9352-6. [Google Scholar] [CrossRef]
Shi MJ, Dong BS, Yang WN, Su SB, Zhang H (2019). Preventive and therapeutic role of Tanshinone IIA in hepatology. Biomedicine & Pharmacotherapy 112: 108676. DOI 10.1016/j.biopha.2019.108676. [Google Scholar] [CrossRef]
Sistayanarain A, Tsuneyama K, Zheng H, Takahashi H, Nomoto K et al. (2006). Expression of Aurora-B kinase and phosphorylated histone H3 in hepatocellular carcinoma. Anticancer Research 26: 3585–3593. [Google Scholar]
Sun J, Lv PC, Guo FJ, Wang XY, Han, X. et al. (2014a). Aromatic diacylhydrazine derivatives as a new class of polo-like kinase 1 (PLK1) inhibitors. European Journal of Medicinal Chemistry 81: 420–426. DOI 10.1016/j.ejmech.2014.05.026. [Google Scholar] [CrossRef]
Sun W, Su Q, Cao XK, Shang B, Chen AS et al. (2014b). High expression of polo-like kinase 1 is associated with early development of hepatocellular carcinoma. International Journal of Genomics 2014: 1–9. DOI 10.1155/2014/312130. [Google Scholar] [CrossRef]
Takai N, Hamanaka R, Yoshimatsu J, Miyakawa I (2005). Polo-like kinases (Plks) and cancer. Oncogene 24: 287–291. DOI 10.1038/sj.onc.1208272. [Google Scholar] [CrossRef]
Tang J, Kong D, Cui Q, Wang K, Zhang D et al. (2018). Prognostic genes of breast cancer Identified by gene co-expression network analysis. Frontiers in Oncology 8: 69. DOI 10.3389/fonc.2018.00374. [Google Scholar] [CrossRef]
Tang Z, Tang Y, Fu L (2003). Growth inhibition and apoptosis induction in human hepatoma cells by Tanshinone IIA. Journal of Huazhong University of Science and Technology [Medical Sciences] 23: 166–168. DOI 10.1007/BF02859946. [Google Scholar] [CrossRef]
Tao W, Xu X, Wang X, Li B, Wang Y et al. (2013). Network pharmacology-based prediction of the active ingredients and potential targets of Chinese herbal Radix curcumae formula for application to cardiovascular disease. Journal of Ethnopharmacology 145: 1–10. [Google Scholar]
Ting CT, Kuo CJ, Hu HY, Lee YL, Tsai TH (2017). Prescription frequency and patterns of Chinese herbal medicine for liver cancer patients in Taiwan: A cross-sectional analysis of the National Health Insurance Research Database. BMC Complementary and Alternative Medicine 17: 118. [Google Scholar]
Torre LA, Bray F, Siegel RL, Ferlay J, Lortet-Tieulent J et al. (2015). Global cancer statistics, CA: A. Cancer Journal for Clinicians 65: 87–108, 2012. [Google Scholar]
Trott O, Olson AJ (2010). AutoDock Vina: Improving the speed and accuracy of docking with a new scoring function, efficient optimization, and multithreading. Journal of Computational Chemistry 31: 455–461. [Google Scholar]
Uhlen M, Fagerberg L, Hallstrom BM, Lindskog C, Oksvold P et al. (2015). Proteomics. Tissue-based map of the human proteome. Science 347: 1260419. [Google Scholar]
Venere M, Horbinski C, Crish JF, Jin X, Vasanji A et al. (2015). The mitotic kinesin KIF11 is a driver of invasion, proliferation, and self-renewal in glioblastoma. Science Translational Medicine 7: 1–12. DOI 10.1126/scitranslmed.aac6762. [Google Scholar] [CrossRef]
Wan B, Huang Y, Liu B, Lu L, Lv C (2019). AURKB: A promising biomarker in clear cell renal cell carcinoma. PeerJ 7: e7718. DOI 10.7717/peerj.7718. [Google Scholar] [CrossRef]
Wang WQ, Liu L, Sun HC, Fu YL, Xu HX et al. (2012). Tanshinone IIA inhibits metastasis after palliative resection of hepatocellular carcinoma and prolongs survival in part via vascular normalization. Journal of Hematology & Oncology 5: 1118. DOI 10.1186/1756-8722-5-69. [Google Scholar] [CrossRef]
Wang X, Wei Y, Yuan S, Liu G, Lu Y et al. (2005). Potential anticancer activity of Tanshinone IIA against human breast cancer. International Journal of Cancer 116: 799–807. DOI 10.1002/(ISSN)1097-0215. [Google Scholar] [CrossRef]
Xu YX, Tian F, Li R, Liu ZC (2009). Tanshinone IIA inhibits invasion and metastasis of human hepatocellular carcinoma cells in vitro and in vivo. Tumori Journal 95: 789–795. DOI 10.1177/030089160909500623. [Google Scholar] [CrossRef]
Yang L, Gong YP, Yang YM, Luo S (2010). A successful case of Tanshinone II A treatment for relapsed acute promyelocytic leukemia after maintainance therapy of all-trans retinoic acid and arsenic trioxide. Sichuan Da Xue Xue Bao Yi Xue Ban 41: 1065–1067. [Google Scholar]
Yang YM, Liu T (2006). Complete remission of acute promyelocytic leukemia resisting all-trans retinoic acid of one case treated by Tanshinone IIA. Sichuan Da Xue Xue Bao Yi Xue Ban 37: 965–967. [Google Scholar]
Yin X, Yin Y, Cao FL, Chen YF, Peng Y et al. (2012). Tanshinone IIA attenuates the inflammatory response and apoptosis after traumatic injury of the spinal cord in adult rats. PLoS One 7: e38381. DOI 10.1371/journal.pone.0038381. [Google Scholar] [CrossRef]
Zhang Y, Li Z, Yang M, Wang D, Yu L et al. (2013). Identification of GRB2 and GAB1 coexpression as an unfavorable prognostic factor for hepatocellular carcinoma by a combination of expression profile and network analysis. PLoS One 8: e85170. DOI 10.1371/journal.pone.0085170. [Google Scholar] [CrossRef]
Zhong C, Zhang YF, Huang JH, Wang ZY, Chen QY et al. (2017). The Chinese medicine, Jianpi Huayu Decoction, inhibits the epithelial mesenchymal transition via the regulation of the Smad3/Smad7 cascade. American Journal of Translational Research 9: 2694–2711. [Google Scholar]
Zhou X, Ma X, Sun H, Li X, Cao H et al. (2020). Let-7b regulates the adriamycin resistance of chronic myelogenous leukemia by targeting AURKB in K562/ADM cells. Leukemia & Lymphoma 61: 3451–3459. DOI 10.1080/10428194.2020.1811269. [Google Scholar] [CrossRef]
SUPPLEMENTARY FIGURES
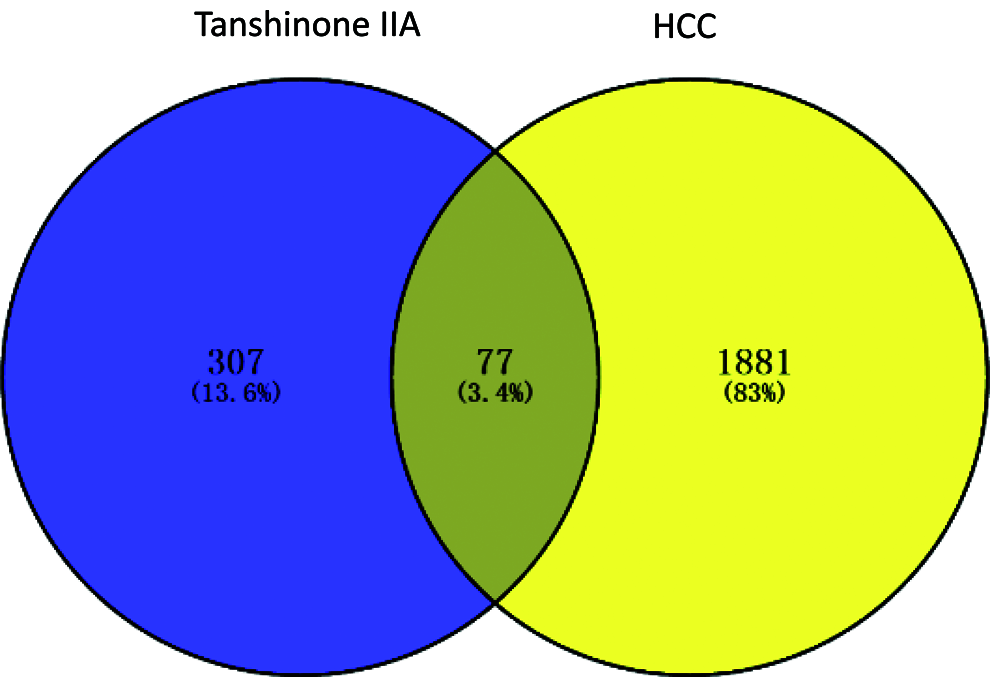
FIGURE S1: Venn diagram of overlapping genes of Tanshinone IIA and HCC-related DEGs from GEO database. Blue: Tanshinone IIA predicted genes; yellow: HCC-related DEGs in GEO database (GSE101685, GSE117361, GSE101728). Finally, 77 overlapping genes were obtained.

Figure S2: Topology analysis of the coexpression network. (A) The PPI of the 77 overlapping genes. Green was the analysis of degree cemtrality >10. (B) Different four subnetworks extracted from (A) using MCODE plug-in. Green rectangles were common genes which meant query terms. Orange rectangles were seed genes in each cluster. The gray edges stand for the interactions among different genes.
 | This work is licensed under a Creative Commons Attribution 4.0 International License, which permits unrestricted use, distribution, and reproduction in any medium, provided the original work is properly cited. |