DOI:10.32604/biocell.2022.017337
| BIOCELL DOI:10.32604/biocell.2022.017337 | |
| Review |
Identification of a three-gene signature in the triple-negative breast cancer
1Clinical Medical College, Yangzhou University, Yangzhou, 225009, China
2Institute of Epigenetics and Epigenomics, College of Animal Science and Technology, Yangzhou University, Yangzhou, 225009, China
3Key Laboratory of Animal Genetics and Breeding, Molecular Design of Jiangsu Province, Yangzhou University, Yangzhou, 225009, China
4China Medical University, Shenyang, 110122, China
5Department of Obstetrics and Gynecology, The Second Hospital of Jilin University, Changchun, 130021, China
*Address correspondence to: Deyuan Fu, fdy1003@163.com
Received: 02 May 2021; Accepted: 15 June 2021
Abstract: This work aimed to improve current prognostic signatures based on clinical stages in identifying high-risk patients of triple-negative breast cancer (TNBC), to allow patients with a high-risk score for specific treatment decisions. In this study, 396 TNBC samples from TCGA and GEO databases were included in genome-wide transcriptome analysis. The relationship between normalized gene expression values and survival data of patients was determined by Cox proportional hazards models in each dataset. The overlapped genes among all datasets were considered as a potential prognostic signature. The risk score was constructed based on individual genes and validated with three separate data sets and the combined dataset. Moreover, the Kaplan–Meier analysis including the log-rank test was performed to determine significantly statistical differences in overall survival. The association analysis between DNA methylation levels and gene expression levels of three genes was measured in the TCGA data set. In Cox proportional hazards model analysis, the result showed that potential protective genes included 564 genes in GSE25066 dataset, 1132 genes in GSE103091 dataset and 564 genes in TCGA dataset, potentially risky genes contained 1132 genes in GSE25066 dataset, 475 genes in GSE25066 dataset and 1115 genes in TCGA dataset. In all datasets, patients in high-risk groups showed worse prognosis than low-risk groups. Multivariate Cox regression analysis displayed that the 3-gene signature (DCAF4, UQCRFS1 and SS18) was an independent prognostic factor in TNBC. The AUC values of the 3-gene signature were 0.71, 0.73 and 0.77 in GSE25066, GSE103091 and TCGA dataset, respectively. The model, which combined the 3-gene signature (DCAF4, UQCRFS1 and SS18) with the tumor stage (pathological stage or pathological T stage), showed a stronger prognostic power for survival prediction. The 3-genes prognostic signature may be a useful biomarker for survival prediction in TNBC patients and may contribute to patient classification in the same tumor stages and individualized clinical treatment.
Keywords: Triple-negative breast cancer; Prognosis; Biomarker
Abbreviations
| ER: | estrogen receptors |
| GEO: | gene expression omnibus |
| HER2: | hormone epidermal growth factor receptor 2 |
| HR: | hazard ratio |
| TCGA: | the cancer genome atlas |
| TNBC: | triple-negative breast cancer |
Triple-negative breast cancer (TNBC), in 15–20% of malignant breast cancer, appears negative for estrogen receptors (ER), progesterone receptors (PR), and hormone epidermal growth factor receptor 2 (HER2) (Foulkes et al., 2010). Without necessary receptors, conventional treatments that target estrogen receptors, progesterone receptors, and HER-2 are ineffective. TNBC is a highly heterogeneous disease that can be divided into 6 subtypes distinct subgroups according to clinical, histopathologic, and molecular profile (Abramson et al., 2015). In the clinical treatment of TNBC, although chemotherapy is effective, About 30% of TNBC patients do not respond well to treatment, resulting in early recurrence within the first 5 years (Foulkes et al., 2010; Gonçalves et al., 2018). To date, two large studies have focused on the effect of genetic markers on prognosis and appropriate treatment of TNBC. At present, the most studied TP53, BRCA1, PIK3CA and EGFR have poor prognostic factors, poor OS and increased risk of metastasis (Sporikova et al., 2018). Therefore, it is necessary to search for effective genetic signature of TNBC to improve accurate prognosis prediction and adapt the treatments.
The availability of gene expression profiling with DNA microarray and sequence brings the chance to identify more reliable prognostic biomarkers that are important for accurate classification of various malignant tumors and individualized treatment in cancers (Diao et al., 2019; Patil and Mahalingam, 2018; Yang et al., 2018). Several studies have proposed that gene-expression data from patients with survival data can improve prognostic models (Corrêa and Augsburger, 2016; Dyrskjøt et al., 2017). Gene signatures have been constructed to predict the overall survival of TNBC patients with different clinical outcomes (Xiang et al., 2017). For cancer prognosis, the single gene maybe not robust enough relative to those multiple biomarker models. To improve the accuracy of the prognostic signature, three datasets downloaded from the Gene Expression Omnibus (GEO) and The Cancer Genome Atlas (TCGA) were applied to identify gene signatures.
In our study, those genes from each dataset significantly associated with overall survival were considered as candidate genes. Then, the overlapped genes from three datasets were selected as a credible prognostic signature. With the Cox proportional hazards coefficients and prognostic genes expression level, the risk scoring model was generated for prognosis prediction. Then, this risk score was validated in each dataset and combined cohort. The result reflected that the three-gene signature not only serves as a reliable prognostic biomarker in TNBC but also can connect with the current staging system to provide a more accurate survival prediction and provide a promising biomarker for personalized therapeutic interventions (Fig. 1).
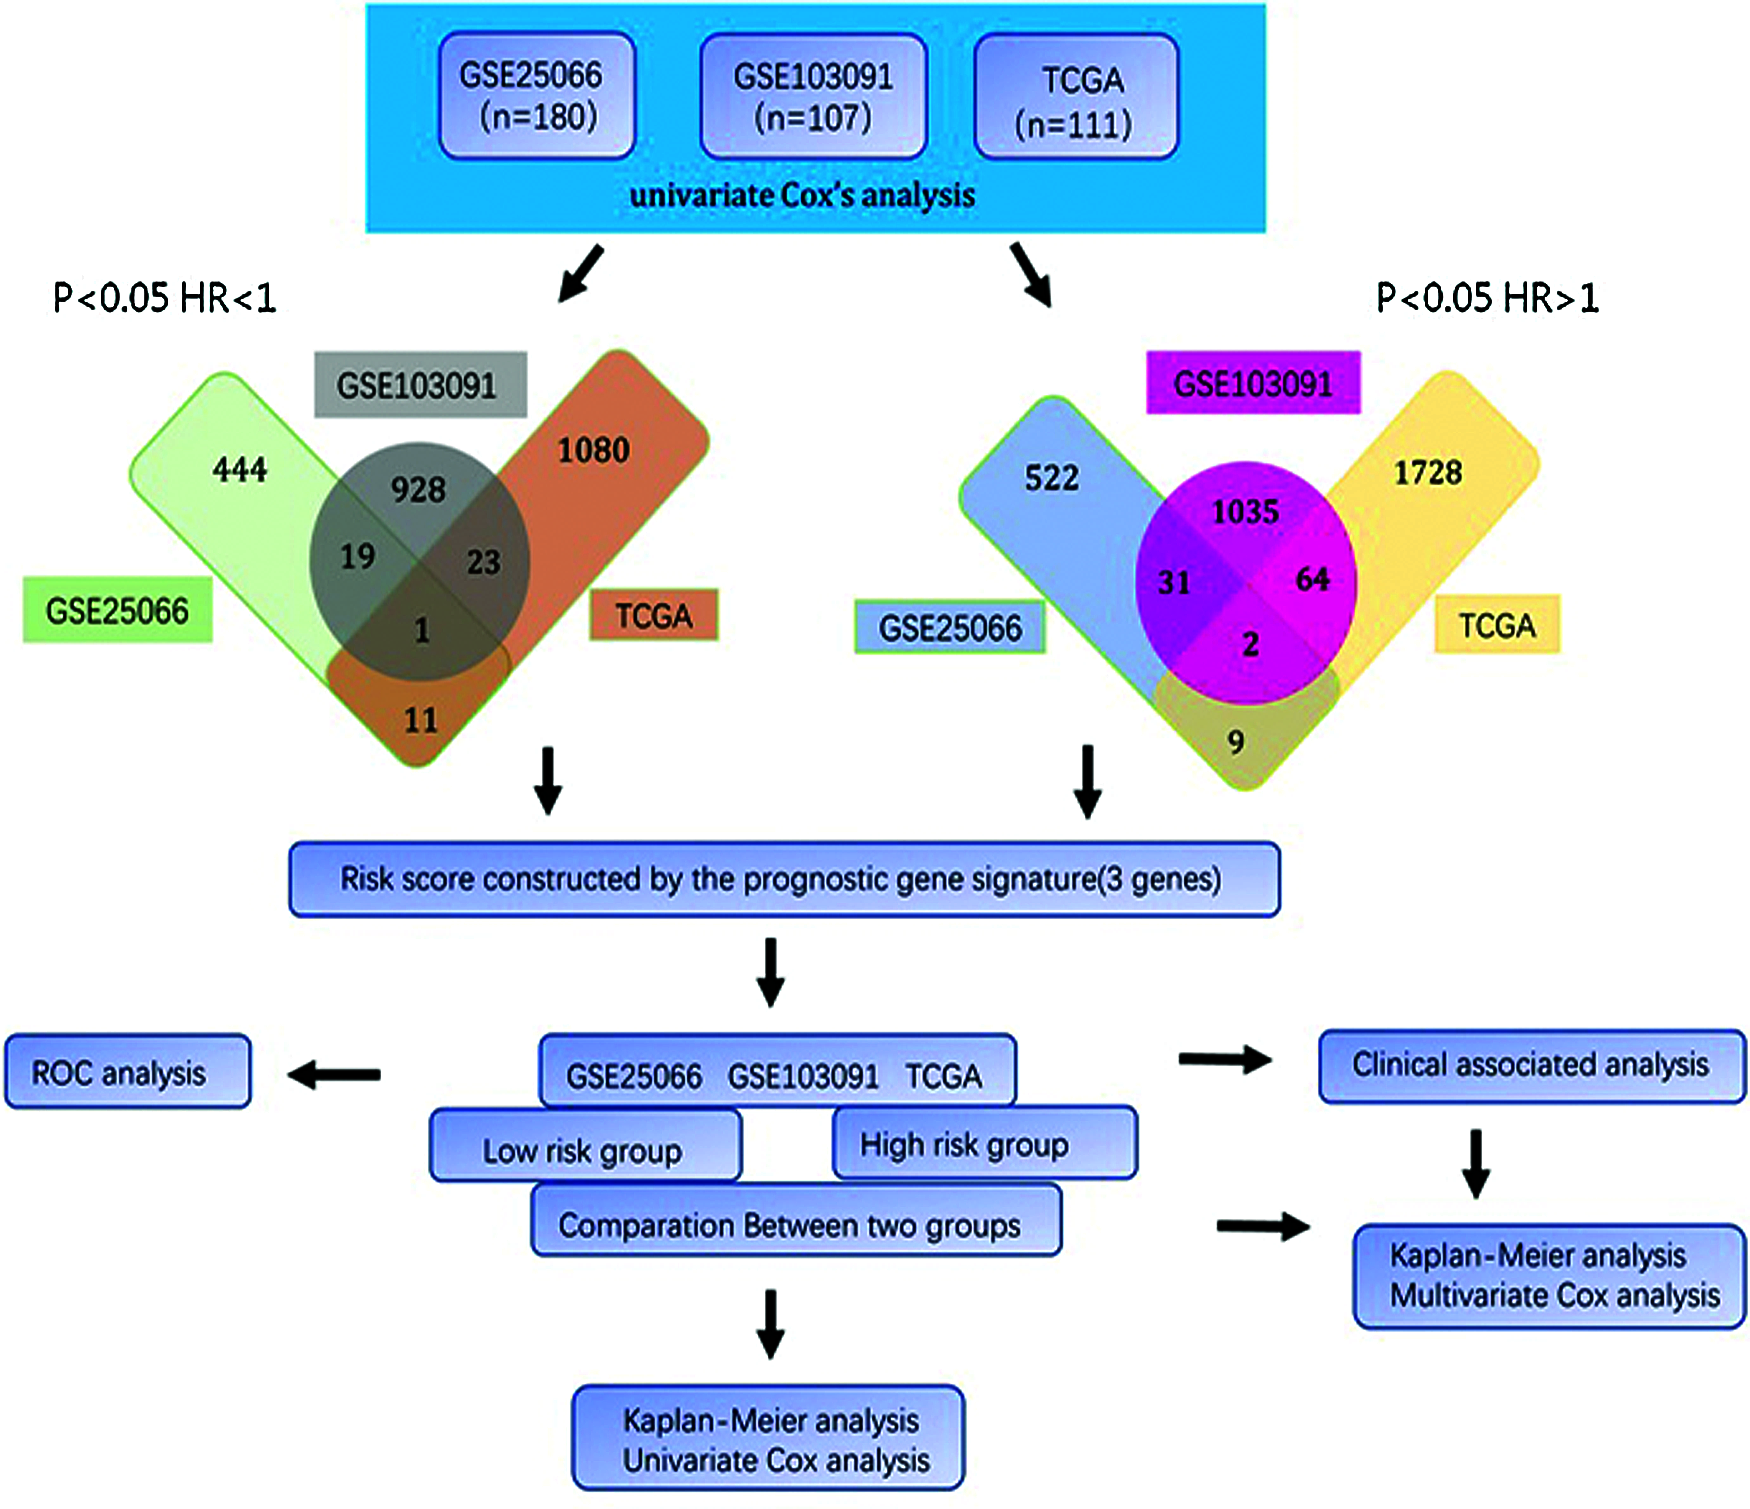
Figure 1: Flow diagram of study.
Patients and datasets included in the study
The normalized gene expression data and clinical data of breast cancer were downloaded from GEO and TCGA database with R packages. The raw data of methylation were downloaded from TCGA. There are two published datasets from GEO, including GSE25066 (Hatzis et al., 2011; Itoh et al., 2014), GSE103091 (Jézéquel et al., 2019; Jézéquel et al., 2015) and one dataset was employed from TCGA (https://tcga-data.nci.nih.gov/tcga/). The patients of datasets were filtered by several factors: ER, HER2 and PR are negative; not suffering from other malignancies and without preoperative chemoradiation if the information of samples is available; patients contained complete data. As a result, a total of 398 patients was finally selected in the current study, including 111 from TCGA, 180 patients from GSE25066, and 107 from GSE103091. The gene expression profile in GSE25066 and GSE103091 datasets were from the Affymetrix microarray platform, and gene expression profile of TCGA was from the Illumina sequencing platform.
Risk score formula establishment and validation
With Cox proportional hazards regression model, the gene expression levels and the overall survival relationship in each cohort were analyzed and the hazard ratio (HR) to identify the candidate genes. The Genes (HR < 1 and P < 0.05) were selected as protective genes with a reduction in the hazard and those genes (HR > 1 and P < 0.05) were considered as risky genes. The genes common among all datasets were constructed the prognostic signature.
Each of these prognosis-related genes was used to establish a risk score and weighted with regression coefficients. Risk score = C1 × gene1 + C2 × gene2 + C3 × gene3 (C is the regression coefficients and gene with number is the normalized expression value of each RNA). TNBC patients in each cohort were divided into high-risk and low-risk groups according to the median of the risk score. Then, the correlation between prognostic signature and overall survival was calculated in each cohort.
The Kaplan–Meier survival curve and the R package “survival” (Lin and Zelterman, 2002) were used to compare the survival rates of TNBC patients with high-risk scores and low-risk scores. Multivariate Cox regression model analysis was used to make sure that the 3-gene signature was independent of other known clinical-related variables. The ROC curve was used to investigate the prognostic ability of 3 gene signatures, and the R package was used to evaluate its accuracy and specificity (Blanche et al., 2013).
Three-gene prognostic signature
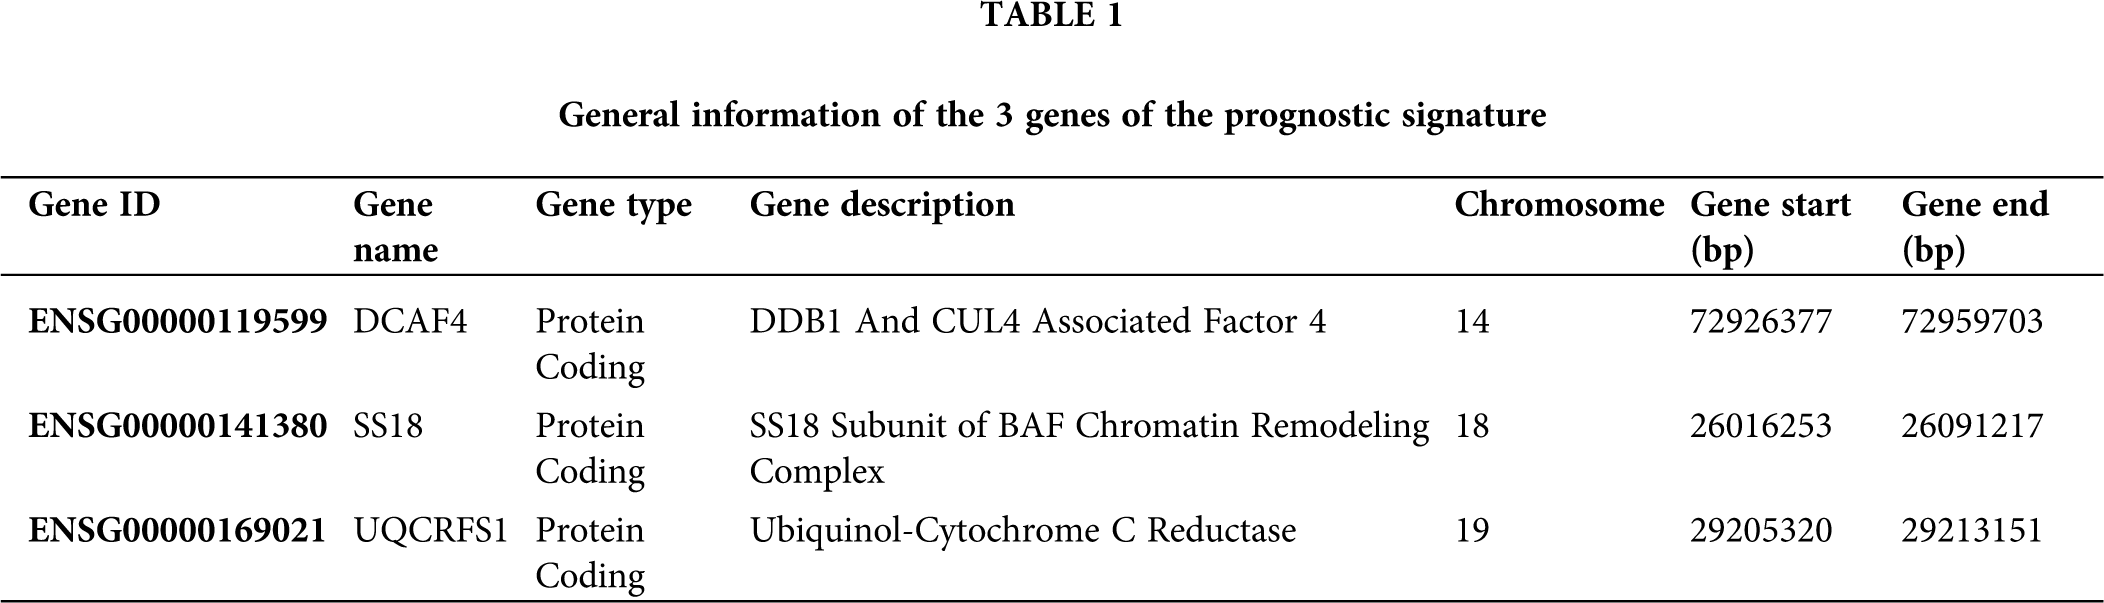
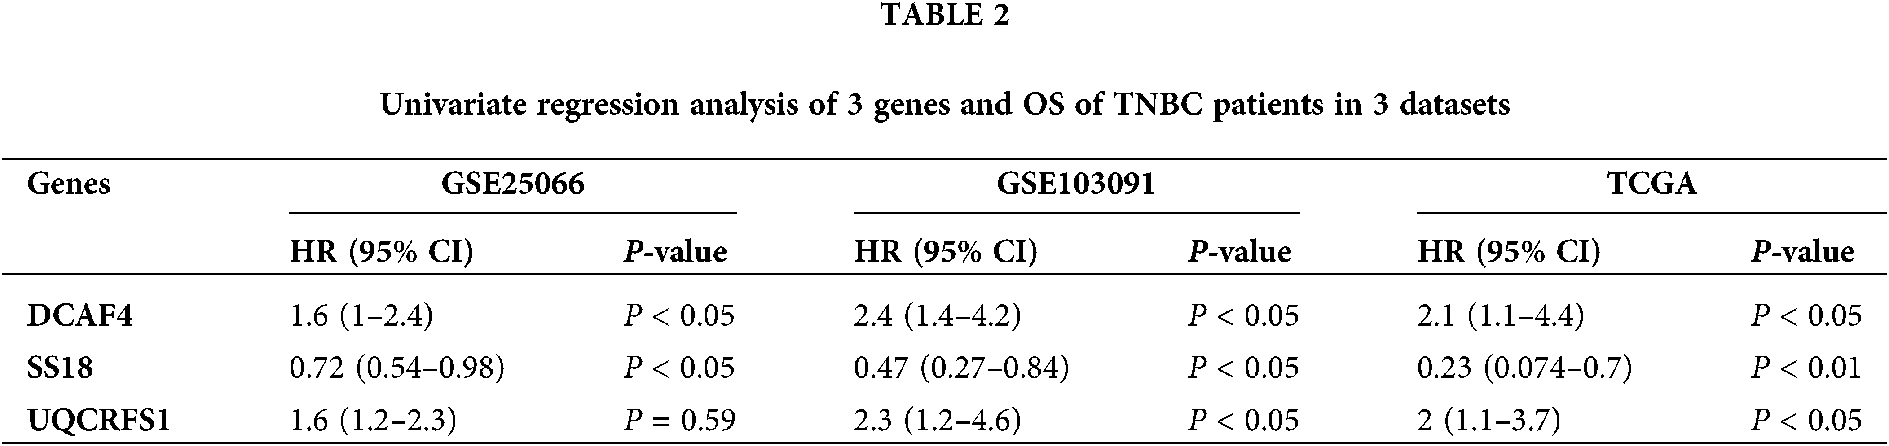
The univariate Cox regression method was used to analyze the expression profile and overall survival rate of all genes from each data set. Select genes that are significantly related to survival as candidate genes. Genes (HR < 1 and P < 0.05) were considered as potential protective genes, among them, there are 475 genes in GSE25066, 971 genes in GSE103091, and 1,115 genes in TCGA. Whereas these, the genes (HR > 1 and P < 0.05) were considered as potential risk genes which included 564 genes in GSE25066, 1,132 in GSE103091, and 1,803 in TCGA. By overlapping the candidate genes of the three datasets, both the protective gene and the risk gene, a total of 3 genes remained, two of which were considered as potential risk genes, and the other gene is a protective gene. Table 1 shows the basic information and annotations of the genes. And the correlation between each common gene and the overall survival of TNBC patients is displayed in Table 2.
Three-gene prognostic signature validation
In order to predict the overall survival of the patient, a risk score was formulated using regression coefficients and weighted by normalized gene expression values of each prognostic gene. Patients in each cohort were divided into high-risk groups and low-risk groups according to the risk scores. The distribution of risk score, normalized gene expression values of three genes, and survival status in each dataset was shown in Fig. 2. Those data demonstrate that the overall survival of high-risk groups is worse (Fig. 3, left panel). Then, patients in each cohort were divided into three groups: high-risk group, moderate-risk group, and low-risk group which displayed the highest risk score group with the worst overall survival (Fig. 3, middle panel). As shown in the right panel of Fig. 3, the AUC values of the time-dependent ROC curves of 3-gene signature were 0.71, 0.73 and 0.77 in GSE25066, GSE103091 and TCGA, suggesting the risk score developed with three genes can be used as a prognostic signature. Then, the expression levels of 3 genes across the groups classified by risk score were compared in each dataset. Patients in high-risk groups showed high expression levels of risky genes (DCAF4 and UQCRFS1), while patients in low-risk groups showed low expression of protective genes (SS18) (Fig. 4).

Figure 2: Risk-score analysis of TNBC in the 3 datasets.

Figure 3: Kaplan–Meier and ROC curves for the 3-gene signature in the 3 datasets.

Figure 4: Box plot visualization of the expression levels of the 3-genes in the risk groups.
Correlation between three-gene signature and clinical characteristics
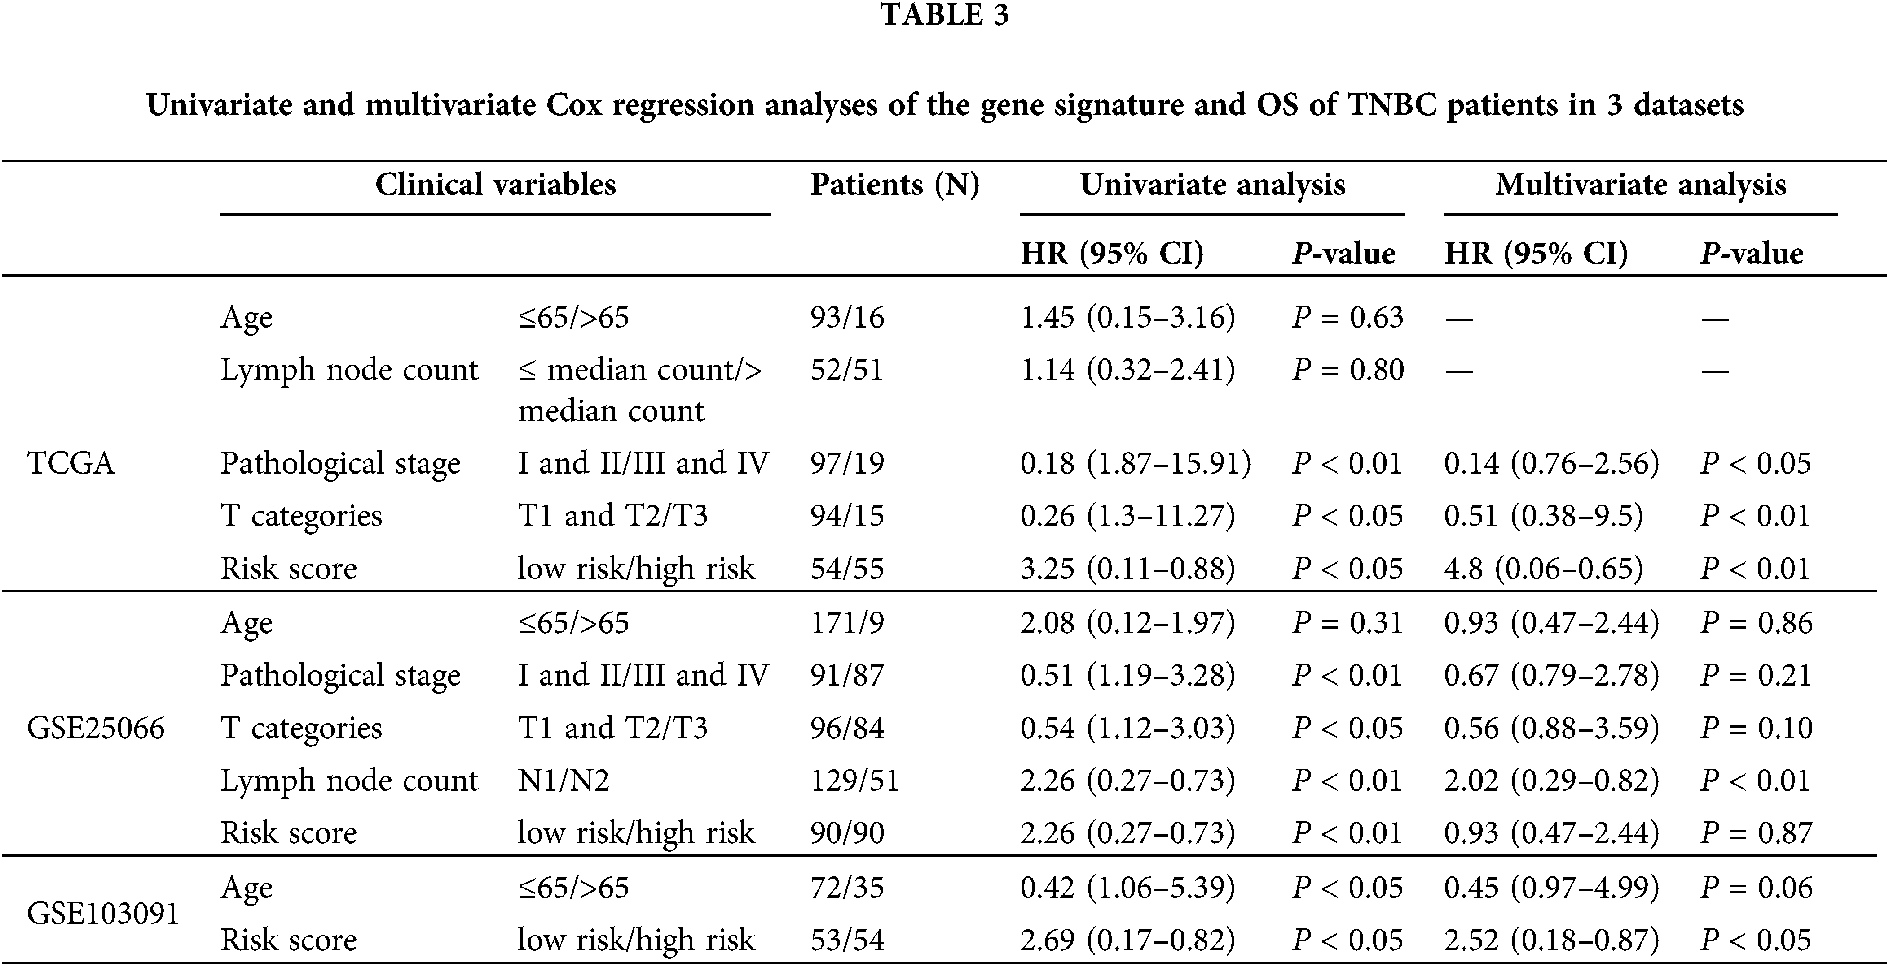
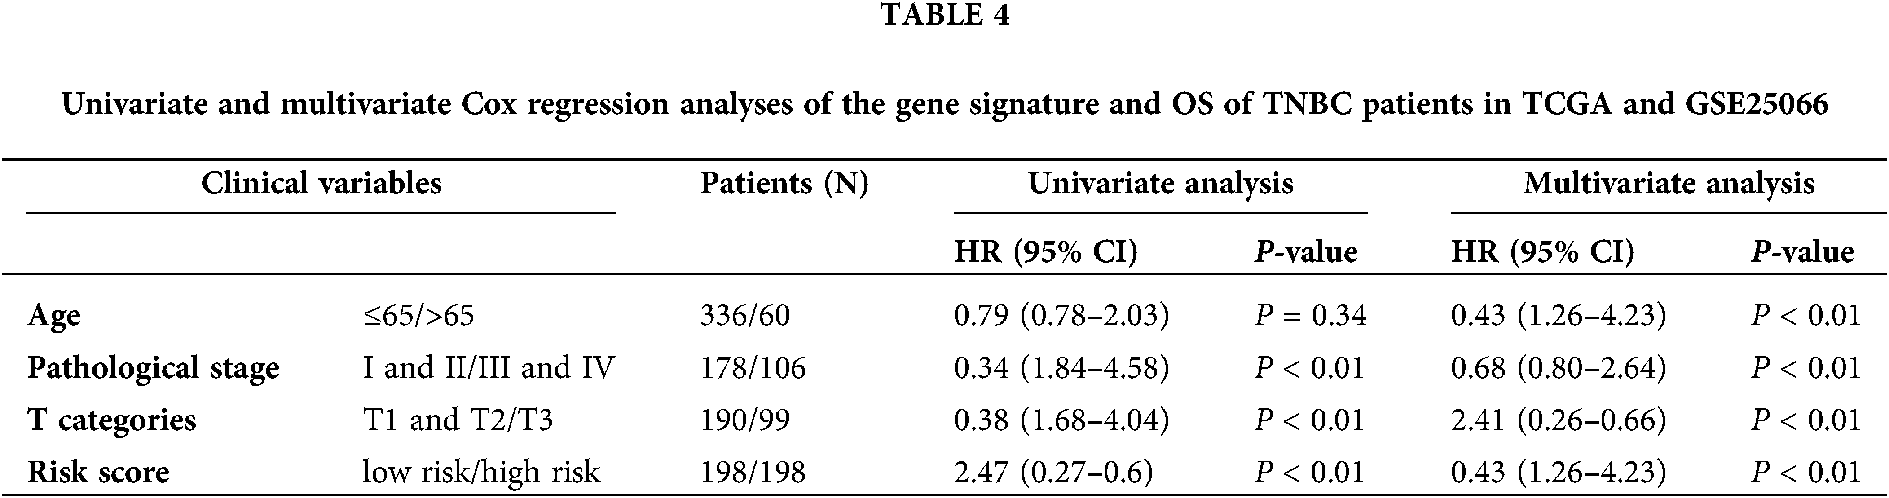
In order to investigate the prognostic independence of the 3-gene signature against known clinical risk factors, the Cox model analysis was used with stepwise model. Covariates contained 3-gene signature and clinical-related variables (age, pathological stage, pathological T stage and lymph node). In Tables 3 and 4, univariate Cox regression model analysis revealed 3-gene signature could serves as independent biomarker for the survival of TNBC patients in each cohort (GSE25066: HR = 2.02, 95% CI = 0.29–0.82, P = 6.00E-03; GSE103091: HR = 2.52, 95% CI = 0.18–0.87, P = 2.2 × 10⁻²; TCGA: HR = 4.80, 95% CI = 0.06–0.65, P = 7.00 × 10⁻³) and combined dataset of TCGA with GSE25066 (HR = 2.41, 95% CI = 0.26–0.66, P = 1.63 × 10⁻⁴). Univariate and multivariate Cox regression model analysis also showed the significantly correlation between pathological stage and overall survival in TCGA (univariate model: HR = 0.18, 95% CI = 1.87–15.91, P = 2.00 × 10⁻³; multivariate model: HR = 0.14, 95% CI = 0.76–2.56, P = 1.00 × 10⁻²) and combined dataset of TCGA with GSE25066 (univariate model: HR = 0.34, 95% CI = 1.84–4.58, P = 4.59 × 10⁻⁶; multivariate model: HR = 0.43, 95% CI = 1.26–4.23, P = 6.77 × 10⁻³), but not in GSE25066 cohort because of the pathological stage information is not available (Table 3).
Through univariate and multivariate Cox proportional hazard regression analysis, clinical features were also considered as potential prognostic factors. Then, the patients were classified to study the 3 gene signature that may effectively predict the overall survival of each clinical feature subgroup. The combined dataset was divided into groups by clinical information: age (≤65/>65), pathological stage (I and II/III and IV), and pathological T stage (T1 and T2/T3 and T4). As shown in Fig. 5, the 3-gene signature divided patients in the subgroups of age, pathological stage, and pathological T stage into high- and low-risk groups. The overall survival rate of each high-risk group was lower than that of the low-risk group.

Figure 5: Kaplan–Meier analysis of overall survival for patients stratified by Age, Pathological stage, and T stage.
Survival prediction by combined clinical-related variables and 3-gene signature
In the independent datasets and combined cohort, univariate and multivariate Cox proportional hazard regression analysis displayed that 3-gene signature, pathological stage and pathological T stage were significant correlated with survival rate (Tables 3 and 4). This means that those variables have significant survival predictive value in clinical treatment. Therefore, we developed prognostic models for survival prediction, which combines two clinical-related variables with the 3-gene signature, respectively. Patients from TCGA and GSE25066 were classified into six subgroups based on the pathological stage and the risk score: subgroup 1 (pathological Stage I with Low-risk score), subgroup 2 (pathological Stage I with High-risk score), subgroup 3 (pathological Stage II with Low-risk score), subgroup 4 (pathological Stage II with High-risk score), subgroup 5 (pathological Stage III with Low-risk score), and subgroup 6 (pathological Stage III with High-risk score). Since there are few Stage IV patients in the dataset, this stage status was not considered in those groups. Fig. 6 shows that pathological Stage II and pathological Stage III were divided into low-risk group and high-risk group. The patients in high-risk groups had worse overall survival, but in Stage I was not signature (Fig. 6, middle panel). However, the results showed no significant difference between several subgroups: subgroup 2 and subgroup 3, subgroup 2 and subgroup 5 and subgroup 4 and subgroup 5 (Fig. 6). The overall survival of patients in the high-risk group in the low-stage state (I and II) was similar to those in the low-risk group in the high-stage state, which suggest that more treatment should also be used to patients in each stage with a high-risk score. Similar results also showed in the prediction of overall survival by 3-gene signature and pathological T stage combination (Fig. S1). Subgroup 4 (Stage T2 with high-risk score) had worse outcomes than those in subgroup 3 (Stage T2 with low-risk score), and subgroup 8 (Stage T4 with high-risk score) was worse than those in subgroup 7 (Stage T4 with low-risk score) (Fig. S1, middle panel).
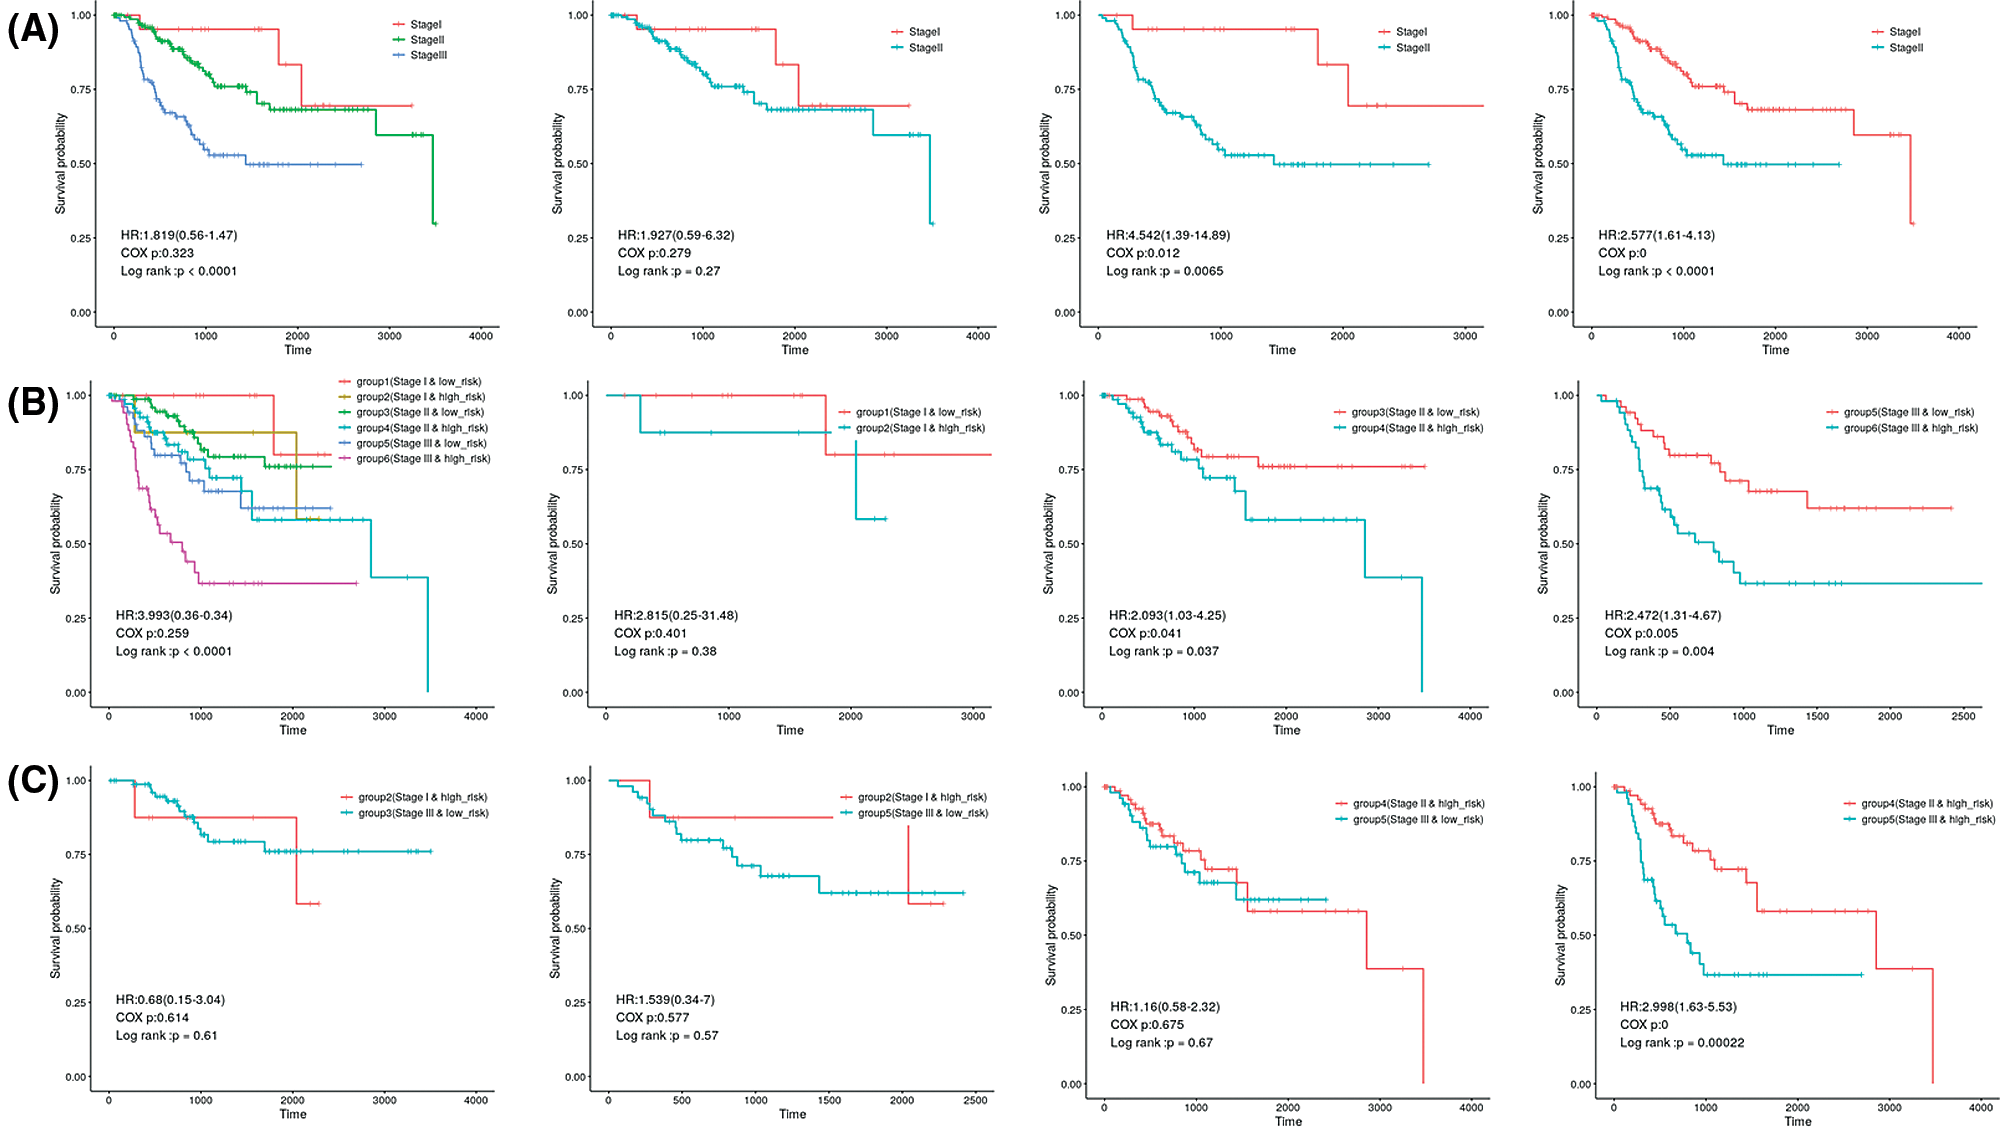
Figure 6: Kaplan–Meier analysis of overall survival for patients grouped by Pathological stage and 3-gene signature combination.
The results also showed no significant difference between the patients in subgroup 2 (Stage T1 with high-risk score) and subgroup 5 (Stage T3 with low-risk score), subgroup 2 (Stage T1 with high-risk score) and subgroup 7 (Stage T4 with low-risk score), subgroup 4 (Stage T2 with high-risk score) and subgroup 5 (Stage T3 with low risk) or subgroup 4 (Stage T2 with high-risk score) and subgroup 7 (Stage T4 and low-risk score).
Methylation associated with expression of prognosis signature genes
In Fig. 7, we analyzed the methylation levels of gene promoter related to 3-gene expression in TCGA datasets. For the DCAF4 and UQCRFS1 genes, there is a significant correlation between methylation and gene expression, indicating that promoter methylation levels regulate those genes. However, there is not a significant correlation for the SS18 gene. The SS18 gene expression may be regulated by other mechanisms.
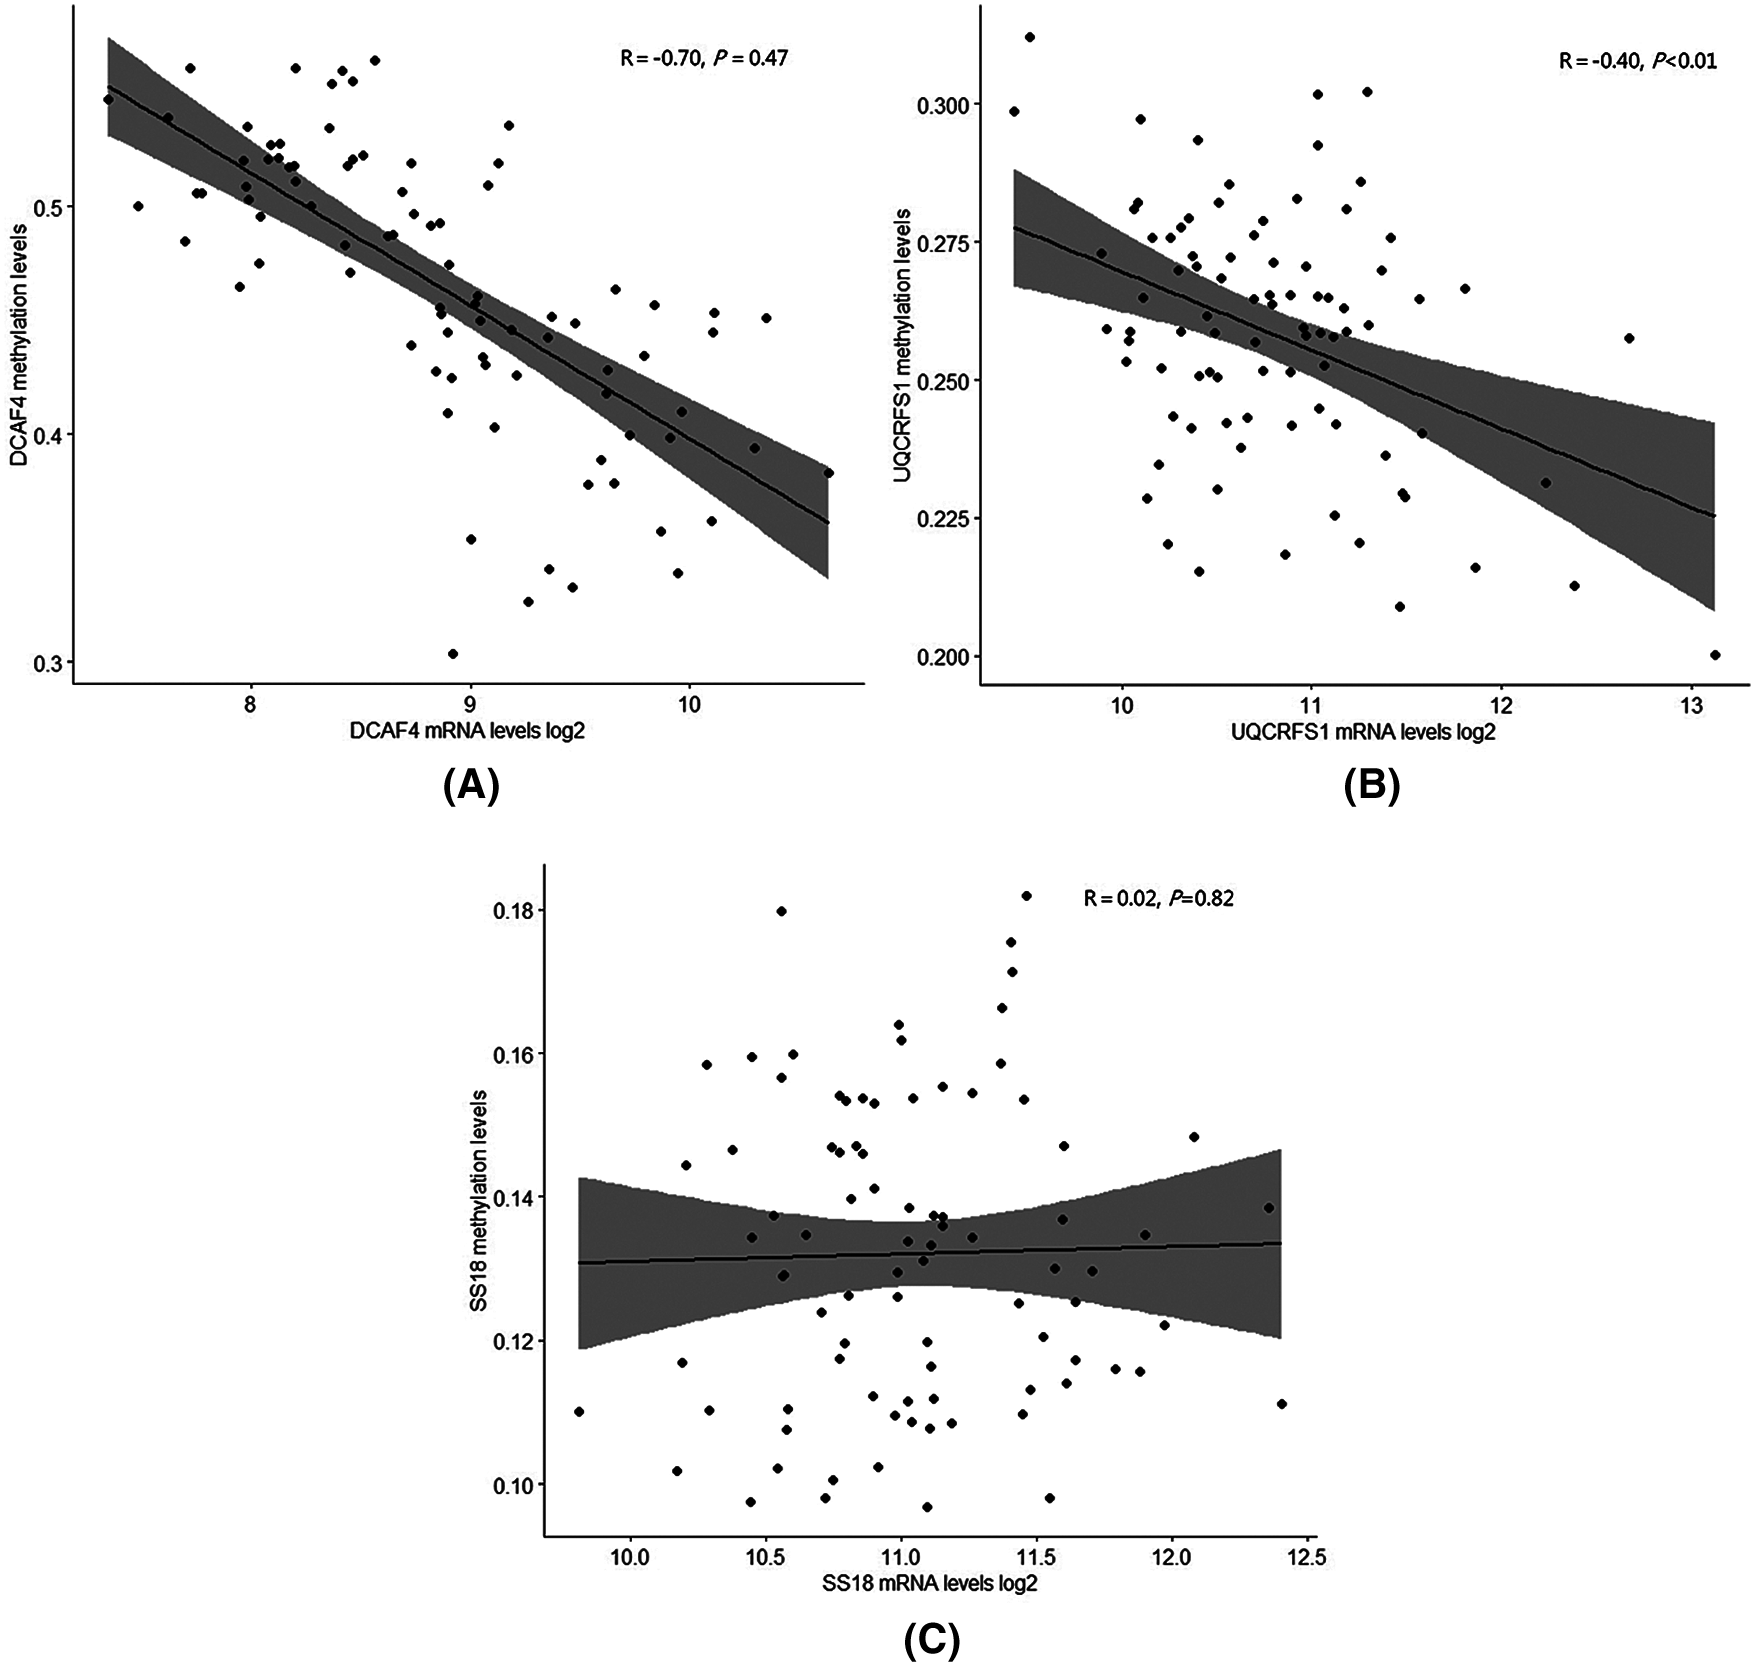
Figure 7: Methylation levels with expression of prognosis signature genes.
Due to the lack of therapeutic targets, both survival prediction and the treatment of TNBC has been a significant challenge in anticancer practice (Engebraaten et al., 2013; O’toole et al., 2013). It is necessary to identify survival associated genes for prognostic prediction to guide tailored therapy for patients with TNBC (Lee et al., 2013; Liu et al., 2016). In order to increase the understanding of the genomic changes of TNBC and allows personalized treatment decisions, we combined array data from GEO and sequence data from TCGA to screen for a novel 3-gene prognostic signature. This signature was developed and validated with genome-wide expression data from a different dataset of TNBC and may constitute an essential diagnostic data in treatment decisions for TNBC patients. In our study, survival related genes were identified with three independent datasets from different platforms. The overlapped genes among the different datasets constructed the 3-gene signature. This method provides a more robust and reliable multi-gene signature than that from a single dataset (Liu et al., 2016). Before system treatment, this 3-gene signature can be used to accurately predict the survival rate of patients. Moreover, we established the 3-gene signature and two clinical-related risk features (T stage or pathological stage) to predict the survival of TNBC. Those may be helpful to guide prognosis prediction and make a personalized therapeutic decision for patients with TNBC.
Although DNA methylation have already been reported to be associated with disease pathogenesis and cancer tumorigenesis, the potential relationships between TNBC and DNA methylation are still unclear. This study analyzed the DNA methylation levels of gene promoter related to 3-gene expression in TCGA datasets. For the DCAF4 and UQCRFS1 genes, there is a significant correlation between methylation and gene expression, indicating that promoter methylation levels regulate those genes. However, there is not a significant correlation for the SS18 gene. The SS18 gene expression may be regulated by other mechanisms. We determined three genes consisting of DCAF4, UQCRFS1 and SS18, which predict the survival of TNBC patients in three independent patient datasets. DCAF4, a repeat-containing protein, has been explicitly reported to direct degradation of ST7 and suppress tumorigenicity in colitis-associated cancer and functional variants of DCAF4 associated with lung cancer risk (Liu et al., 2017; Liu et al., 2019). UQCRFS1 is related to ATP synthesis (Bottani et al., 2017). Real-time PCR analysis showed that the expression level of UQCRFS1 mRNA was relatively high in colorectal cancer tissues and has been selected as a biomarker in clear cell renal cell carcinoma (Kim et al., 2017). UQCRFS1 overexpression has also been detected in breast tumors (Owens et al., 2011). SS18 was related to transcriptional misregulation in cancer and chromatin regulation (de Bruijn et al., 2006). This gene has been reported highly expressed in various kinds of malignant tumors (de Bruijn et al., 2006; Isfort et al., 2019; Przybyl et al., 2019). However, the roles of SS18 in breast cancer have not been investigated. In our study, the ROC analyses displayed that the AUC values of each dataset were more than 0.71 in overall survival, suggesting the 3-gene signature could be considered as a novel prognosis signature for TNBC patients. The tumor staging system was a useful tool for survival prediction and treatment decisions in the current treatment of TNBC (Jung et al., 2010). In this study, the combination of tumor stage status and risk score showed more information for the overall survival of patients. This prognostic model classified patients of the same clinical stage into high-risk and low-risk subgroups with significantly different survival status. Those results suggest the 3-gene signature can be a useful biomarker to improve the precise prognosis prediction. Survival prospects of the low stage status with high-risk score were similar to high stage with low-risk score, which reflected that the low stage with a high-risk score also had worse survival prediction. The combination of the 3-gene signature with clinical-stage information for prognosis prediction might be useful to make up for the shortcomings of tumor staging system prediction.
Our discovery may have clinical value for the diagnosis of TNBC patients. However, several limitations still exist in this study. First of all, only TCGA and GSE25066 datasets contained serval clinical factors include pathological stage and T stage. Information in GSE103091 was unavailable. Thus, GSE103091 was discarded in the analysis of the combination of 3-gene Signature and clinical-stage status. Secondly, this study was the entirely retrospective and analysis of gene expression with the heterogeneity of the techniques which contained the Affymetrix microarray and Illumina sequencing platform. Last but not the least, although the 3-gene signature showed good predictive accuracy in all datasets, the biological roles of these genes in TNBC should be further studied in vitro and in vivo based on other experimental methods.
Acknowledgement: We thank Dr. Shanshan Dan (New York University School of Medicine) for her valuable comments and extensive editing of the manuscript.
Authors’ Contribution: Study conception and design: W. Author, L. Author; data collection: S. Author, Y. Author; analysis and interpretation of results: F. Author, Z. Author. W. Author; draft manuscript preparation: W. Author, L. Author. All authors reviewed the results and approved the final version of the manuscript.
Ethics Approval: All experiments were approved by the hospital ethics committee and informed consent of all participants was obtained prior to sample collection. Ethical approval code 2019ky221and date of approval July 20, 2019.
Funding Statement: This study was funded by The National Natural Science Foundation of China (Nos. 82072909, 825001512); The Maternal and Child Health Research Foundation of Jiangsu Province (No. F201945); The Science and Technology Development Plan Project of Jilin Province (Nos. 20200404169YY, 20180101140JC) and the Postgraduate Training Innovation Foundation of Jiangsu Province (No. KYCX19_2113).
Conflicts of Interest: The authors declare that they have no conflicts of interest to report regarding the present study.
Abramson VG, Lehmann BD, Ballinger TJ, Pietenpol JA (2015). Subtyping of triple-negative breast cancer: Implications for therapy. Cancer 121: 8–16. [Google Scholar]
Blanche P, Dartigues JF, Jacqmin-Gadda H (2013). Estimating and comparing time-dependent areas under receiver operating characteristic curves for censored event times with competing risks. Statistics in Medicine 32: 5381–5397. [Google Scholar]
Bottani E, Cerutti R, Harbour ME, Ravaglia S, Dogan SA et al. (2017). TTC19 plays a husbandry role on UQCRFS1 turnover in the biogenesis of mitochondrial respiratory complex III. Molecular Cell 67: 96–105. [Google Scholar]
Corrêa ZM, Augsburger JJ (2016). Independent prognostic significance of gene expression profile class and largest basal diameter of posterior uveal melanomas. American Journal of Ophthalmology 162: 20–27. [Google Scholar]
de Bruijn DR, Allander SV, van Dijk AH, Willemse MP, Thijssen J et al. (2006). The synovial sarcoma-associated SS18-SSX2 fusion protein induces epigenetic gene (de) regulation. Cancer Research 66: 9474–9482. [Google Scholar]
Diao P, Song Y, Ge H, Wu Y, Li J et al. (2019). Identification of 4-lncRNA prognostic signature in head and neck squamous cell carcinoma. Journal of Cellular Biochemistry 120: 10010–10020. [Google Scholar]
Dyrskjøt L, Reinert T, Algaba F, Christensen E, Nieboer D et al. (2017). Prognostic impact of a 12-gene progression score in non-muscle-invasive bladder cancer: A prospective multicentre validation study. European Urology 72: 461–469. [Google Scholar]
Engebraaten O, Vollan HKM, Børresen-Dale AL (2013). Triple-negative breast cancer and the need for new therapeutic targets. The American Journal of Pathology 183: 1064–1074. [Google Scholar]
Foulkes WD, Smith IE, Reis-Filho JS (2010). Triple-negative breast cancer. The New England Journal of Medicine 363: 1938–1948. [Google Scholar]
Gonçalves H Jr, Guerra MR, Duarte Cintra JR, Fayer VA, Brum IV, Bustamante Teixeira MT (2018). Survival study of triple-negative and non-triple-negative breast cancer in a Brazilian cohort. Clinical Medicine Insights: Oncology 12: 1179554918790563. [Google Scholar]
Hatzis C, Pusztai L, Valero V, Booser DJ, Esserman L et al. (2011). A genomic predictor of response and survival following taxane-anthracycline chemotherapy for invasive breast cancer. JAMA 305: 1873–1881. [Google Scholar]
Isfort I, Cyra M, Elges S, Kailayangiri S, Altvater B et al. (2019). SS18-SSX-dependent YAP/TAZ signaling in synovial sarcoma. Clinical Cancer Research 25: 3718–3731. [Google Scholar]
Itoh M, Iwamoto T, Matsuoka J, Nogami T, Motoki T et al. (2014). Estrogen receptor (ER) mRNA expression and molecular subtype distribution in ER-negative/progesterone receptor-positive breast cancers. Breast Cancer Research and Treatment 143: 403–409. [Google Scholar]
Jézéquel P, Kerdraon O, Hondermarck H, Guérin-Charbonnel C, Lasla H et al. (2019). Identification of three subtypes of triple-negative breast cancer with potential therapeutic implications. Breast Cancer Research 21: 65. [Google Scholar]
Jézéquel P, Loussouarn D, Guérin-Charbonnel C, Campion L, Vanier A et al. (2015). Gene-expression molecular subtyping of triple-negative breast cancer tumours: Importance of immune response. Breast Cancer Research 17: 43. [Google Scholar]
Jung SY, Kim HY, Nam BH, Min SY, Lee SJ et al. (2010). Worse prognosis of metaplastic breast cancer patients than other patients with triple-negative breast cancer. Breast Cancer Research and Treatment 120: 627–637. [Google Scholar]
Kim HC, Chang J, Lee HS, Kwon HJ (2017). Mitochondrial UQCRB as a new molecular prognostic biomarker of human colorectal cancer. Experimental & Molecular Medicine 49: e391. [Google Scholar]
Lee U, Frankenberger C, Yun J, Bevilacqua E, Caldas C et al. (2013). A prognostic gene signature for metastasis-free survival of triple negative breast cancer patients. PLoS One 8: e82125. [Google Scholar]
Lin H, Zelterman D (2002). Modeling survival data: Extending the Cox model. Technometrics 44: 85–86. [Google Scholar]
Liu H, Liu Z, Wang Y, Stinchcombe TE, Owzar K et al. (2017). Functional variants in DCAF4 associated with lung cancer risk in European populations. Carcinogenesis 38: 541–551. [Google Scholar]
Liu H, Lu W, He H, Wu J, Zhang C et al. (2019). Inflammation-dependent overexpression of c-Myc enhances CRL4DCAF4 E3 ligase activity and promotes ubiquitination of ST7 in colitis-associated cancer. The Journal of Pathology 248: 464–475. [Google Scholar]
Liu YR, Jiang YZ, Xu XE, Hu X, Yu KD, Shao ZM (2016). Comprehensive transcriptome profiling reveals multigene signatures in triple-negative breast cancer. Clinical Cancer Research 22: 1653–1662. [Google Scholar]
O’toole SA, Beith JM, Millar EK, West R, Mclean A et al. (2013). Therapeutic targets in triple negative breast cancer. Journal of Clinical Pathology 66: 530–542. [Google Scholar]
Owens KM, Kulawiec M, Desouki MM, Vanniarajan A, Singh KK (2011). Impaired OXPHOS complex III in breast cancer. PLoS One 6: e23846. [Google Scholar]
Patil V, Mahalingam K (2018). A four-protein expression prognostic signature predicts clinical outcome of lower-grade glioma. Gene 679: 57–64. [Google Scholar]
Przybyl J, Van De Rijn M, Rutkowski P (2019). Detection of SS18-SSX1/2 fusion transcripts in circulating tumor cells of patients with synovial sarcoma. Diagnostic Pathology 14: 24. [Google Scholar]
Sporikova Z, Koudelakova V, Trojanec R, Hajduch M (2018). Genetic markers in triple-negative breast cancer. Clinical Breast Cancer 18: e841–e850. [Google Scholar]
Xiang Y, Ye Y, Lou Y, Yang Y, Cai C et al. (2017). Comprehensive characterization of alternative polyadenylation in human cancer. Journal of the National Cancer Institute 110: 379–389. [Google Scholar]
Yang R, Xing L, Wang M, Chi H, Zhang L, Chen J (2018). Comprehensive analysis of differentially expressed profiles of lncRNAs/mRNAs and miRNAs with associated ceRNA networks in triple-negative breast cancer. Cellular Physiology and Biochemistry 50: 473–488. [Google Scholar]

Figure S1: Kaplan-Meier analysis of overall survival for patients grouped by Pathological stage and 3-gene signature combination.
 | This work is licensed under a Creative Commons Attribution 4.0 International License, which permits unrestricted use, distribution, and reproduction in any medium, provided the original work is properly cited. |