DOI:10.32604/biocell.2022.020311
| BIOCELL DOI:10.32604/biocell.2022.020311 | |
| Article |
Development of polymorphic SSR markers and their applicability in genetic diversity evaluation in Euptelea pleiosperma
College of Life Science, Luoyang Normal University, Luoyang, 471934, China
*Address correspondence to: Xiaojun Zhou, zhouxiaojun@lynu.edu.cn
Received: 16 November 2021; Accepted: 13 March 2022
Abstract: Euptelea pleiosperma is a characteristic species of East Asian flora with both ornamental and scientific values. Based on the reduced-representation sequencing (RRS) technology of RAD-Seq, this study conducted high-throughput Illumina paired-end sequencing to find SSR marker information in the genome of E. pleiosperma, and to screen and verify polymorphism of SSR markers. We obtained 5.5G of high-quality data using RAD-Seq. The total number of contigs of the RAD tags was 299,376, with the maximum contig length of 2,062 bp and the average length of 445 bp. From these sequences, we identified 20,718 SSR loci, with a distribution density of one SSR per 6.45 kb (1/6.45 kb). Among all SSRs, dinucleotides (52.00%) were the most detected SSRs, followed by mononucleotides (21.63%). AG/CT was the dominant motif in the SSR loci, accounting for 34.8%. Primers were successfully designed for 14,593 loci, and 100 pairs of these primers were randomly selected for chemical synthesis and validated by SSR-PCR amplification in 20 individuals of E. pleiosperma. Seventy-nine primers were able to amplify the target bands. Cervus 3.0 software was used to analyze the selected 20 SSR loci with good polymorphism. For the 20 SSR markers, the number of alleles ranged from 4 to 9, and the observed heterozygosity and expected heterozygosity were from 0.35 to 0.75 and 0.541 to 0.875, respectively. The information content of polymorphic loci ranged from 0.463 to 0.848, with an average value of 0.638. Among them, there were 18 highly polymorphic loci, and 20 SSR loci did not deviate from the Hardy-Weinberg equilibrium. Furthermore, the 20 pairs of SSR primers were used to conduct PCoA analysis based on Nei’s genetic distance of 51 individuals from three populations. The results showed that these SSR markers could distinguish genetic differences based on different geographical locations.
Keywords: Cluster analysis; E. pleiosperma; RAD-Seq; Rare species; SSR markers
Euptelea pleiosperma J. D. Hooker & Thomson is a tertiary relict plant of the Eupteleaceae family, mainly distributed in Henan, Hebei, and Shanxi in China (Fu and Peter, 2001). This species forms deciduous shrubs or small arbors with flowers that open before the leaf flush, and clusters of red flowers and fruits, making it a beautiful ornamental tree. In addition, E. pleiosperma is a characteristic species of the East Asian flora, which has important academic value for the study of palaeoflora and paleoclimate (Wang et al., 2015). However, with the social development, the wild habitats have been disturbed or destroyed by human activities, affecting the growth and natural regeneration of E. pleiosperma (Chen et al., 2007). As a result, the number of E. pleiosperma has decreased dramatically and the distribution range has become increasingly smaller (Wang and Qin, 2011). Therefore, the species has been listed as a national third-class protected plant of China and the IUCN LC level (Wang and Xie, 2004; Sun, 2018). As a rare plant with both ornamental and scientific value, E. pleiosperma attracted the attention of many researchers. Much research has been conducted on habitats investigation of germplasm, seedling growth assays, or chemical composition analysis (Zhang et al., 2016; Yan et al., 2020).
At the molecular level, SCoT (start codon targeted polymorphism) and RAPD (random amplified polymorphic DNA) molecular markers were used to analyze the genetic diversity of related populations of E. pleiosperma (Wu et al., 2020; Wang et al., 2014; Zhang et al., 2016).
Simple sequence repeats (SSRs), are widely present in eukaryotes and consist of 1–6 nucleotides in tandem as repeating units (Varshney et al., 2005; Zhang et al., 2021). Compared with SCoT and RAPD molecular markers, SSRs have the characteristics of high polymorphism, co-dominant inheritance, and are suitable for high-throughput automated genotyping (Varshney et al., 2005; Victoria et al., 2011). SSRs have been widely used in genetic analysis and conservation of tobacco, soybean, and ginkgo (Liu et al., 2018; Qi et al., 2019). Reduced-representation sequencing (RRS) techniques reduce the complexity of the genome of a given species by sequencing only a subset of the genome (Choquet, 2021). Restriction-site associated DNA sequencing (RAD-Seq) is a simplified genome sequencing technique based on whole-genome restriction sites developed using next-generation sequencing (Baird et al., 2008). In the past few years, dozens of publications using RAD-Seq have been reported in molecular marker development, genetic diversity, and mapping studies (Etter et al., 2011; Gonen et al., 2014; Tsujimoto et al., 2020). Some of the main reasons are that RAD-Seq does not require a reference genome, it represents a cost-effective and high throughput method for generating comparative genomic information and it can be widely used in different species (Miller et al., 2007; Feng et al., 2020). The approaches are particularly useful for species that rather young plant groups (less than 50 million years), and across different plant systems (Eaton et al., 2017).
This study analyzed the SSR markers characteristics of E. pleiosperm based on RAD-Seq and explored the feasibility of developing polymorphic SSR markers. These SSR markers will provide opportunities for examining the genetic diversity and population structure of E. pleiosperma and contribute to the effective conservation of this species.
The plant samples were collected in the Longyuwan National Forest Park (Luanchuan County, Luoyang City, China), the Daohuigou Park (Songxian County, Luoyang City, China), and the Xiaoqinling National Nature Reserve (Lingbao County, Sanmenxia City, China). Sampling information is shown in Table 1.
For each individual healthy young leaves were collected (different individuals should be more than 10 meters apart) and stored in the refrigerator at 4°C. DNA was extracted by modified CTAB (hexadecyl trimethyl ammonium bromide) method and detected by KAIAO ultra-micro spectrometer (K5500, Beijing, China).
Sequencing and data processing
Three qualified genomic DNA samples were mixed in equal amounts, treated with restriction enzymes, and P1 adaptors were added (the adaptors contain amplification primer sites, Illumina sequencing primers binding sites sequences, and short tag sequences to distinguish different samples). The DNA sample was interrupted into short sequences of 300–700 bp in length and added with P2 adaptors (which include the reverse complementary amplification primer sites), and then RAD tags were enriched by PCR amplification. The RAD libraries were sequenced by the Illumina NovaSeq 6000 platform. The raw reads obtained from sequencing were conducted quality control by twice data filtering, and then high-quality clean reads were used for subsequent analysis. High-quality Illumina sequencing reads were submitted to the NCBI (accession number: PRJNA749160). The specific sequencing and assembly procedures were described in references (Catchen et al., 2011; Willing et al., 2011).
Screening and validation of SSR
SSRs search was performed on the assembled sequences by the software MISA (Beier et al., 2017). The searching parameters of SSR loci were set to identify perfect mono-, di-, tri-, tetra-, penta-, and hexa-nucleotide motifs with a minimum of 15, 6, 5, 4, 4, and 4 repeats, respectively. Moreover, the distance between two SSRs must be at least 100 bp. If the distance between two SSRs is less than 100 bp, they are merged into one SSR marker. SSR primers were designed using Primer Premier 3.0 software in the flanking regions (Untergasser et al., 2012; Zhou et al., 2015). To validate the designed primers, a total of 100 pairs of primers were synthesized and PCR was carried out for amplification in 20 individuals of E. pleiosperma. The number of individuals from LY, XQ, and DH was 10, 5, and 5 respectively. The PCR procedure was carried out in 15 μl volume containing 7.5 μl of 2 × PCR Mixture (Tiangen, Beijing, China), 20 ng of genomic DNA, 0.25 μM of forward and reverse primers with conditions as follows: denaturation for 5 min at 94°C followed by 30 cycles of 50 s at 94°C, 45 s for annealing and 30 s min at 72°C. Amplification products were resolved by 10% polyacrylamide gel electrophoresis (PAGE) and visualized by silver staining. The size of each SSR-PCR product was determined in comparison with pBR322 DNA/MspI marker (Tiangen, Beijing, China).
Twenty pairs of SSR primers with good polymorphism were selected to conduct the genetic analysis of the 51 individuals from three populations (LY, DH, and XQ). The amplified data were input into GenAlEx v6.5, and the principal coordinate analysis (PCoA) was performed based on Nei’s genetic distance of the individuals in different populations (see e.g., Karbstein et al., 2019).
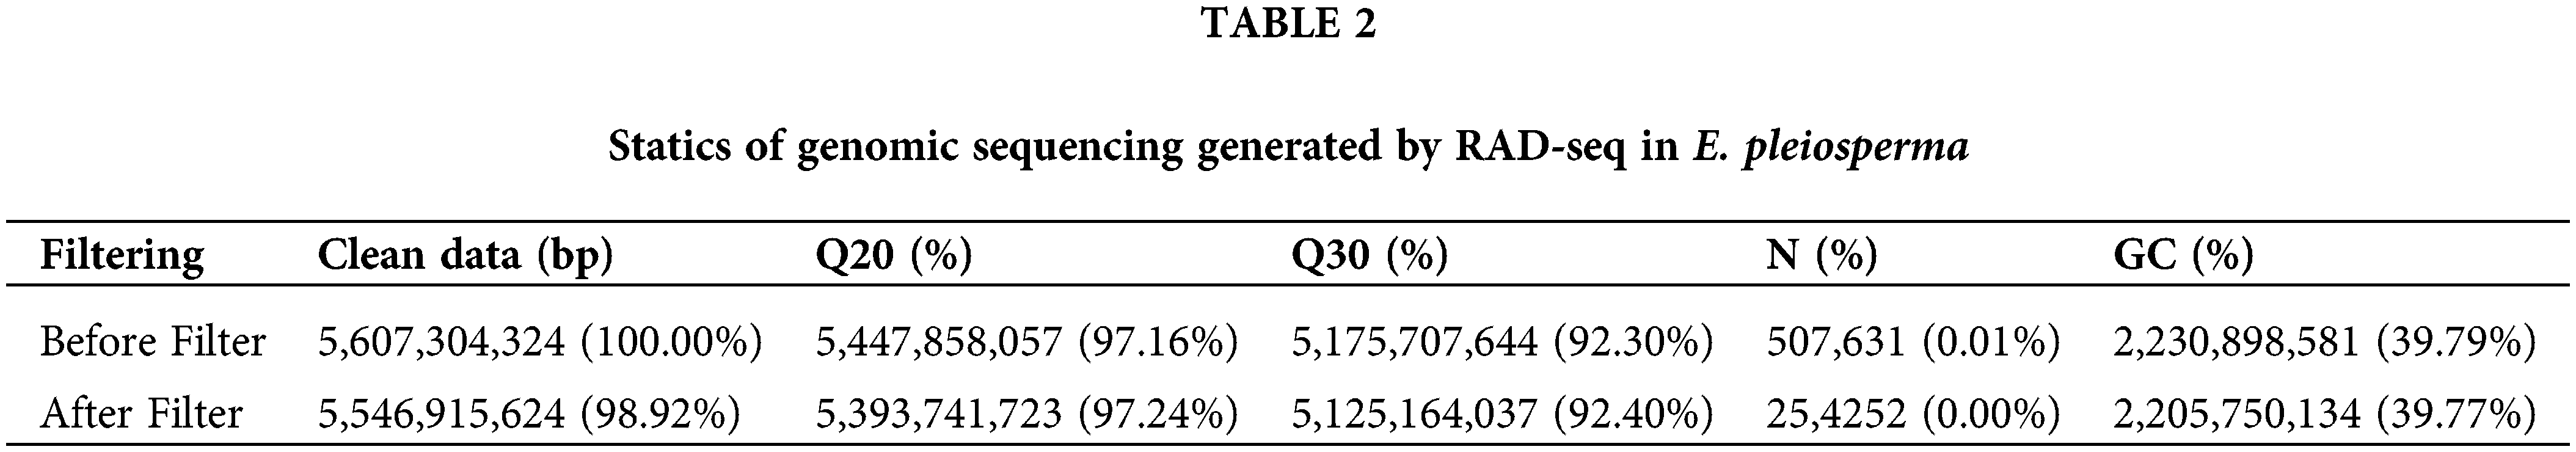
The raw data obtained by sequencing and the clean data after filtering are shown in Table 2. It indicates that the obtained data are accurate and reliable and can be used for further analysis. The total number of contigs assembled from the RAD tags was 299,376 with a length average of 445 bp, a minimum of 159 bp, and a maximum of 2,062 bp.
Profile of the SSR loci of E. pleiosperma
After searching 299,376 contigs by MISA software (http://pgrc.ipk-gatersleben.de/misa/), a total of 20,718 SSR loci were detected. Of these, 19,034 (91.87%) were complete SSRs and 1,684 (8.13%) were complex SSRs. The 20,718 SSR loci were distributed in 18,135 contig sequences, of which 2,171 sequences contained two or more SSR loci. The distribution density of the SSR was 0.155 SSR/kb, with an average of one SSR locus per 6.45 kb (1/6.45 kb). The sequences containing SSR loci accounted for 6.06% of the total number of sequences, and detected SSR loci accounted for 6.92% of the total number of sequences.
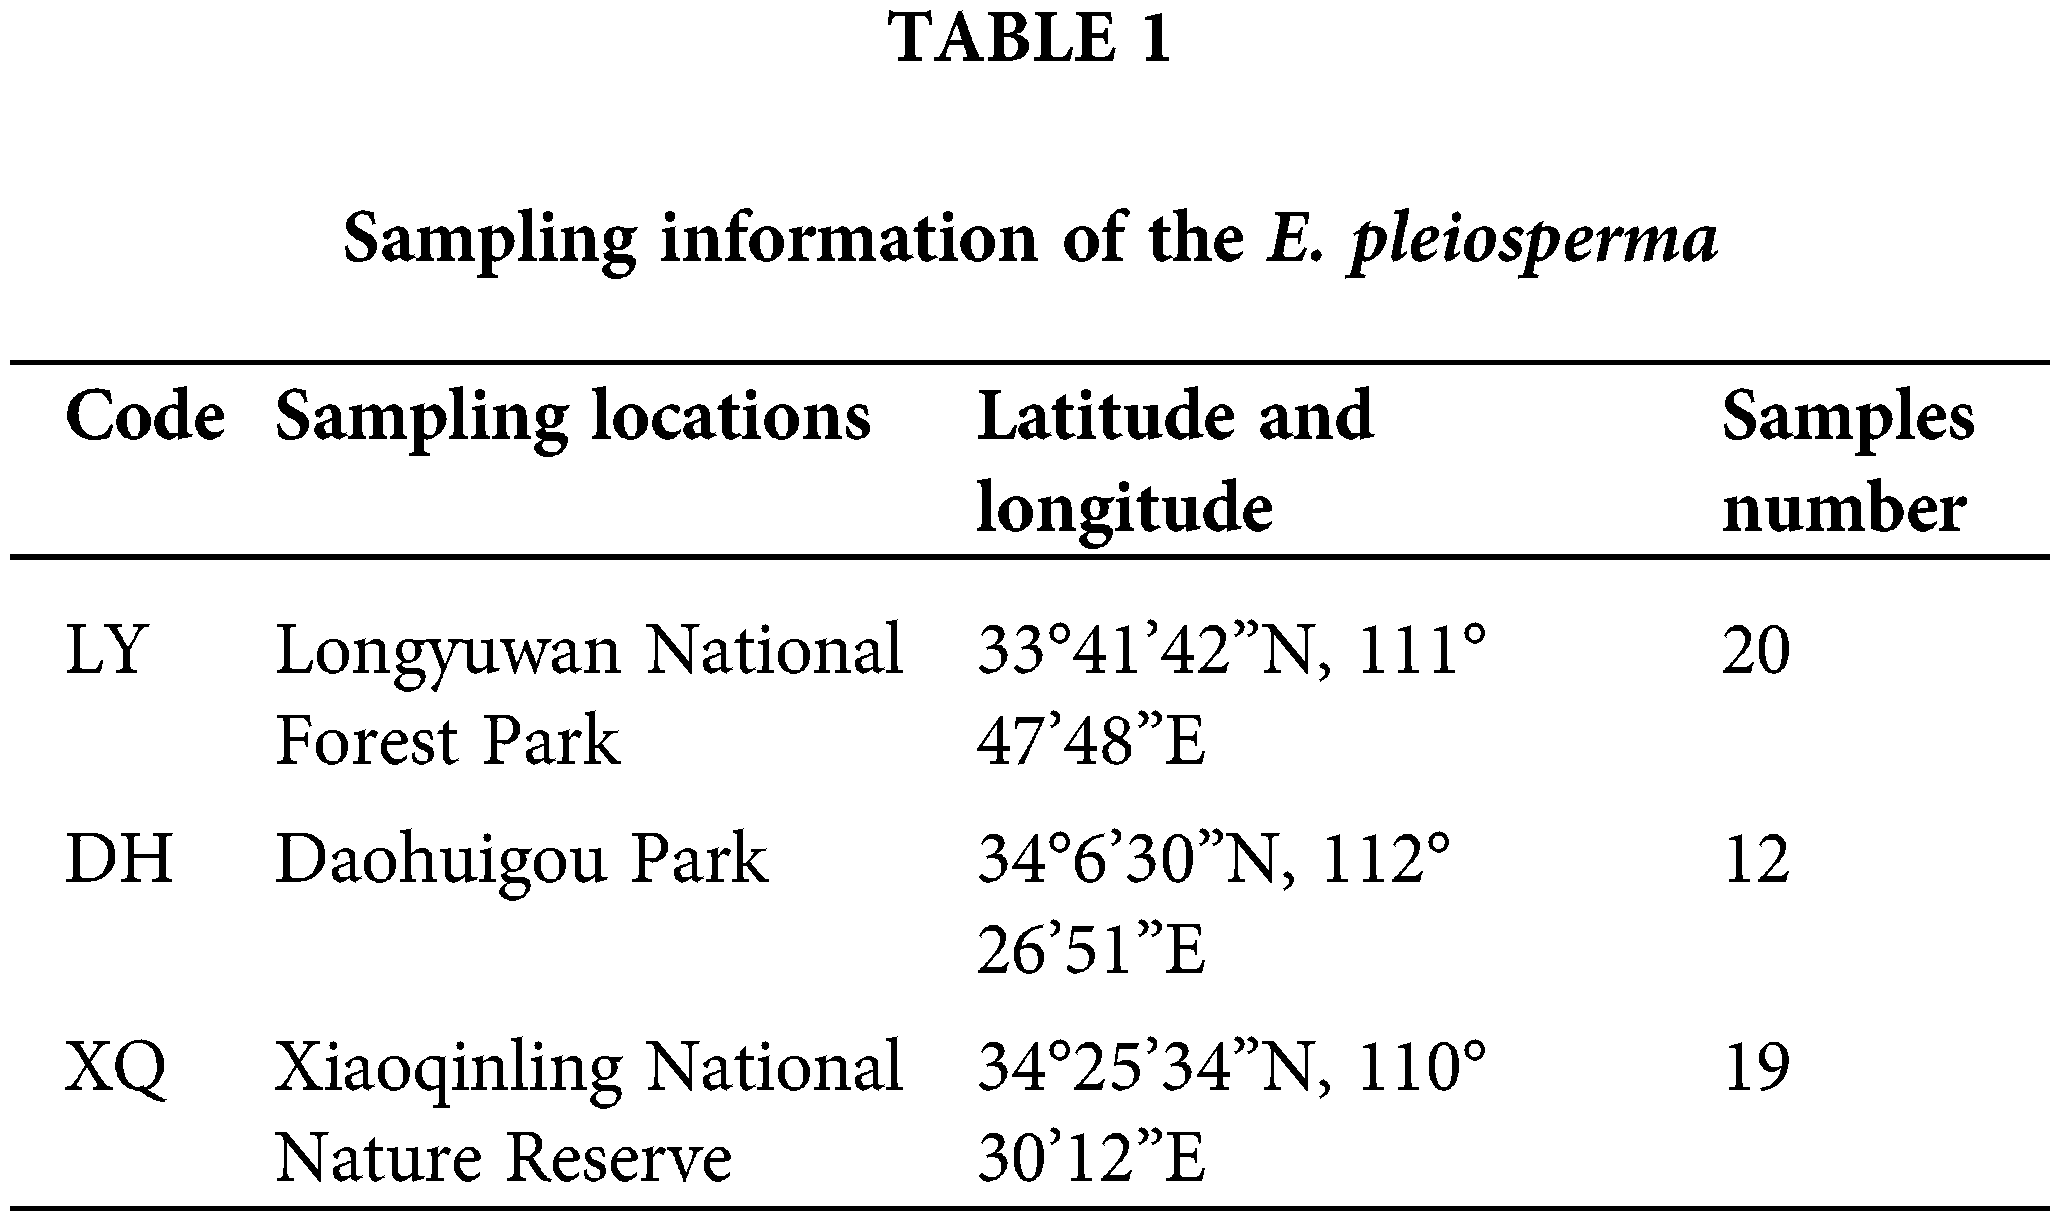
In the present study, dinucleotide was the most abundant SSR marker, accounting for 52.00% (10,773) of all SSRs, followed by mono- (21.63%, 4,482), tri- (16.19%, 3,355), tetra- (6.21%, 1,287), hexa- (2.11%, 437) and pentanucleotide (1.85%, 384). The A/T motif accounted for 96.3% of the mononucleotide repeat motifs and 20.8% of all SSR loci. AG/CT was the most common dinucleotide motif, accounting for 67.1% of all dinucleotide repeat motifs and 34.8% of all SSR loci. AAG/CTT was the dominant trinucleotide motif, accounting for 40.1% of all trinucleotide repeat motifs and 6.3% of all SSR loci. For tetranucleotide repeats, the most frequent motif was AAAT/ATTT, which accounted for 63.2% of all tetranucleotide repeat motifs and 2.4% of all SSR loci. The total number of pentanucleotides and hexanucleotides accounted for 7.1% of all SSR loci (Fig. 1).
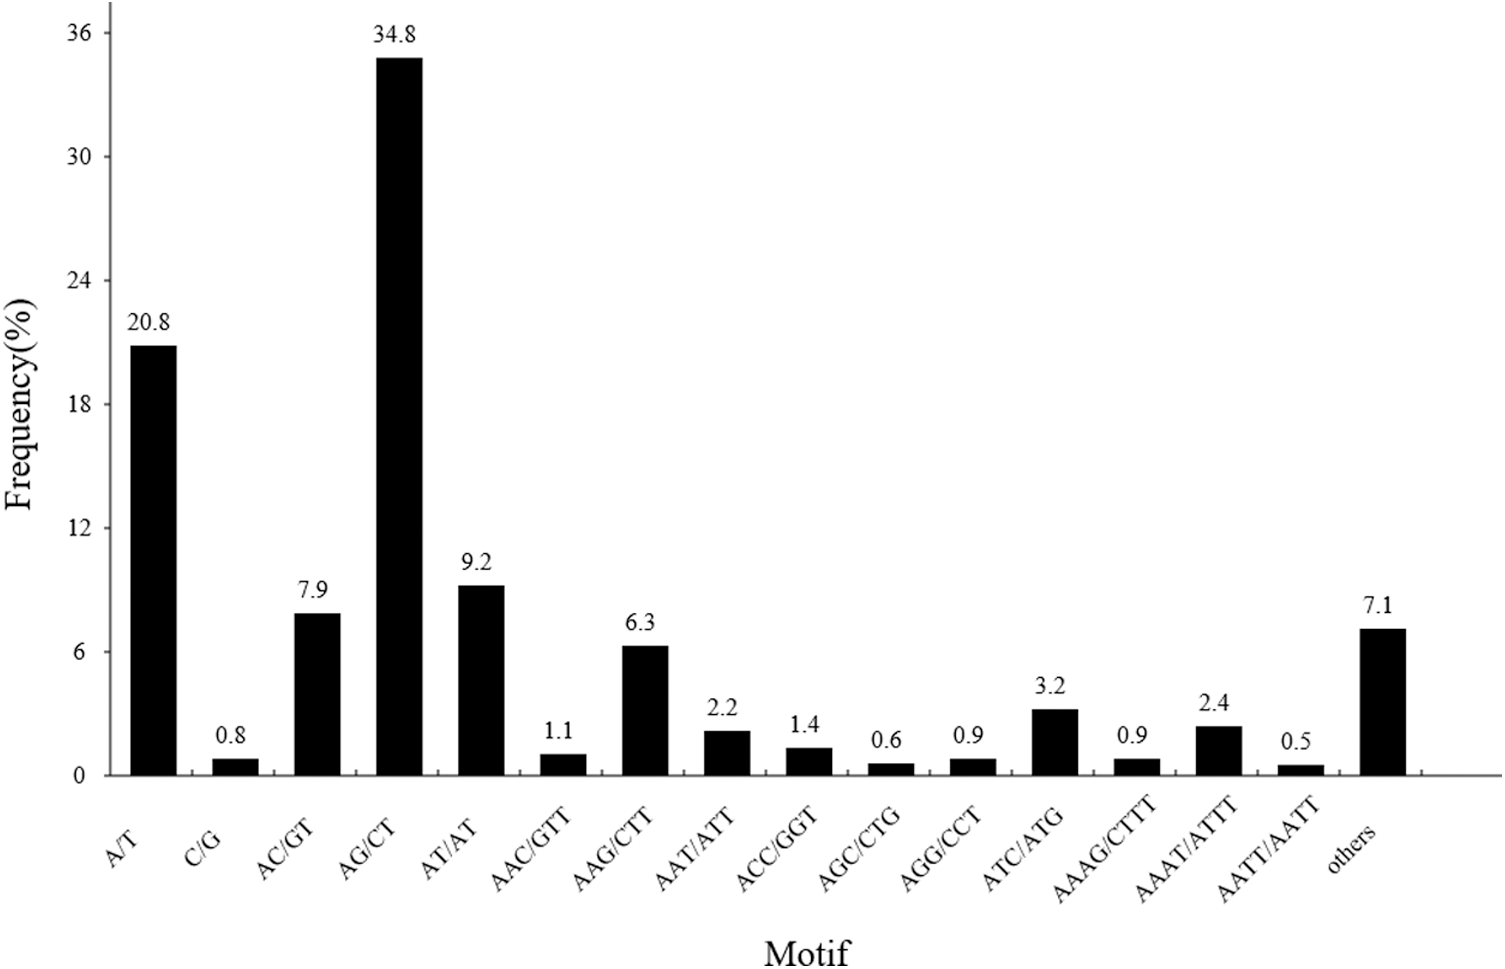
Figure 1: Statistics of E. pleiosperma SSR motifs. The x-coordinate is the SSR motif type, and the y-coordinate is the proportion of different motif types among all SSRs. The others represent pentanucleotides and hexanucleotides motif types.
Length distribution of SSRs motifs
The SSR motifs length of the E. pleiosperma genome was in the range of 12–142 bp, and there were 17,862 SSRs in the range of 12–20 bp, accounting for 86.0% of all SSRs. There were 2,919 SSR motif sequences longer than 20 bp, accounting for 14.0% of all sequences. There were 16,403 SSR loci between 12 and 19 bp and 4,378 ≥ 20 bp in the genomes of E. pleiosperma. Therefore, in the genome of E. pleiosperma, most SSR loci (78.9%) showed moderate polymorphism, and the loci with high polymorphism account for 21.1%. The number of SSRs with motif length of 16 bp was the highest (3,542), representing 17.0% of all SSRs (Fig. 2).
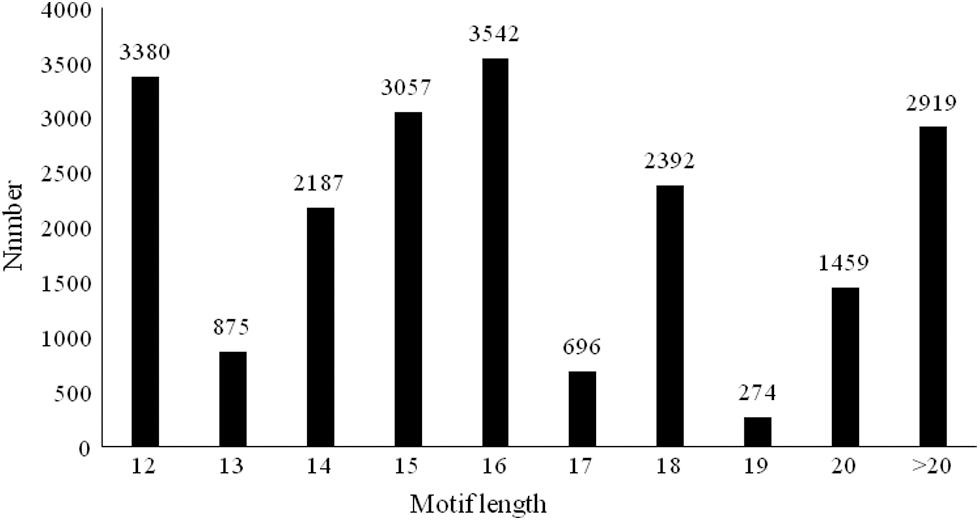
Figure 2: Length Distribution of SSRs motifs. The x-coordinate is the SSR motif length, and the y-coordinate is the number of SSRs with different motif lengths.
SSRs validation and principal coordinates analysis
A total of 14,593 primers were successfully designed for all these SSR loci. One hundred primers were randomly selected to chemically synthesize and conducted SSR-PCR amplification in 20 E. pleiosperma DNA samples, of which 79 could amplify the target bands.
To verify the polymorphism of these primers, 20 highly polymorphic loci were selected and analyzed by CERVUS 3.0 software. The detailed information of the 20 primers is shown in Table 3. Results showed the average allele of 20 SSR loci was 5.25, the observed heterozygosity ranged from 0.350 to 0.740, and the expected heterozygosity ranged from 0.541 to 0.875. In this study, the polymorphic information content (PIC) of the 20 polymorphic loci ranged from 0.463 to 0.848, with an average of 0.638 (Table 3). Among them, there were 18 highly polymorphic loci (PIC > 0.5), two moderately polymorphic loci (0.25 < PIC < 0.5), and the 20 SSR loci did not deviate from the Hardy-Weinberg equilibrium. In addition, the 20 polymorphic SSR loci were used to conduct PCoA analysis of 51 individuals of E. pleiosperma. The results showed that LY and DH populations tend to be clustered into one group because the distance between LY and DH populations is even closer (Fig. 3). Two coordinates explain 24.1% and 18.97% of the overall genetic variation, respectively. The results showed that the SSR markers could distinguish genetic differences among populations based on different geographical locations.
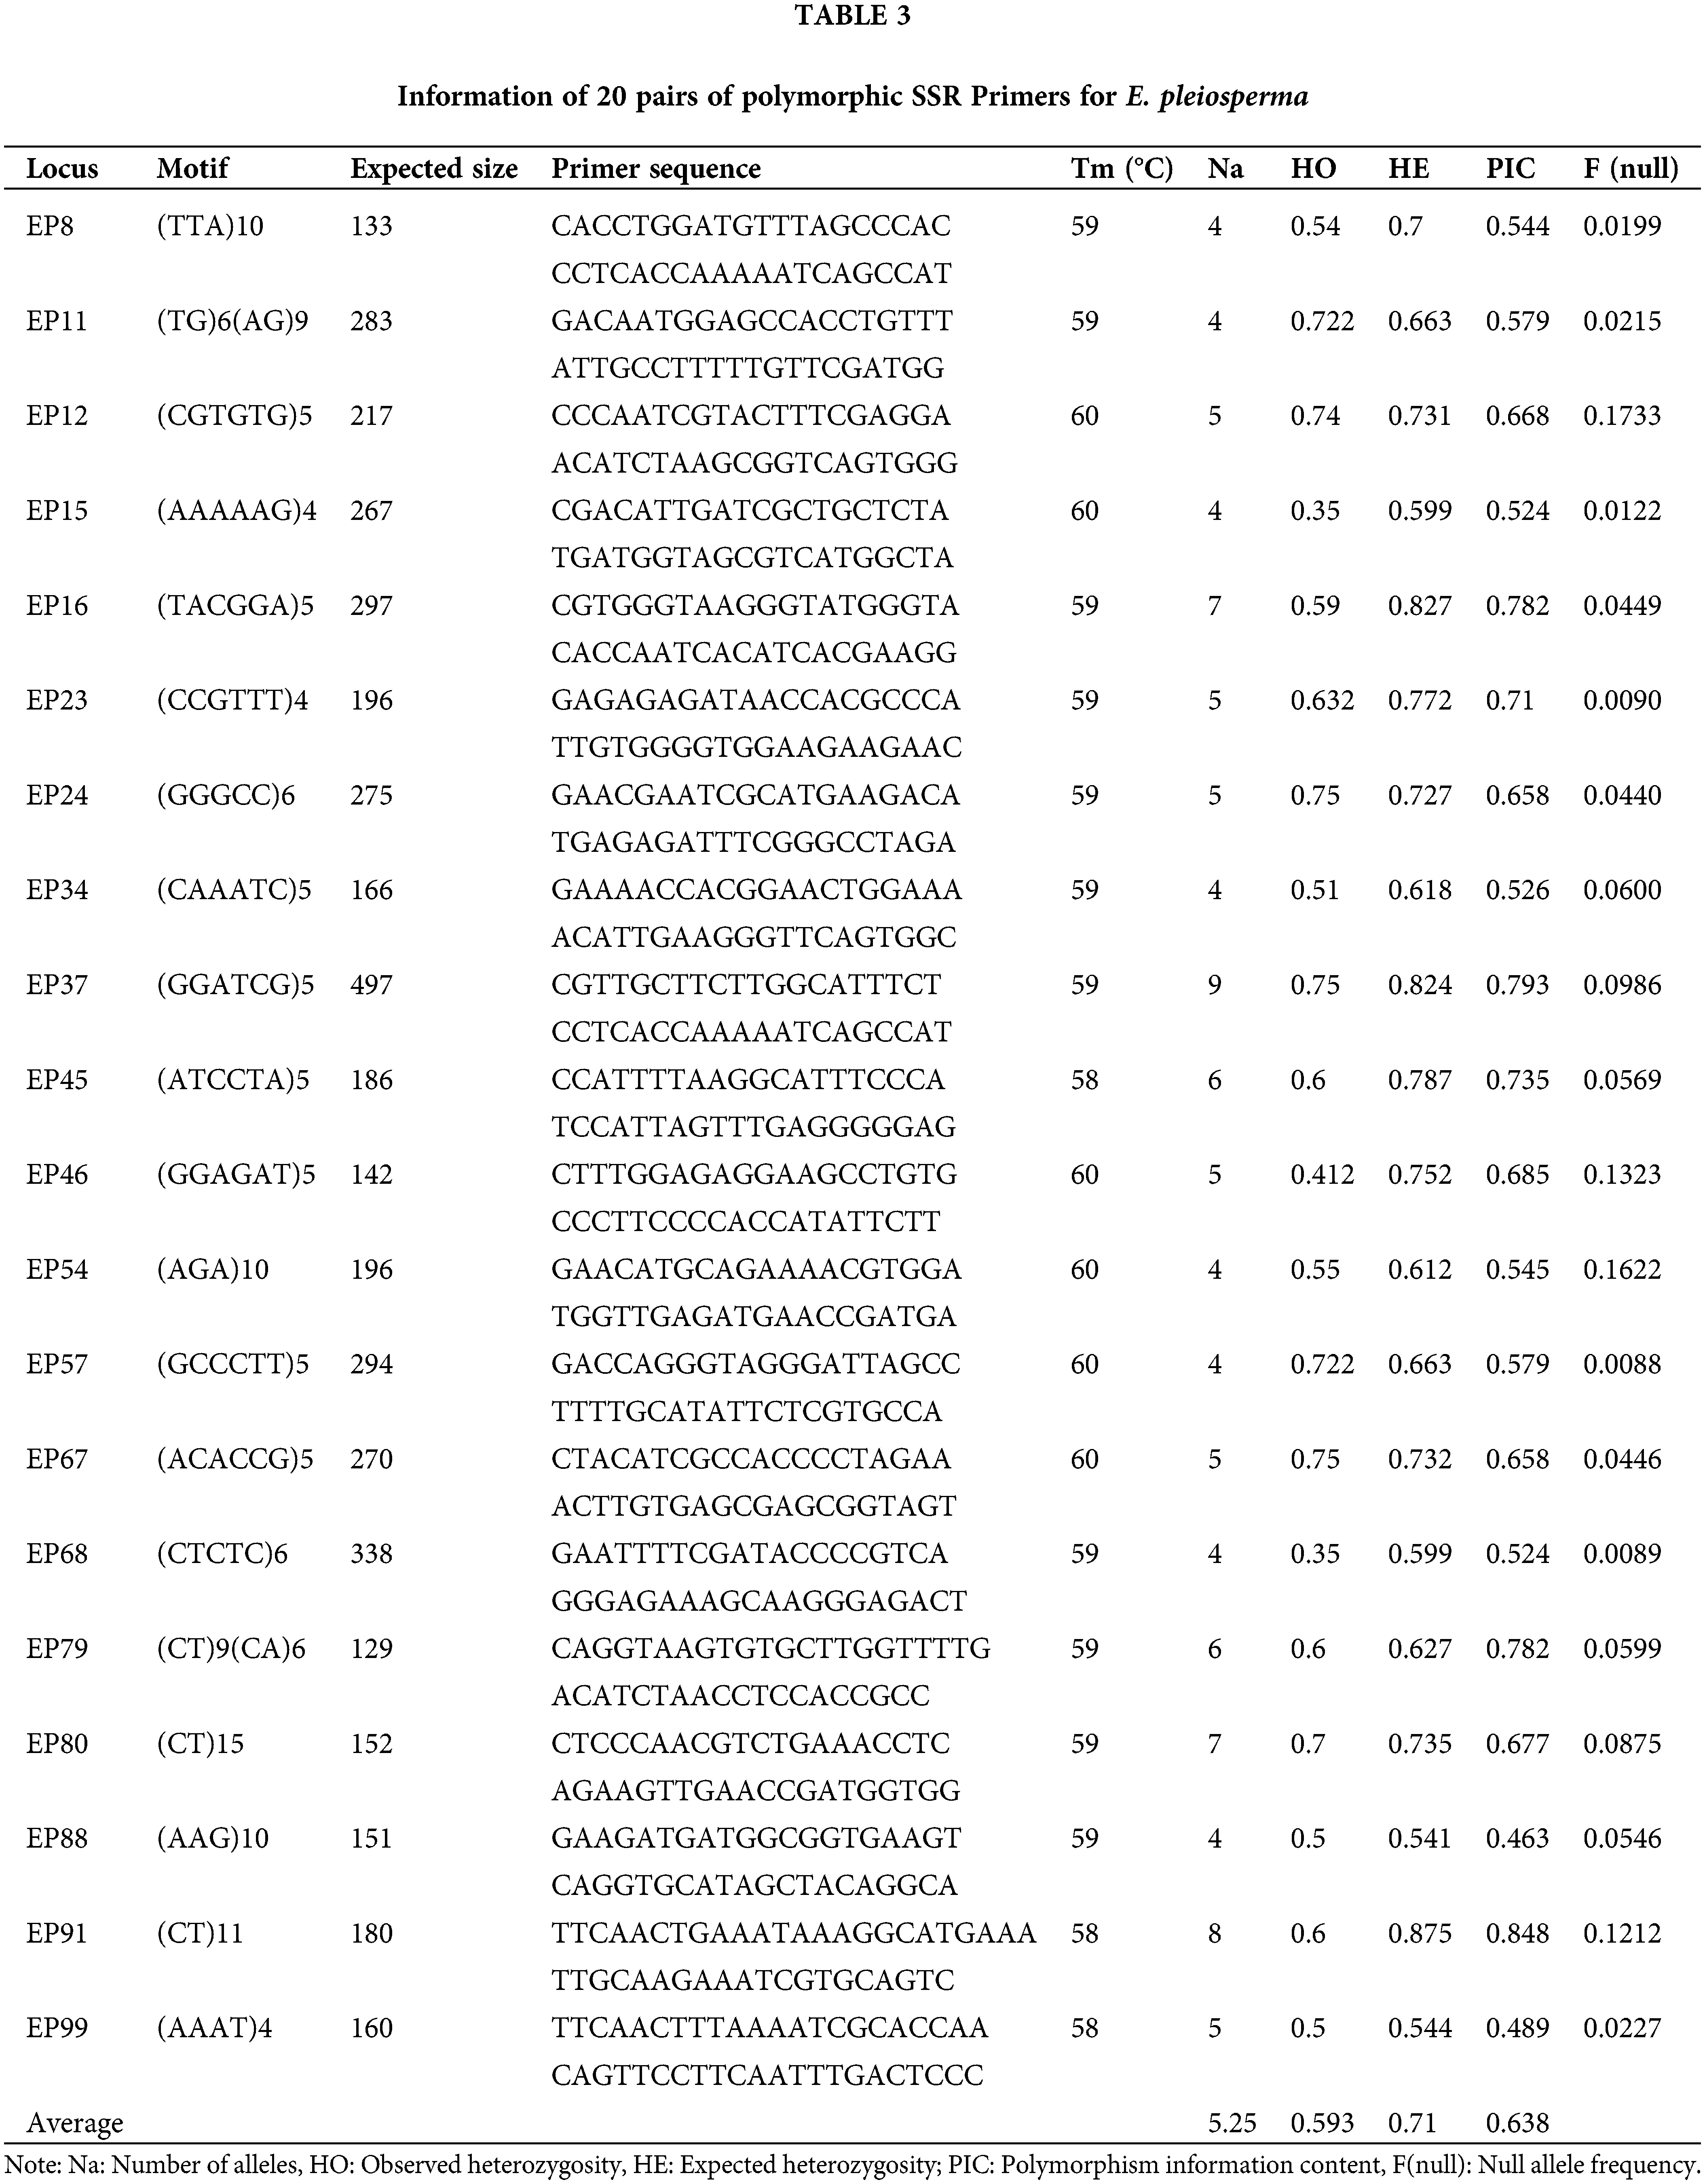
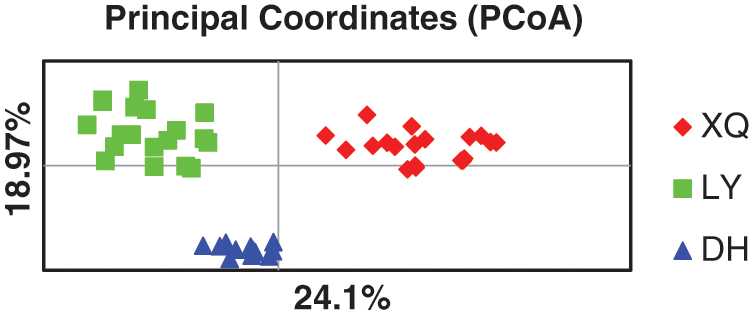
Figure 3: PCoA of genetic distance for the 51 individuals from the three populations sampled. Coordinate axis 1 explains 24.1% of the variation, coordinate axis 2 explains 18.97% of the variation.
RRS technology can obtain many tag sequences representing the genome of a species through high-throughput sequencing of part of the genome, which has the advantages of short experimental periods, high accuracy, and reliable results. RAD-Seq is one of the most used sequencing technologies. It has many advantages, such as simple operation, low experimental cost with high throughput, and has been widely used in many fields such as genome comparison, genetic analysis, and germplasm conservation (Basak et al., 2019). Due to the above advantages, RAD-Seq technology is an ideal method for SSR development and analysis for non-model plant E. pleiosperma.
In the present study, the distribution density of SSR in the genome of E. pleiosperma was similar to that of Camellia sinensis (1/3.55 kb), Piper nigrum (1/6.3 kb), Hibiscus esculentus (1/7.81 kb), and Chimonanthus praecox (1/5.00 kb) (Sharma et al., 2009; Kumari et al., 2019; Li et al., 2018; Li et al., 2013). Compared with cotton (1/20.8 kb), Sorghum bicolor (1/220 kb), and wheat (1/578 kb), the distribution frequency of SSR loci in E. pleiosperma was significantly higher (Liu et al., 2019; Yonemaru et al., 2009; Morgante et al., 2002). These differences may be due to the use of different sequencing methods, but they also reflect differences in the genomic characteristics of these species.
Among these E. pleiosperma SSR loci, the dinucleotide motif was the main repeat type, followed by the mononucleotide motif. This is like the situation for both genomes of palm trees and Dimocarpus longan, which are dominated by mono- and dinucleotide motifs (Manee et al., 2020; Hu et al., 2019). However, it differs from strawberry, Cicer arietinum, and Corchorus capsularis, which are dominated by di- and trinucleotide motifs repetition (Zorrilla-Fontanesi et al., 2011; Asadi et al., 2020; Yao et al., 2019). The AG/CT repeat motif is the most abundant one detected in the genome of E. pleiosperma, which is the same as Jatropha curcas, Toona sinensis, and Paeonia lactiflora (Yadav et al., 2011; Yu et al., 2019; Mercati and Sunseri, 2020).
Polymorphism of SSR loci is mainly caused by changes in the number of repeats of the motif, and the higher the number of repeats, the higher the potential for polymorphism (Marshall et al., 2002). In addition, SSRs with low polymorphism are usually less than 12 bp in length, SSRs greater than 12 bp and less than 20 bp in length are often moderate polymorphic, while SSRs with higher polymorphism are usually greater than 20 bp in length (Gao et al., 2003; Temnykh et al., 2001). The results indicate that the development of SSR markers for E. pleiosperma is feasible using the RAD-Seq approach, and all of the SSR loci developed in this study had above moderate polymorphism.
Takezaki and Nei (1996) suggested that the range of heterozygosity calculated from SSR was 0.3–0.8. Heterozygosity indicates the degree of individual genetic variation within a population, and high values indicate large variation. The expected heterozygosity (He) and observed heterozygosity (Ho) of the 20 polymorphic SSR loci in this study were generally consistent with the criteria proposed by Takezaki, except for some loci (EP16, EP37, and EP91). According to the polymorphic information content index proposed by Bostein et al. (1980) to measure the degree of gene variation, a locus is considered low polymorphic when PIC < 0.25, moderately polymorphic when 0.25 < PIC < 0.5, and highly polymorphic when PIC > 0.5. In this study, two loci (EP88 and EP99) have PIC values between 0.25 and 0.5, indicating that they are moderately polymorphic, whereas the other 18 loci have PIC values greater than 0.5, indicating that they are highly polymorphic.
Principal coordinates analysis (PCoA) is a powerful tool for assessing the genetic structure of a population. The results demonstrate that the polymorphic SSR markers developed in this study are effective in the genetic analysis of E. pleiosperma and lay the foundation for the effective conservation of this species.
This study used RAD-Seq to investigate the characteristics of E. pleiosperm SSR markers and the potential of developing polymorphic SSR markers. Analysis of SSR loci in the genome of E. pleiosperma indicated that most of these SSR loci have polymorphism potential. Primers developed from the important genetic resources were successfully utilized for genetic analysis in E. pleiosperma and revealed good heterozygosity and PIC values. Furthermore, 14,593 SSR primers that were designed in the present study will provide opportunities for examining the population structure of E. pleiosperma and contribute to the effective conservation of this species. The results obtained in this study demonstrate that RAD-seq can be used as an efficient method for E. pleiosperma SSR markers development and genetic research.
Authors Contribution: The authors confirm contribution to the paper as follows: study conception and design: X.J.Z.; analysis and interpretation of results: X.J.Z. and X.B.W.; draft manuscript preparation: X.J.Z. and X.Y.L. All authors reviewed the results and approved the final version of the manuscript.
Funding Statement: This work was supported by the National Natural Science Foundation of China (31870697).
Conflicts of Interest: The authors declare that they have no conflicts of interest to report regarding the present study.
Asadi A, Ebrahimi A, Rashidi-Monfared S, Basiri M, Akbari-Afjani J (2020). Comprehensive functional analysis and mapping of SSR markers in the chickpea genome (Cicer arietinum L.). Computational Biology and Chemistry 84: 107169. [Google Scholar]
Baird NA, Etter PD, Atwood TS, Currey MC, Shiver AL, Lewis ZA, Selker EU, Cresko WA, Johnson EA (2008). Rapid SNP discovery and genetic mapping using sequenced RAD markers. PLoS One 3: e3376. [Google Scholar]
Basak M, Uzun B, Yol E (2019). Genetic diversity and population structure of the Mediterranean sesame core collection with use of genome-wide SNPs developed by double digest RAD-Seq. PLoS One 14: e0223757. [Google Scholar]
Beier S, Thiel T, Münch T, Scholz U, Mascher M (2017). MISA-web: A web server for microsatellite prediction. Bioinformatics 33: 2583–2585. [Google Scholar]
Bostein D, Whrite RL, Skolnick M, Davis RW (1980). Construction of a genetic linkage map in man using restriction fragment length polymorphisms. American Journal of Human Genetics 32: 314–331. [Google Scholar]
Catchen JM, Amores A, Hohenlohe P, Cresko W, Postlethwait JH (2011). Stacks: Building and genotyping loci de novo from short-read sequences. G3-Genes Genome and Genetic 1: 171–182. [Google Scholar]
Chen KH, Luo Q, Xie YG (2007). Euptelea pleiosperma community characteristics of Dafang karst area in Guizhou Southwest China. Journal of Wuhan Botanica Research 25: 515–520. [Google Scholar]
Choquet M (2021). Customize and get the most out of your reduced-representation sequencing experiment with the new simulation software RADinitio. Molecular Ecology Resources 21: 351–354. [Google Scholar]
Eaton DAR, Spriggs EL, Park B, Donoghue MJ (2017). Misconceptions on missing data in RAD-seq phylogenetics with a deep-scale example from flowering plants. Systematic Biology 66: 399–412. [Google Scholar]
Etter PD, Preston JL, Bassham S, Cresko WA, Johnson EA (2011). Local de novo assembly of RAD paired-end contigs using short sequencing reads. PLoS One 6: e18561. [Google Scholar]
Feng J, Zhao S, Li M, Zhang C, Qu H, Li Q, Li J, Lin Y, Pu Z (2020). Genome-wide genetic diversity detection and population structure analysis in sweetpotato (Ipomoea batatas) using RAD-seq. Genomics 112: 1978–1987. [Google Scholar]
Fu DZ, Peter KE (2001). Eupteleaceae. In: Flora of China. Beijing: Science Press. [Google Scholar]
Gao L, Tang J, Li H, Jia J (2003). Analysis of microsatellites in major crops assessed by computational and experimental approaches. Molecular Breeding 12: 245–261. [Google Scholar]
Gonen S, Lowe NR, Cezard T, Gharbi K, Bishop SC, Houston RD (2014). Linkage maps of the Atlantic salmon (Salmo salar) genome derived from RAD sequencing. BMC Genomics 15: 116. [Google Scholar]
Hu WS, Chen XP, Zheng SQ (2019). EST-SSR markers developed from Dimocarpus longan and their application in genetic diversity analysis of five genera of Sapindaceae. Acta Horticulturae Sinica 46: 1359–1372. [Google Scholar]
Karbstein K, Tomasello S, Prinz K (2019). Desert-like badlands and surrounding (semi-) dry grasslands of Central Germany promote small-scale phenotypic and genetic differentiation in Thymus praecox. Ecology and Evolution 9: 14066–14084. [Google Scholar]
Kumari R, Wankhede DP, Bajpai A, Maurya A, Prasad K et al. (2019). Genome wide identification and characterization of microsatellite markers in black pepper (Piper nigrumA valuable resource for boosting genomics applications. PLoS One 14: e0226002. [Google Scholar]
Li X, Yang N, Zhao KG, Chen YX (2013). Development and primer selection of EST-SSR molecular markers based on transcriptome sequencing of Chimonanthus praecox. Journal of Beijing Forestry University 35: 25–32. [Google Scholar]
Li YP, Liu JT, Chen MD, Zhang QR, Zhu HS, Wen QF (2018). SSR markers excavation and germplasm analysis using the transcriptome information of Hibiscus esculentus. Acta Horticulturae Sinica 45: 579–590. [Google Scholar]
Liu C, Dang JB, Wang LL, Chen Z, Wang Y, Li GR, Liang GL (2018). Segregation correlation of SSR markers and flower traits in aneuploid tobacco. World Journal of Engineering and Technology 6: 225–240. [Google Scholar]
Liu DM, Lou XY, Wu D, Yong Y, Pei DL (2019). Development of SSR molecular markers based on cotton transcriptome sequencing. Jiangsu Agricultural Sciences 47: 32–35. [Google Scholar]
Manee MM, Al-Shomrani BM, Al-Fageeh MB (2020). Genome-wide characterization of simple sequence repeats in Palmae genomes. Genes & Genomics 42: 597–608. [Google Scholar]
Marshall HD, Newton C, Ritland K (2002). Chloroplast phylogeography and evolution of highly polymorphic microsatellites in lodgepole pine (Pinus contorta). Theoretical and Applied Genetics 104: 367–378. [Google Scholar]
Mercati F, Sunseri F (2020). Genetic diversity assessment and marker-assisted selection in crops. Genes 11: 1481. [Google Scholar]
Miller MR, Dunham JP, Amores A, Cresko WA, Johnson EA (2007). Rapid and cost-effective polymorphism identification and genotyping using restriction site associated DNA (RAD) markers. Genome Research 17: 240–248. [Google Scholar]
Morgante M, Hanafey M, Powell W (2002). Microsatellites are preferentially associated with nonrepetitive DNA in plant genomes. Nature Genetics 30: 194–200. [Google Scholar]
Qi M, Zhou Q, Ni ZX, Wu YQ, Han X, Xu LA (2019). Genetic structure analysis of ancient Ginkgo biloba L. populations based on SSR markers. Chinese Journal of Ecology 38: 2902–2910. [Google Scholar]
Sharma RK, Bhardwaj P, Negi R, Mohapatra T, Ahuja PS (2009). Identification, characterization and utilization of unigene derived microsatellite markers in tea (Camellia sinensis L.). BMC Plant Biology 9: 1–24. [Google Scholar]
Sun W (2018). Euptelea pleiosperma (amended version of 1998 assessment). The IUCN Red List of Threatened Species 2018: e.T32403A128670575. [Google Scholar]
Takezaki N, Nei M (1996). Genetic distance and reconstruction of phylogenetic trees from microsatellite DNA. Genetics 144: 389–399. [Google Scholar]
Temnykh S, DeClerck G, Lukashova A, Lipovich L, Cartinhour S, McCouch S (2001). Computational and experimental analysis of microsatellites in rice (Oryzasativa L.Frequency, length variation, transposon associations, and genetic marker potential. Genome Research 11: 1441–1452. [Google Scholar]
Tsujimoto M, Araki KS, Honjo MN, Yasugi M, Nagano AJ et al. (2020). Genet assignment and population structure analysis in a clonal forest-floor herb, Cardamine leucantha, using RAD-seq. AoB Plants 12: plz080. [Google Scholar]
Untergasser A, Cutcutache I, Koressaar T, Ye J, Faircloth BC, Remm M, Rozen SG (2012). Primer3- new capabilities and interfaces. Nucleic Acids Research 40: e115. [Google Scholar]
Varshney RK, Graner A, Sorrells ME (2005). Genic microsatellite markers in plants: Features and applications. TRENDS in Biotechnology 23: 48–55. [Google Scholar]
Victoria FC, Maia LC, Oliveira AC (2011). In silico comparative analysis of SSR markers in plants. BMC Plant Biology 11: 1–15. [Google Scholar]
Wang F, He P, Zhang YF (2014). Genetic diversity analysis in Euptelea pleiospermum. Journal Southwest University 36: 70–74. [Google Scholar]
Wang F, He P, Zhang YF (2015). Coenoecological research of Euptelea pleiospermum—An endangered plant species. Journal Southwest University 37: 65–70. [Google Scholar]
Wang L, Qin J (2011). Diameter class structure and sprouting characteristics of a northernmost Euptelea pleiosperma population in China: Implications for conservation. Acta Ecologica Sinica 31: 103–107. [Google Scholar]
Wang S, Xie Y (2004). China species red list. Beijing: Higher Education Press. [Google Scholar]
Willing EM, Hoffmann M, Klein JD, Weigel D, Dreyer C (2011). Paired-end RAD-seq for de novo assembly and marker design without available reference. Bioinformatics 27: 2187–2193. [Google Scholar]
Wu Q, Zhang F, Zhang JH, Wu YZ (2020). Genetic diversity of natural population in an endangered plant species Euptelea pleiosperma Hook. f. et Thoms. based on SCoT markers. Northern Horticulture 13: 77–82. [Google Scholar]
Yadav HK, Ranjan A, Asif MH, Mantri S, Sawant SV, Tuli R (2011). EST-derived SSR markers in Jatropha curcas L.: Development, characterization, polymorphism, and transferability across the species/genera. Tree Genetics & Genomes 7: 207–219. [Google Scholar]
Yan QQ, Guo X, Hou YL, Xie F, Yang F, Wei HL, Zhao D (2020). Study on annual growth dynamics of one-year-old seedings of Euptelea pleiosperma. Journal of Temperate Forestry Research 3: 50–54. [Google Scholar]
Yao JY, Zhang LW, Zhao J, Xu Y, Qi JM, Zhang LM (2019). Evaluation and characteristic analysis of SSRs from the whole genome of jute (Corchorus capsularis). Acta Agronomica Sinica 45: 10–17. [Google Scholar]
Yonemaru J, Ando T, Mizubayashi T, Kasuga S, Matsumoto T, Yano M (2009). Development of genome-wide simple sequence repeat markers using whole-genome shotgun sequences of sorghum (Sorghum bicolor (L.) moench). DNA Research 16: 187–193. [Google Scholar]
Yu PF, Sun XJ, Li CC, Zhang X, Zheng W, Liu C (2019). Chromosome karyotype analysis and development of SSR molecular markers in Toona sinensis. Acta Horticulturae Sinica 46: 1172–1182. [Google Scholar]
Zhang H, Zhang M, Tan J, Huang S, Zhou G, Chen X (2021). Transcriptome based high-throughput SSRs and SNPs discovery in the medicinal plant Lagenaria siceraria. Biocell 45: 371–386. [Google Scholar]
Zhang LL, Li YX, Wei XY, Xu H (2016). Chemical constituents from twigs of Euptelea pleiospermum. Journal of Tropical and Subtropical Botany 24: 228–232. [Google Scholar]
Zhou XJ, Wang YY, Xu YN, Yan RS, Zhao P, Liu WZ (2015). De novo characterization of flower bud transcriptomes and the development of EST-SSR markers for the endangered tree Tapiscia sinensis. International Journal of Molecular Sciences 16: 12855–12870. [Google Scholar]
Zorrilla-Fontanesi Y, Cabeza A, Torres AM, Botella MA, Valpuesta V, Monfort A, Sánchez-Sevilla JF, Amaya I (2011). Development and bin mapping of strawberry genic-SSRs in diploid Fragaria and their transferability across the Rosoideae subfamily. Molecular Breeding 27: 137–156. [Google Scholar]
 | This work is licensed under a Creative Commons Attribution 4.0 International License, which permits unrestricted use, distribution, and reproduction in any medium, provided the original work is properly cited. |