DOI:10.32604/biocell.2022.020389
| BIOCELL DOI:10.32604/biocell.2022.020389 | |
| Article |
Comprehensive analysis reveals an arachidonic acid metabolism-related gene signature in patients with pancreatic ductal adenocarcinoma
1Department of Gastroenterology, West China School of Public Health and West China Fourth Hospital, Sichuan University, Chengdu, 610041, China
2Department of Gastroenterology, West China Hospital of Sichuan University, Chengdu, 610041, China
*Address correspondence to: Chunhui Wang, wangch@scu.edu.cn
Received: 20 November 2021; Accepted: 10 March 2022
Abstract: Pancreatic ductal adenocarcinoma (PDAC) is highly heterogeneous, making its prognosis prediction difficult. The arachidonic acid (AA) cascade is involved in carcinogenesis. Therefore, the metabolic enzymes of the AA cascade consist of lipoxygenases (LOXs), phospholipase A2s (PLA2s), and cyclooxygenases (COXs) along with their metabolic products, including leukotrienes. Nevertheless, the prognostic potential of AA metabolism-associated PDAC has not been explored. Herein, the mRNA expression patterns and the matching clinical information of individuals with PDAC were abstracted from online data resources. We employed the LASSO Cox regression model to develop a multigene clinical signature in the TCGA queue. The GEO queue and the ICGC queue were employed as the validation queue. There was differential expression of a significant number of AA metabolism-associated genes (56.8%) between PDAC and neighboring nonmalignant tissues in the TCGA queue. Univariate Cox regression demonstrated that 13 of the differentially expressed genes (DEGs) were linked to overall survival (OS) (p < 0.05). A 6-gene clinical signature was developed for stratifying the PDAC patients into two risk groups, with the high-risk group patients exhibiting remarkably lower OS than the low-risk group patients (p < 0.001 in the TCGA data set and the ICGC queue, and p = 0.001 in the GEO data set). The multivariate Cox data revealed the risk score as an independent OS predictor (HR > 1, p < 0.01). The receiver operating characteristic (ROC) curve verified the predictive potential of our signature. The expression and alteration of the six genes in PDAC were also validated using online databases. Functional analyses demonstrated that immune-linked cascades were enriched, and the immune status was remarkably different between the high- and low-risk groups. In summary, an AA metabolism-associated clinical gene signature can be applied for prognostic estimation in PDAC.
Keywords: Arachidonic acid metabolism; Gene signature; Pancreatic ductal adenocarcinoma; Overall survival; Immune status
Abbreviations
| PDAC: | pancreatic ductal adenocarcinoma |
| AA: | arachidonic acid |
| CEA: | carcinoembryonic antigen |
| CA199: | carbohydrate antigen 199 |
| COX: | cyclooxygenases |
| LOX: | lipoxygenase |
| HETE: | hydroxy eicosatetraenoic acid |
| EETs: | epoxygenated fatty acids |
| GO: | gene ontology |
| KEGG: | kyoto encyclopedia of genes and genomes |
| Sages: | single-sample gene set enrichment analysis |
| GITEX: | genotype-tissue expression |
| FDR: | false discovery rate |
| GSEA: | gene set enrichment analysis |
| DEGs: | differential genes |
| PLA2G4A: | phospholipase A2, group IVA |
| ALOX5: | arachidonate 5-lipoxygenase |
| EPHX2: | epoxide hydrolase 2, cytoplasmic |
| PPI: | protein interaction networks |
| CYP2C18: | cytochromeP450, family2, subfamily C, polypeptide 18 |
| GPX4: | glutathione peroxidase 4 |
| LTC4S: | leukotriene C4 synthase |
| PTGES: | prostaglandin E synthase |
| PTGS2: | prostaglandin-endoperoxide synthase 2 |
| LTC4S: | leukotriene C4 synthase |
| TIL: | tumor infiltrating lymphocytes |
| NK: | natural killer cells |
Pancreatic ductal adenocarcinoma (PDAC) is still a deadly cancer and is estimated to become the 2nd leading cause of cancer mortality in the USA in the next 20 to 30 years. The five-year survival period at diagnosis is 10% in the USA, as an estimated 80%–85% of patients manifest with either metastatic or unresectable disease. (Nieves and Moreno, 2007; Xu et al., 2011; Esser-von Bieren, 2017; Siegel et al., 2020). It is the 7th principle cause of cancer fatalities in both women and men globally and is responsible for approximately 459,000 new cases and 432,000 deaths, as per the GLOBOCAN 2018 estimates (Bray et al., 2018). The improvable risk factors linked to the onset of PDAC consist of obesity, tobacco use, and type 2 diabetes (Mizrahi et al., 2020a). The known tumor biomarkers CEA (carcinoembryonic antigen) and CA199 (carbohydrate antigen 199) have low sensitivity and specificity for the diagnosis of PDAC and can only be used to evaluate the progression of patients with confirmed disease (van Manen et al., 2020). Surgical treatment, interventional treatment and adjuvant chemoradiotherapy are the main treatment methods for PDAC patients at present (Zhou et al., 2012; Mizrahi et al., 2020a). Among them, surgical resection is the only way to cure PDAC at present (Oba et al., 2020). However, due to the difficulties in the early diagnosis of PDAC combined with the rapid progression and metastasis of the disease, approximately 80% of patients with PDAC initially diagnosed have metastasis, and only 15%–20% of patients can undergo radical surgery (Hackert et al., 2015; Oba et al., 2020). Therefore, even after decades of efforts, the five-year rate of survival of PDAC patients is still less than 7% (Mizrahi et al., 2020b; Siegel et al., 2020). In-depth exploration of the potential mechanism of PDAC occurrence and progression, discovery of specific prognostic and early diagnostic markers, development of potential therapeutic targets, prevention of recurrence and metastasis of PDAC, and selection of different targeted drugs and treatment options according to the molecular classification of PDAC are the keys to early diagnosis of PDAC and to improving the prognosis of patients.
The metabolism of arachidonic acid (AA) proceeds via three distinct cascades, namely, the COX (cyclooxygenases) axis to generate prostaglandins along with thromboxanes, the LOX (lipoxygenase) cascade generating leukotrienes and HETEs (hydroxyeicosatetraenoic acid), and the cytochrome P450 axis to generate EETs (epoxygenated fatty acids) and HETEs. These arachidonic acid metabolites are collectively referred to as eicosanoids (Smith, 1989). This family of biomolecules has been documented to participate in almost all biological processes constituting proliferation, migration, differentiation, and infiltration (Baker, 1990). For many years, the function of eicosanoids in cancer has been investigated (Young, 1994; Wang and Dubois, 2010; Johnson et al., 2020). HETEs ((Moreno, 2003; Nieves and Moreno, 2007; Moreno, 2009) and EETs (Nieves and Moreno, 2007) are involved in the control of cell growth/cell cycle/apoptosis. PGE2 exhibits many biological effects that can be involved in cancer development, such as effects on the cell cycle/apoptosis (Wang and DuBois, 2018). Recent research evidence suggests that PGE2 exhibits immunosuppressive effects, which renewed research interest focused on targeting this cascade. In PDAC, the activation of COX-2, mediated through ephrin A receptor 2, results in tumors in which T cells are primarily excluded (Devchand et al., 1996; Markosyan et al., 2019). The overexpression of cytoplasmic phospholipase A2 (PLA2), PGS2, PTGES, and PTGES-2 in most human PDACs compared with matched normal pancreases. (Hasan et al., 2008), many genes have similarly been identified as regulators or biomarkers of AA metabolism. Previous investigations have documented that AA metabolism has a pivotal role in prostate cancer, and some genes, e.g., LTA4H rs1978331, are inversely related to prostate cancer risk overall. PTGES2 rs10987883 was linked to an elevated risk of prostate cancer (Amirian et al., 2011). Nevertheless, whether these AA metabolism-linked genes are associated with PDAC patient prognosis has not been examined.
Herein, we first downloaded the PDAC mRNA data set and clinical information from TCGA data. Then, we created a multigene prognostic clinical signature of AA metabolism-associated differentially expressed genes (DEGs) in the TCGA data set and verified it in the GEO and ICGC data sets. Furthermore, we conducted functional enrichment analyses to elucidate the responsible mechanisms.
Data selection (GEO-PAAD, TCGA-PAAD, ICGC and AA metabolism-related genes)
The mRNA data along with the clinical data of individuals with PDAC were abstracted from the TCGA data resource up to November 15, 2020 (https://portal.gdc.cancer.gov/repository). There were 178 PDAC tumor specimens and 4 nonmalignant tissue specimens. The standardized gene expression data of the TCGA-PAAD data set were log2 transformed for further analysis. On the other hand, the RNA-seq data sets of 167 nonmalignant pancreas tissues were abstracted from GTEx (Genotype-Tissue Expression). The TCGA biolinks R package was used to normalize the RNA-seq data sets of count values from both the TCGA and GTEx data resources (Mounir et al., 2019).
Then, we downloaded GSE71729 and GSE62452 data sets from the GEO database. The GSE71729 data set consists of 17-cell lines, 145 primary as well as 61 metastatic PDAC tumors, 46 pancreas and 88 distant site neighboring nonmalignant samples. We only selected 145 primary pancreatic tumors and 46 normal pancreases for further study. The GSE62452 data sets consist of 69 primary pancreatic tumors and 61 neighboring nonmalignant tissues from individuals with pancreatic ductal adenocarcinoma. First, all the samples from the two queues were integrated to remarkably improve the number of samples (107 nonmalignant samples relative to 214 tumor samples) to increase the reliability of our results.
We also downloaded the ICGC-PAAD-AU data set (https://dcc.icgc.org/releases), including 242 samples. We extracted only samples containing primary solid tumors and clinical information for further analysis. Finally, we enrolled 91 PDAC patients.
Finally, we downloaded AA metabolism-related genes in the KEGG pathway from GSEA (http://www.gseamsigdb.org/gsea/msigdb/cards/KEGG_ARACHIDONIC_ACID_METABOLISM), and the overlapping arachidonic acid metabolism-linked genes were determined from TCGA and GEO gene expression profiles. Supplementary Table S1 shows the AA metabolism-related genes.
Development and verification of the prognostic AA metabolism-associated gene signature
The R “limma” package was employed to determine the DEGs between the tumor variables. We performed Cox analyses of OS (overall survival) to determine the AA metabolism-associated genes with prognostic potential. Afterwards, the STRING data resource V.11.0 was applied to develop an interaction network of the prognostic DEGs (Szklarczyk et al., 2011). To minimize the overfitting risk, LASSO-penalized Cox regression assessment was conducted to develop a clinical prediction model (Tibshirani, 1997; Simon et al., 2011). The LASSO algorithm was employed to select variables and shrink them using the “glmnet” R package. The normalized expression matrix of candidate prognostic DEGs was the independent variable for regression, while the patients’ OS and status in the TCGA data set were the response variables. Tenfold cross validation was performed to determine the penalization parameter (λ) for clinical prediction models based on the minimum criterion (i.e., the value of λ matching the lowest partial probability deviation). The patients’ risk scores were determined on the basis of the normalized expression level of every gene and its matching regression coefficients. We developed the formula as follows: score = esum (each gene’s expression × matching coefficient). According to the median value of the risk score, patients were divided into high-risk and low-risk groups. The ‘prcomp’ function of the ‘stats’ R package was used to perform PCA based on the expression of genes in clinical features. Moreover, the R “Rtsne” package was applied to perform t-SNE to examine the scatters of different groups. In the survival analysis of every gene, the “surv_cutpoint” function of the R “survminer” package was employed to establish the optimal cutoff expression value. The R “survivalROC” package was applied to perform time-dependent ROC curve assessment to explore the estimation potential of our clinical gene signature (Yao et al., 2021).
Validation of six genes in pancreatic cancer using online databases.
We further validated the signature genes using online databases. The mRNA expression levels were validated using GEPIA (http://gepia.cancer-pku.cn/)) and the Oncomine database (http://www.oncomine.org/). The cBioPortal for Cancer Genomics (http://www.cbioportal.org/) was used to analyze the known genetic alterations of the signature genes. The Human Protein Atlas database (http://www.proteinatlas.org/) was used to validate the protein expression levels associated with the signature genes.
Functional enrichment analysis
We used GSEA 2.0 to explore the potential mechanisms of the AA-related gene signature. We separated the samples from the TCGA data set into high- and low-risk groups. We then applied Java GSEA v3.0 to the Molecular Signatures Database v6.2 to identify enriched KEGG pathways related to poor survival in the high-risk group. FDR < 0.05 with |NES| > 1 was regarded as significantly enriched. ssGSEA (single-sample gene set enrichment analysis) in the R “gsva” package was employed to compute the infiltrating score of 16 immune cells, as well as the activity of 13 immune-associated cascades (Rooney et al., 2015). Supplementary Table S2 shows the annotated gene set file.
Student’s t test was used to compare gene expression between tumor tissues and adjacent nonmalignant tissues. The chi square test was used to compare the difference in proportions. The ssgsea scores of immune cells or cascades between the high- and low-risk groups were compared with the Mann–Whitney test, and p values were corrected with the BH method. Kaplan–Meier analysis and the log rank test were used to compare OS between different groups. Univariate and multivariate quantitative Cox regression analyses were performed to identify independent predictors of OS. Statistical analysis was performed with R software (v3.5.3) or SPSS (v23.0). If not specified above, p < 0.05 indicated statistical significance, and all P values were two tailed.
Fig. 1 shows the flow chart of this study. Overall, 166 PDAC patients from the TCGA-PAAD data set, 188 PDAC patients from the GEO data set, and 91 PDAC patients from the ICGC data set were finally recruited. The clinical characteristics of these patients are summarized in detail in Table 1.
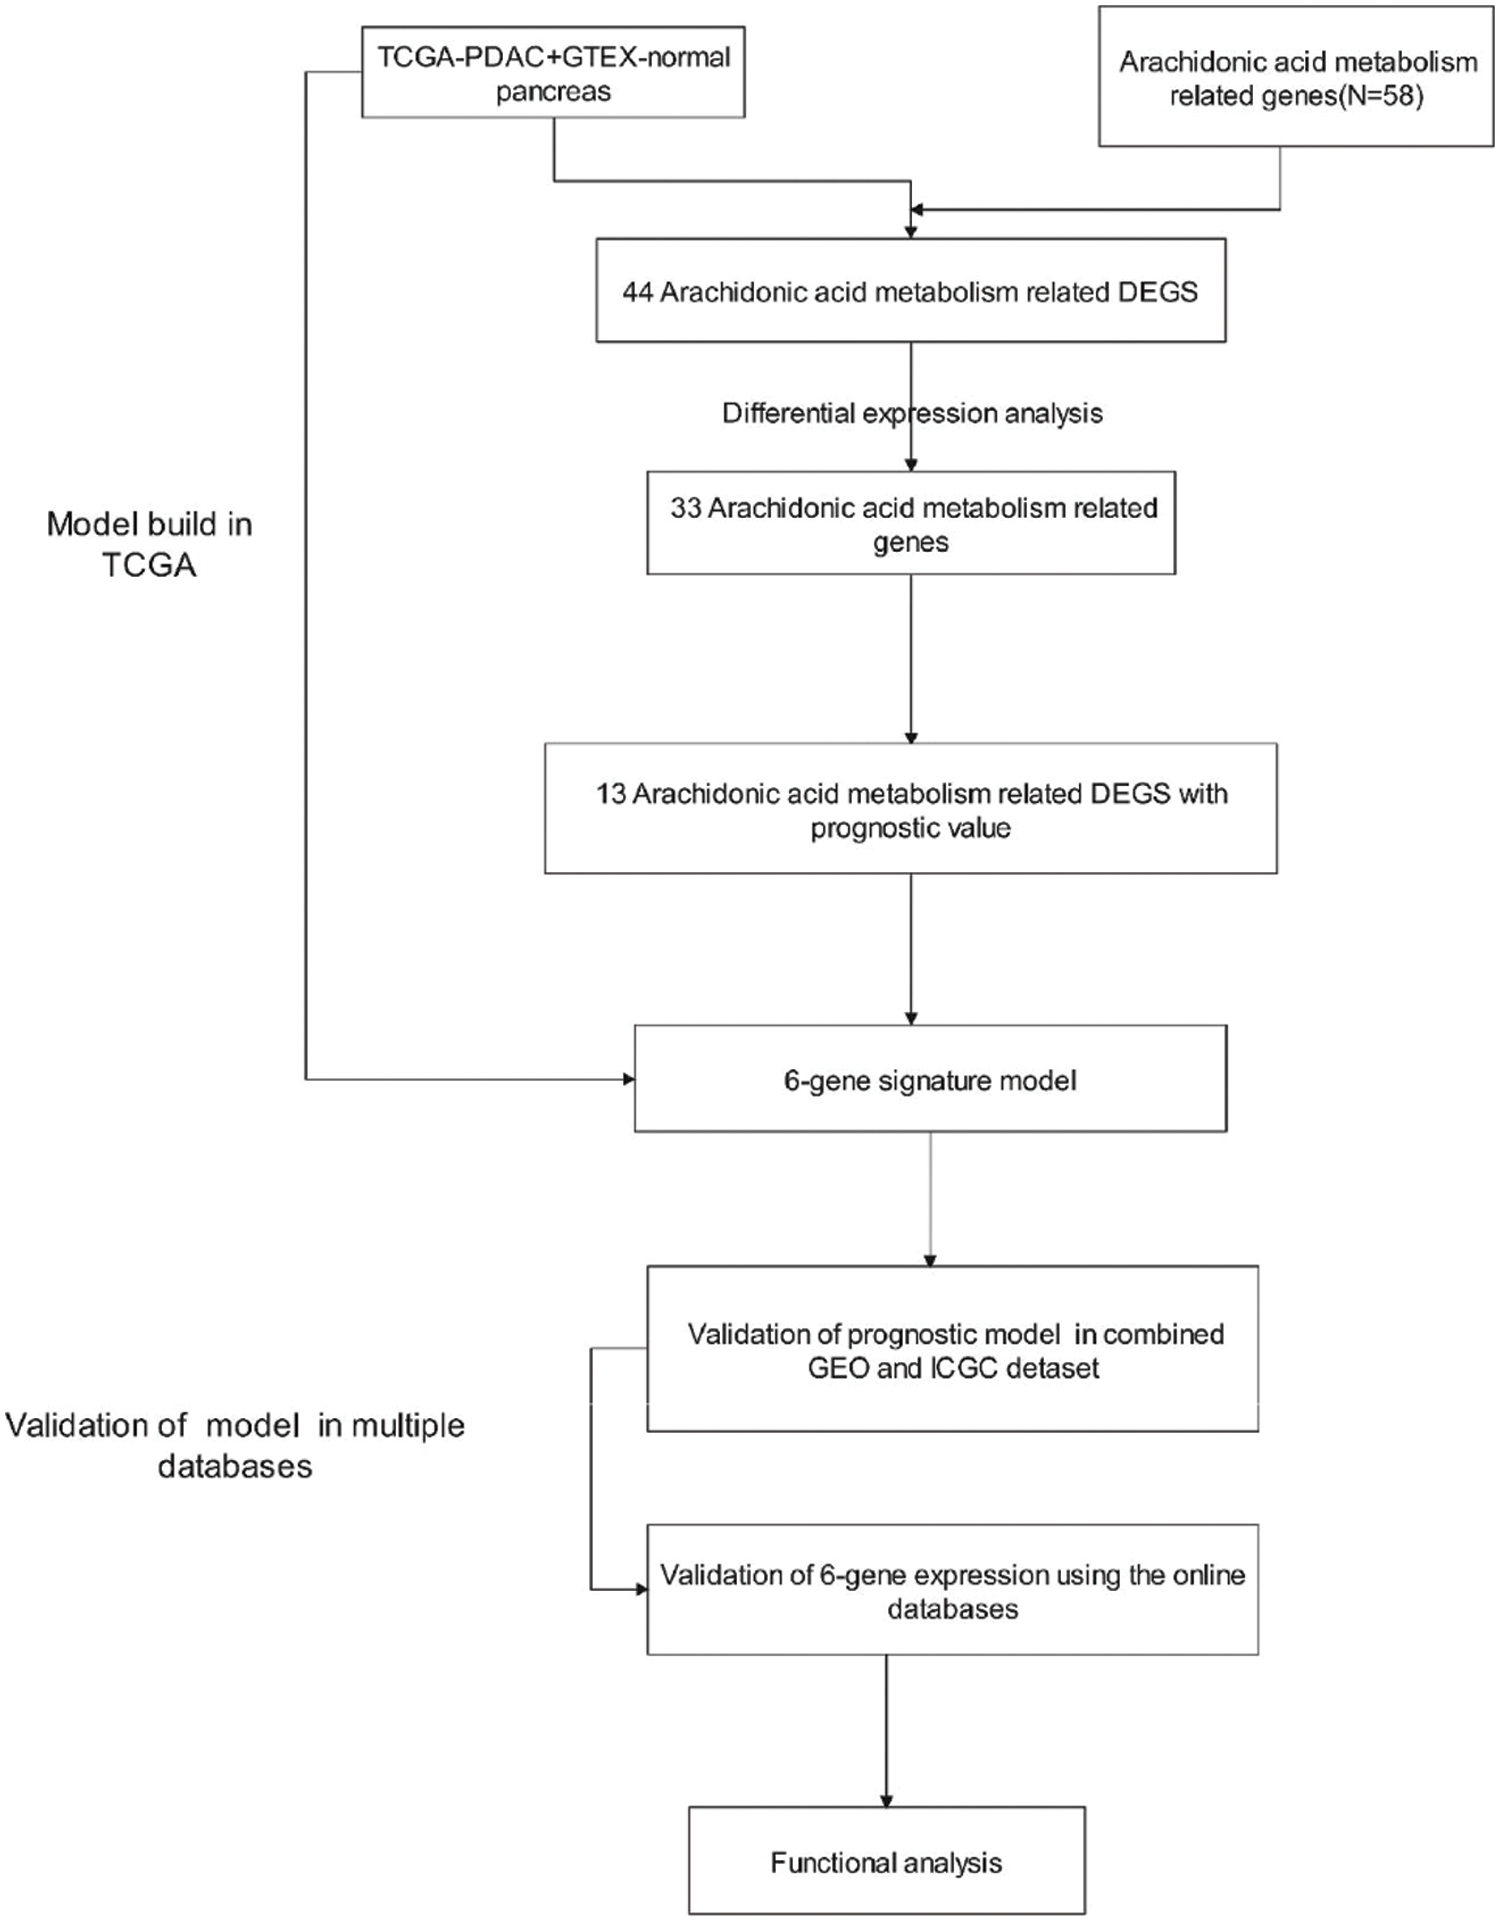
Figure 1: Flow chart of data collection and analysis.

TCGA data set filter differential AA metabolism-related genes
AA metabolism-related genes (n = 58) were identified from the online website GSEA, and overlapping arachidonic acid metabolism-related genes (n = 44, 75.9%) were identified from the TCGA gene expression profile (Supplementary Table S3). Most of the arachidonic acid metabolism-related genes (33/58, 56.8%) were expressed differently between tumor tissues and nonmalignant tissues (Fig. 2A), and 13 of them were linked to OS according to the univariate Cox regression assessment (Fig. 2B). Overall, 13 prognostic AA metabolism-linked DEGs were preserved (all p < 0.05, Fig. 2B). The interaction network among these genes revealed PLA2G4A, ALOX5 and EPHX2 as the hub genes (Fig. 2C). Fig. 2D indicates the relationship between these genes.
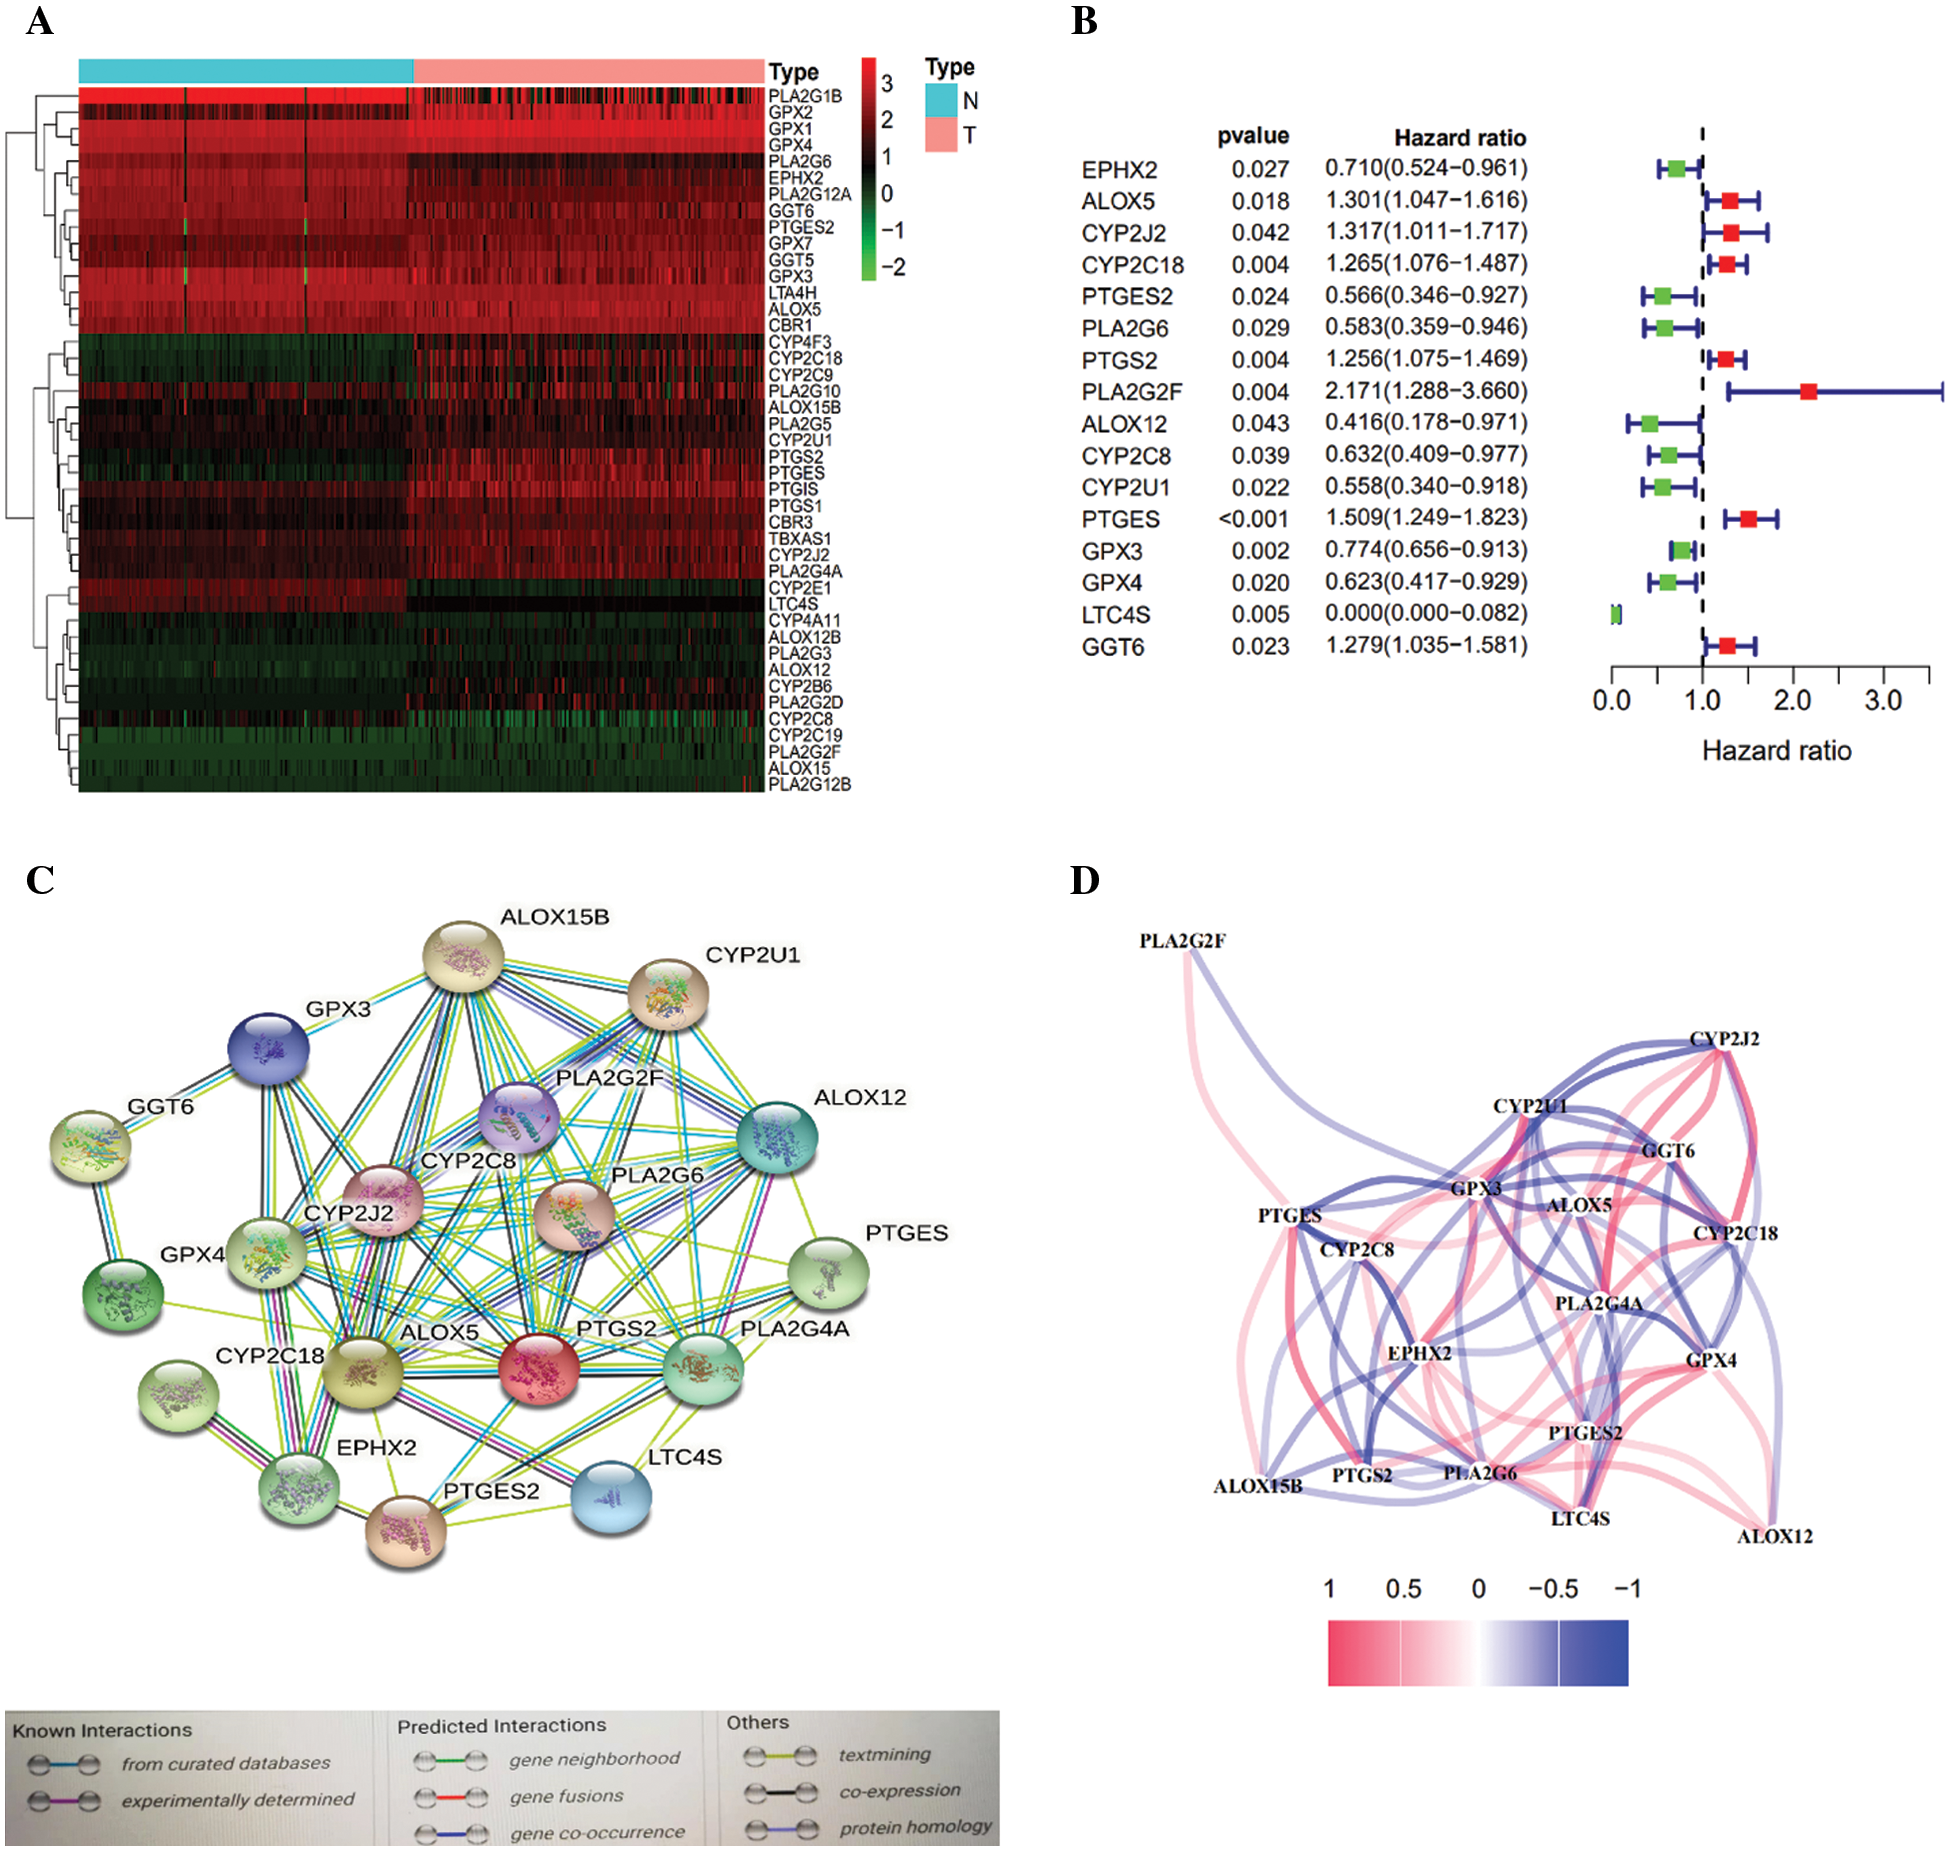
Figure 2: Identification of AA metabolism-related genes in the TCGA-PDAC queue. A. Heatmap of AA-related differentially expressed genes (DEGs) in the TCGA-PDAC queue. B. Forest plots exhibiting the prognostic value of AA metabolism-related genes. C. The PPI network of the candidate genes. D. The correlation network of differentially expressed genes.
Development and validation of a clinical prediction model in the TCGA data set
LASSO Cox regression assessment was employed to develop a clinical prediction model on the basis of the expression pattern of 13 genes identified above. The risk score was computed using the formula (0.50 * expression level of CYP2C18 + 0.220 * expression level of PTGS2 + 0.192 * expression level of PLA2G2F + 0.350 * expression level of PTGES + (–0.053) * expression level of GPX4 + (–0.987) * expression level of LTC4S). On the basis of the median cutoff value, the patients were clustered into either the high- (n = 84) or low-risk group (n = 82) (Fig. 3A). Patients with high risk were highly likely to die earlier than those with low risk (Fig. 3B). Consistently, PCA and t-SNE analysis indicated that the patients in different risk groups were distributed in two directions (Figs. 3C and 3D). Kaplan–Meier curve analysis showed that the high-risk group patients had a dramatically worse OS than the low-risk group patients (Fig. 3E). The AUCs of the five-gene clinical signature were 0.772, 0.683, and 0.650 in the TCGA cohort (Fig. 3F).
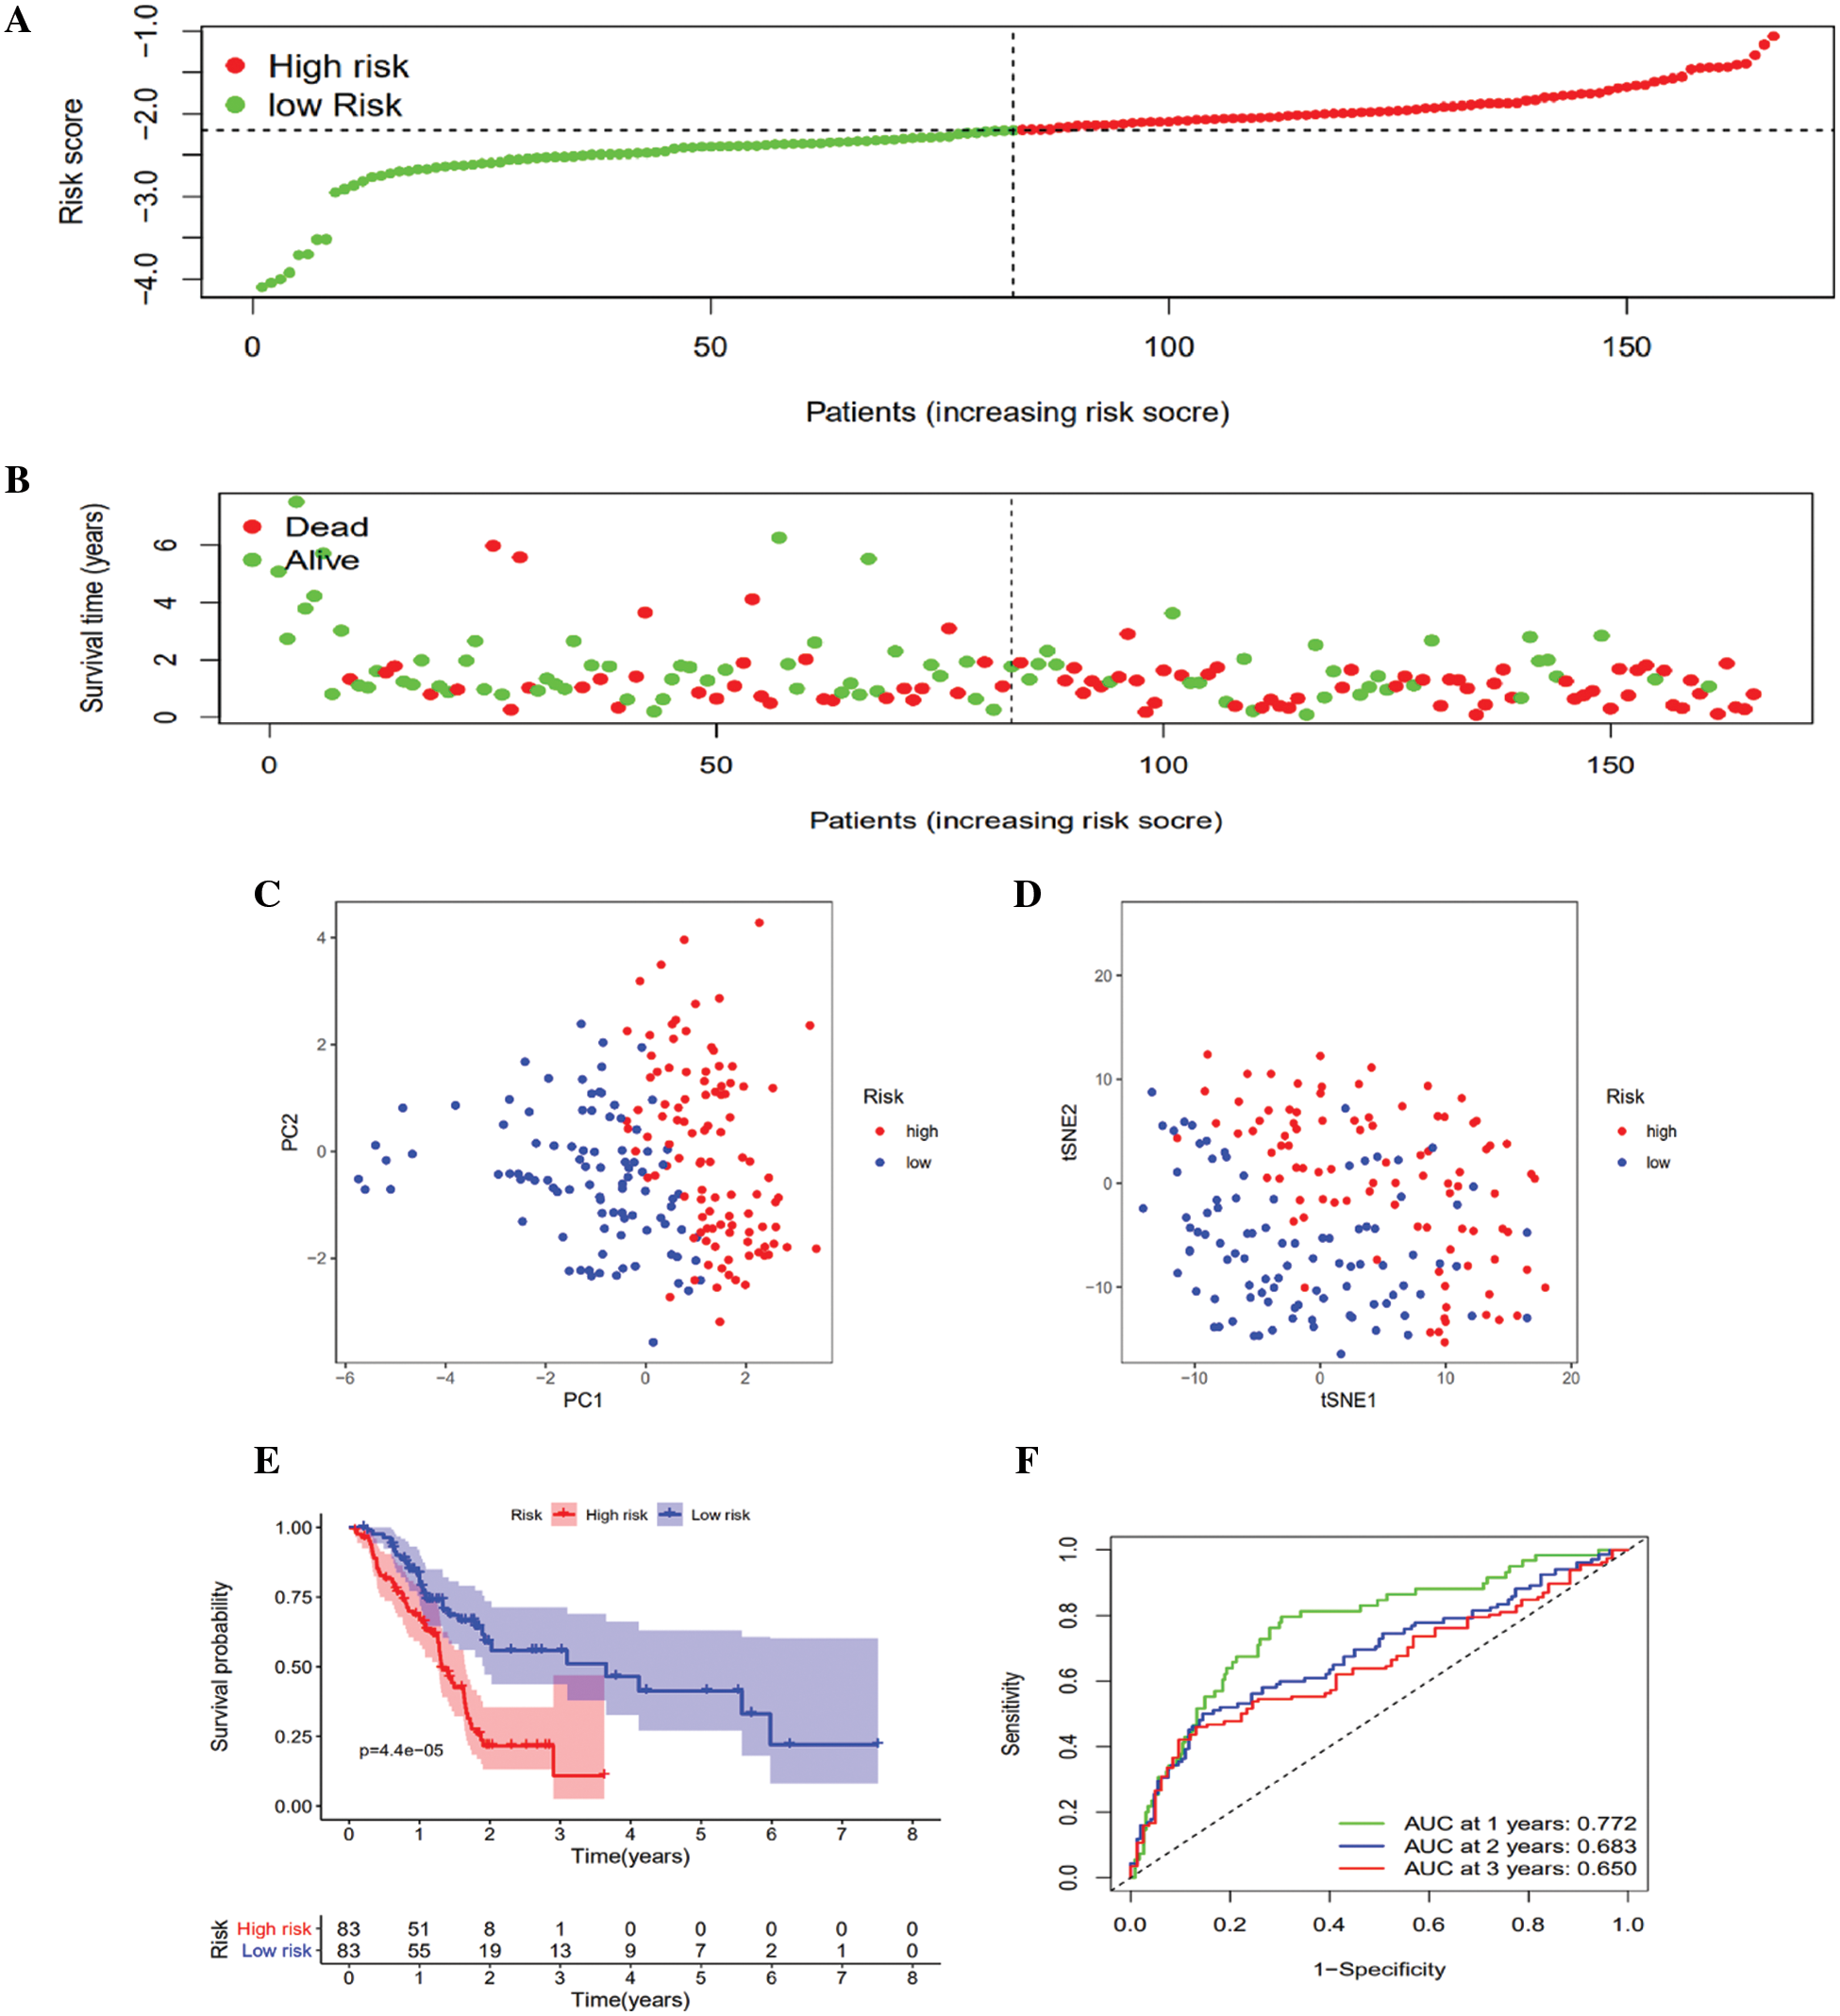
Figure 3: Prognostic risk score model analysis in the TCGA queue. A. Distribution of patient survival duration and gene expression levels. B. The allocations of OS status, OS and risk score in the TCGA queue. C. PCA plot of the TCGA queue. D. t-SNE analysis of the TCGA queue. E. Kaplan–Meier curves of OS based on the gene signature in the TCGA queue. F. AUC of time-dependent ROC curves in the TCGA queue.
Verification of the 6-gene clinical signature in the GEO queue and ICGC queue
To verify the robustness of the created model using the TCGA queue, the GEO queue and ICGC queue patients were similarly clustered into the low- and high-risk groups according to the median value computed using the same formula utilized in the TCGA queue (Figs. 4A and 5A). Similarly, the high-risk group patients were more likely to die earlier than the low-risk group patients in both the GEO queue and ICGC queue (Figs. 4B and 5B). Congruent with the TCGA results, in the GEO queue and ICGC queue, the PCA along with the t-SNE analyses verified that the patients in the two subgroups were stratified into distinct directions (Figs. 4C and 4D, Figs. 5C and 5D) and had a decreased survival time in contrast with the low-risk group patients (Figs. 4E and 5E) (p < 0.01). Moreover, the AUC of the five-gene clinical signature was 0.680, 0.690, and 0.718 in the GEO queue and 0.747, 0.710, and 0.747 in the ICGC queue at one year, two years, and three years, respectively (Figs. 4F and 5F).
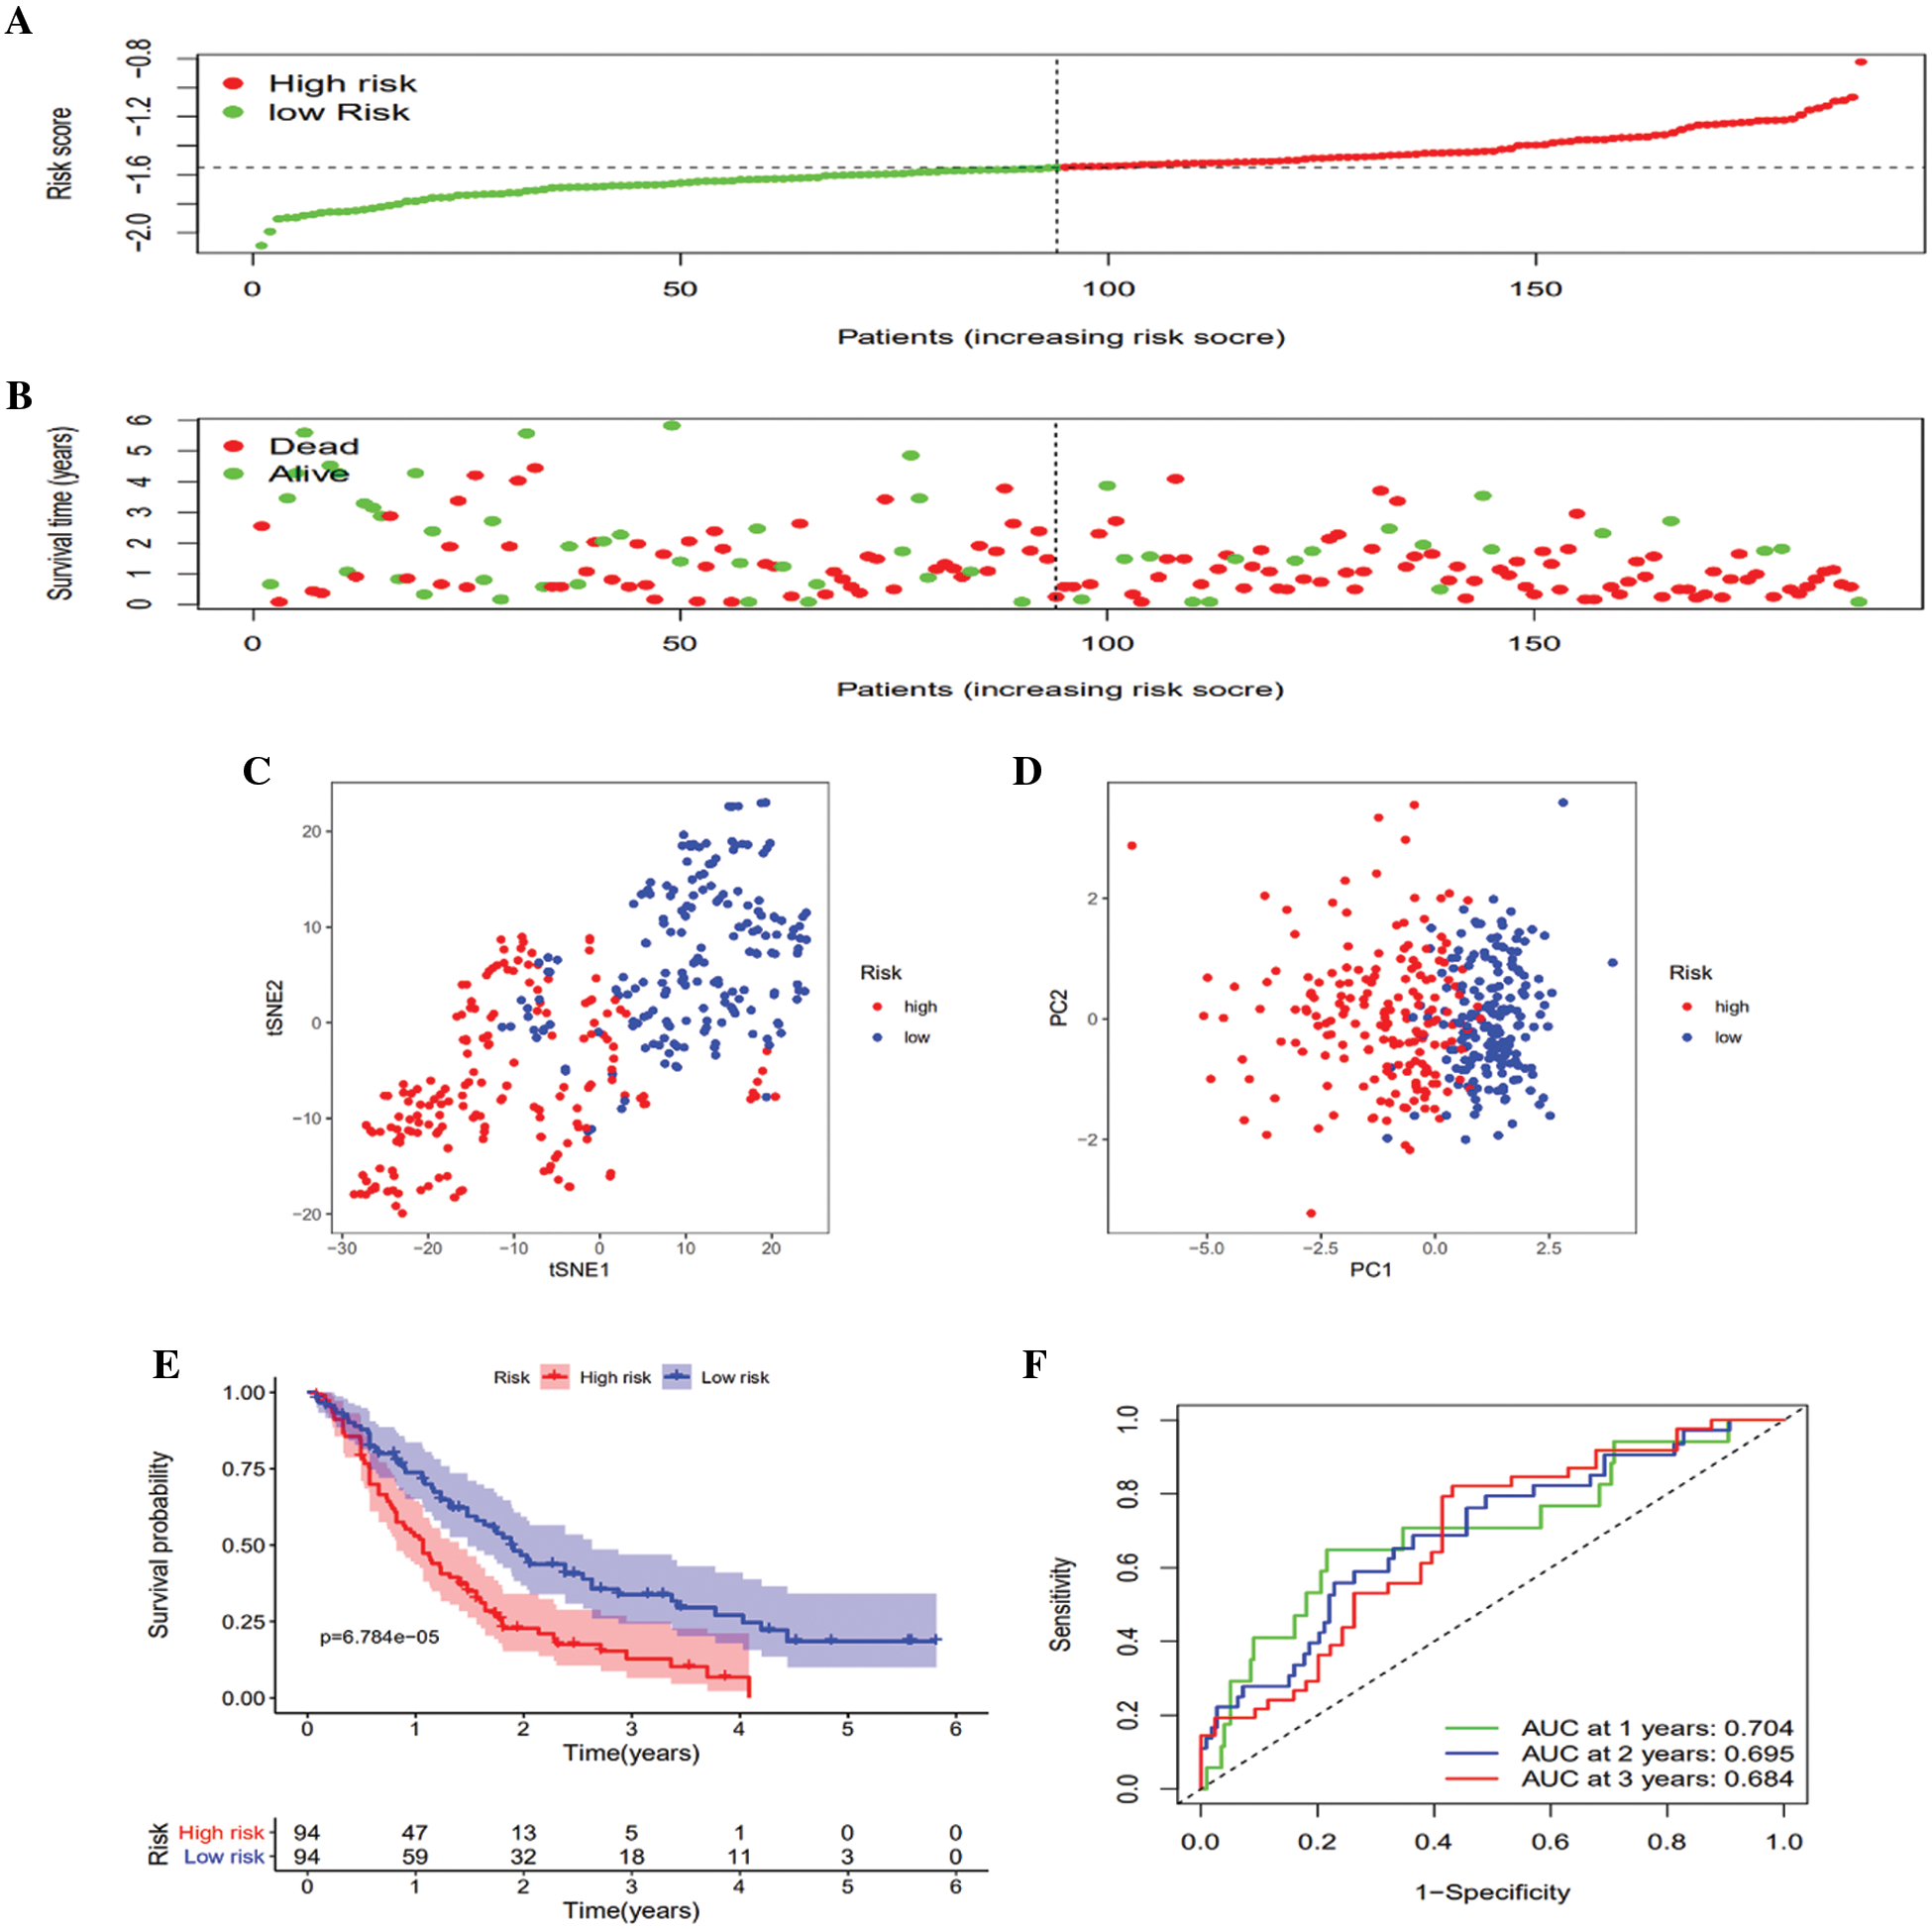
Figure 4: Validation of the 6-gene signature in the GEO queue. A. Distribution of patient survival duration and gene expression levels. B. The allocations of OS status, OS and risk score in the GEO queue. C. PCA plot of the GEO queue. D. t-SNE analysis of the GEO queue. E. Kaplan–Meier curves of OS based on the gene signature in the GEO queue. F. AUC of time-dependent ROC curves in the GEO queue.

Figure 5: Validation of the 6-gene signature in the ICGC queue. A. Distribution of patient survival duration and gene expression levels. B. The allocations of OS status, OS and risk score in the ICGC queue. C. PCA plot of the ICGC queue. D. t-SNE analysis of the ICGC queue. E. Kaplan–Meier curves of OS based on the gene signature in the ICGC queue. F. AUC of time-dependent ROC curves in the ICGC queue.
Independent prognostic value of the 6-gene signature
The Kaplan–Meier data illustrated that the study risk model has a stable estimation potential for the prognosis of PC patients grouped by age (<62, 62–76, and >76), N-stage (N0 or N1) (Supplemental Fig. S1), pathological grade (G1/2, or G3/4), sex (male and female), and T-stage (T1/2, or T3/4). Using TCGA clinical data, we used TCGA clinical data to perform subgroup analysis by age (62,62–76,76), sex (male and female), pathological grade (G1/2, or G3/4), T-stage (T1/2, or T3/4), and N-stage (N0 or N1). We found that the risk model significantly decreased the overall survival time compared with the low-risk group in subgroups such as age (62, 62–76), sex (male and female), G1/2, T3/4, and N0/N1 (p < 0.05) (Figs. 6A–6K). The high-risk PDAC patients exhibited a remarkably worse OS than the patients in the low-risk group when the patients were grouped into different subgroups on the basis of age, T-stage, sex, N-stage, and pathological grade (Figs. 6A–6K). The univariate Cox regression data demonstrated that the risk score was remarkably linked to OS in the TCGA data set (HR = 4.778, 95% CI = 2.644–8.633, p < 0.001) (Fig. 7A) and in the ICGC queue (HR = 8.341, 95% CI = 3.995–17.413, p < 0.001) (Fig. 7C). Following the adjustment for other confounding factors, the multivariate Cox regression data still demonstrated that the risk score was still an independent predictor (HR = 4.232, 95% CI = 2.474–7.238, p < 0.001. Fig. 7B) and in the ICGC queue (HR = 4.507, 95% CI = 2.657–7.654, p < 0.001) (Fig. 7D); thus, the gene signature was an independent prognostic factor of other clinical variables. On the basis of the multivariate Cox regression data of OS in the TCGA queue, we created a nomogram to estimate the one-, three- and five-year survival likelihood in PDAC (Fig. 7E).

Figure 6: A–C. Kaplan–Meier curves of the prognostic value of the risk model in clinical subgroups of patients. Kaplan–Meier survival curves for patients by age group (<62, 62–76, and >76). D–E. Kaplan–Meier survival curves for sex subgroups (male and female). F–G. Kaplan–Meier survival curves for pathological grade subgroups (G1/2 and G3/4). H–I. Kaplan–Meier survival curves for T-stage subgroups (T1/2 and T3/4). J–K. Kaplan–Meier survival curves for subgroups by N-stage (N0 and N1).

Figure 7: Univariate (A) and Multivariate (B) Cox regression analyses in the TCGA derivation queue. Univariate (C) and Multivariate (D) Cox regression analyses regarding OS in the ICGC queue. (E) The nomogram was built in the TCGA queue.
External validation using online databases
The mRNA expression levels of GPX4, PLA2G2F, PTGES, and PTGS2 were evidently increased in PAAD tumor tissue. Conversely, CYP2C18 and LTC4S were evidently decreased in contrast with nontumor tissues (Figs. 8A and 8C). All the results from the Oncomine and GEPIA databases were consistent with our results for the TCGA, GEO and ICGC data sets. The effect of these genes on the prognosis of pancreatic cancer was verified by GEPIA (Fig. 8B). Of the 849 PAAD patients included, 67 (7.9%) had changes in 6 genes. Amplification is the most common mutation type in upregulated genes (Fig. 8D). In the Human Protein Atlas database, we found IHC staining for the GPX4, PTGES, and PTGS2 genes in tumor and normal pancreatic tissues (Fig. 8E).

Figure 8: External validation using online databases. A. The mRNA expression levels of six genes from GEPIA (http://gepia.cancer-pku.cn/). B. Kaplan–Meier curves of the prognostic impact of six gene expression levels in pancreatic cancer patients. C. The mRNA expression levels of the six genes in the Oncomine database (http://www.oncomine.org/) (p < 0.05) D. Proportion of alterations in six genes in the cBioPortal database (https://www.cbioportal.org/). E. IHC of the GPX4, PTGES, and PTGS2 genes in tumor and normal pancreatic tissues obtained from the human protein atlas (https://www.proteinatlas.org/).
Functional analyses in the TCGA queue
To determine the biological roles and cascades that were related to the risk score, GSEA was performed on the basis of the DEGs between the high- and low-risk groups. In the high-risk groups. DEGs were abundant in multiple cancer-related molecular functions, including bladder cancer, the P53 signaling pathway, the cell cycle and tight junctions, in the TCGA data set (FDR < 0.05, Table 2, Figs. 9A–9C). A total of 19 oncological signatures were also significantly enriched. Full GSEA results are presented in Supplementary Table S3. In the low-risk groups. DEGs were abundant in multiple metabolism-related molecular functions (Table 2).


Figure 9: Functional analysis using the TCGA queue. Typical signaling pathways evidently enriched in the high-risk group identified by GSEA (A, B and C). Comparison of the ssGSEA scores among different risk groups in the TCGA queue. D. The scores of 16 immune cells and E. 13 immune-related functions. FDR is shown as follows: ns, not significant; *, p < 0.05; **, p < 0.01; ***, p < 0.001.
Furthermore, to investigate the association of the risk score with immune status, quantification of the enrichment scores of different immune cell subpopulations, associated roles or cascades was performed using ssGSEA. As expected, numerous contents of T-cell immunity, including the scores of CD8+_T_cells, T_cell_costimulation, T_helper_cells, TIL, and T_cell_coinhibition, were remarkably different between the low- and high-risk groups in the TCGA data sets (all corrected p < 0.05, Fig. 9D). Moreover, the scores of the type II IFN response, cytolytic activity, checkpoint, mast cells and NK cells were lower in the high-risk group (adjusted p < 0.05, Fig. 9E).
Herein, we systematically explored the expression of 58 AA metabolism-linked genes in PDAC tumor tissues and their relationship with OS. A new clinical prediction model combining 6 AA metabolism-linked genes was first created and verified in an external data set. Functional analyses demonstrated that immune-associated cascades were abundant.
Although a few previous investigations (Elander et al., 2008; Amirian et al., 2011) have indicated that several AA metabolism-related genes enhance cell proliferation, migration and infiltration, their relationship with the OS of PDAC patients has not been explored. Interestingly, most AA metabolism-linked genes (75.9%) were expressed differently between tumor and nonmalignant tissues, with more than one-third being associated with OS on the basis of the univariate Cox regression data. These results markedly revealed the prospective role of AA metabolism in PDAC and the likelihood of creating a prognostic model using these AA metabolism-linked genes. Several AA metabolism-related genes enhance cell proliferation, migration and infiltration, and eicosanoids generally enhance the progression of cancer (Young, 1994; Wang and Dubois, 2010; Johnson et al., 2020) The clinical prediction model proposed herein consisted of 6 AA metabolism-associated genes (CYP2C18, PTGS2, PTGES, PLA2G2F, LTC4S, and GPX4). These genes were roughly grouped into four classes consisting of COX metabolism (PTGS2, PTGES), LOX metabolism (LTC4S, GPX4), CYP metabolism (CYP2C18) and phospholipase A2 relevant gene (PLA2G2F). The CYP2C18 gene is localized within a cluster of cytochrome P450 genes on chromosome 10q24. The CYP2C family participates in the conversion of AAs into four regioisomers of EETs: 14,15, 11,12-, 8,9-, and 5,6-EETs. Mounting research evidence documents that metabolism mediated by CYP enzymes has a pivotal role in tumorigenesis as well as the cardiovascular system (Jiang et al., 2005; Jiang et al., 2009; Xu et al., 2011; Sausville et al., 2018). However, whether CYP2C18 has a role in the prognosis of PDAC patients by affecting AA metabolism remains unclear. Prostaglandin-endoperoxide synthase (PTGES), also referred to as cyclooxygenase (COX), is the critical enzyme involved in the biosynthesis of prostaglandin and functions both as a peroxidase and as a dioxygenase. PTGS exists into isoforms, namely, constitutive PTGS1 and inducible PTGS2, differing in their tissue distribution and modulation of expression. This gene codes for the inducible isozyme. It is modulated by distinct stimulatory events, implying that it accounts for the biosynthesis of prostanoids participating in mitogenesis and inflammation (Kosaka et al., 1994). Multiple studies have documented that COX-2 is overexpressed in colorectal, breast, prostate, esophageal, and PCs (Eberhart et al., 1994; Sano et al., 1995; Hida et al., 1998; Tucker et al., 1999; Denkert et al., 2001; Pidgeon et al., 2007). PTGES is also known as microsomal PGES-1 (mPGES-1), and the gene for human mPGES-1 maps to chromosome 9q34.3. This gene codes for the glutathione-dependent prostaglandin E synthase protein (Forsberg et al., 2000). Microsomal PGES-1 (mPGES-1) mediates the impacts of PGE2 in tumorigenesis. The genetic deletion of mPGES-1 and concurrent suppression of endogenous PGE2 was reported to repress the onset of intestinal tumors in ApcMin/and AOM mice (Elander et al., 2008; Sasaki et al., 2012). The PLA2G2F gene is localized on chromosome 1 and located within a sPLA(2) gene cluster of approximately 300 kbp, which also contains the genes for group V sPLA(2)s, IID, IIA, IIE, and IIC. In adult tissues, PLA2G2F is overexpressed in the placenta, kidney, testis, liver, and thymus. Finally, PLA2G2F was recombinantly expressed (Valentin et al., 2000). Pla2g2f−/− mice had a fragile stratum corneum and were remarkably protected from psoriasis, skin cancer, and contact dermatitis (Yamamoto et al., 2015). The GPX4 (glutathione peroxidase 4) gene encodes a glutathione peroxidase protein family member (Savaskan et al., 2007). It participates in glutathione peroxidase in platelets in AA metabolism. Reduces hydroperoxy ester lipids generated by a 15-lipoxygenase that might have a role in downregulating the cellular 15-lipoxygenase cascade (by similarity) (Sutherland et al., 2001). Recent investigations related to GPX4 have shown that the antioxidant GPX4 appears to be a key regulator of pancreatic tumorigenesis (Sutherland et al., 2001). LTC4S (leukotriene C4 synthase). The gene coding for LTC4S is 2.5 kb long and is located on chromosome 5q35, distal to that of the genes coding for cytokines. In addition, receptors are significant in the onset and progression of allergic inflammation (Welsch et al., 1994). Recent investigations related to leukotrienes have shown that leukotriene B4 promotes lung tumor and colon cancer growth (Satpathy et al., 2015; Jala et al., 2017; Ringleb et al., 2018; Johnson et al., 2020). Unfortunately, other than LTB4, there have not been extensive studies on LTC4S.
Several significant biological processes and signaling pathways that were active in the high-risk or low-risk group have been revealed to provide new insights into the development of PDAC. We divided patients from the training cohort into two subtypes by performing our gene signature. Next, we conducted differential expression analysis between the high and low groups to determine the association between the metabolic genes and the two subtypes. We found that upregulated genes in the high-risk group were mainly involved in cell cycle regulation, and upregulated genes in the low-risk group were mainly involved in metabolic and energy regulation.
For many years, the function of eicosanoids in cancer has been investigated (Young, 1994; Wang and Dubois, 2010). The consensus of these initial investigations indicated that eicosanoids generally enhanced the progression of cancer and that these influences were primarily modulated via direct effects on tumor cells. GSEA confirmed a similar result. Significant pathways that were positive in the high-risk group were mostly related to cell cycle regulation, the P53 signaling pathway, and tight junctions. In contrast, meaningful pathways that were positive in the low-risk group were mostly associated with metabolic and energy regulation.
Emerging data indicate that eicosanoids play significant roles in immunosuppressive cascades. Many studies have documented that both products of the COX and 5-LO cascades participate in modulating antitumor immunity. These studies suggest that eicosanoids have an immune repressive role, different from their direct influences on cancer cells. Eicosanoids have been reported to modify the antitumor influences of cytotoxic T cells (DiMeo et al., 2008; Poczobutt et al., 2016), alter innate immune cell populations favoring the increment of immunosuppressive cells consisting of MDSCs and tumor-related macrophages (Lone and Taskén, 2013; Esser-von Bieren, 2017), and regulate metabolic cascades, e.g., indoleamine 2,3-dioxygenase 1 (IDO1) (Moore and Pidgeon, 2017). Our functional analysis also found numerous enriched T-cell-linked biological processes and cascades. Additionally, the high-risk groups in the TGCA data set had lower proportions of CD8+ T cells, B cells, mast cells, neutrophils, NK cells, T helper cells, pDCs, TILs, and Tfh cells. Moreover, higher risk scores were associated with impaired antitumor immunity consisting of the activity of the type II IFN response and T_cell_co-stimulation, T_cell_co-suppression, Cytolytic activity, Check-point and fractions of NK cells. Hence, diminished antitumor immunity in high-risk patients could explain the worse prognosis. These results suggest that immune pathways and pancreatic cancer are closely related, but the specific mechanisms need further validation.
In conclusion, our study established a new clinical prediction model of 6 AA metabolism-associated genes. This model was independently linked to OS in both the derivation and verification data sets, providing an understanding of the estimation of PDAC prognosis. The mechanism responsible for the association of AA metabolism-linked genes with tumor immunity in AA metabolism remains unclear and therefore should be studied.
Author Contribution: The authors confirm contribution to the paper as follows: study conception and design: Hui-Li Zhu and Chun-Hui Wang; data collection: Hui-Li Zhu and Li-Na Xiao; analysis and interpretation of results: Hui-Li Zhu and Shi-Bing Xiang; draft manuscript preparation: Xia Yin. Hui-Li Zhu. All authors reviewed the results and approved the final version of the manuscript.
Availability of Data and Materials: The datasets used and/or analysed during the current study are available from the corresponding author on reasonable request.
Ethics Approval: Not applicable.
Funding Statement: The authors received no specific funding for this study.
Conflicts of Interest: The authors declare that the research was conducted in the absence of any commercial or financial relationships that could be construed as a potential conflict of interest.
Amirian ES, Ittmann MM, Scheurer ME (2011). Associations between arachidonic acid metabolism gene polymorphisms and prostate cancer risk. Prostate 71: 1382–1389. DOI 10.1002/pros.21354. [Google Scholar] [CrossRef]
Baker RR (1990). The eicosanoids: A historical overview. Clinic Biochemistry 23: 455–458. DOI 10.1016/0009-9120(90)90255-S. [Google Scholar] [CrossRef]
Bray F, Ferlay J, Soerjomataram I, Siegel RL, Torre LA et al. (2018). Global cancer statistics 2018: GLOBOCAN estimates of incidence and mortality worldwide for 36 cancers in 185 countries. CA: A Cancer Journal for Clinic 68: 394–424. DOI 10.3322/caac.21492. [Google Scholar] [CrossRef]
Denkert C, Köbel M, Berger S, Siegert A, Leclere A et al. (2001). Expression of cyclooxygenase 2 in human malignant melanoma. Cancer Research 61: 303–308. [Google Scholar]
Devchand PR, Keller H, Peters JM, Vazquez M, Gonzalez FJ et al. (1996). The PPARalpha-leukotriene B4 pathway to inflammation control. Nature 384: 39–43. DOI 10.1038/384039a0. [Google Scholar] [CrossRef]
DiMeo D, Tian J, Zhang J, Narushima S, Berg DJ (2008). Increased interleukin-10 production and Th2 skewing in the absence of 5-lipoxygenase. Immunology 123: 250–262. [Google Scholar]
Eberhart CE, Coffey RJ, Radhika A, Giardiello FM, Ferrenbach S et al. (1994). Up-regulation of cyclooxygenase 2 gene expression in human colorectal adenomas and adenocarcinomas. Gastroenterology 107: 1183–1188. DOI 10.1016/0016-5085(94)90246-1. [Google Scholar] [CrossRef]
Elander N, Ungerbäck J, Olsson H, Uematsu S, Akira S et al. (2008). Genetic deletion of mPGES-1 accelerates intestinal tumorigenesis in APCMin/+ mice. Biochemical and Biophysical Research Communications 372: 249–253. DOI 10.1016/j.bbrc.2008.05.026. [Google Scholar] [CrossRef]
Esser-von Bieren J (2017). Immune-regulation and -functions of eicosanoid lipid mediators. Biological Chemistry 398: 1177–1191. DOI 10.1515/hsz-2017-0146. [Google Scholar] [CrossRef]
Forsberg L, Leeb L, Thorén S, Morgenstern R, Jakobsson P (2000). Human glutathione dependent prostaglandin E synthase: Gene structure and regulation. FEBS Letters 471: 78–82. DOI 10.1016/S0014-5793(00)01367-3. [Google Scholar] [CrossRef]
Hackert T, Schneider L, Büchler MW (2015). Current state of vascular resections in pancreatic cancer surgery. Gastroenterology Researach and Practice 2015: 120207. DOI 10.1155/2015/120207. [Google Scholar] [CrossRef]
Hasan S, Satake M, Dawson DW, Funahashi H, Angst E et al. (2008). Expression analysis of the prostaglandin E2 production pathway in human pancreatic cancers. Pancreas 37: 121–127. DOI 10.1097/MPA.0b013e31816618ba. [Google Scholar] [CrossRef]
Hida T, Yatabe Y, Achiwa H, Muramatsu H, Kozaki K et al. (1998). Increased expression of cyclooxygenase 2 occurs frequently in human lung cancers, specifically in adenocarcinomas. Cancer Research 58: 3761–3764. [Google Scholar]
Jala VR, Maturu P, Bodduluri SR, Krishnan E, Mathis S et al. (2017). Leukotriene B(4)-receptor-1 mediated host response shapes gut microbiota and controls colon tumor progression. Oncoimmunology 6: e1361593. DOI 10.1080/2162402X.2017.1361593. [Google Scholar] [CrossRef]
Jiang JG, Chen CL, Card JW, Yang S, Chen JX et al. (2005). Cytochrome P450 2J2 promotes the neoplastic phenotype of carcinoma cells and is up-regulated in human tumors. Cancer Research 65: 4707–4715. DOI 10.1158/0008-5472.CAN-04-4173. [Google Scholar] [CrossRef]
Jiang JG, Fu XN, Chen CL, Wang DW (2009). Expression of cytochrome P450 arachidonic acid epoxygenase 2J2 in human tumor tissues and cell lines. Chinese Journal of Cancer 28: 93–96. [Google Scholar]
Johnson AM, Kleczko EK, Nemenoff RA (2020). Eicosanoids in cancer: New roles in immunoregulation. Frontiers in Pharmacology 11: 595498. DOI 10.3389/fphar.2020.595498. [Google Scholar] [CrossRef]
Kosaka T, Miyata A, Ihara H, Hara S, Sugimoto T et al. (1994). Characterization of the human gene (PTGS2) encoding prostaglandin-endoperoxide synthase 2. European Journal of Biochemistry 221: 889–897. DOI 10.1111/j.1432-1033.1994.tb18804.x. [Google Scholar] [CrossRef]
Lone AM, Taskén K (2013). Proinflammatory and immunoregulatory roles of eicosanoids in T cells. Frontiers in Immunology 4: 130. DOI 10.3389/fimmu.2013.00130. [Google Scholar] [CrossRef]
Markosyan N, Li J, Sun YH, Richman LP, Lin JH et al. (2019). Tumor cell-intrinsic EPHA2 suppresses anti-tumor immunity by regulating PTGS2 (COX-2). Journal of Clinical Investigation 129: 3594–3609. DOI 10.1172/JCI127755. [Google Scholar] [CrossRef]
Mizrahi JD, Surana R, Valle JW, Shroff RT (2020a). Pancreatic cancer. Lancet 395: 2008–2020. DOI 10.1016/S0140-6736(20)30974-0. [Google Scholar] [CrossRef]
Mizrahi JD, Surana R, Valle JW, Shroff RT (2020b). Pancreatic cancer. Lancet 395: 2008–2020. DOI 10.1016/S0140-6736(20)30974-0. [Google Scholar] [CrossRef]
Moore GY, Pidgeon GP (2017). Cross-talk between cancer cells and the tumour microenvironment: The role of the 5-Lipoxygenase pathway. International Journal of Molecular Sciences 18: 236. DOI 10.3390/ijms18020236. [Google Scholar] [CrossRef]
Moreno JJ (2003). Cyclooxygenase and cytochrome P-450 pathways induced by fetal calf serum regulate wound closure in 3T6 fibroblast cultures through the effect of prostaglandin E2 and 12 and 20 hydroxyeicosatetraenoic acids. Journal of Cellular Physiology 195: 92–98. DOI 10.1002/(ISSN)1097-4652. [Google Scholar] [CrossRef]
Moreno JJ (2009). New aspects of the role of hydroxyeicosatetraenoic acids in cell growth and cancer development. Biochemical Pharmacology 77: 1–10. DOI 10.1016/j.bcp.2008.07.033. [Google Scholar] [CrossRef]
Mounir M, Lucchetta M, Silva TC, Olsen C, Bontempi G et al. (2019). New functionalities in the TCGAbiolinks package for the study and integration of cancer data from GDC and GTEx. PLoS Computational Biology 15: e1006701. DOI 10.1371/journal.pcbi.1006701. [Google Scholar] [CrossRef]
Nieves D, Moreno JJ (2007). Epoxyeicosatrienoic acids induce growth inhibition and calpain/caspase-12 dependent apoptosis in PDGF cultured 3T6 fibroblast. Apoptosis 12: 1979–1988. DOI 10.1007/s10495-007-0123-3. [Google Scholar] [CrossRef]
Oba A, Bao QR, Barnett CC, Al-Musawi MH, Croce C et al. (2020). Vascular resections for pancreatic ductal adenocarcinoma: Vascular resections for PDAC. Scandinavian Journal Surgery 109: 18–28. DOI 10.1177/1457496919900413. [Google Scholar] [CrossRef]
Pidgeon GP, Lysaght J, Krishnamoorthy S, Reynolds JV, O’Byrne K et al. (2007). Lipoxygenase metabolism: Roles in tumor progression and survival. Cancer and Metastasis Reviews 26: 503–524. DOI 10.1007/s10555-007-9098-3. [Google Scholar] [CrossRef]
Poczobutt JM, Nguyen TT, Hanson D, Li H, Sippel TR et al. (2016). Deletion of 5-lipoxygenase in the tumor microenvironment promotes lung cancer progression and metastasis through regulating T cell recruitment. Journal of Immunology 196: 891–901. DOI 10.4049/jimmunol.1501648. [Google Scholar] [CrossRef]
Ringleb J, Strack E, Angioni C, Geisslinger G, Steinhilber D et al. (2018). Apoptotic cancer cells suppress 5-lipoxygenase in tumor-associated macrophages. Journal of Immunology 200: 857–868. DOI 10.4049/jimmunol.1700609. [Google Scholar] [CrossRef]
Rooney MS, Shukla SA, Wu CJ, Getz G, Hacohen N (2015). Molecular and genetic properties of tumors associated with local immune cytolytic activity. Cell 160: 48–61. DOI 10.1016/j.cell.2014.12.033. [Google Scholar] [CrossRef]
Sano H, Kawahito Y, Wilder RL, Hashiramoto A, Mukai S et al. (1995). Expression of cyclooxygenase-1 and -2 in human colorectal cancer. Cancer Research 55: 3785–3789. [Google Scholar]
Sasaki Y, Kamei D, Ishikawa Y, Ishii T, Uematsu S et al. (2012). Microsomal prostaglandin E synthase-1 is involved in multiple steps of colon carcinogenesis. Oncogene 31: 2943–2952. DOI 10.1038/onc.2011.472. [Google Scholar] [CrossRef]
Satpathy SR, Jala VR, Bodduluri SR, Krishnan E, Hegde B et al. (2015). Crystalline silica-induced leukotriene B4-dependent inflammation promotes lung tumour growth. Nature Communication 6: 7064. DOI 10.1038/ncomms8064. [Google Scholar] [CrossRef]
Sausville LN, Gangadhariah MH, Chiusa M, Mei S, Wei S et al. (2018). The cytochrome P450 slow metabolizers CYP2C9*2 and CYP2C9*3 directly regulate tumorigenesis via reduced epoxyeicosatrienoic acid production. Cancer Research 78: 4865–4877. DOI 10.1158/0008-5472.CAN-17-3977. [Google Scholar] [CrossRef]
Savaskan NE, Ufer C, Kuhn H, Borchert A (2007). Molecular biology of glutathione peroxidase 4: From genomic structure to developmental expression and neural function. Biological Chemistry 388: 1007–1017. DOI 10.1515/BC.2007.126. [Google Scholar] [CrossRef]
Siegel RL, Miller KD, Jemal A (2020). Cancer statistics, 2020. CA Cancer Journal Clinic 70: 7–30. DOI 10.3322/caac.21590. [Google Scholar] [CrossRef]
Simon N, Friedman J, Hastie T, Tibshirani R (2011). Regularization paths for Cox’s proportional hazards model via coordinate descent. Journal of Statistical Software 39: 1–13. DOI 10.18637/jss.v039.i05. [Google Scholar] [CrossRef]
Smith WL (1989). The eicosanoids and their biochemical mechanisms of action. Biochemical Journal 259: 315–324. DOI 10.1042/bj2590315. [Google Scholar] [CrossRef]
Sutherland M, Shankaranarayanan P, Schewe T, Nigam S (2001). Evidence for the presence of phospholipid hydroperoxide glutathione peroxidase in human platelets: implications for its involvement in the regulatory network of the 12-lipoxygenase pathway of arachidonic acid metabolism. Biochemical Journal 353: 91–100. DOI 10.1042/bj3530091. [Google Scholar] [CrossRef]
Szklarczyk D, Franceschini A, Kuhn M, Simonovic M, Roth A et al. (2011). The STRING database in 2011: Functional interaction networks of proteins, globally integrated and scored. Nucleic Acids Research 39: D561–568. DOI 10.1093/nar/gkq973. [Google Scholar] [CrossRef]
Tibshirani R (1997). The lasso method for variable selection in the Cox model. Statistics Medicine 16: 385–395. DOI 10.1002/(ISSN)1097-0258. [Google Scholar] [CrossRef]
Tucker ON, Dannenberg AJ, Yang EK, Zhang F, Teng L et al. (1999). Cyclooxygenase-2 expression is up-regulated in human pancreatic cancer. Cancer Research 59: 987–990. [Google Scholar]
Valentin E, Singer AG, Ghomashchi F, Lazdunski M, Gelb MH et al. (2000). Cloning and recombinant expression of human group IIF-secreted phospholipase A(2). Biochemical and Biophysical Research Communications 279: 223–228. DOI 10.1006/bbrc.2000.3908. [Google Scholar] [CrossRef]
van Manen L, Groen JV, Putter H, Vahrmeijer AL, Swijnenburg RJ et al. (2020). Elevated CEA and CA19-9 serum levels independently predict advanced pancreatic cancer at diagnosis. Biomarkers 25: 186–193. DOI 10.1080/1354750X.2020.1725786. [Google Scholar] [CrossRef]
Wang D, Dubois RN (2010). Eicosanoids and cancer. Nature Reviews: Cancer 10: 181–193. DOI 10.1038/nrc2809. [Google Scholar] [CrossRef]
Wang D, DuBois RN (2018). Role of prostanoids in gastrointestinal cancer. Journal of Clinical Investigation 128: 2732–2742. DOI 10.1172/JCI97953. [Google Scholar] [CrossRef]
Welsch DJ, Creely DP, Hauser SD, Mathis KJ, Krivi GG et al. (1994). Molecular cloning and expression of human leukotriene-C4 synthase. PNAS 91: 9745–9749. DOI 10.1073/pnas.91.21.9745. [Google Scholar] [CrossRef]
Xu X, Zhang XA, Wang DW (2011). The roles of CYP450 epoxygenases and metabolites, epoxyeicosatrienoic acids, in cardiovascular and malignant diseases. Advanced Drug Delivery Reviews 63: 597–609. DOI 10.1016/j.addr.2011.03.006. [Google Scholar] [CrossRef]
Yamamoto K, Miki Y, Sato M, Taketomi Y, Nishito Y et al. (2015). The role of group IIF-secreted phospholipase A2 in epidermal homeostasis and hyperplasia. Journal of Experimental Medicine 212: 1901–1919. DOI 10.1084/jem.20141904. [Google Scholar] [CrossRef]
Young MR (1994). Eicosanoids and the immunology of cancer. Cancer and Metastasis Reviews 13: 337–348. DOI 10.1007/BF00666103. [Google Scholar] [CrossRef]
Zhou G, Niu L, Chiu D, He L, Xu K (2012). Changes in the expression of serum markers CA242, CA199, CA125, CEA, TNF-α and TSGF after cryosurgery in pancreatic cancer patients. Biotechnology Letters 34: 1235–1241. DOI 10.1007/s10529-012-0908-5. [Google Scholar] [CrossRef]
Yao X, Lu C, Shen J, Jiang W, Qiu YAN et al. (2021). A novel nine gene signature integrates stemness characteristics associated with prognosis in hepatocellular carcinoma. BIOCELL 45: 1425–1448. DOI 10.32604/biocell.2021.017289. [Google Scholar] [CrossRef]
 | This work is licensed under a Creative Commons Attribution 4.0 International License, which permits unrestricted use, distribution, and reproduction in any medium, provided the original work is properly cited. |