DOI:10.32604/biocell.2022.015409
| BIOCELL DOI:10.32604/biocell.2022.015409 | |
| Article |
Forkhead box protein O1 (FoxO1) regulates lipids metabolism and cell proliferation mediated by insulin and PI3K-Akt-mTOR pathway in goose primary hepatocytes
1Farm Animal Genetic Resources Exploration and Innovation Key Laboratory of Sichuan Province, Sichuan Agricultural University, Chengdu, 611130, China
2College of Life Science, Sichuan Agricultural University, Ya’an, 625014, China
*Address correspondence to: Chunchun Han, chunchunhai_510@163.com
Received: 17 December 2020; Accepted: 30 December 2020
Abstract: In order to explore the role of forkhead box protein O1 (FoxO1) in the lipid metabolism and cell proliferation, goose primary hepatocytes were isolated and incubated with insulin or PI3K-Akt-mTOR pathway dual inhibitor NVP-BEZ235, and then transfected with FoxO1 interference plasmid. The related parameters of lipid metabolism and cell proliferation were measured. The results firstly showed that FoxO1 interference increased the intracellular TG and lipids concentration (P < 0.05); and increased the proliferative index (PI), cell DNA synthesis, protein expression of Cyclin D1 in goose primary hepatocytes (P < 0.05). Secondly, the co-treatment of insulin and FoxO1 interference increased the mRNA level and protein content of Cyclin D1 (P < 0.05); however, there was no significant difference between the insulin treatment and the co-treatment of insulin and miR-FoxO1 interference in the intracellular TG and lipids concentration and PI (P > 0.05). Lastly, the decrease of intracellular TG and lipids concentration and PI induced by NVP-BEZ235 was up-regulated by FoxO1 interference significantly (P < 0.05). In summary, FoxO1 could regulate the lipids metabolism and cell proliferation mediated by PI3K-Akt-mTOR signaling pathway in goose primary hepatocytes. Further investigations are required to highlight the potential role of FoxO1 in the lipid metabolism and cell proliferation mediated by insulin in goose primary hepatocyte.
Keywords: FoxO1; Lipid metabolism; Cell proliferation; PI3K-Akt-mTOR signal pathway; Goose primary hepatocytes
The transcription factor forkhead box protein O1 (FoxO1) is a member of the forkhead O family and plays important roles in different biological processes which includ cell proliferation and cell lipid metabolism. Previous researches showed that FoxO1 regulates hepatic lipid metabolism in multiple ways, including PP2A-AMPK pathway, insulin pathway, glucose pathway, AKT-FoxO1 pathway (Chen et al., 2020; Shi et al., 2020; Yu et al., 2019; Zangerolamo et al., 2019), from the de novo lipogenesis via sterol regulatory element-binding proteins-1 (SREBP-1), fatty acids oxidation and lipids transportation. Recent study reported that the FoxO1 deacetylation decreased the fatty acid oxidation in β-cells (Kim-Muller et al., 2016). In primary hepatocytes, CA-FoxO1 suppressed SREBP-1c expression, insulin induced SREBP-1c promoter activity (Deng et al., 2012). FoxO1 loss-of-function, caused by RNAi-mediated depletion of FoxO1 mRNA in liver resulted in reduced hepatic VLDL production in diabetic db/db and FoxO1 transgenic mice (Kamagate et al., 2008). FoxO1 also had been found to play a critical role in the cell proliferation from cell cycle arrest and cell apoptosis (Kapahi et al., 2010; Zeng et al., 2009). When the FoxO1 was suppressed or silenced, the cell proliferation increased and the cell apoptosis decreased (Piao et al., 2019). One recent research indicated that silencing FoxO1 attenuated dexamethasone-induced apoptosis in osteoblastic MC3T3-E1 cells (Xing et al., 2019). In addition, FoxO1 not only acts as a negative checkpoint on NK cell maturation, but also represses NK cell specification and proliferation (Huang et al., 2019).
FoxO1 Forkhead proteins are major targets of insulin action. The insulin signaling through FoxO1 plays an important role in regulating hepatic microsomal triglyceride transfer protein (MTP) expression and very low-density lipoprotein (VLDL) production (Zangerolamo et al., 2019). Our current research reported that the regulation of lipid deposition by insulin in goose liver cells was mediated by the PI3K-Akt-mTOR signaling pathway (Han et al., 2015). A current study demonstrated that nicotinamide phosphoribosyltransferase (Nampt) is a transcriptional target of FoxO1 that is under control of the insulin-PI3K-Akt pathway and the stimulatory effect of insulin signaling pathways on the Nampt gene expression is largely due to inhibitory action on FoxO1 (Jeong et al., 2019). However, whether FoxO1 regulated the cell proliferation and lipid metabolism mediated by insulin in reverse is unclear.
It was reported that miRNA treatment reduced the expression of FoxO1, which is the downstream of the PI3K-Akt pathway in mice hepatocytes (Shu et al., 2020). PI3K-Akt-FoxO1 mediated pathway attenuated the hepatic glucose output, and the hepatic lipid accumulation was inhibited (Mutt et al., 2020). PKC epsilon-PI3K-Akt pathway ameliorated the high fat diet-induced hepatic steatosis and insulin resistance, suppressed the hepatic gluconeogenesis (Cheng et al., 2019). Mammalian target of rapamycin (mTOR) complex controls glucose and lipid metabolism, and a research showed silent information regulator 6 (SIRT6) was the FoxO1 deacetylase suppressed by mTORC2 (Jung et al., 2019). FoxK1 phosphorylation was increased upon mTORC1 suppression. Mechanistically, this occurs by mTORC1-dependent suppression of nuclear signaling by the Foxk1 kinase, Gsk3 (He et al., 2018). However, there has been no report whether FoxO1 regulates the cell lipid deposition and cell proliferation by PI3K-AKT-mTOR signal pathway.
Non-alcoholic steatohepatitis (NASH), characterized by inflammation, represents a crucial step in the progression of Non-alcoholic fatty liver disease (NAFLD) from simple steatosis to more advanced stages in mammals. This process is closely associated with insulin resistance, abnormal expression of FoxO1 as well as uncontrolled PI3K-Akt-mTOR pathway (Chen et al., 2019; Ding et al., 2020). In overfed geese, their liver increased in size and weight by 5 to 10 folds in two weeks due to a large amount of lipid accumulation. Despite severe steatosis, goose fatty liver (foie gras) showed no obvious inflammation, fibrosis, and other pathological changes that are often seen in NAFLD of humans and mice (Liu et al., 2016). Overfed goose liver can recover to normal state under certain conditions (Wei et al., 2021). Therefore, goose fatty liver provides a unique model of severe hepatic steatosis without any apparent liver injury, which provide a reference for the prevention and treatment of NAFLD. FoxO1 is the potential treatment molecular target for NAFLD (Elhafiz et al., 2020; Huang et al., 2019; Puentes et al., 2014). So, further uncovering the relationship between FoxO1, insulin and PI3K-Akt-mTOR signal pathway may provide new ideas for developing methods to prevent and cure NAFLD in humans and other animals.
Overfed goose liver (foie gras) has a special hepatic steatosis process where lipid deposition accompanied with cell proliferation. In our previous study, we found insulin and PI3K-Akt-mTOR signal pathway could stimulate lipid deposition and cell proliferation in goose primary hepatocytes (Han et al., 2015; Han et al., 2016). However, the role of FoxO1 in waterfowl hepatic steatosis development is unknown at present; in addition, whether FoxO1 could regulate the lipids metabolism and cell proliferation mediated by insulin and PI3K-Akt-mTOR signaling pathway is unclear. We hypothesized that FoxO1 may regulate the lipids metabolism and cell proliferation dependented on insulin and PI3K-Akt-mTOR signal pathway. In order to demostrated this hypothesis, we conducted a series of in vitro studies with cultured goose primary hepatocytes which were taken as in vitro liver model; and the corresponding indexes and parameters involveded in lipids metabolism and cell proliferation were detected. By addressing the hypothesis, this study may reveal the relationship between FoxO1, insulin and PI3K-Akt-mTOR signal pathway, provide a reference for the goose fatty liver (foie gras) formation mechanism. and open a new approach to preventing the occurrence of nonalcoholic steatohepatitis suffered by other animals.
Hepatocytes were isolated from three 14-day-old Tianfu Meat Goose from the Experimental Farm for Waterfowl Breeding at Sichuan Agricultural University (Sichuan, China) using a modification of the “two-step procedure” described by Seglen (1976). Goose primary hepatocytes were isolated and cultured in Dulbecco’s modified Eagle medium (DMEM) supplemented with 10% fetal bovine serum (FBS). The culture conditions were 37°C with 5% CO2. As showed in Suppl. Materials S1, the effective FoxO1 miRNA interference vector was selected. Control miRNA oligo and selected effective miRNAs interfering goose FoxO1 were designed and synthesized by BGI (Shenzhen, China). These two pairs of double-stranded miRNA oligo were inserted into the plasmid vector pCDNA6.2/MIRNA/AMP to construct two miRNA recombinant clone vectors, respectively. Before treatment, the cells were cultured in serum-free media for 12 h. Subsequently, serum-free media change to the media (contain serum), and then, some cells were treated with serum-free media supplemented with PI3K-Akt-mTOR pathway dual inhibitors (1 μmol/L NVP-BEZ235) (Selleck, HOU, USA) or insulin (150 nmol/L) for 12 h, and then the selected effective FoxO1 miRNA interference plasmid vectors pCDNA6.2/MIRNA/AMP-miRNA (miRNA-FoxO1) were added for incubation of 48 h for exploring the lipid metabolism. Meantime, in order to investigate the cell proliferation, some goose primary cells were treated with 1 μmol/L NVP-BEZ235 or 150 nmol/L insulin for 24 h; and then the previous treated goose primary hepatocytes were transfected with the miRNA-FoxO1 and incubated 12 h. After the incubation, the cells were collected for follow-up study. Each experiment was performed at least in triplicate.
Concentration measurement of triglyceride (TG) and VLDL
The extracellular VLDL concentration in the supernatant was measured using a chicken VLDL ELISA kit (GBD, USA). The concentration of VLDL in the samples was determined by comparing the optical density (OD) value at 450 nm of the samples to the standard curve. After cultured cell treatment, the culture media was collected for detecting extracellular TG concentration. Cell samples used to measure intracellular TG concentration were collected. The TG levels were quantified using a triglyceride GPO-POD assay kit (Biosinc, China). Measurements will be in accordance with the manufacturer’s protocol. All assays were performed in triplicate.
Briefly, after the treatments with goose primary hepatocytes, staining of intracellular lipids was performed using Oil Red O (Sigma) according to the manufacturer instructions. Oil Red O staining images were taken using a light microscope (Olympus Optical, Tokyo, Japan) at 200× magnification. For quantification of lipid accumulation, the Oil Red O-positive cells were extracted using 100% isopropanol for 10 min. The absorbance of the extracted dye was analyzed at a wavelength of 510 nM (BIO-RAD, USA).
Goose primary hepatocytes were seeded in the 24-well culture dish at a density of 2 × 10⁴ cells. To investigate the proportion of cells in the G0/G1, S, and G2M phases of the cell cycle, flow cytometric analysis were conducted. After the treatment, cells were collected and centrifuged (800 × g for 10 min) to obtain the cell pellet (106 cells/mL), which was resuspended in 100 µL of PBS (pH 7.4) with 10 µL RNase A (250 µg/mL) and 10 µL propidium iodide stain (100 µg/mL), followed by incubation at 4°C in the dark for 30 min. Subsequently, flow cytometry was performed using a FACScan (Becton-Dickinson, Franklin Lakes, NJ) with an argon laser (488 nm), and the data was collected and displayed using the FL2 channel. Cell proliferative index (PI) was calculated using the following formula: PI = (S + G2M)/(G0G1 + S + G2M) × 100.
Investigating DNA synthesis rate using BrdU assay
To assess DNA synthesis, we performed bromodeoxyuridine (BrdU) assay using ELISA kit of 5-Bromo-2-deoxyuridine cell proliferation assay (Roche, Indianapolis, IN). The detailed procedure followed as the previous experiment (Bashash et al., 2013). In brief, after the treatment, the cells were incubated for 24 h with 10 μM BrdU in culture medium. After the cells were washed and fixed. The cells were exposed to rabbit anti-BrdU antibody (1:100, Beijing Biosynthesis Biotechnology, China), then incubated with goat anti-rabbit Cy3-conjugated secondary antibody (1:300, Beijing Biosynthesis Biotechnology, China), and counterstained with 4’,6-diamidino-2-phenylindole (DAPI) finally. Cell were examined by the upright BH2 microscope system (Olympus, Tokyo, Japan), 3 visual fields of each experiment were randomly selected at 200× magnifications. Cell were quantified by counting BrdU-positive cells (green) and DAPI-positive cells (blue). The experiments were repeated three times.
Measurement of protein content in culture cells
Protein content of ACCα, FAS, Carnitine palmitoyltransferase 1 (CPT1), MTP, Cyclin D1 and p21 in culture cells was measured using ELISA kit (GBD, USA). Briefly, goose primary hepatocytes were seeded in the 96-well plates and treated with insulin, NVP-BEZ235 and pCDNA6.2/MIRNA/AMP-miRNA vectors. Subsequently, the cells were collected, further measurements will be in accordance with the manufacturer’s protocol. All assays were performed in triplicate.
Isolation of total RNA and real-time RT-PCR
Cultured cells total RNA was extracted using extraction kit (TRIzol Reagent) (Invitrogen, USA), and then RNA was transcribed into cDNA via reverse-transcription using the Primer Script TM RT system kit for real-time PCR (TaKaRa, Japan) as described by the manufacturer. The fluorescence quantitative PCR was performed on the CFX 96 instrument (Bio-Rad, USA), using a Takara ExTaq RT-PCR kit and SYBR Green as the detection dye (Takara, Japan); qRT-PCR reaction system contained the newly generated cDNA template (1.0 µL), SYBR Premix Ex Taq TM (6.0 µL), sterile water (4.0 µL), upstream primers of target genes (0.5 µL) and downstream primers of target genes (0.5 µL). After initial denaturation at 95°C for 5 min, 40 cycles were carried out: 95°C for 10 s, 60°C for 20 s, 72°C for 15 s and 72°C extension for 10 min. Fluorescence quantitative PCR Primers (BGI, Beijing, China) designed according to the goose gene sequences in current experiment were summarized in Suppl. Tab. S1. Fold change in the expression of target gene was analyzed using the 2−ΔΔCt method (Livak and Schmittgen, 2001). β-actin and 18S used as the internal reference gene. Each test included 3 biological samples and each sample was analyzed in triplicate.
Protein analysis by western blotting
Following the incubation with the different treatments, SDS buffer was used to extract total proteins from the harvested cells which were washed twice and collected in ice-cold PBS. The untreated cells were used as control. Equal amounts of total proteins (100 μg/lane) were separated by SDS-PAGE gel (6%) electrophoresis and transferred to a PVDF membrane. After blocking with a mixture of 5% skimmed milk/Tris-buffered saline Tween 20 (TBST), the membranes were incubated overnight at 4°C with the primary antibody rabbit against FoxO1, P-FoxO1(Ser256), Akt1, P-Akt1(Thr34), acetyl-CoA carboxylase (ACCα), carnitine palmitoyl-transferase (CPT1A), MTTP or Cyclin D1 antibodies (1:1,000; Beijing Biosynthesis Biotechnology, China); antibody information was listed in Suppl. Tab. S2. Following three consecutive washes in TBST (0.05%), the membranes were incubated with the goat anti-rabbit horseradish peroxidase-conjugated IgG at 1:2000 (Beijing Biosynthesis Biotechnology, China) for another 2 h at room temperature. The results were normalized to α-tubulin (Beijing Biosynthesis Biotechnology, China) protein levels. Protein expression levels were finally visualized using enhanced chemiluminescence (ECL) reagents (Beyotime Institute of Biotechnology, China). The western blot gray value was measured by integral optical density (IOD) measurement via Image Pro Plus 6.0 (Media Cybernetics, Bethesda, MD, USA); and western blot quantification was performed as the ratio of IOD value of treatment to IOD value of reference protein.
By using SAS 9.13 package (SAS Institute Inc, Cary, NC), the comparisons of multiple groups were analyzed by GLM, and the means were assessed for significant differences using the SNK-q test. All data were presented as means ± SD and showed with graphs created with GraphPad Prism 5.0 software (GraphPad Prism Software, Inc., USA). We considered P < 0.05 as statistically significant. Each detection was repeated with 3 biological samples, and each sample was performed thrice.
Effect of miRNA-FoxO1 interference on lipids metabolism and cell proliferation in goose hepatocytes
miRNA-FoxO1 interference increased the intracellular and extracellular TG concentration (P < 0.05), decreased the extracellular VLDL concentration (P < 0.05), and increased the lipids deposition in goose primary hepatocytes (Figs. 1A–1D; Suppl. Fig. S2). After miRNA-FoxO1 treatment, the mRNA expression level and protein content of ACCα and fatty acid synthetase (FAS) decreased (P < 0.05) (Figs. 1E, 1H, and 1I), the western blot result also showed the protein expression of ACCα decreased (Fig. 1L; Suppl. Fig. S6A), the mRNA expression level of liver X receptor α (LXRα) decreased (P < 0.05) (Fig. 1E). miRNA-FoxO1 interference decreased the mRNA expression level of CPT1 and acyl-CoA oxidase 1 (ACOX1) (P < 0.05) (Fig. 1F). The results of ELISA and western blot showed miRNA-FoxO1 interference decreased the protein content and protein expression of CPT1 (P < 0.05) (Figs. 1J and 1M; Suppl. Fig. S6B). miRNA-FoxO1 interference decreased the mRNA expression level of MTP and apolipoprotein B (ApoB) (P < 0.05), increased the mRNA expression level of diacylglycerol acyltransferase-1 (DGAT1) (P < 0.05) (Fig. 1G). The protein content of MTP decreased after FoxO1 interference (P < 0.05) (Figs. 1K and 1M; Suppl. Fig. S6C).

Figure 1: FoxO1 interference on cell lipid metabolism in goose primary hepatocytes. (A) Intracellular lipid contents. (B) Intracellular TG concentrations. (C) Extracellular TG concentrations. (D) Extracellular VLDL concentrations. (E) Relative mRNA level of FAS, SREBP-1, ACCα and LXRα which is related to lipogenesis. (F) Relative mRNA level of CPT1, ACOX1, PPARα and PPARγ which is related to fatty acid oxidation. (G) Relative mRNA level of ApoB, MTP, DGAT1 and DGAT2 which is related to lipids transportation. (H) Protein content of FAS. (I) Protein content of ACCα. (J) Protein content of CPT1. (K) Protein content of MTP. (L) Western blot result of the protein expression of ACCα. (M) Western blot result of the protein expression of CPT1. (N) Western blot result of the protein expression of MTP. Values are means ± SD (n = 3). Different lowercase letters in the same set indicate difference among treatments at P < 0.05. Con, Control treatment; miR-Con, miRNA-Control treatment; miR-F, miRNA-FoxO1 (FoxO1 miRNA interference vector) treatment; VLDL, very-low-density lipoprotein; TG, triglyceride; FoxO1, Forkhead box O1; FAS, fatty acid synthetase; SREBP-1, sterol regulatory element-binding proteins-1; ACCα, acetyl-CoA carboxylase; LXRα, liver X receptor α; CPT1, carnitine palmitoyltransferase; ACOX1, acyl-CoA oxidase 1; PPARα, peroxisome proliferators-activated receptor-α; PPARγ, peroxisome proliferators-activated receptor-γ; ApoB, apolipoprotein B; MTP, microsomal triglyceride transfer protein; DGAT1, diacylglycerol acyltransferase-1; DGAT2, diacylglycerol acyltransferase-2.
As shown in flow cytometric analysis (Fig. 2A), miRNA-FoxO1 interference increased PI from 48.47% to 59.86%. And it was consistent with the result of BrdU-incorporation assay, after the FoxO1 interference, the DNA synthesis rate and the BrdU-positive cells of treated cells increased (Figs. 2B and 2C; Suppl. Figs. S3 and S4). Figs. 2D and 2E summarized the effect of FoxO1 on protein content of Cyclin D1 and p21, miRNA-FoxO1 interference significantly increased the protein content of Cyclin D1, and significantly decreased the protein content of p21 (P < 0.05). The result of quantitative PCR showed the mRNA expression levels of Cyclin D1, Cyclin D2, Cyclin D3 increased significantly after the miRNA-FoxO1 interference (P < 0.05), and the mRNA expression levels of p21 and p27 decreased significantly (P < 0.05) (Figs. 2F and 2G). The result of western blot indicated the miRNA-FoxO1 interference increased the protein expression of Cyclin D1 (Fig. 2H; Suppl. Fig. S7A).

Figure 2: FoxO1 interference on cell proliferation in goose primary hepatocytes. (A) The proportion of cells in the G0/G1, S, and G2M phases of the cell cycle. Cells were examined by flow cytometer. (B) Rate of BrdU-positive cells, and results are expressed as the ratio of the number of BrdU-positive cells to DAPI-positive cells. (C) DNA synthesis rate detected by bromodeoxyuridine incorporation assay. (D) Protein content of Cyclin D1. (E) Protein content of p21. (F) Relative mRNA level of Cyclin D1, Cyclin D2 and Cyclin D3. (G) Relative mRNA level of p21 and p27. (H) Western blot result of the protein expression of Cyclin D1. The numbers “1, 2, 3” under the blot indicates the treatment of control, control miRNA vectors, and FoxO1 miRNA interference vectors, respectively. Values are means ± SD (n = 3). Different lowercase letters in the same set indicate difference among treatments at P < 0.05. Con, Control treatment; miR-Con, miRNA-Control treatment; miR-F, miRNA-FoxO1 (FoxO1 miRNA interference vector) treatment; PI, cell proliferative index; Brdu, 5-Bromo-2-deoxyuridine; DAPI, 4’,6-diamidino-2-phenylindole; p21, antioncogene p21 protein; p27, antioncogene p27 protein.
Role of FoxO1 in regulation of lipids metabolism and cell proliferation mediated by insulin
The results showed that insulin could significantly decrease the mRNA expression level of FoxO1 (P < 0.05) (Fig. 3A). The results of western blot indicated insulin decreased the protein expression of FoxO1 and increased the phosphorylation level of FoxO1 (Fig. 3B; Suppl. Fig. S5A). After the single insulin treatment, the lipids deposition increased (Figs. 4A–4D). However, in our present study, there was no significant difference in TG concentration and lipids drops between the insulin treatment and the co-treatment of insulin and miR-FoxO1 (Figs. 4A–4D; Suppl. Fig. S2). There was no significant difference in expression level of genes (CPT1, ACOX1, PPARα, PPARγ, MTP, ApoB, DGAT1 ) and protein content of CPT1 and MTP between the insulin treatment and the co-treatment with insulin and miR-FoxO1 (P > 0.05) (Figs. 4E–4K); The protein content and protein expression (ACCα, CPT1 and MTP) measured by ELISA and western blot was in accordance with the results of mRNA expression levels (Figs. 4L–4N; Suppl. Figs. S5D–S5F).

Figure 3: Effect of insulin on of FoxO1. (A) Effect of insulin on relative mRNA expression levels of FoxO1 gene. (B) Effect of insulin on protein expression of FoxO1 by western blot. Values are means ± SD (n = 3). Different lowercase letters in the same set indicate difference among treatments at P < 0.05. P-FoxO1, FoxO1 phosphorylation.

Figure 4: FoxO1 interference on lipid metabolism mediated by insulin in goose primary hepatocytes. (A) Intracellular lipid contents. (B) Intracellular TG concentrations. (C) Extracellular TG concentrations. (D) Extracellular VLDL concentrations. (E) Relative mRNA level of FAS, SREBP-1, ACCα and LXRα which is related to lipogenesis. (F) Relative mRNA level of CPT1, ACOX1, PPARα and PPARγ which is related to fatty acid oxidation. (G) Relative mRNA level of ApoB, MTP, DGAT1 and DGAT2 which is related to lipids transportation. (H) Protein content of FAS. (I) Protein content of ACCα. (J) Protein content of CPT1. (K) Protein content of MTP. (L) Western blot result of the protein expression of ACCα. (M) Western blot result of the protein expression of CPT1. (N) Western blot result of the protein expression of MTP. Values are means ± SD (n = 3). Different lowercase letters in the same set indicate difference among treatments at P < 0.05. Con, Control treatment; miR-Con, miRNA-Control treatment; miR-F, miRNA-FoxO1 (FoxO1 miRNA interference vector) treatment; insulin + miRNA-F, co-treatment of insulin and miRNA-FoxO1; VLDL, very low-density lipoprotein; TG, triglyceride; FoxO1, Forkhead box O1; FAS, fatty acid synthetase; SREBP-1, sterol regulatory element-binding proteins-1; ACCα, acetyl-CoA carboxylase; LXRα, liver X receptor α; CPT1, carnitine palmitoyltransferase; ACOX1, acyl-CoA oxidase 1; PPARα, peroxisome proliferators-activated receptor-α; PPARγ, peroxisome proliferators-activated receptor-γ; ApoB, apolipoprotein B; MTP, microsomal triglyceride transfer protein; DGAT1, diacylglycerol acyltransferase-1; DGAT2, diacylglycerol acyltransferase-2.
As shown in Fig. 5A, the addition of insulin increased the PI from 42% and 58.25%, thus insulin played a role in the regulation of cell proliferation. The result of the DNA synthesis rate of treated cells and BrdU stain all verified this viewpoint (Figs. 5B and 5C; Suppl. Figs. S3 and S4). The mRNA levels of Cyclin D1, Cyclin D2 and Cyclin D3 of the co-treatment with insulin and miRNA-FoxO1 were significantly higher than those of single insulin treatment or miRNA-FoxO1 (P < 0.05) (Figs. 5F and 5G). There was no significant difference in PI and protein content of p21 and p27 between the single insulin treatment or miRNA-FoxO1 and co-treatment of insulin and miRNA-FoxO1 (P > 0.05) (Figs. 5D and 5E). The result of western blot verified that the above three treatments all increased the protein expression of Cyclin D1 (Fig. 5H; Suppl. Fig. S7B).

Figure 5: FoxO1 interference on cell proliferation mediated by insulin in goose primary hepatocytes. (A) The proportion of cells in the G0/G1, S, and G2M phases of the cell cycle. Cells were examined by flow cytometer. (B) Rate of BrdU-positive cells, and results are expressed as the ratio of the number of BrdU-positive cells to the DAPI-positive cells. (C) DNA synthesis rate detected by bromodeoxyuridine incorporation assay. (D) Protein content of Cyclin D1. (E) Protein content of p21. (F) Relative mRNA level of Cyclin D1, Cyclin D2 and Cyclin D3. (G) Relative mRNA level of p21 and p27. (H) Western blot result of the protein expression of Cyclin D1. The numbers “1, 2, 3, 4” under the blot indicates the treatment of control, 150 nmol/L insulin, FoxO1 miRNA interference vectors, and 150 nmol/L insulin+FoxO1 miRNA interference vectors, respectively. Values are means ± SD (n = 3). Different lowercase letters in the same set indicate difference among treatments at P < 0.05. Con, Control treatment; miR-Con, miRNA-Control treatment; miR-F, miRNA-FoxO1 (FoxO1 miRNA interference vector) treatment; insulin + miRNA-F, co-treatment of insulin and miRNA-FoxO1; PI, cell proliferative index; Brdu, 5-bromo-2-deoxyuridine; DAPI, 4’,6-diamidino-2-phenylindole; p21, antioncogene p21 protein; p27, antioncogene p27 protein.
Role of FoxO1 in regulation of lipids metabolism and cell proliferation mediated by PI3K-Akt-mTOR signal pathway
Compared with the control group, NVP-BEZ235 treatment increased the mRNA level and protein expression of FoxO1 (P < 0.05) (Figs. 6A and 6B; Suppl. Fig. S5B); miRNA-FoxO1 interference increased the mRNA expression level of mTOR (P < 0.05) (Fig. 6C); the result of western blot indicated miRNA-FoxO1 interference decreased the phosphorylation level of Akt1 and increased the protein expression of Akt1 and mTORC1 (Figs. 6D and 6E; Suppl. Figs. S5C-S5D). Compared with the control group, NVP-BEZ235 increased the extracellular VLDL concentration, and decreased the lipids deposition in goose primary hepatocytes (P < 0.05) (Figs. 7A–7D). Compared with the NVP-BEZ235 treatment, the co-treatment of NVP-BEZ235 and miR-FoxO1 increased the lipids deposition, the intracellular and extracellular TG concentration (P < 0.05) and decreased of the extracellular VLDL concentration in hepatocytes (P < 0.05) (Figs. 7A–7D; Suppl. Fig. S2). The expression level of genes (FAS, SREBP-1, CPT1, ACOX1, PPARα, PPARγ, MTP, ApoB, DGAT1, and DGAT2) in the co-treatment with NVP-BZE235 and miRNA-FoxO1 were higher than those of the single NVP-BZE235 treatment (P < 0.05) (Figs. 7E–7G). The protein content and protein expression (ACCα, CPT1 and MTP) measured by ELISA and western blot was in accordance with the results of mRNA expression levels (Figs. 7H–7K and 7L–7N; Suppl. Figs. S6G–S6I).

Figure 6: Effect of NVP-BEZ235 on FoxO1 and effect of FoxO1 on PI3K-Akt-mTOR pathway. (A) Effect of NVP-BEZ235 on relative mRNA expression levels of FoxO1 gene. (B) Effect of NVP-BEZ235 on protein expression of FoxO1 by western blot. (C) Effect of FoxO1 on gene relative expression levels of PI3K, Akt1, mTOR and S6K1. (D) Effect of FoxO1 on protein expression of Akt and P-Akt by western blot. (E) Effect of FoxO1 on protein expression of mTOR by western blot. Values are means ± SD (n = 3). Different lowercase letters in the same set indicate difference among treatments at P < 0.05. P-FoxO1, FoxO1 phosphorylation. Con, Control treatment; miR-Con, miRNA-Control treatment; miR-F, miRNA-FoxO1 (FoxO1 miRNA interference vector) treatment; P-FoxO1, FoxO1 phosphorylation; P-Akt, Akt phosphorylation; NVP, NVP-BEZ235; PI3K, Phosphatidylinositide 3-kinases; Akt, protein kinase B (PKB); mTOR, mammalian target of rapamycin; S6K1, ribosomal S6 kinase. Akt1 phosphorylation sites is Thr 34; P-FoxO1 phosphorylation sites is Ser256.

Figure 7: FoxO1 interference on lipid metabolism mediated by PI3K-Akt-mTOR signal pathway in goose primary hepatocytes. (A) Intracellular lipid contents. (B) Intracellular TG concentrations. (C) Extracellular TG concentrations. (D) Extracellular VLDL concentrations. (E) Relative mRNA level of FAS, SREBP-1, ACCα and LXRα which is related to lipogenesis. (F) Relative mRNA level of CPT1, ACOX1, PPARα and PPARγ which is related to fatty acid oxidation. (G) Relative mRNA level of ApoB, MTP, DGAT1 and DGAT2 which is related to lipids transportation. (H) Protein content of FAS. (I) Protein content of ACCα. (J) Protein content of CPT1. (K) Protein content of MTP. (L) Western blot result of the protein expression of ACCα. (M) Western blot result of the protein expression of CPT1. (N) Western blot result of the protein expression of MTP. Values are means ± SD (n = 3). Different lowercase letters in the same set indicate difference among treatments at P < 0.05. Con, Control treatment; miR-Con, miRNA-Control treatment; miR-F, miRNA-FoxO1 (FoxO1 miRNA interference vector) treatment; NVP + miR-F, co-treatment of NVP-BEZ235 and miRNA-FoxO1; NVP, NVP-BEZ235; VLDL, very low-density lipoprotein; TG, triglyceride; FoxO1, Forkhead box O1; FAS, fatty acid synthetase; SREBP-1, sterol regulatory element-binding proteins-1; ACCα, acetyl-CoA carboxylase; LXRα, liver X receptor α; CPT1, carnitine palmitoyltransferase; ACOX1, acyl-CoA oxidase 1; PPARα, peroxisome proliferators-activated receptor-α; PPARγ, peroxisome proliferators-activated receptor-γ; ApoB, apolipoprotein B; MTP, microsomal triglyceride transfer protein; DGAT1, diacylglycerol acyltransferase-1; DGAT2, diacylglycerol acyltransferase-2; PI3K, Phosphatidylinositide 3-kinases; Akt1, protein kinase B (PKB); mTOR, mammalian target of rapamycin; S6K1, ribosomal S6 kinase.
As shown in Fig. 8A, compared with the control group, the treatment with dual inhibitor of PI3K-Akt-mTOR1 signal pathway, NVP-BEZ235, decreased the PI from 42% to 15.85%, and the treatment of miRNA-FoxO1 decreased the PI from 15.85% to 24.56%. The DNA synthesis rate of treated cells and the result of BrdU stain all indicated the NVP-BEZ235 treatment decreased the stimulating effect of miRNA-FoxO1 treatment (P < 0.05) (Figs. 8B–8C; Suppl. Figs. S3 and S4). As shown in Figs. 8D and 8E, the effect of co-treatment of NVP-BEZ235 and miRNA-FoxO1 on the protein content of Cyclin D1 and p21 was between the single NVP-BEZ235 treatment and the single miRNA-FoxO1 treatment (P < 0.05). Meanwhile, Figs. 8F and 8G showed that the mRNA expression levels of Cyclin D1, Cyclin D2 and Cyclin D3 were higher in the co-treatment of NVP-BEZ235 and miRNA-FoxO1 compared with the inhibiting effect of the NVP-BEZ235 treatment (P < 0.05); the mRNA expression level of p21 and p27 of the co-treatment with NVP-BEZ235 and miRNA-FoxO1 were lower than those of the NVP-BEZ235 treatment (P < 0.05). The change of protein expression of Cyclin D1 measured by western blot was in accordance with the result of mRNA expression level (Fig. 8H; Suppl. Fig. S7C).
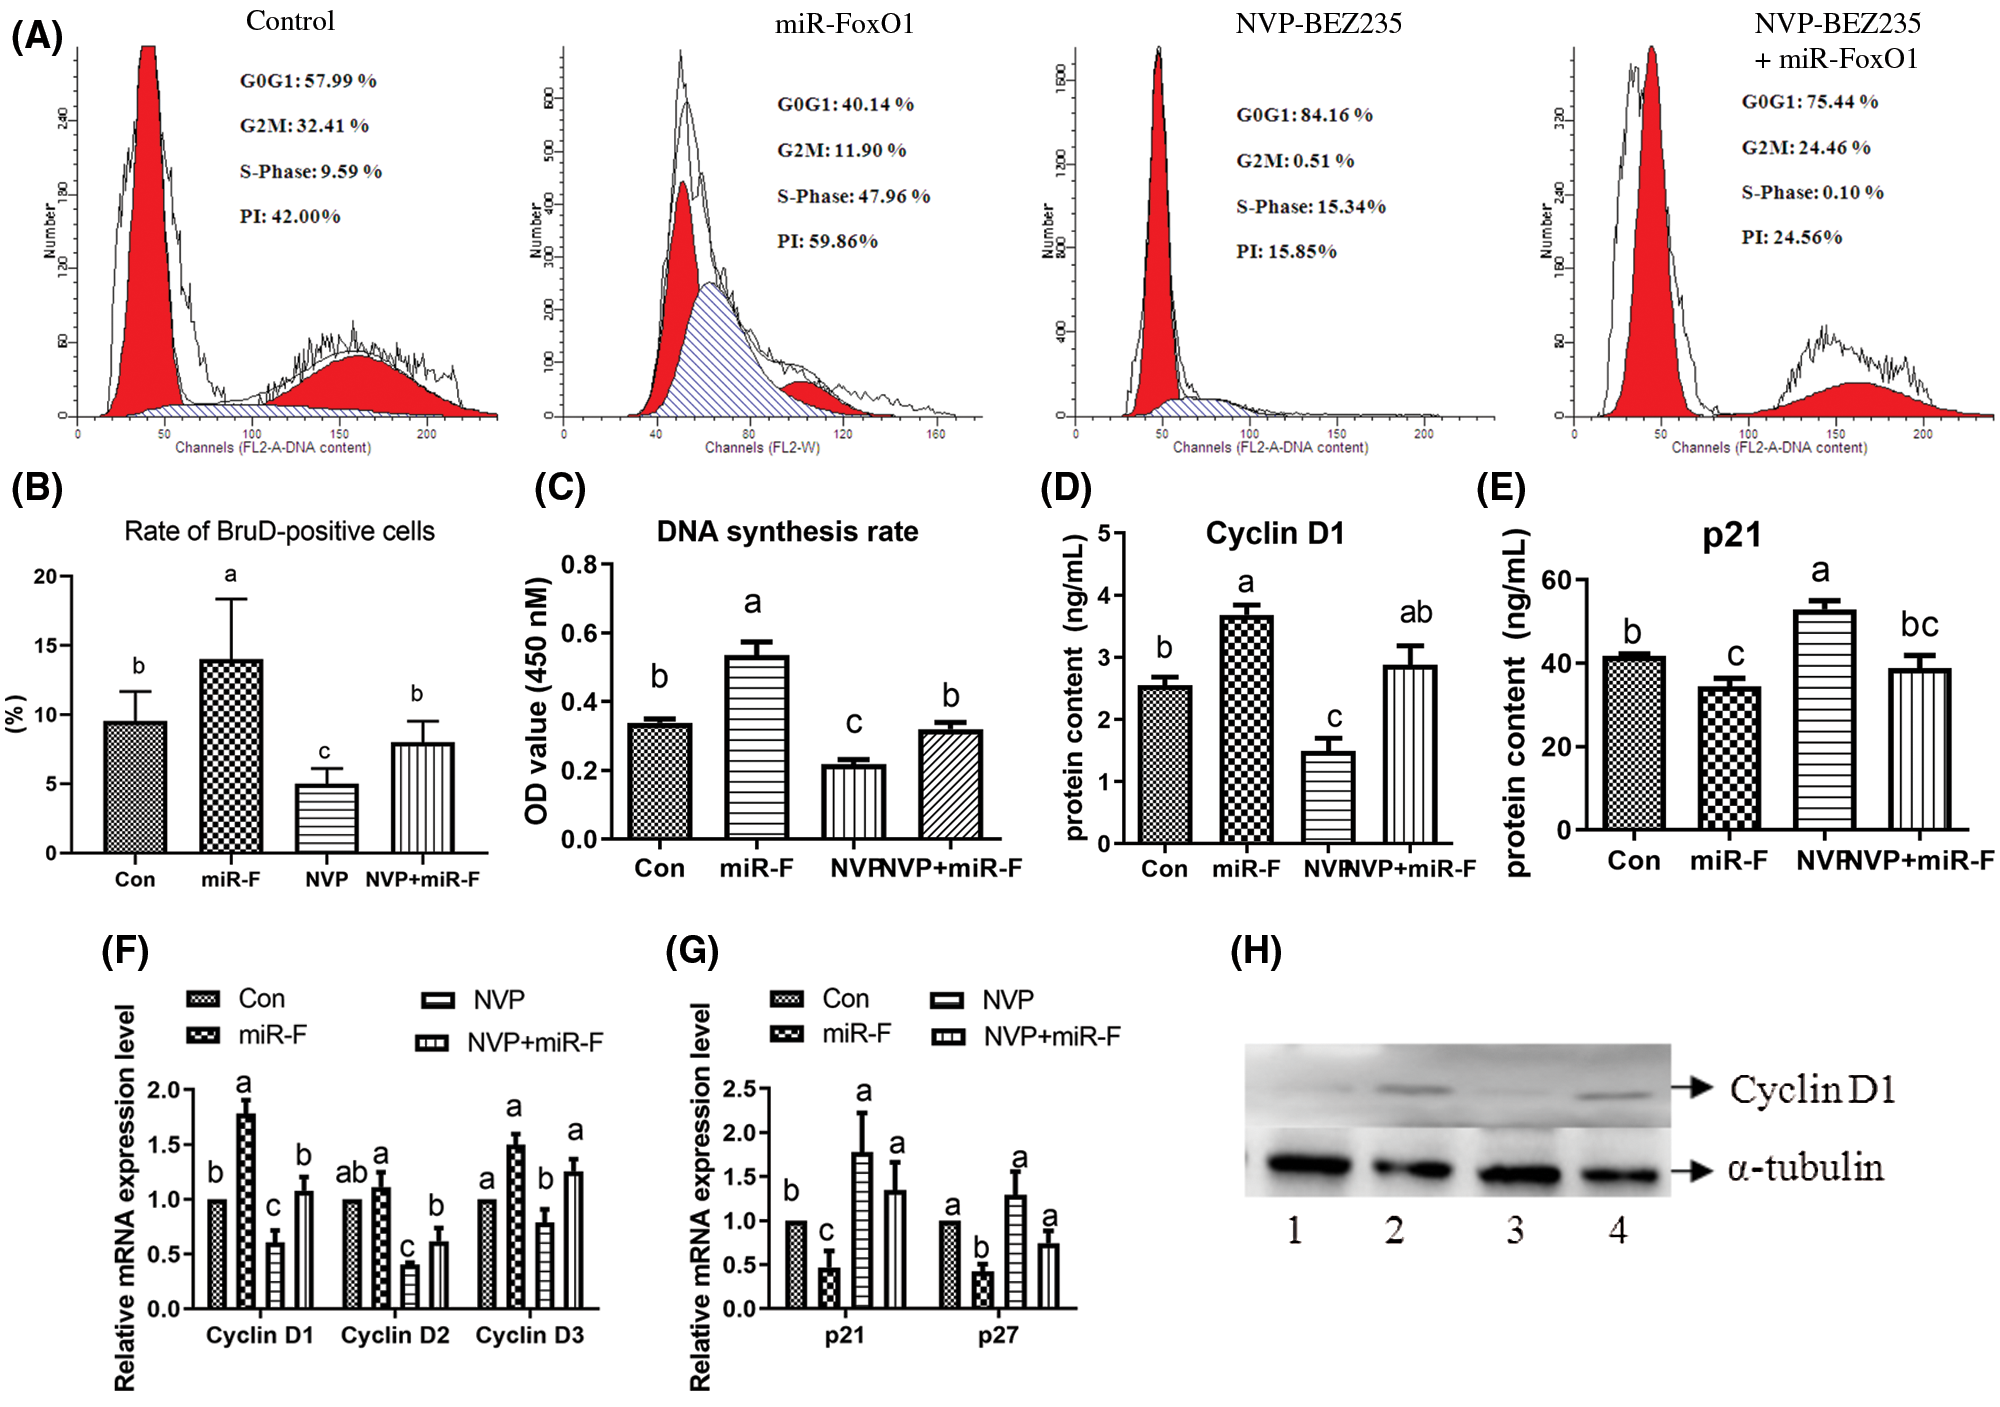
Figure 8: FoxO1 interference on cell proliferation mediated by PI3K-Akt-mTOR signal pathway in goose primary hepatocytes. (A) The proportion of cells in the G0/G1, S, and G2M phases of the cell cycle. Cells were examined by flow cytometer. (B) Rate of BrdU-positive cells, and results are expressed as the ratio of the number of BrdU-positive cells to the DAPI-positive cells. (C) DNA synthesis rate detected by bromodeoxyuridine incorporation assay. (D) Protein content of Cyclin D1. (E) Protein content of p21. (F) Relative mRNA level of Cyclin D1, Cyclin D2 and Cyclin D3. (G) Relative mRNA level of p21 and p27. (H) Western blot result of the protein expression of Cyclin D1. The numbers “1, 2, 3, 4” under the blot indicates the treatment of control, 1 μmol/L NVP-BEZ235, FoxO1 miRNA interference vectors, and 1 μmol/L NVP-BEZ235 + FoxO1 miRNA interference vectors, respectively. Values are means ± SD (n = 3). Different lowercase letters in the same set indicate difference among treatments at P < 0.05. Con, Control treatment; miR-Con, miRNA-Control treatment; miR-F, miRNA-FoxO1 (FoxO1 miRNA interference vector) treatment; NVP, NVP-BEZ235; NVP + miR-F, co-treatment of NVP-BEZ235 and miRNA-FoxO1; PI, cell proliferative index; Brdu, 5-Bromo-2-deoxyuridine; DAPI, 4’,6-diamidino-2-phenylindole; p21, antioncogene p21 protein; p27, antioncogene p27 protein.
When the content of TG produced far exceeded the transport capacity of apolipoproteins, and the fatty acid produced far exceeded the degraded fatty acid by β-oxidation, the accumulation of lipids occurred (Mun et al., 2019; Wei et al., 2021). FoxO1 is a critical regulator of hepatocyte lipid deposition, FoxO1 can regulate hepatic lipid metabolism from the lipid lipogenesis, fatty acids oxidation and lipids transportation (Liu et al., 2019). In current research, miRNA-FoxO1 interference decreased the relative gene expression and the protein content of CPT1 and ACOX1, which indicated that fatty acid oxidation decreased after FoxO1 interference, which is in line with a previous study that FoxO1 proteins exerted important effects on fatty acid oxidation via the regulation of adipose triacylglycerol lipase reported by Zhang et al. (2016). Zha et al. (2017) reported that regulating PI3K-Akt-Foxo1 signaling pathway mediated by insulin receptor substrate alleviated VLDL overproduction. In this study, FoxO1 interference decreased the gene expression of MTP and ApoB, decreased the protein content of MTP, decreased VLDL-TG secretion and increased the intracellular TG content, which led to excessive fat accumulation in the liver cells. Zhang et al. (2021) reported that FoxO1 mediated the lipogenesis and promoted the liver steatosis. Although the miRNA-FoxO1 interference decreased the expression of lipogenic genes (FAS, ACCα, and LXRα) and decreased the protein content of FAS and ACCα, the lipid deposition increased in goose primary hepatocytes in this study. The reason may be that the inhibition of the fatty acid oxidation and the intracellular TG outward transportation induced by FoxO1 interference was far more than the inhibition of lipogenesis pathways. Thereby, the miRNA-FoxO1 interference increased the lipids deposition in goose hepatocytes. A finding suggested that the forced FoxO1:S249V suppressed the cell growth through G2/M cell cycle arrests and increased the apoptosis in glioma (Piao et al., 2019). Transfection with siRNA for FoxO1 cancelled metformin-inhibited cell growth, indicating that FoxO1 mediated metformin to inhibit endometrial cancer cell proliferation (Zou et al., 2016). One report indicated that the hyperproliferation of mesangial cells in diabetic nephropathy rats was probably associated with FoxO1 (Ji et al., 2014). In this study, the specific inhibition of FoxO1 by miRNA-FoxO1 decreased the gene expression of cell-cycle negative regulators (p27 and p21) and increased the gene expression of cell-cycle regulators (Cyclin D family), resulting in the increase of the DNA synthesis and the cell proliferation in goose primary hepatocytes. Our findings suggested that the increased cell proliferation by inhibition of FoxO1 was consistent with its greater inhibitory effects on the expression of multiple cell cycle proteins (Yuan et al., 2014).
Hepatic insulin signaling plays a pivotal role in lipids metabolism. The formation of non-alcoholic fatty liver or goose fatty liver accompanies with the insulin resistance (Correnti et al., 2020; Wei et al., 2021). In this current study, insulin increased lipids deposition, which is consistent with the previous research reported by Han et al. (2015). As reported by Gao et al. (2018), insulin promoted the cell proliferation, and the result of this study was consistent with it. We also found the effect of the co-treatment of insulin and FoxO1 interference on the mRNA level of Cyclin D family was more evident than the other two single treatments. One research indicated that FoxO1 was reciprocally regulated to FoxK1/K2 following insulin stimulation and played a critical role in the control of apoptosis, metabolism, and mitochondrial function (Sakaguchi et al., 2019). These results indicated that insulin and FoxO1 interference might have a synergistic regulation of cell proliferation. FoxO1 integrated the insulin signaling and mediated the insulin-dependent regulation of MTP in regulating the hepatic VLDL-TG secretion (Kamagate and Dong, 2008; Kamagate et al., 2008). Skarra and Thackray (2015) reported that insulin administration in vivo induced the phosphorylation of FoxO1. Estradiol-17 (E2) increased the FoxO1 phosphorylation and promoted the cell proliferation (Shaklai et al., 2018). In this current study, we also found insulin increased the phosphorylation level of FoxO1. These results suggested that FoxO1 regulated the cell proliferation mediated by insulin, and there was an interaction between FoxO1 and insulin in goose primary hepatocytes. However, there was no significant difference in PI between insulin treatment and co-treatment of insulin and miR-FoxO1 interference, in addition, in our present study, there was no significant difference in the TG and lipids concentration between the insulin treatment and the co-treatment of insulin and miR-FoxO1 interference. The reason may be that the promotion on cell proliferation and lipid deposition by the miRNA-FoxO1 was similar to the promotion by insulin, there is a kind of competition between them (Onuma et al., 2006). In addition, previous research reported that in insulin-resistant high-fat-fed mice, FoxO1 phosphorylation was impaired, and insulin increased the lipogenic enzyme expression by activating SREBP-1c, and the insulin resistance increased selective impairment of the Akt-dependent FoxO1 phosphorylation in mice (Sajan et al., 2015; Sajan et al., 2018). Thereby, whether FoxO1 could regulate insulin-mediated lipids deposition and cell proliferation remains to be further researched.
There was an interaction between FoxO1, PI3K, Akt and mTOR in regulation of lipid metabolism and cell cycle. Previous analysis indicated that long non-coding RNA HCV regulated 1 (IncHR1) participates in the lipid metabolism in vivo and regulated the level of SREBP-1c protein through the phosphorylation of the PDK1-Akt-FoxO1 axis (Li et al., 2018). A previous study showed that orexin-A protected cells from apoptosis by regulating FoxO1 and mTORC1 through the OX1R/PI3K/AKT signaling pathway in hepatocytes (Ju et al., 2014). In lipid metabolism, miRNA-FoxO1 interference up-regulated the gene and protein expression of genes involved in the lipogenesis inhibited by NVP-BEZ235, down-regulated the protein expression of genes involved in the lipid transportation activated by NVP-BEZ235 and restored the intracellular lipid concentration to a normal level. In cell proliferation, the miRNA-FoxO1 interference up-regulated the gene and protein expression of cyclin D inhibited by NVP-BEZ235, down-regulated the gene and protein expression of p21 and p27 activated by NVP-BEZ235, increased the DNA synthesis rate and PI suppressed by NVP-BEZ235. These results indicated that FoxO1 regulated the lipid metabolism and cell proliferation mediated by PI3K-Akt-mTOR pathway. Phosphorylation of FoxO1 is one of the most important way how FoxO1 regulates cell metabolism pathway. In this current experiment, we also found PI3K-Akt-mTOR signal pathway dual inhibitor NVP-BEZ235 up-regulated the relative expression of FoxO1, and decreased phosphorylation of FoxO1 (Figs. 6A and 6B). Our previous study showed that PI3K-Akt-mTOR signal pathway played an important role in the lipid deposition in goose primary hepatocytes, and phosphorylated FoxO1 translocated from the nucleus to cytosol and lost its transcriptional activity in liver (Han et al., 2015). The cell proliferation, apoptosis and the cell cycle regulated by FoxO1 was part of the PI3K and MAPK signaling network, while this regulation was mostly activated by phosphorylation of FoxO1 (Wang et al., 2018). In this present study, we also found that three single sites, PI3K, Akt and mTOR, were influenced by the miRNA-FoxO1 interference (Figs. 6C–6E). These findings indicated that FoxO1 regulated the lipid metabolism and cell proliferation mediated by PI3K-Akt-mTOR pathway via the interaction between FoxO1 and PI3K-Akt-mTOR signal pathway in goose primary hepatocytes.
In summary, FoxO1 interference promoted lipid deposition and cell proliferation in goose primary hepatocytes; FoxO1 could mediate lipid metabolism and cell proliferation dependent on PI3K-Akt-mTOR signaling pathway in goose primary hepatocytes. However, whether FoxO1 could regulate insulin-mediated lipids deposition and cell proliferation remains to be further researched.
Abbreviations: FoxO1, Forkhead box O1; FAS, fatty acid synthetase; SREBP-1, sterol regulatory element-binding proteins-1; ACCα, acetyl-CoA carboxylase; LXRα, liver X receptor α; CPT1, carnitine palmitoyltransferase; ACOX1, acyl-CoA oxidase 1; PPARα, peroxisome proliferators-activated receptor-α; PPARγ, peroxisome proliferators-activated receptor-γ; ApoB, apolipoprotein B; MTP, microsomal triglyceride transfer protein; DGAT1, diacylglycerol acyltransferase-1; DGAT2, diacylglycerol acyltransferase-2; PI3K, phosphatidylinositide 3-kinases; Akt, protein kinase B (PKB); mTOR, mammalian target of rapamycin; S6K1, ribosomal S6 kinase; VLDL, very low-density lipoprotein; TG, triglyceride; p21, antioncogene p21 protein; p27, antioncogene p27 protein.
Author Contributions: Conceptualization, C.H., and S.W.; Methodology, H.X.; Formal Analysis, S.H., and X.Z.; Investigation, F.H. and F.Y.; Resources, L.L.; Writing—Original Draft Preparation, C.H., and S.W.; Writing—Review & Editing, R.W.; Project Administration, H.L.; Funding Acquisition, C.H. All authors have read and agreed to the published version of the manuscript.
Ethics Approval: All procedures in the present study were subject to approval by the Institutional Animal Care and Use Committee (IACUC) of Sichuan Agricultural University (Permit No. DKY-B20141401) and carried out in accordance with the approved guidelines.
Availability of Data and Materials: The supplement materials and original source data of this paper were up-loaded to Figshare, the Publicly available DOI at Figshare: https://doi.org/10.6084/m9.figshare.12731108.
Supplementary Material: The supplementary material is available online at DOI: https://10.32604/biocell.2022.015409.
Funding Statement: The work was supported by the National Natural Science Funds of China (No. 31672413), and the National Waterfowl Industrial Technology System (No. CARS-43-6).
Conflicts of Interest: We declare that all authors have no conflict of interest about this manuscript.
Bashash DH, Ghaffari S, Zaker F, Kazerani M, Hezave K (2013). BIBR 1532 increases arsenic trioxide-mediated apoptosis in acute promyelocytic leukemia cells: Therapeutic potential for APL. Anti-Cancer Agents in Medicinal Chemistry (Formerly Current Medicinal Chemistry-Anti-Cancer Agents) 13: 1115–1125. [Google Scholar]
Correnti J, Lin C, Brettschneider J, Kuriakose A, Jeon S et al. (2020). Liver-specific ceramide reduction alleviates steatosis and insulin resistance in alcohol-fed mice. Journal of Lipid Research 61: 983–994. [Google Scholar]
Chen J, Chen J, Huang J, Li Z, Gong Y et al. (2019). HIF-2α upregulation mediated by hypoxia promotes NAFLD-HCC progression by activating lipid synthesis via the PI3K-AKT-mTOR pathway. Aging 11: 10839. [Google Scholar]
Chen X, Chen S, Shen T, Yang W, Chen Q et al. (2020). Adropin regulates hepatic glucose production via PP2A/AMPK pathway in insulin-resistant hepatocytes. FASEB Journal 34: 10056–10072. [Google Scholar]
Cheng F, Han L, Xiao Y, Pan C, Li Y et al. (2019). D-chiro-Inositol ameliorates high fat diet-induced hepatic steatosis and insulin resistance via PKCε-PI3K/AKT pathway. Journal of Agricultural and Food Chemistry 67: 5957–5967. [Google Scholar]
Deng X, Zhang W, Insug O, Williams JB, Dong Q et al. (2012). FoxO1 inhibits sterol regulatory element-binding protein-1c (SREBP-1c) gene expression via transcription factors Sp1 and SREBP-1c. Journal of Biological Chemistry 287: 20132–20143. [Google Scholar]
Ding HR, Tang ZT, Tang N, Zhu ZY, Liu HY et al. (2020). Protective properties of FOXO1 inhibition in a murine model of non-alcoholic fatty liver disease are associated with attenuation of ER stress and necroptosis. Frontiers in Physiology 11: 177. [Google Scholar]
Elhafiz M, Zhao G, Ismail M, Xu D, Das D et al. (2020). Imbalanced insulin substrate-1 and insulin substrate-2 signaling trigger hepatic steatosis in vitamin D deficient rats: 8-methoxypsoralen, a vitamin D receptor ligand with a promising anti-steatotic action. Biochimica et Biophysica Acta (BBA)-Molecular and Cell Biology of Lipids 1865: 158657. [Google Scholar]
Gao Y, Shi L, Cao Z, Zhu X, Li F et al. (2018). Telocinobufagin inhibits the epithelial-mesenchymal transition of breast cancer cells through the phosphoinositide 3-kinase/protein kinase B/extracellular signal-regulated kinase/Snail signaling pathway. Oncology Letters 15: 7837–7845. [Google Scholar]
Han C, Wei S, He F, Liu D, Wan H et al. (2015). The regulation of lipid deposition by insulin in goose liver cells is mediated by the PI3K-AKT-mTOR signaling pathway. PLoS One 10: e0098759. [Google Scholar]
Han C, Wei S, Song Q, He F, Xiong X et al. (2016). Insulin stimulates goose liver cell growth by activating PI3K-AKT-mTOR signal pathway. Cellular Physiology and Biochemistry 38: 558–570. [Google Scholar]
He L, Gomes AP, Wang X, Yoon SO, Lee G et al. (2018). mTORC1 promotes metabolic reprogramming by the suppression of GSK3-dependent Foxk1 phosphorylation. Molecular Cell 70: 949–960. [Google Scholar]
Huang P, Wang F, Yang Y, Lai W, Meng M et al. (2019). Hematopoietic-specific deletion of FoxO1 promotes NK cell specification and proliferation. Frontiers in Immunology 10: 1016. [Google Scholar]
Jeong B, Park JW, Kim JG, Lee BJ (2019). FOXO1 functions in the regulation of nicotinamide phosphoribosyltransferase (Nampt) expression. Biochemical and Biophysical Research Communications 511: 398–403. [Google Scholar]
Ji H, Wu L, Ma X, Ma X, Qin G (2014). The effect of resveratrol on the expression of AdipoR1 in kidneys of diabetic nephropathy. Molecular Biology Reports 41: 2151–2159. [Google Scholar]
Ju SJ, Zhao Y, Chang X, Guo L (2014). Orexin A protects cells from apoptosis by regulating FoxO1 and mTORC1 through the OX1R/PI3K/AKT signaling pathway in hepatocytes. International Journal of Molecular Medicine 34: 153–159. [Google Scholar]
Jung SM, Hung CM, Hildebrand SR, Sanchez-Gurmaches J, Martinez-Pastor B et al. (2019). Non-canonical mTORC2 signaling regulates brown adipocyte lipid catabolism through SIRT6-FoxO1. Molecular Cell 75: 807–822. [Google Scholar]
Kamagate A, Dong HH (2008). FoxO1 integrates insulin signaling to VLDL production. Cell Cycle 7: 3162–3170. [Google Scholar]
Kamagate A, Qu S, Perdomo G, Su D, Kim DH et al. (2008). FoxO1 mediates insulin-dependent regulation of hepatic VLDL production in mice. Journal of Clinical Investigation 118: 2347–2364. [Google Scholar]
Kapahi P, Chen D, Rogers AN, Katewa SD, Li PWL et al. (2010). With TOR, less is more: A key role for the conserved nutrient-sensing TOR pathway in aging. Cell Metabolism 11: 453–465. [Google Scholar]
Kim-Muller JY, Kim YJR, Fan J, Zhao S, Banks AS et al. (2016). FoxO1 deacetylation decreases fatty acid oxidation in β-cells and sustains insulin secretion in diabetes. Journal of Biological Chemistry 291: 10162–10172. [Google Scholar]
Li D, Guo L, Deng B, Li M, Yang T et al. (2018). Long non-coding RNA HR1 participates in the expression of SREBP-1c through phosphorylation of the PDK1/AKT/FoxO1 pathway. Molecular Medicine Reports 18: 2850–2856. [Google Scholar]
Liu L, Zhao X, Wang Q, Sun X, Xia L et al. (2016). Prosteatotic and protective components in a unique model of fatty liver: Gut microbiota and suppressed complement system. Scientific Reports 6: 31763. [Google Scholar]
Liu YZ, Peng W, Chen JK, Su WJ, Yan WJ et al. (2019). FoxO1 is a critical regulator of hepatocyte lipid deposition in chronic stress mice. PeerJ 7: e7668. [Google Scholar]
Livak KJ, Schmittgen TD (2001). Analysis of relative gene expression data using real-time quantitative PCR and the 2−ΔΔCT method. Methods 25: 402–408. [Google Scholar]
Mun J, Park J, Yoon HG, You Y, Choi KC et al. (2019). Effects of Eriobotrya japonica water extract on alcoholic and nonalcoholic fatty liver impairment. Journal of Medicinal Food 22: 1262–1270. [Google Scholar]
Mutt SJ, Raza GS, Mäkinen MJ, Keinänen-Kiukaanniemi S, Järvelin MR, Herzig KH (2020). Vitamin D deficiency induces insulin resistance and re-supplementation attenuates hepatic glucose output via the PI3K-AKT-FOXO1 mediated pathway. Molecular Nutrition & Food Research 64: 1900728. [Google Scholar]
Onuma H, Vander Kooi BT, Boustead JN, Oeser JK, O’brien RM (2006). Correlation between FOXO1a (FKHR) and FOXO3a (FKHRL1) binding and the inhibition of basal glucose-6-phosphatase catalytic subunit gene transcription by insulin. Molecular Endocrinology 20: 2831–2847. [Google Scholar]
Piao XY, Li W, Li Z, Zhang N, Fang H et al. (2019). Forced FoxO1: S249V expression suppressed glioma cell proliferation through G2/M cell cycle arrests and increased apoptosis. Neurological Research 41: 189–198. [Google Scholar]
Puentes Y, Yerges-Armstrong LM, Powell CC, Bielak LF, Feitosa MF et al. (2014). 697 Novel approach reveals that genetic variation in/near FXR/RXR pathway genes predisposes to nonalcoholic fatty liver disease in humans. Gastroenterology 146: S–923. [Google Scholar]
Sajan MP, Ivey RA, Lee MC, Farese RV (2015). Hepatic insulin resistance in ob/ob mice involves increases in ceramide, aPKC activity, and selective impairment of Akt-dependent FoxO1 phosphorylation. Journal of Lipid Research 56: 70–80. [Google Scholar]
Sajan MP, Lee MC, Foufelle F, Sajan J, Cleland C, Farese RV (2018). Coordinated regulation of hepatic FoxO1, PGC-1α and SREBP-1c facilitates insulin action and resistance. Cellular Signalling 43: 62–70. [Google Scholar]
Sakaguchi M, Cai W, Wang CH, Cederquist CT, Damasio M et al. (2019). FoxK1 and FoxK2 in insulin regulation of cellular and mitochondrial metabolism. Nature Communications 10: 1582. [Google Scholar]
Seglen PO (1976). Preparation of isolated rat liver cells. Methods in Cell Biology 13: 29–83. [Google Scholar]
Shaklai S, Grafi-Cohen M, Sharon O, Sagiv N, Shefer G et al. (2018). Pancreatic beta-cell proliferation induced by estradiol-17β is Foxo1 dependent. Hormone and Metabolic Research 50: 485–490. [Google Scholar]
Shi HJ, Li XF, Xu C, Zhang D, Zhang L et al. (2020). Nicotinamide improves the growth performance, intermediary metabolism and glucose homeostasis of blunt snout bream Megalobrama amblycephala fed high-carbohydrate diets. Aquaculture Nutrition 26: 1311–1328. [Google Scholar]
Shu L, Zhao H, Huang W, Hou G, Song G, Ma H (2020). Resveratrol upregulates mmu-miR-363-3p via the PI3K-Akt pathway to improve insulin resistance induced by a high-fat diet in mice. Diabetes, Metabolic Syndrome and Obesity: Targets and Therapy 13: 391. [Google Scholar]
Skarra DV, Thackray VG (2015). FOXO1 is regulated by insulin and IGF1 in pituitary gonadotropes. Molecular and Cellular Endocrinology 405: 14–24. [Google Scholar]
Wang T, Zhao H, Gao H, Zhu C, Xu Y et al. (2018). Expression and phosphorylation of FOXO1 influences cell proliferation and apoptosis in the gastrointestinal stromal tumor cell line GIST-T1. Experimental and Therapeutic Medicine 15: 3197–3202. [Google Scholar]
Wei R, Han C, Deng D, Ye F, Gan X et al. (2021). Research progress into the physiological changes in metabolic pathways in waterfowl with hepatic steatosis. British Poultry Science 62: 118–124. [Google Scholar]
Xing L, Zhang X, Feng H, Liu S, Li D et al. (2019). Silencing FOXO1 attenuates dexamethasone-induced apoptosis in osteoblastic MC3T3-E1 cells. Biochemical and Biophysical Research Communications 513: 1019–1026. [Google Scholar]
Yu H, Zhang L, Chen P, Liang X, Cao A et al. (2019). Dietary bile acids enhance growth, and alleviate hepatic fibrosis induced by a high starch diet via AKT/FOXO1 and cAMP/AMPK/SREBP1 pathway in micropterus salmoides. Frontiers in Physiology 10: 1430. [Google Scholar]
Yuan C, Wang L, Zhou L, Fu Z (2014). The function of FOXO1 in the late phases of the cell cycle is suppressed by PLK1-mediated phosphorylation. Cell Cycle 13: 807–819. [Google Scholar]
Zangerolamo L, Soares GM, Vettorazzi JF, Do Amaral ME, Carneiro EM et al. (2019). ARHGAP21 deficiency impairs hepatic lipid metabolism and improves insulin signaling in lean and obese mice. Canadian Journal of Physiology and Pharmacology 97: 1018–1027. [Google Scholar]
Zeng FY, Cui J, Liu L, Chen T (2009). PAX3-FKHR sensitizes human alveolar rhabdomyosarcoma cells to camptothecin-mediated growth inhibition and apoptosis. Cancer Letters 284: 157–164. [Google Scholar]
Zha XQ, Zhang WN, Peng FH, Xue L, Liu J, Luo JP (2017). Alleviating VLDL overproduction is an important mechanism for Laminaria japonica polysaccharide to inhibit atherosclerosis in LDLr−/− mice with diet-induced insulin resistance. Molecular Nutrition & Food Research 61: 1600456. [Google Scholar]
Zhang L, Zhang Z, Li C, Zhu T, Gao J et al. (2021). S100A11 promotes liver steatosis via FOXO1-mediated autophagy and lipogenesis. Cellular and Molecular Gastroenterology and Hepatology 11: 697–724. [Google Scholar]
Zhang W, Bu SY, Mashek MT, Insug O, Sibai Z et al. (2016). Integrated regulation of hepatic lipid and glucose metabolism by adipose triacylglycerol lipase and FoxO proteins. Cell Reports 15: 349–359. [Google Scholar]
Zou J, Hong L, Luo C, Li Z, Zhu Y et al. (2016). Metformin inhibits estrogen-dependent endometrial cancer cell growth by activating the AMPK-FOXO 1 signal pathway. Cancer Science 107: 1806–1817. [Google Scholar]
 | This work is licensed under a Creative Commons Attribution 4.0 International License, which permits unrestricted use, distribution, and reproduction in any medium, provided the original work is properly cited. |