DOI:10.32604/biocell.2021.016203
| BIOCELL DOI:10.32604/biocell.2021.016203 | |
| Article |
Immune prognostic implications of PSMD14 and its associated genes signatures in hepatocellular carcinoma
1Department of Medical Oncology, Affiliated Jinling Hospital, Medical School of Nanjing University, Nanjing, 210008, China
2Department of Medical Oncology, Jinling Hospital, Nanjing Medical University, Nanjing, 210008, China
*Address correspondence to: Rui Wang, wangrui218@163.com
Received: 17 February 2021; Accepted: 06 May 2021
Abstract: PSMD14 played a vital role in initiation and progression of hepatocellular carcinoma (HCC). However, PSMD14 and its-related genes for the immune prognostic implications of HCC patients have rarely been analyzed. Messenger RNA expression profiles and clinicopathological data were downloaded from The Cancer Genome Atlas (TCGA) and International Cancer Genome Consortium (ICGC) database-Liver Hepatocellular Carcinoma (LIHC). Additionally, we used multi-dimensional bioinformatics analysis to construct and validate a PSMD14-based immune prognostic signature (including RBM45, PSMD1, OLA1, CCT6A, LCAT and IVD) for HCC prognosis prediction. Patients in the high-risk group shown significantly poorer survival than patients in the low-risk group. Calibration curves confirmed the good consistency between the clinical nomogram prediction and the actual observation. Gene set enrichment analyses (GSEA) revealed several significantly enriched pathways, which might help explain the underlying mechanisms. Besides, the rt-PCR further validates the expression of seven immune genes in HCC cells. Our study identified a novel PSMD14-based signature for HCC prognosis prediction, it provided new potential prognostic biomarkers and therapeutic targets for immunotherapy of HCC.
Keywords: Hepatocellular carcinoma; PSMD14; TCGA; ICGC; Prognosis; Immune prognostic model
Abbreviations
| AUC: | area under the curve |
| CHOL: | cholangiocarcinoma |
| C-index: | concordance index |
| FLC: | fibrolamellar carcinoma |
| GO: | gene ontology |
| GSEA: | gene set enrichment analysis |
| HCC: | hepatocellular carcinoma |
| HL: | hepatic lobectomy |
| HR: | hazard ratio |
| ICGC: | international cancer genome consortium |
| KEGG: | kyoto encyclopedia of genes and genomes |
| LASSO: | least absolute shrinkage and selection operator |
| OS: | overall survival |
| ROC: | receiver operating characteristics |
| SSLR: | single segment liver resection |
| TCGA: | the cancer genome atlas |
| TIC: | tumor-infiltrating immune cell |
Hepatocellular carcinoma (HCC) is one of the most common malignancy in the world and the high rate of metastasis is a vital biological feature that leads to unfavorable prognosis (Long et al., 2019; Rimassa et al., 2019). Although surgery, radiofrequency ablation and chemoembolization have been widely applied for HCC treatment, the survival rate of HCC patients is still low, partly due to high heterogeneity of HCC (Cai et al., 2019; Shi et al., 2020). Furthermore, due to the fact that biological processes involved in the occurrence and progression of HCC are very complicated, no effective prognostic biomarker have yet been found (Pan et al., 2020). Therefore, it is necessary to explore the new HCC-related molecules for the diagnosis, prognosis, and treatment of HCC.
The deubiquitinase (DUB) 26S proteasome non-ATPase regulatory subunit 14 (PSMD14), belongs to the JAMM domain metalloprotease family of DUBs and is an important part of 19S regulatory cap in 26S proteasome (Lv et al., 2020). PSMD14 has been confirmed to play vital roles in gene ontology and related pathway, including protein stability (Seo et al., 2019), tumor formation (Wang et al., 2015), transcriptional regulation (Wang et al., 2019), double-strand DNA break repair (Butler et al., 2012), senescence (Byrne et al., 2010), apoptosis and resistance (Song et al., 2017), growth and metastasis (Lv et al., 2020), BMP6 signaling (Seo et al., 2019), TGF-β signaling (Wang et al., 2019). Recently, it has been found that PSMD14 is overexpressed in many human cancers, such as HCC, colorectal cancer, multiple myeloma, esophageal squamous cell carcinoma and breast cancer, which are related to the poor prognosis of the patients (Luo et al., 2017; Lv et al., 2020; Seo et al., 2019; Song et al., 2017; Zhu et al., 2018). PSMD14 acts as an oncogene promotes tumor progression by deubiquitinating different protein substrates. For example, deubiquitinase PSMD14 positively regulates the initiation of the BMP6 signaling pathway, resulting in increased stability of the ALK2. Either PSMD14 or ALK2 depletion significantly decreases colorectal cancer growth and chemoresistance (Seo et al., 2019). In addition, PSMD14 can stabilizes and inhibits the degradation of GRB2 through deubiquitination, which is an oncoprotein enhances hepatocellular carcinoma growth and metastasis (Lv et al., 2020). At the same time, we found that PSMD14 deubiquitinates the TGF-β receptors and CAV1, contributes to hyperactivation of TGF-β signaling and facilitates hepatocellular carcinoma metastasis, which it negatively regulates lysosome pathway-mediated turnover of TGF-β receptors (Wang et al., 2019). Other mechanisms of the contribution of PSMD14 in the progression of HCC remains to be further explored.
Here, we evaluated PSMD14 mRNA and protein levels and prognostic value in multiple databases and found that increased PSMD14 expression is associated with poor survival of HCC. Moreover, we screened prognostic genes signature closely related to PSMD14 through bioinformatics analysis then constructed the PSMD14-related prognostic model. We validated our model both in The Cancer Genome Atlas (TCGA) and independent International Cancer Genome Consortium (ICGC) database. At last, we confirmed the correlation between PSMD14 expression with clinicopathological characteristics, signatures (RBM45, PSMD1, OLA1, CCT6A, LCAT and IVD) and immune infiltration of hepatocellular carcinoma patients. In conclusion, our study confirms the important role of PSMD14 and its associated genes in HCC as well as correlated with prognosis and immune infiltrating levels in HCC patients, providing new insights relevant to individualized treatment.
Human HCC cell lines, HepG2 and Hep3B, were obtained from the Shanghai Cell Bank of the Chinese Academy of Sciences (Shanghai, China). The liver cell line, L02, was purchased from Chen Xi Research Group Nanjing University School of the college of Life Sciences. Each cell line was cultured in Dulbecco’s modified Eagle medium (DMEM, Invitrogen, USA) supplemented with 10% fetal bovine serum (FBS, Hyclone) as well as 100 ug/mL penicillin and 100 ug/mL streptomycin. All of the cells were maintained in a humidified incubator at 37°C with 5% CO2.
RNA extraction and quantitative real-time PCR
Total RNA was isolated from the cultured cells using Trizol reagent (Invitrogen, Carlsbad, CA, USA) according to the manufacturer’s instructions. The concentration of extracted RNA was measured using a NanoDrop ND-1000 Spectrophotometer (Agilent, Santa Clara, CA, USA). RNA was reverse transcribed into complementary DNA (cDNA) using the PrimeScript RT reagent kit with gDNA Eraser (Takara, Dalian, China) by incubating the mixture at 37°C for 15 min, 85°C for 5 s at 4°C. When the temperature reaches 4°C this process ends.
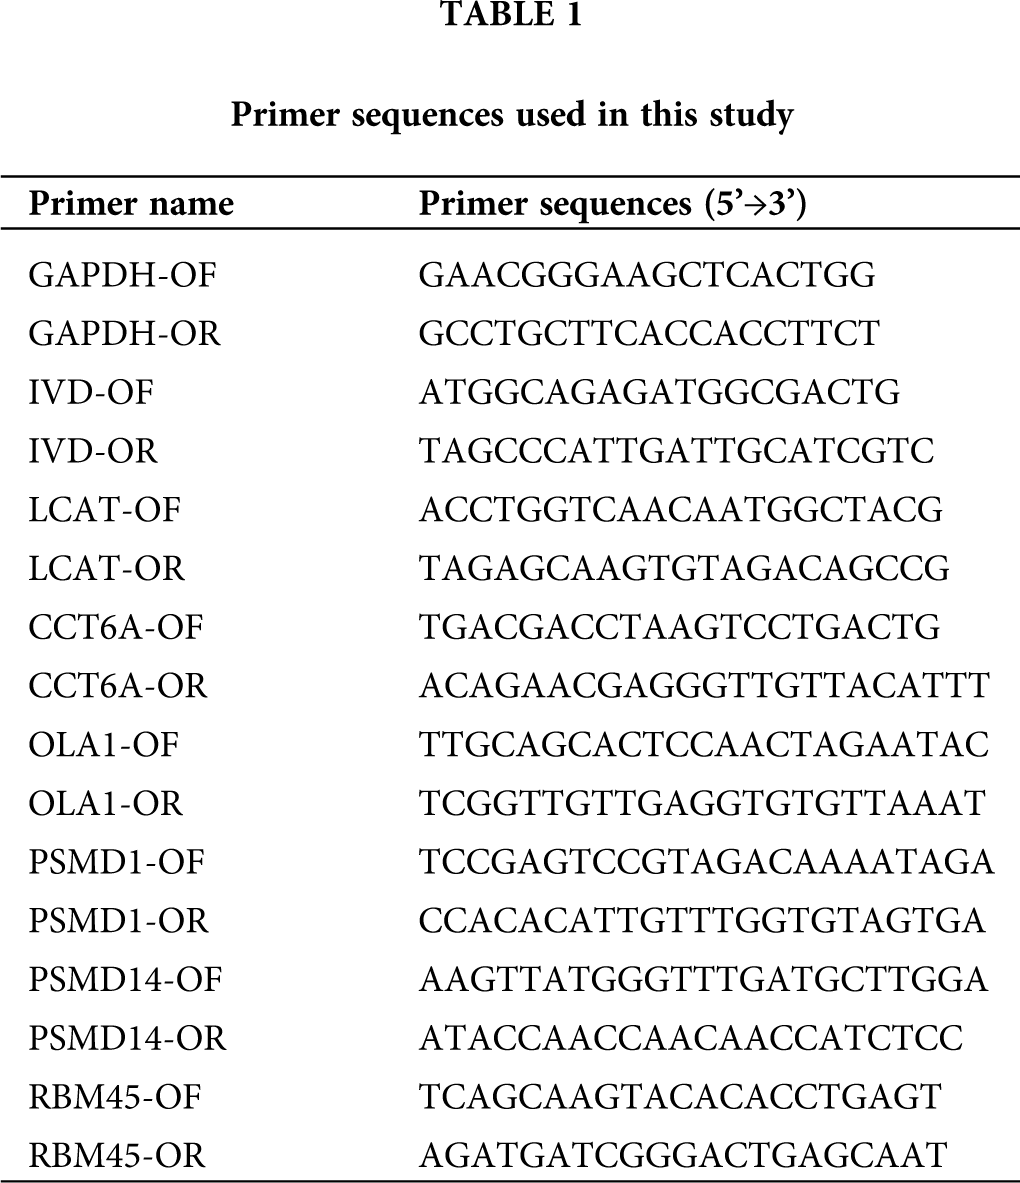
Quantitative PCR (qPCR) was performed using the SYBR PrimeScript RT-PCR kit (Takara, Shiga, Japan) and the ABI 7500 System (Applied Biosystems, Foster City, CA, USA) according to manufacturer’s instructions. The relative expression was calculated via the comparative cycle threshold (CT) method and was normalized to the expression of GAPDH. The primers used are listed in Tab. 1. Reaction conditions were as follows: 95°C for 30 s, followed by 40 cycles of 95°C for 5 s and 60°C for 34 s. The differential expression level was calculated using the 2−ΔΔCt formula. All the experiments were conducted at least three times.
PSMD14 expression levels were identified in the Oncomine database (https://www.oncomine.org/resource/login.html) in various type of cancers. The data was defined as a P-value of 0.01, a fold change of 1.5, a top 10% gene ranking, and the data has to be from mRNA.
PSMD14 mRNA expression and survival in public databases
To investigate the expression level and prognostic role of PSMD14 mRNA in HCC, the Human Protein Atlas database (http://www.proteinatlas.org), LinkedOmics (http://www.linkedomics.org/admin.php), the Cancer Genome Atlas (TCGA) database (http://cancergenome.nih.gov/), the International Cancer Genome Consortium (ICGC) database (https://dcc.icgc.org/) were used.
We analyzed the correlation between signature genes expression and 6 types of immune infiltrating cells (B cells, CD4+ T cells, CD8+ T cells, neutrophils, macrophages, and dendritic cells) in HCC patients via The Tumor Immune Estimation Resource (TIMER) algorithm database (https://cistrome. shinyapps.io/timer/). Tumor purity is a vital factor that influences the analysis of tumor immune infiltration by genomic approaches.
Tumor-infiltrating immune cell
The CIBERSORT computational method was applied for estimating the TIC (tumor-infiltrating immune cell) abundance profile in all tumor samples, which followed by quality filtering that only 374 tumor samples with P < 0.05 were selected for the following analysis.
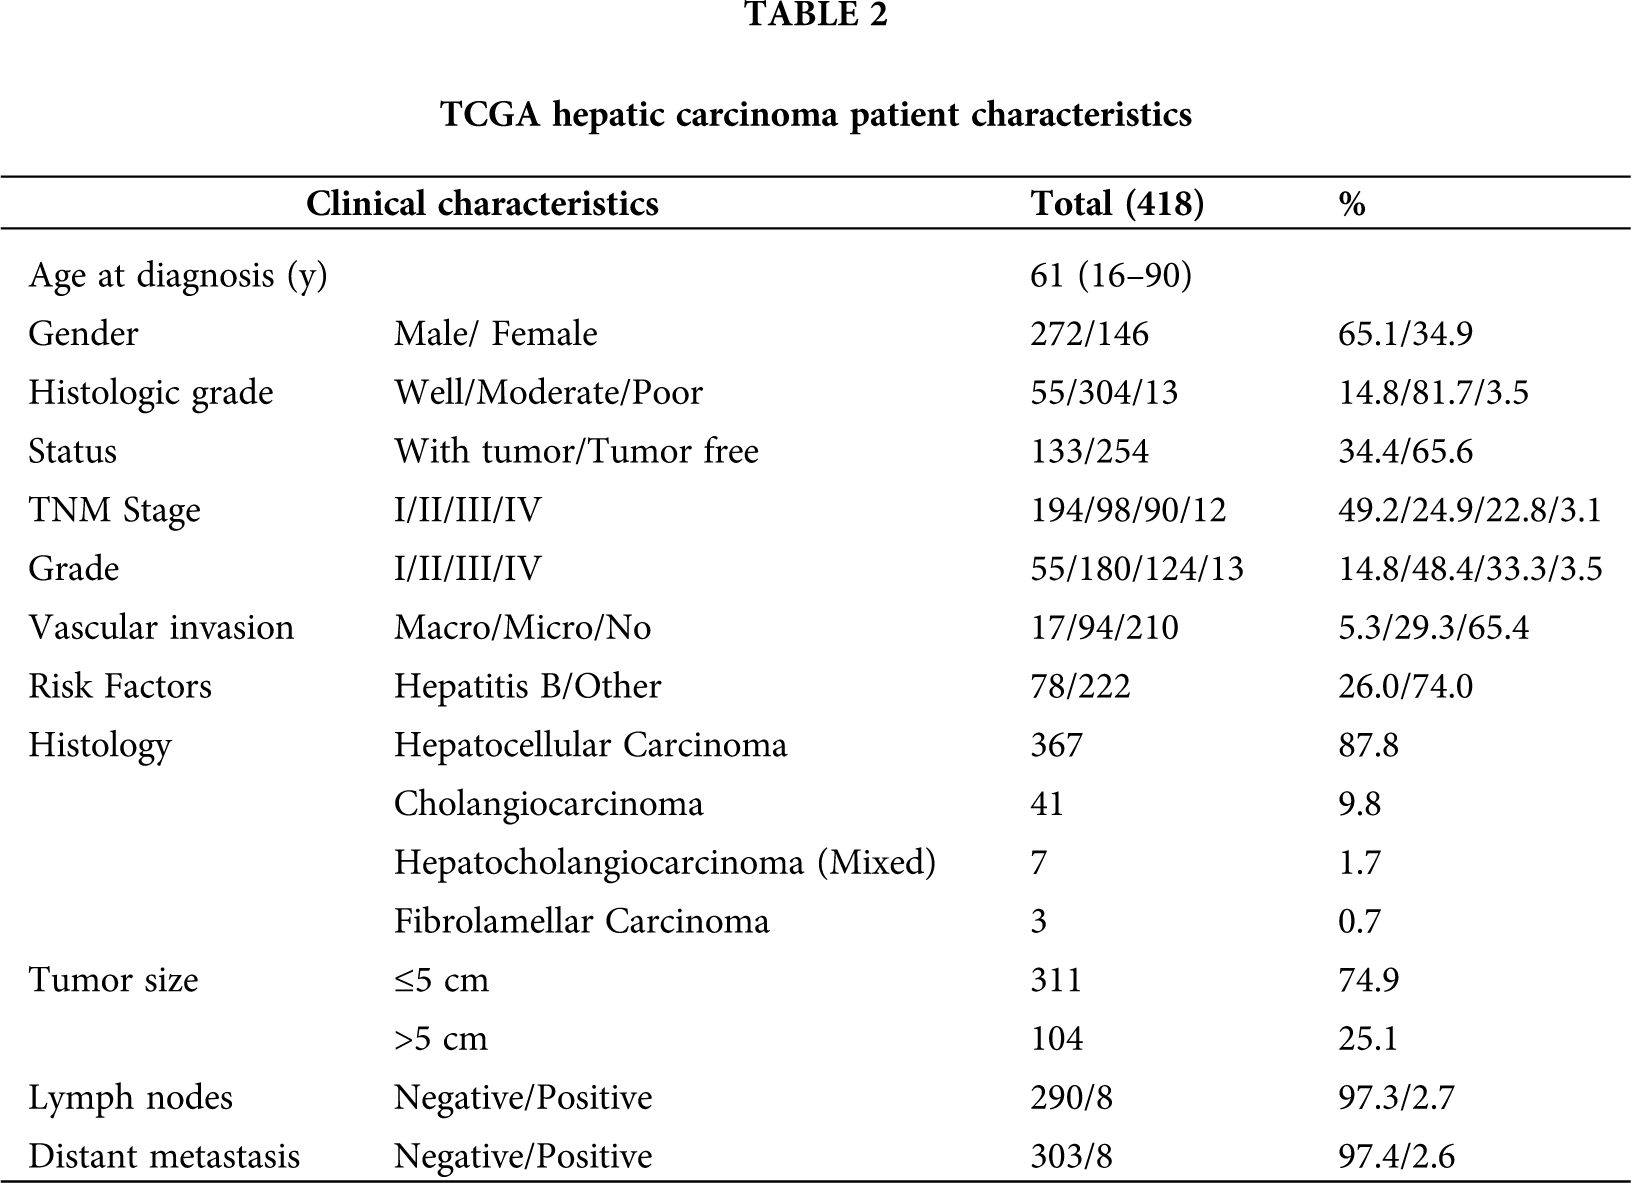
RNA-sequencing and clinical information for hepatic carcinoma were acquired from TCGA and ICGC database. The clinical features of patients with hepatic carcinoma in the TCGA cohorts are presented in Tab. 2.
Selection of immune-related prognostic genes
Genes significantly associated with PSMD14 (Pearson |R| > 0.4, P < 0.001) were filtered by Pearson correlation analysis in TCGA data sets. The top 10 genes that were positively and negatively correlated with PSMD14 were selected for further analysis.
Identification and validation of the prognostic gene signature
Using univariate and least absolute shrinkage and selection operator (LASSO) COX regression, we filter the independent risk prognostic genes. Moreover, multivariate COX regression was used to identify corresponding coefficients of HCC prognostic signature using the R package “glment”, “survminer” and “survival”. The risk score of every patient was calculated from the TCGA and ICGC database based on the signature. With the median score as cut-off value, all samples were randomly separated to high- and low-risk sets. In addition, survival analysis was evaluated for each set using the Kaplan-Meier curve and log-rank test. The receiver operating characteristic (ROC) curve and the area under the curve (AUC) were drawn using the R package “survivalROC”.
We constructed a nomogram for age, gender, stage, T, N, M, and risk score using the survival and the rms package of R. Next, we used a calibration curve to assess the concordance between actual and predicted survival. In addition, the concordance index (C-index) was computed to evaluate the model performance for predicting prognosis, which was ranged from 0.5 to 1.0. Value of 0.5 and 1.0 represents a random chance and an excellent capacity for predicting survival with the model, respectively.
Gene set enrichment analysis (GSEA) was conducted to identify gene sets that differed significantly between the high- and low-risk patient groups, using GSEA 4.0.3 software (http://www.broadinstitute.org/gsea/index.jsp). In the analysis results, it was generally believed that the pathways were significantly enriched when |NES| > 1, NOM P-value < 0.05, and FDR q-value < 0.25.
All statistics were executed using the R software (v.3.4.3). Clinicopathological characteristics associated with PSMD14 overall survival were analyzed using the Wilcoxon signed-rank test, logistic and cox regression, Kaplan-Meier method. In addition, χ2 test was used to check the association of risk scores with clinical characteristics and univariate and multivariate cox proportional hazard regression analysis was performed to evaluate the association between risk score and OS. The receiver operating characteristic (ROC) analysis was used to examine the sensitivity and specificity of survival prediction using the gene signature risk score. An area under the roc curve (AUC) served as an indicator of prognostic accuracy. P-values < 0.05 were considered statistically significant.
As shown in Tab. 2, 418 primary tumors with both gene expression and clinical data were downloaded from TCGA (LIHC-CHOL) data in November 2019. The median age was 61 years old at diagnosis. Moreover, histopathologic distribution of HCC included well-differentiated (14.8%), moderately differentiated (81.7%), and poorly differentiated (3.5%). The cancer status included 254 tumor-free (65.6%) and 133 with tumor (34.4%). Stage I disease was found in 194 patients (49.2%), Stage II in 98 (24.9%), Stage III in 90 (22.8%), and Stage IV in 12 (3.1%). Grade I disease was found in 55 patients (14.8%), Grade II in 180 (48.4%), Grade III in 124 (33.3%), and Grade IV in 13 (3.5%). The vascular invasion included 17 Macro (5.3%), 94 micro (29.3%), and 210 NO (65.4%). Most tumors (87.8%, N = 367) were of hepatocellular carcinoma (HCC), 9.8% (N = 41) were cholangiocarcinoma (CHOL), 1.7% (N = 7) were hepatocholangiocarcinoma (Mixed) and 0.7% (N = 3) were fibrolamellar carcinoma (FLC). Tumor size (≤5 cm, 74.9%, N = 311) and (>5 cm, 25.1%, N = 104). Eight of 298 (2.7%) cases had lymph node metastases. Eight of 311 (2.6%) cases had distant metastases.
Oncomine database analysis exhibits significantly up-regulation of PSMD14 in 2 HCC data set compared to the normal liver tissues (Fig. 1A). Complementary, PSMD14 mRNA expression was higher in most tumors, such as bladder cancer, brain and CNS, breast cancer, cervical, colorectal cancer, head and neck cancer, kidney cancer, HCC, lung cancer, lymphoma, myeloma, pancreatic cancer, and sarcoma. To further assess PSMD14 expression of HCC, we verified PSMD14 mRNA expression by TIMER data set (Fig. 1B). PSMD14 mRNA expression was significantly higher in liver hepatocellular carcinoma (LIHC) compared with adjacent normal tissues.
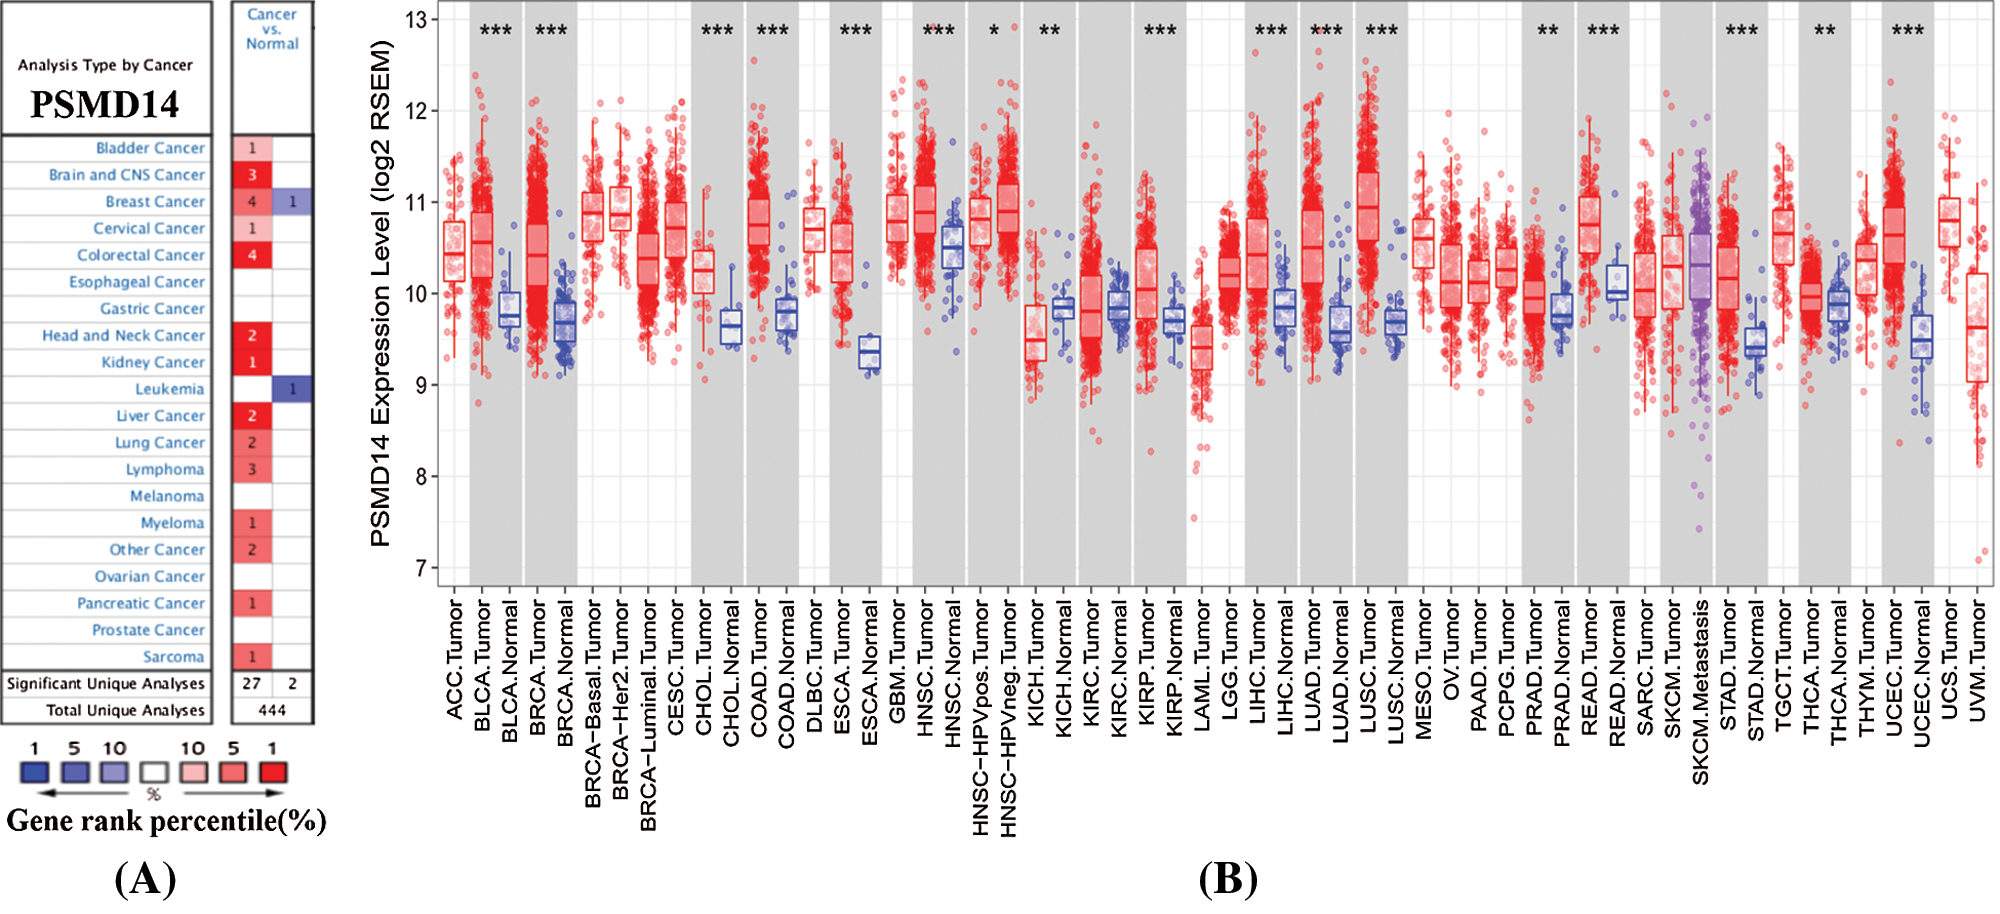
Figure 1: PSMD14 expression levels in human cancers. (A) PSMD14 in data sets of different cancers in the Oncomine database. (B) PSMD14 expression levels in different tumor types were determined by TIMER (*P < 0.05, **P < 0.01, ***P < 0.001).
PSMD14 expression and its clinical significance in HCC
To further assess the role of PSMD14 in HCC, we first analyzed four independent microarray datasets from Oncomine database. The median rank of PSMD14 in up-regulated genes of HCC was 1197.5 based on a meta-analysis across the four datasets, including 4 analyses using the Oncomine algorithms (760 samples, P = 2.96 × 10⁻⁵, Fig. 2A) (Chen et al., 2002; Roessler et al., 2010; Wurmbach et al., 2007). In the meantime, we examined the protein expression of PSMD14 using the Human Protein Atlas (HPA). Images revealed a markedly high expression of PSMD14 could be observed compared to the normal liver tissues using the HPA002114 antibody in Liver cancer (Fig. 2B). Next, we evaluated PSMD14 mRNA expression compared with normal tissues in multiple HCC studies from TCGA and ICGC databases, and we found that the mRNA level of PMSD14 was significantly higher in HCC patients than normal liver tissues (Figs. 2C and 2D). These findings suggested that PSMD14 is highly expressed in HCC and elevated PSMD14 may predict a poor outcome for HCC patients.
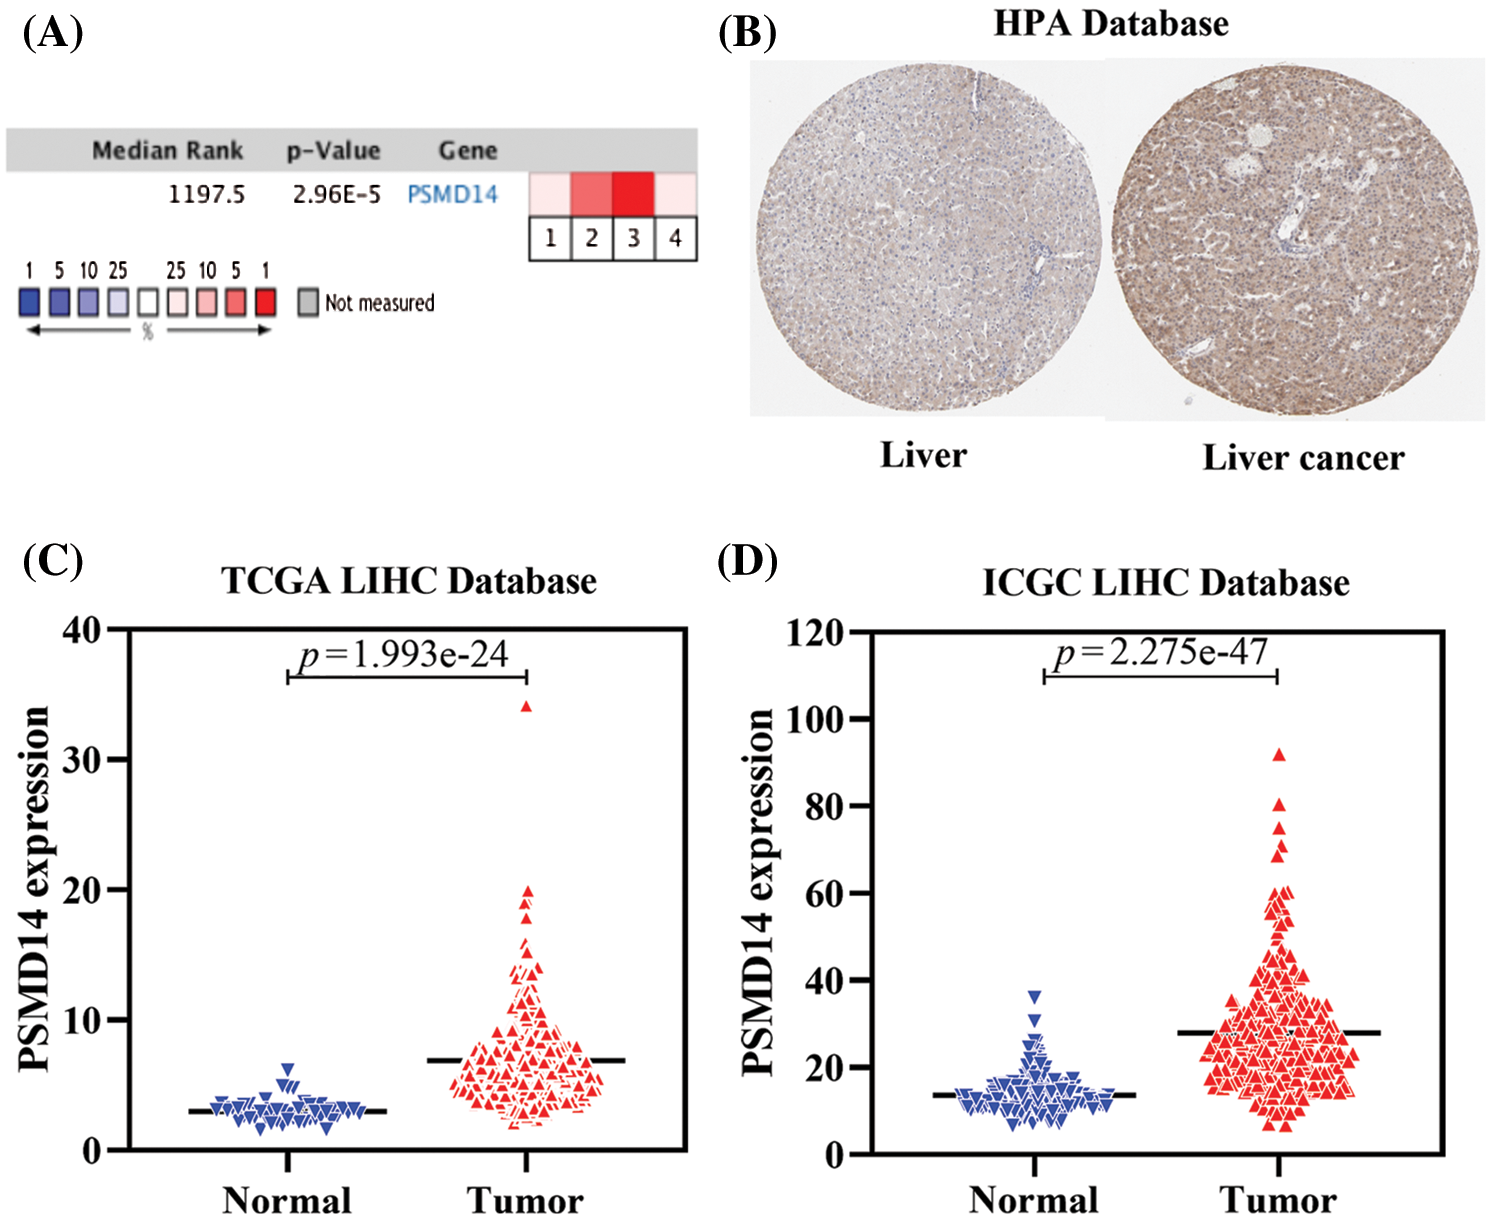
Figure 2: PSMD14 expression is upregulated in HCC. (A) A meta-analysis of PSMD14 gene expression from four Oncomine databases where colored squares indicate the median rank for PSMD14 (vs. Normal tissue) across 4 analyses. Chen Liver (1), Roessler Liver (2–3), Wurmbach Liver (4). The P-value is given for the median rank analysis. (B) The representative protein expression of the PSMD14 in HCC and normal liver tissue. Data were from the Human Protein Atlas (http://www.proteinatlas.org) database. (C) PSMD14 significantly increased in human 374 LIHC tissues to 50 normal tissues using TCGA Database. (D) PSMD14 significantly increased in human 243 LIHC tissues to 202 normal tissues using ICGC Database (*P < 0.05, **P < 0.01, ***P < 0.001).
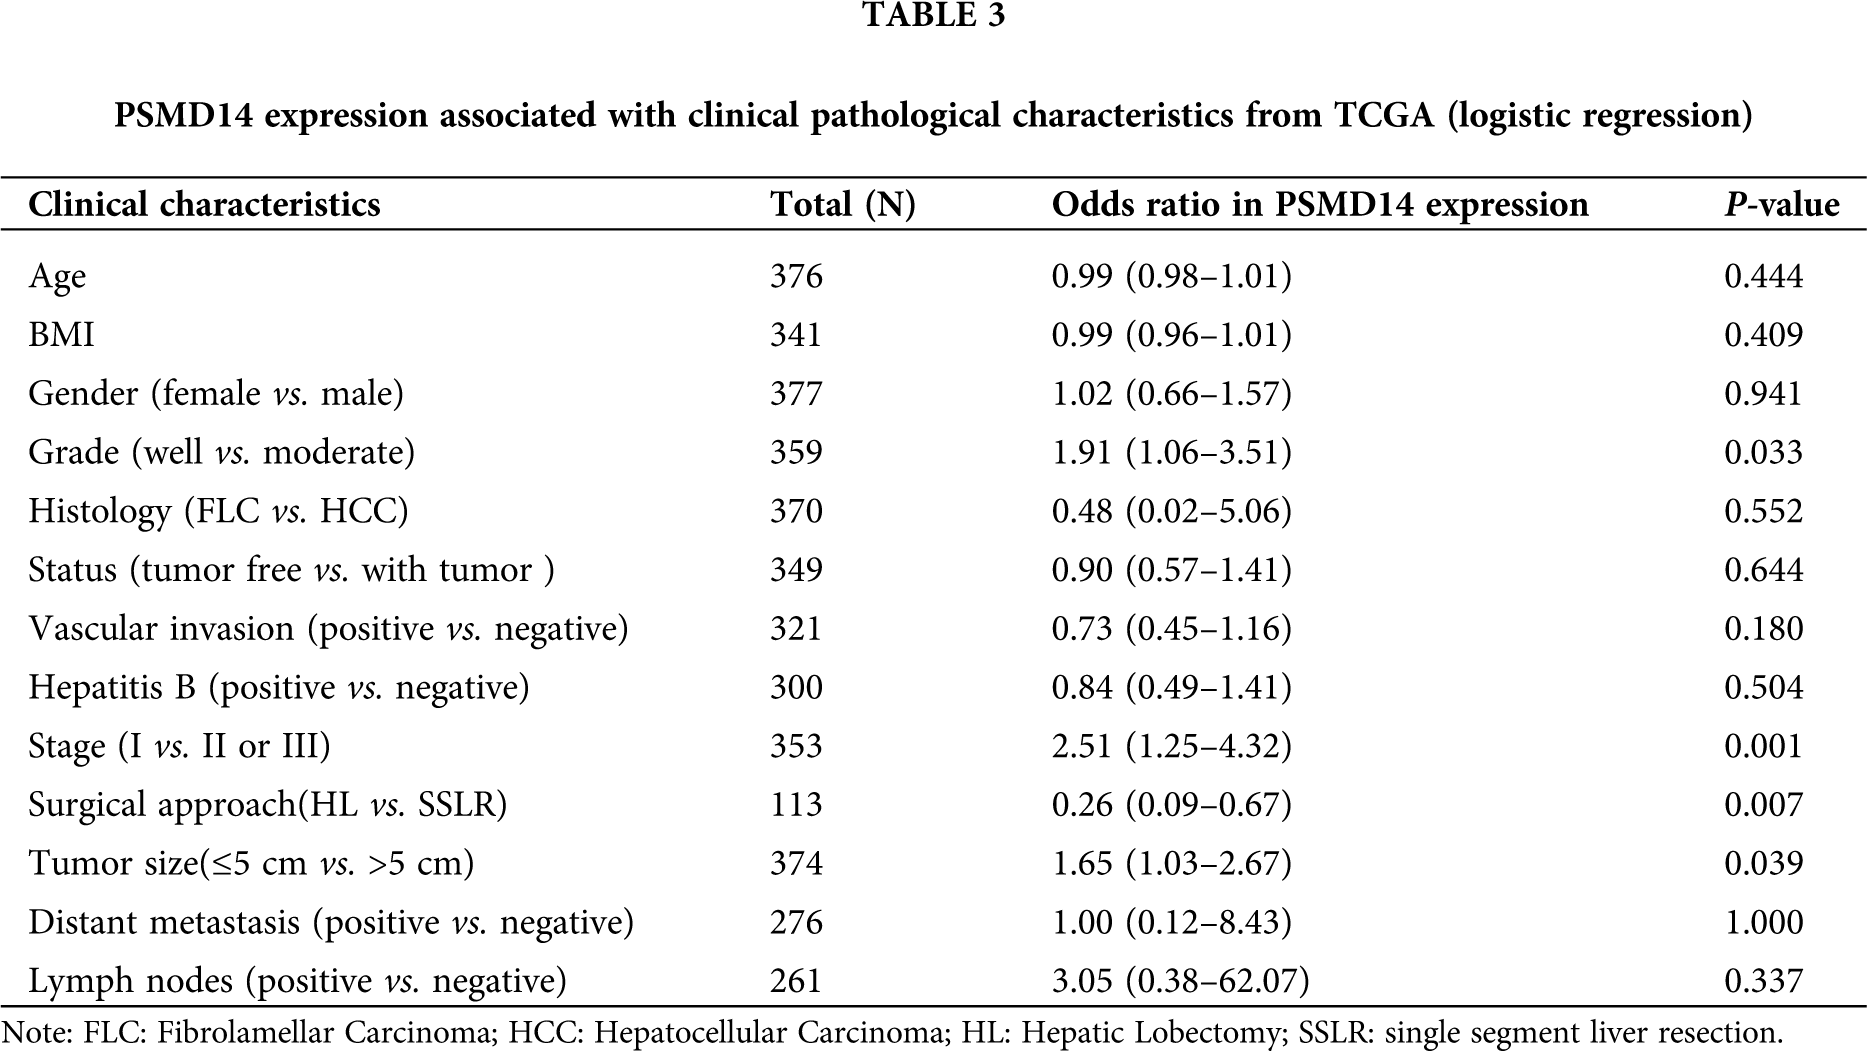
We analyzed 377 HCC samples with PSMD14 expression and clinical characteristics from the TCGA database. As shown in Figs. 3A–3D, the significant increase in PSMD14 expression correlated with tumor histological grade (P = 0.046), histological stage (P < 0.001), surgical approach (P = 0.001) and T stage (P = 0.013). Categorical dependent variable using logistic regression, univariate analysis showed that PSMD14 expression was significantly associated with poor prognostic clinicopathological characteristics (Tab. 3). Increased PSMD14 expression was significantly associated with Grade (OR = 1.9 for well vs. moderate), Stage (OR = 2.5 for I vs. II, III), surgical approach (OR = 0.26 for HL vs. SSLR), tumor size (OR = 1.65 for ≤5 cm vs. >5 cm) in HCC (all P-values < 0.05). The results suggested that HCC with high PSMD14 expression was progressed to a more advanced stage than those with low PSMD14 expression.
Survival and independent prognostic analysis
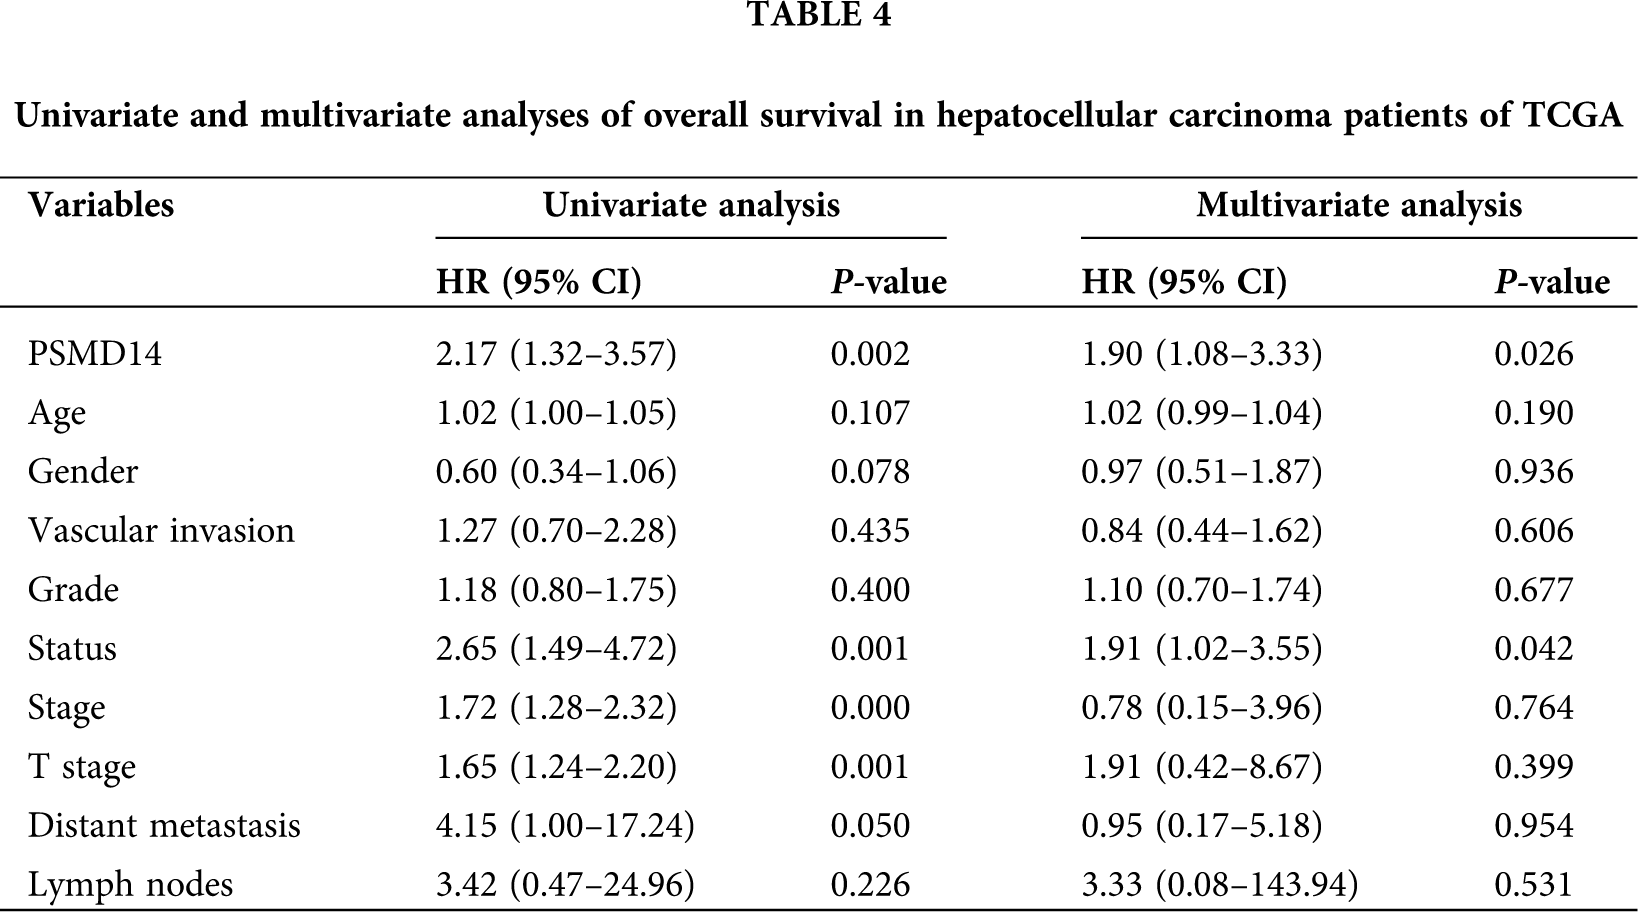
Kaplan–Meier survival analysis indicated that HCC with PSMD14-high had a poor prognosis than the PSMD14-low in TCGA and ICGC database in Figs. 3E and 3F (P < 0.001). The univariate analysis revealed that PSMD14-high correlated significantly with a poor OS (hazard ratio (HR): 2.17; 95% confidence interval (CI): 1.32–3.57; P = 0.002). Other clinicopathological variables related to poor survival include status, stage, T stage and distant metastasis. Multivariate analysis shown that the PSMD14 remained independently associated with overall survival (HR: 1.9; CI: 1.08–3.33; P = 0.026), along with status in TCGA (Tab. 4). Therefore, we first revealed that PSMD14 was associated with poor prognosis, as an independent prognostic factor for HCC survival.
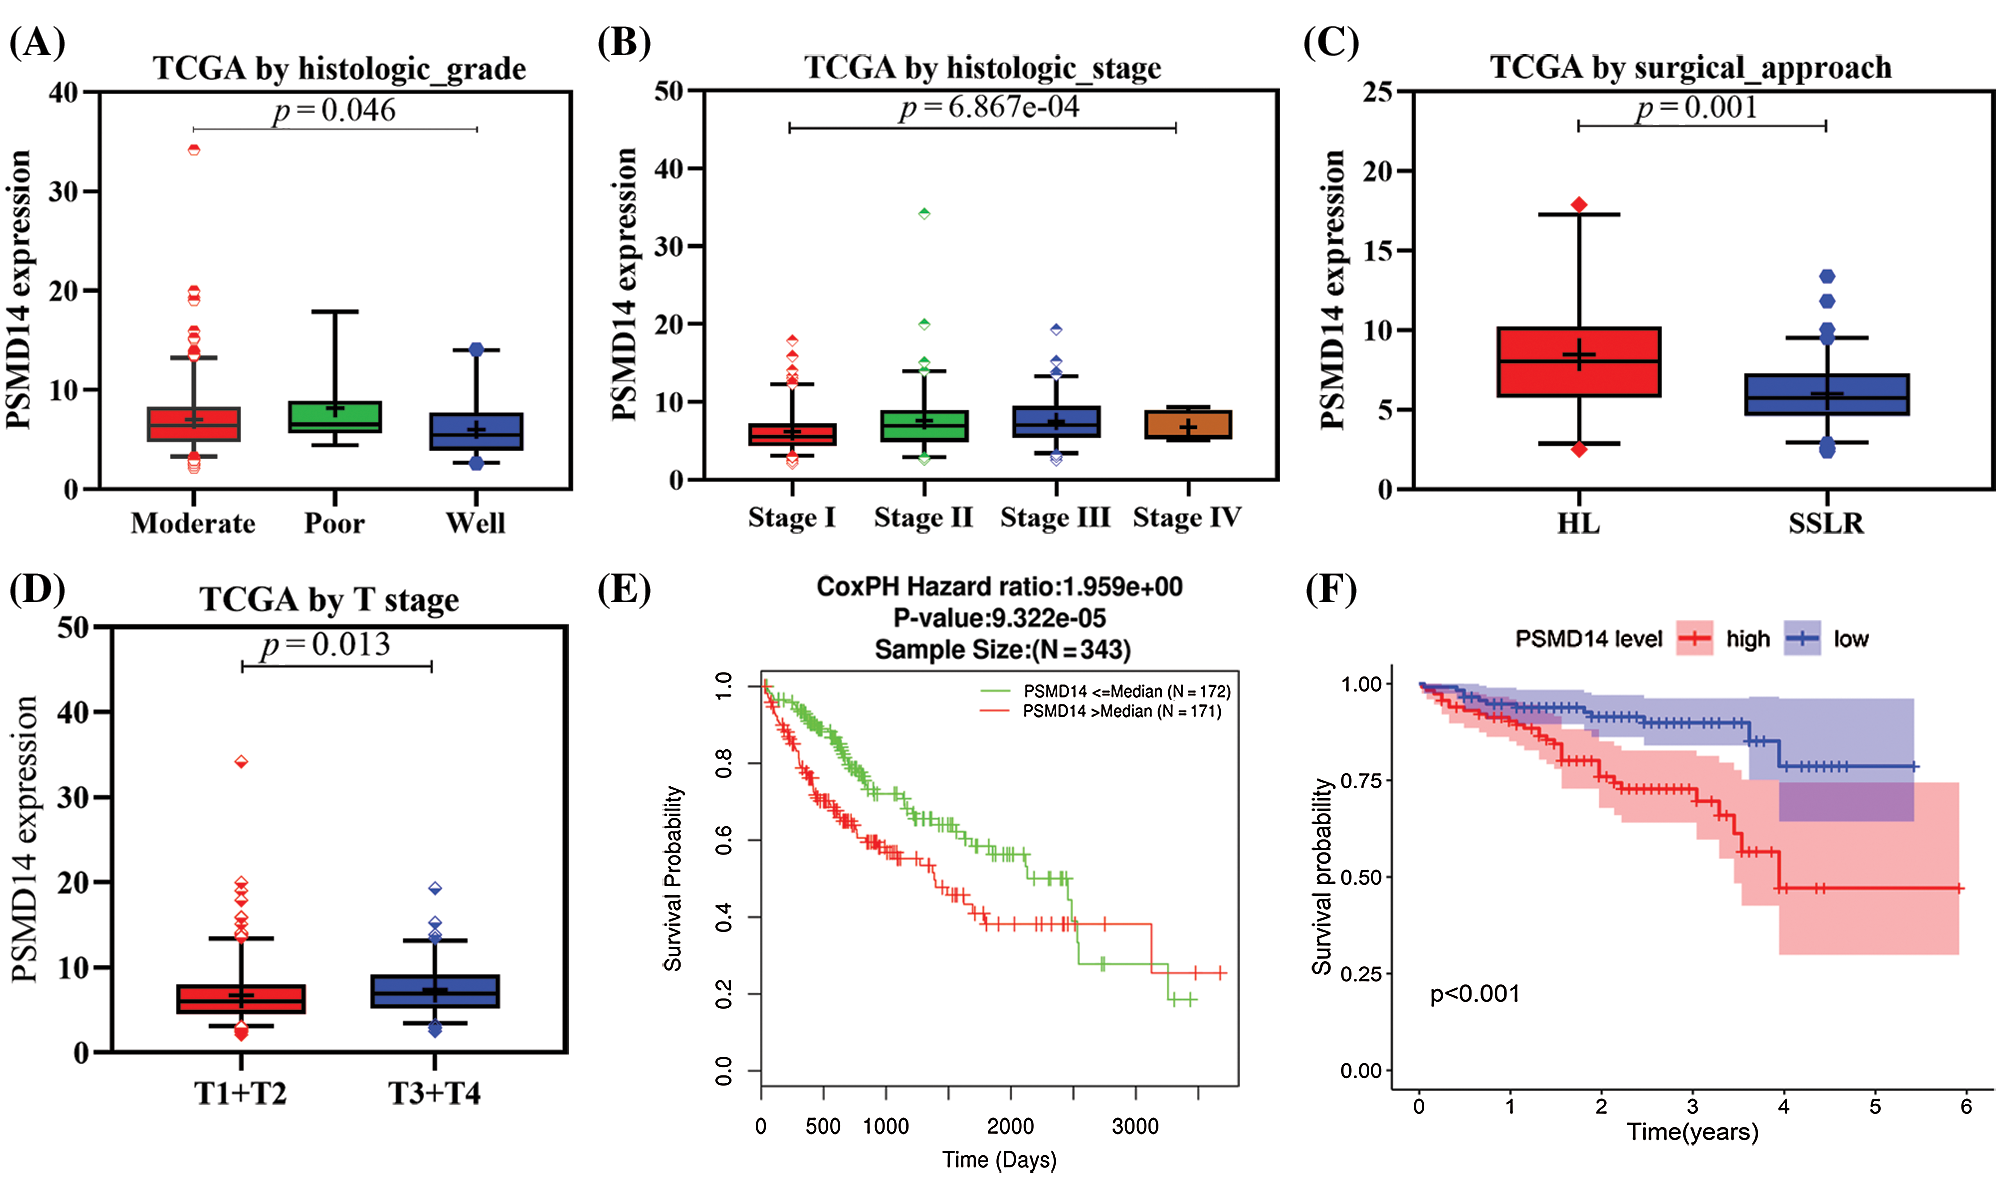
Figure 3: Association with PSMD14 expression and clinicopathologic characteristics, including (A) histologic grade, (B) histologic stage, (C) surgical approach, (D) T stage. (E–F) Impact of PSMD14 expression on overall survival in HCC patients in LinkedOmics and ICGC cohort. ICGC: International Cancer Genome Consortium; HL: Hepatic Lobectomy; SSLR: single segment liver resection.
Construction and validation of signature
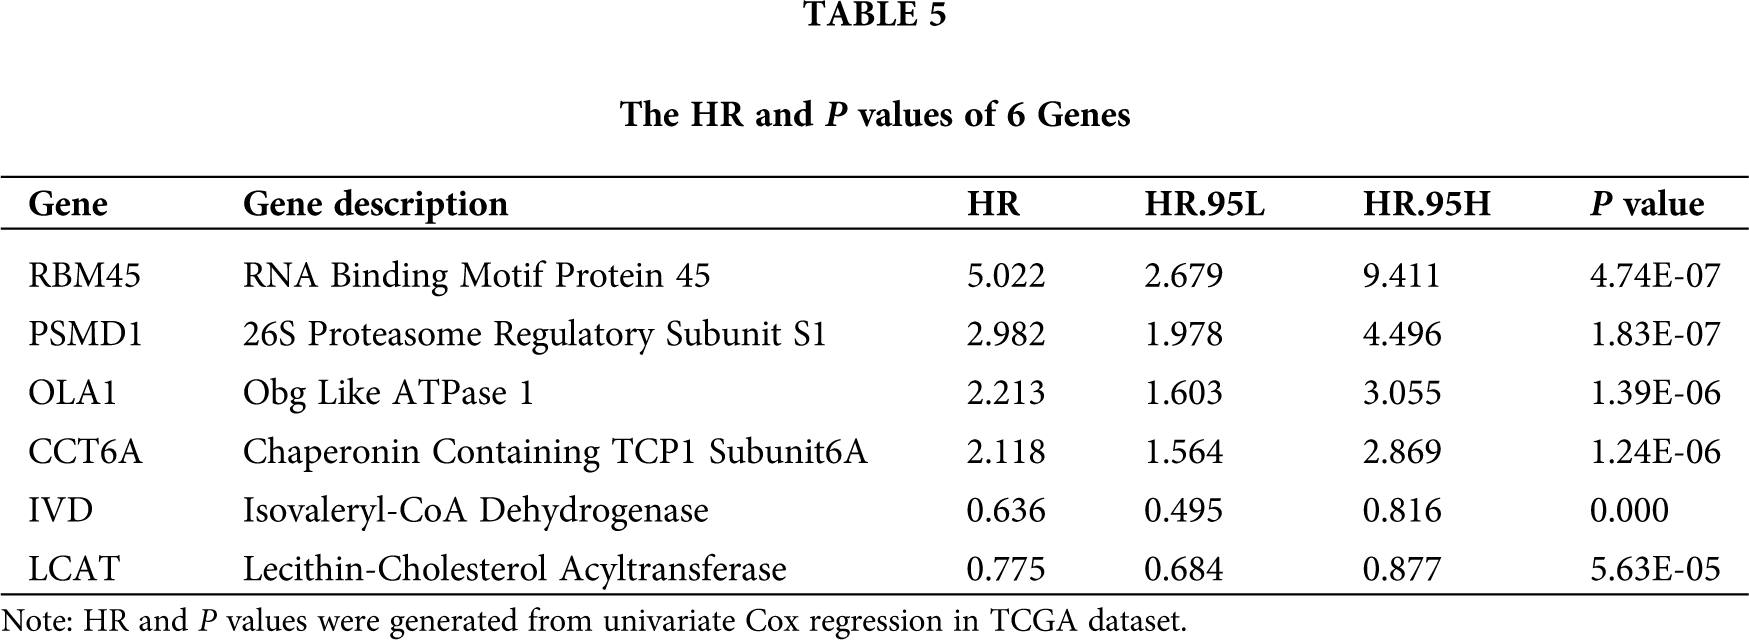
We selected the genes signatures associated with PSMD14 in the TCGA-LIHC database. A total of 2478 PSMD14-associated genes (Pearson |R| > 0.4, P < 0.001) were chosen to generate prognosis gene signatures and the top 10 positively and negatively genes were selected for further analysis (Fig. 4A). All genes were analyzed by univariate cox regression. A total of 17 genes were significantly related to the OS in TCGA-LIHC database (Fig. 4B). Then, the lasso cox regression analysis and the regression coefficient were computed, the model achieved the best performance at 6 genes (Fig. 4C). Finally, we constructed a risk signature for HCC using multivariate cox regression (Tab. 5). All patients were divided into high- and low-risk sets based on median risk score in the TCGA and ICGC database. Status, survival time and gene expression levels of patients were shown in TCGA (Fig. 4D) and ICGC (Fig. 4E).
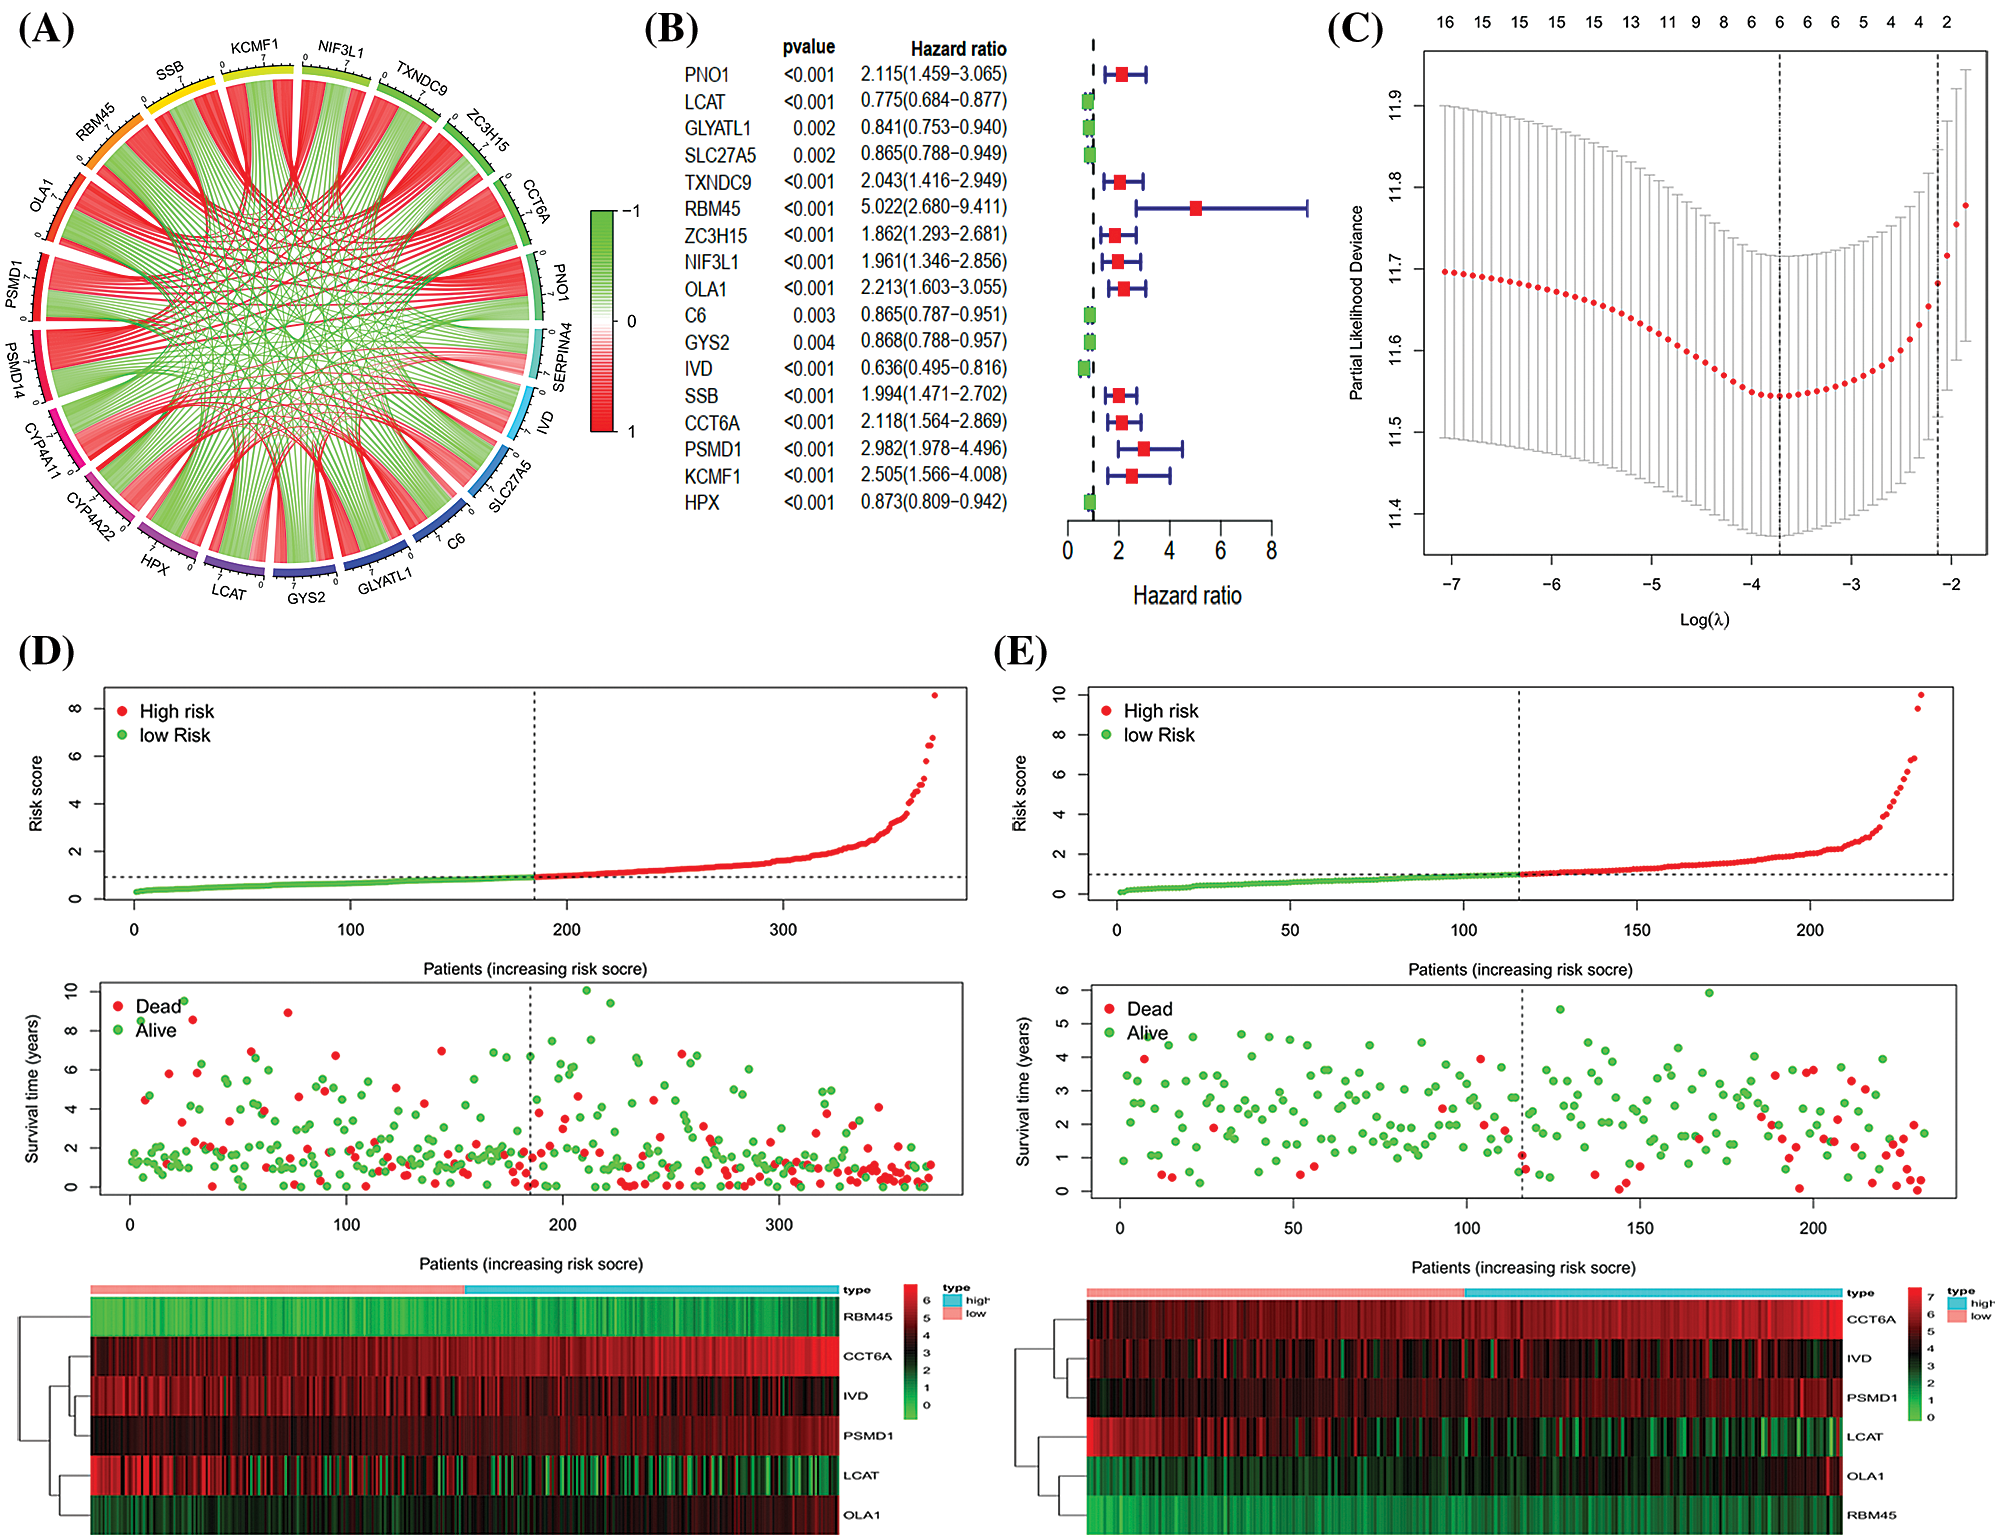
Figure 4: Establishment and validation of the six genes prognostic signature. (A) Circle chart showing PSMD14 related genes (top 10 positive and negative related genes). (B–C) The procedure of the establishment of the prognostic signature. (D) Correlation between the prognostic signature and the overall survival of patients in the TCGA cohort (D) and ICGC (E) cohorts. The distribution of risk scores (upper), survival time (middle) and genes expression levels (below). The black dotted lines represent the median risk score cut-off dividing patients into low- and high-risk groups. The red dots and lines represent the patients in high-risk groups. The green dots and lines represent the patients in low-risk groups.
The survival analysis indicated that the OS of the low-risk set was better than that of high-risk set in the TCGA database (P < 0.001) (Fig. 5A). The results were consistent in the ICGC database (P < 0.001) (Fig. 5B). The area under the roc curve (AUC) for 1-, 3-, and 5-year OS were 0.723, 0.653, 0.645, 0.657, 0.705, 0.683 in the TCGA (Fig. 5C) and ICGC (Fig. 5D) cohorts, respectively. Together, Results revealed that the signature showed excellent performance for OS prediction.
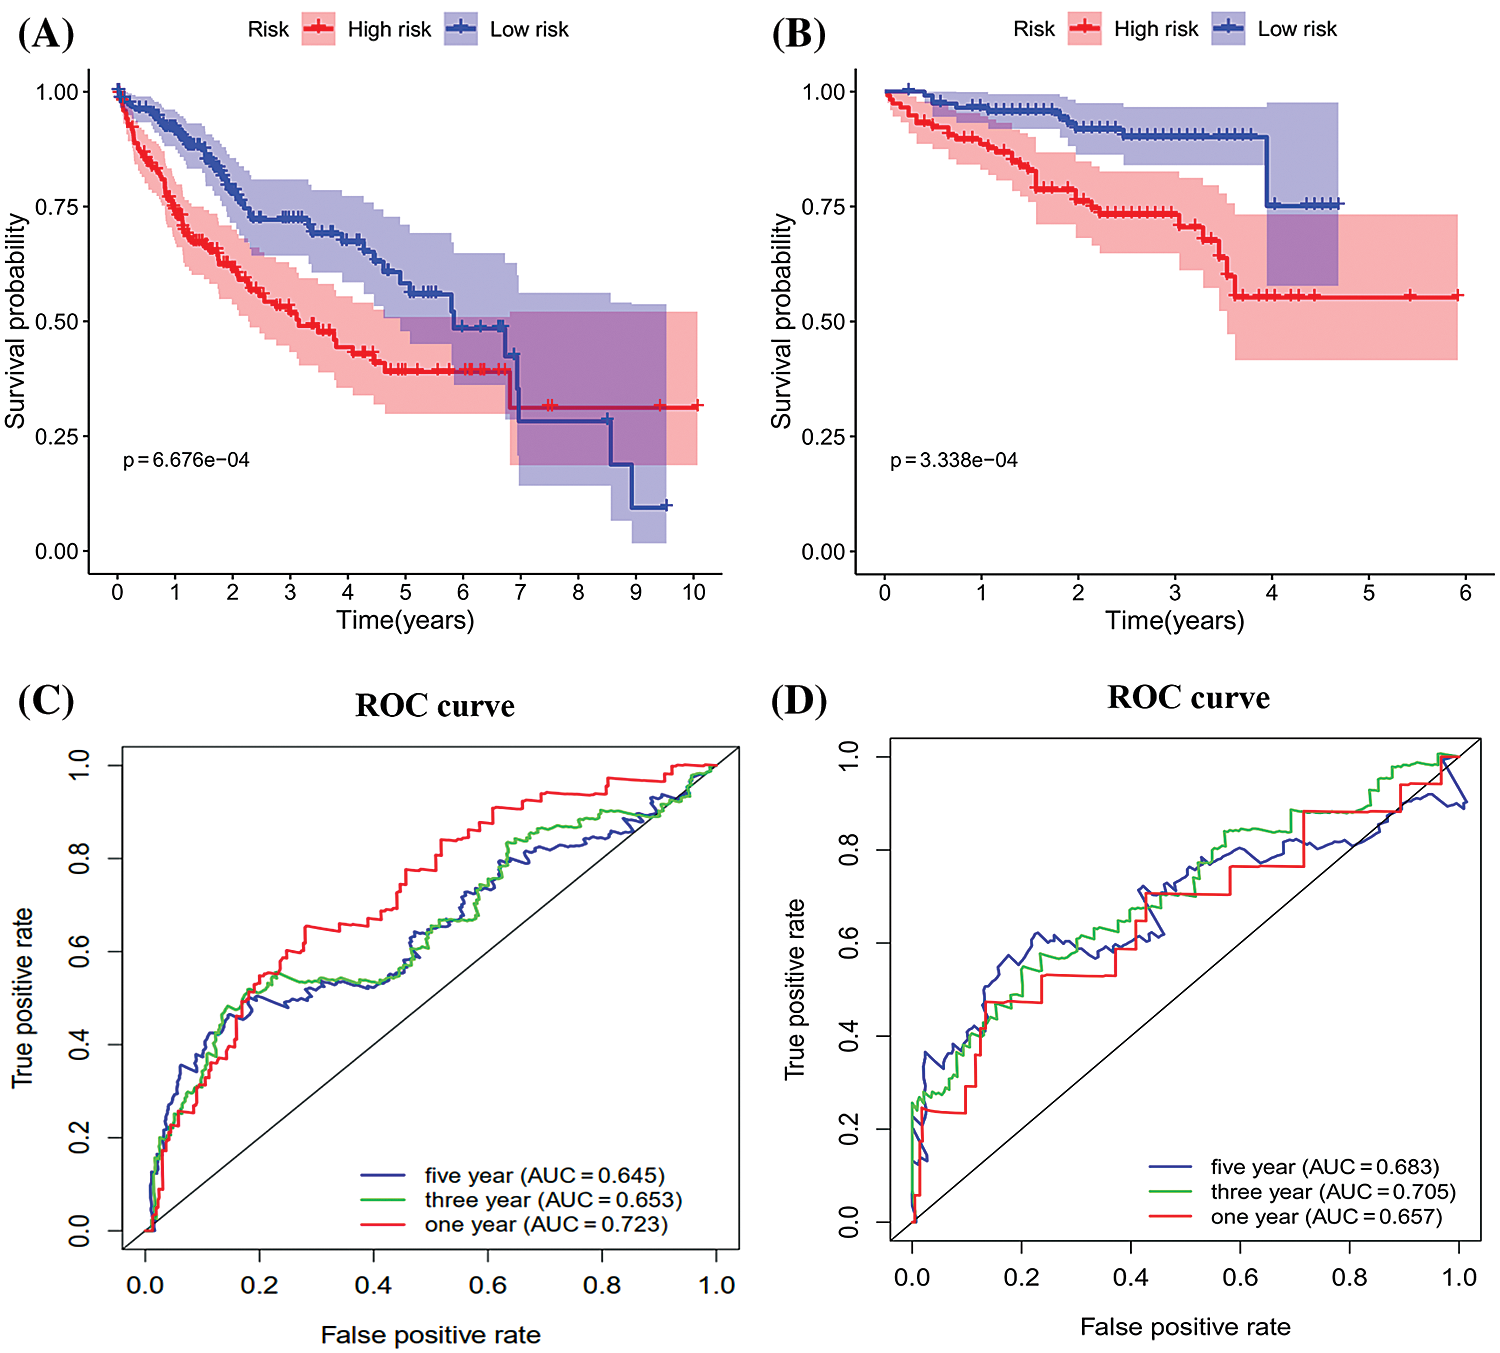
Figure 5: Kaplan-Meier survival and ROC curves of the six genes prognostic signature. (A–B) Kaplan–Meier survival curves of overall survival among risk stratification groups in the TCGA (A) and ICGC (B) set. (C–D) ROC curves with calculated AUCs for risk prediction in 1-, 3-, 5-years in the TCGA (C) and ICGC (D) sets.
Univariate and multivariate COX regression analysis
Univariate cox regression indicated that stage, T stage, M stage and risk score in the TCGA database (stage: P < 0.001; T stage: P < 0.001; M stage: P = 0.026; risk score: P < 0.001; Fig. 6A), and gender, stage, risk score in the ICGC database (gender: P = 0.039; stage: P < 0.001; risk score: P < 0.001; Fig. 6C) were predictors for OS. Moreover, multivariate cox regression analysis verified that age (HR: 1.019, 95% CI: 1.003–1.034; P = 0.017) and risk score (HR: 1.545; 95% CI: 1.354–1.763; P < 0.001; Fig. 6B) were significant independent risk factors in the TCGA database. Multivariate cox regression further showed that gender (HR: 0.372, 95% CI: 0.196–0.707; P = 0.003); stage (HR: 2.320, 95% CI: 1.599–3.367; P < 0.001); prior malignancy (HR: 2.500, 95% CI: 1.065–5.868; P = 0.035) and risk score (HR: 1.094; 95% CI: 1.031–1.162; P = 0.003; Fig. 6D) was significant independent risk factors in the ICGC database. These data demonstrated that this signature was an independent risk factor of HCC.
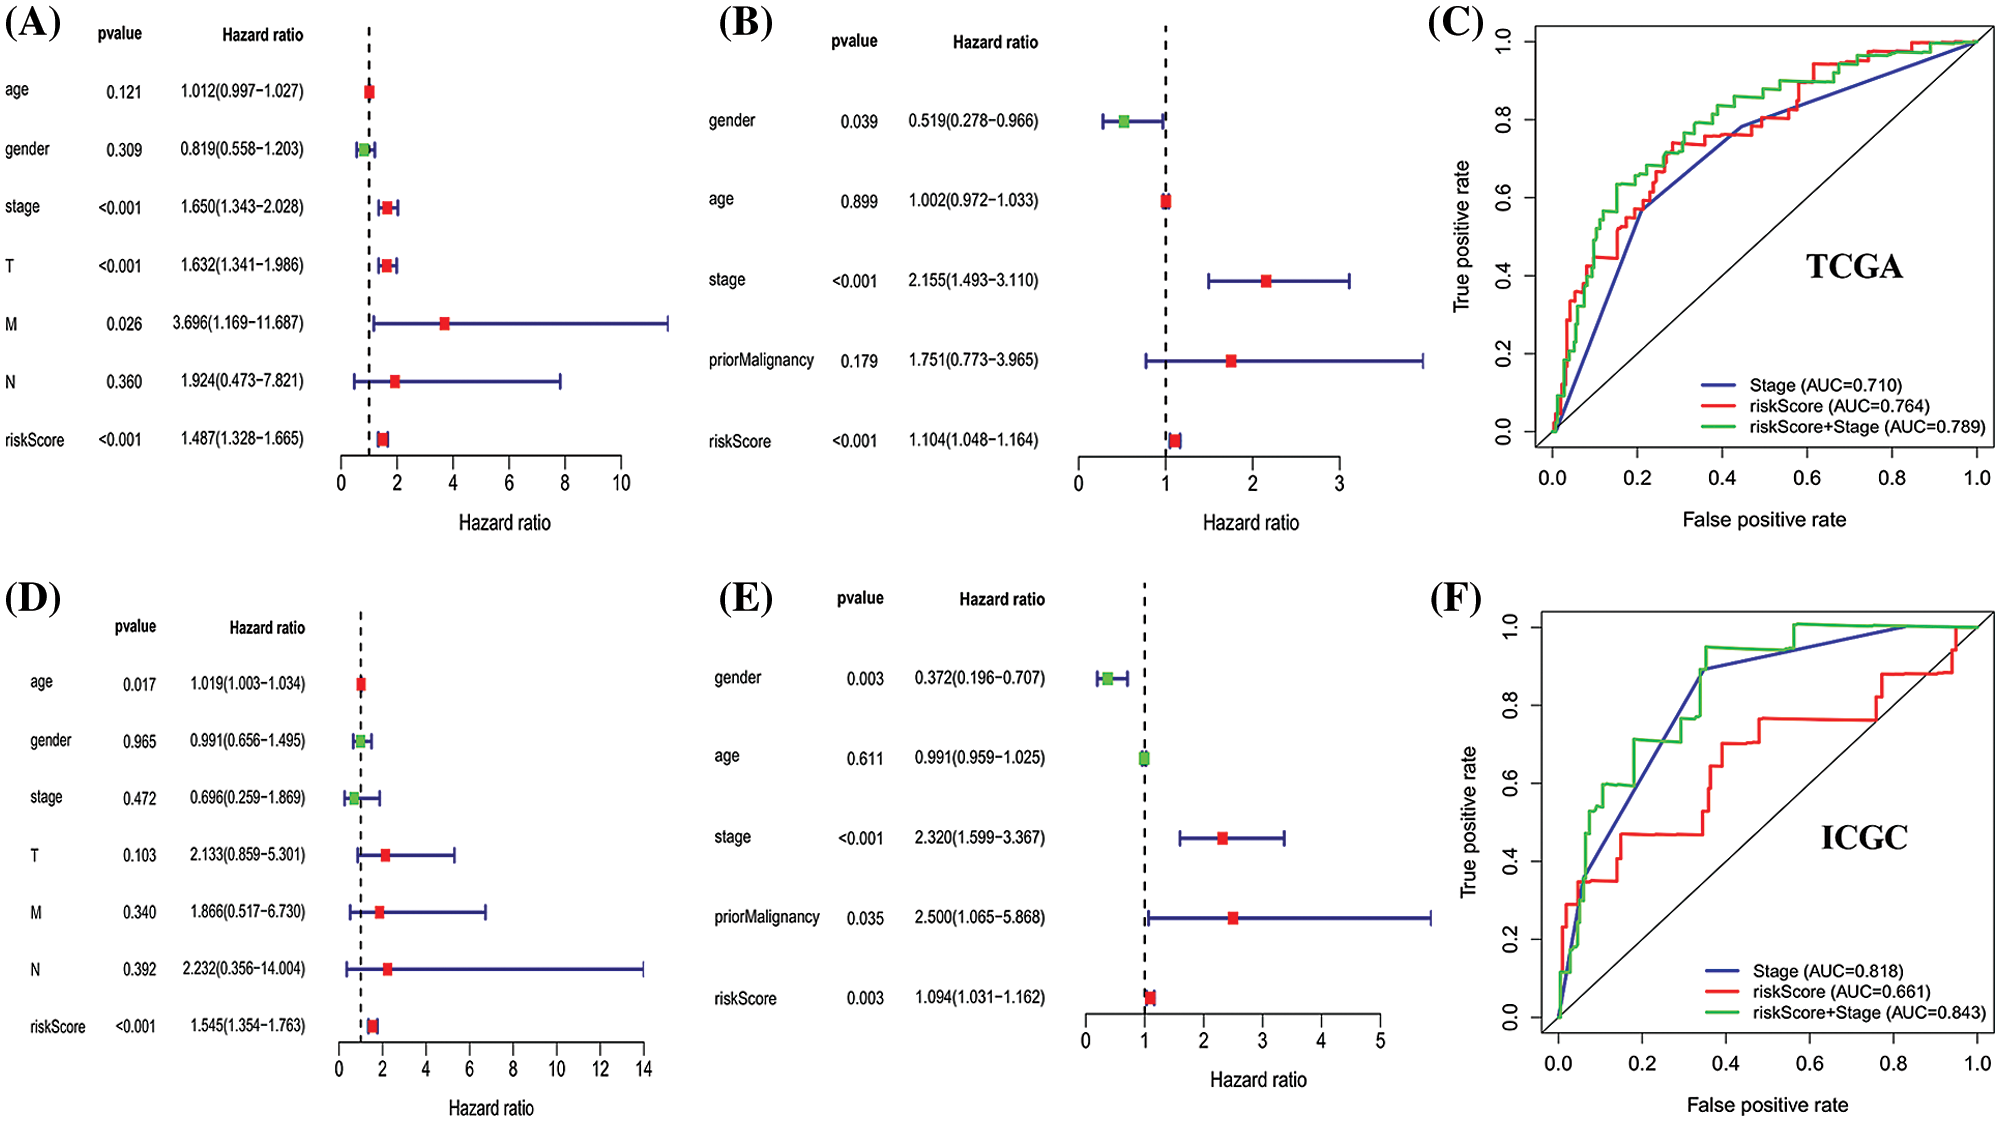
Figure 6: Univariate and multivariate Cox regression analyses of clinical factors associated with overall survival. (A–D) Univariate Cox regression analyses of clinical factors associated with overall survival in the TCGA (A) and ICGC (D) set. (B–E) Multivariate Cox regression analyses of clinical factors associated with overall survival in the TCGA (B) and ICGC (E) sets. The combination of stage and risk score could better predict prognosis in TCGA-LIHC (C) and ICGC-LIHC (F) than either one alone.
Based on the prognostic signature and clinical factors, such as age, gender, vascular invasion, tumor status and stage, a nomogram was constructed in the TCGA dataset (Fig. 7A). The calibration curve was used to describe the prediction value of the nomogram and the 45-degree line indicates the actual survival outcomes. The results showed that the nomogram-predicted survival closely matched with the best prediction performance for predicting 1-, 3- and 5-year OS (Fig. 7B). The 1-year AUC was 0.765 for nomogram, and 0.481 for age, 0.490 for grade, 0.425 for status, 0.711 for stage. The 3-year AUC was 0.697 for nomogram, and 0.508 for age, 0.525 for grade, 0.567 for status, 0.706 for stage. Moreover, the 5-year AUC was 0.715 for nomogram, and 0.594 for age, 0.508 for grade, 0.607 for status, 0.667 for stage (Figs. 7C–7E). These showed that compared with a single clinical factor, the nomogram had great predictive accuracy combined the signature and clinical factors.
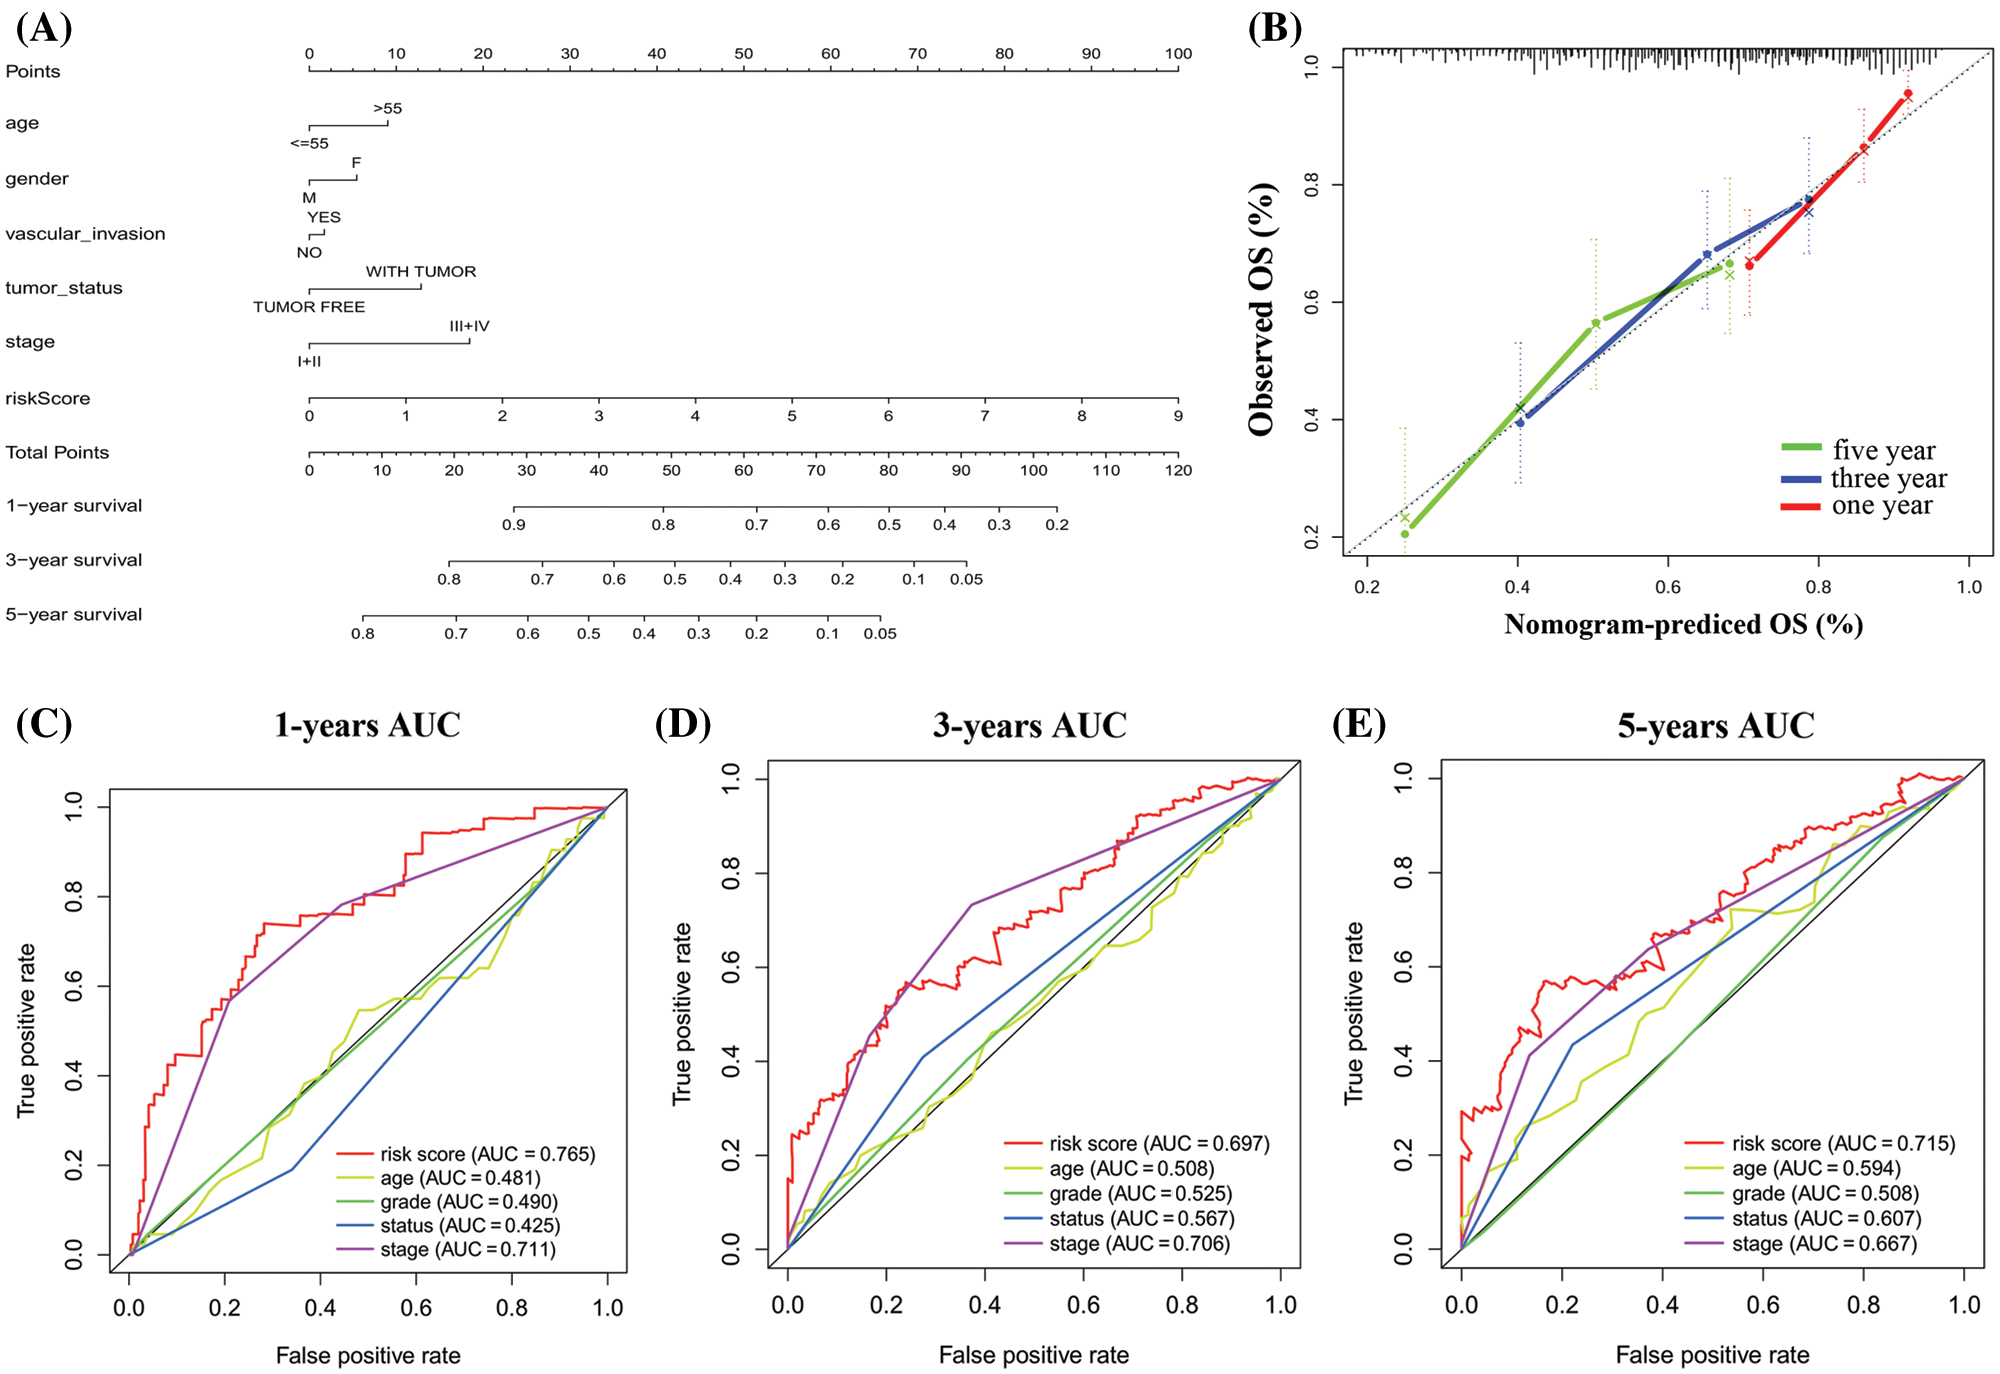
Figure 7: Construction of a nomogram for overall survival prediction in HCC. (A) The nomogram consists of age, gender, grade, vascular invasion, tumor status, stage, and the risk score based on the six genes signature. (B) Calibration curves of the nomogram for the estimation of survival rates at 1-, 3-, 5-year. (C–E) The Kaplan–Meier curves of the risk subgroups stratified by the tertiles of total points derived from the nomogram.
Consistent with our results, IVD and LCAT were found to be significantly down expressed, while CCT6A and OLA1 were significantly overexpressed for liver cancer in the Oncomine (Fig. 8A), TIMER (Fig. 8B), TCGA (Fig. 8C) and ICGC (Fig. 8D) database. Though lack in the Oncomine database, the mRNA expression of PSMD1 and RBM45 were also found to be significantly overexpressed for HCC in the TIMER, TCGA and ICGC database. Taking together, we further verified aberrant expression of six prognostic genes and found that IVD and LCAT genes were significantly decreased, while CCT6A, OLA1, PSMD1 and RBM45 genes were increased in HCC tissues.
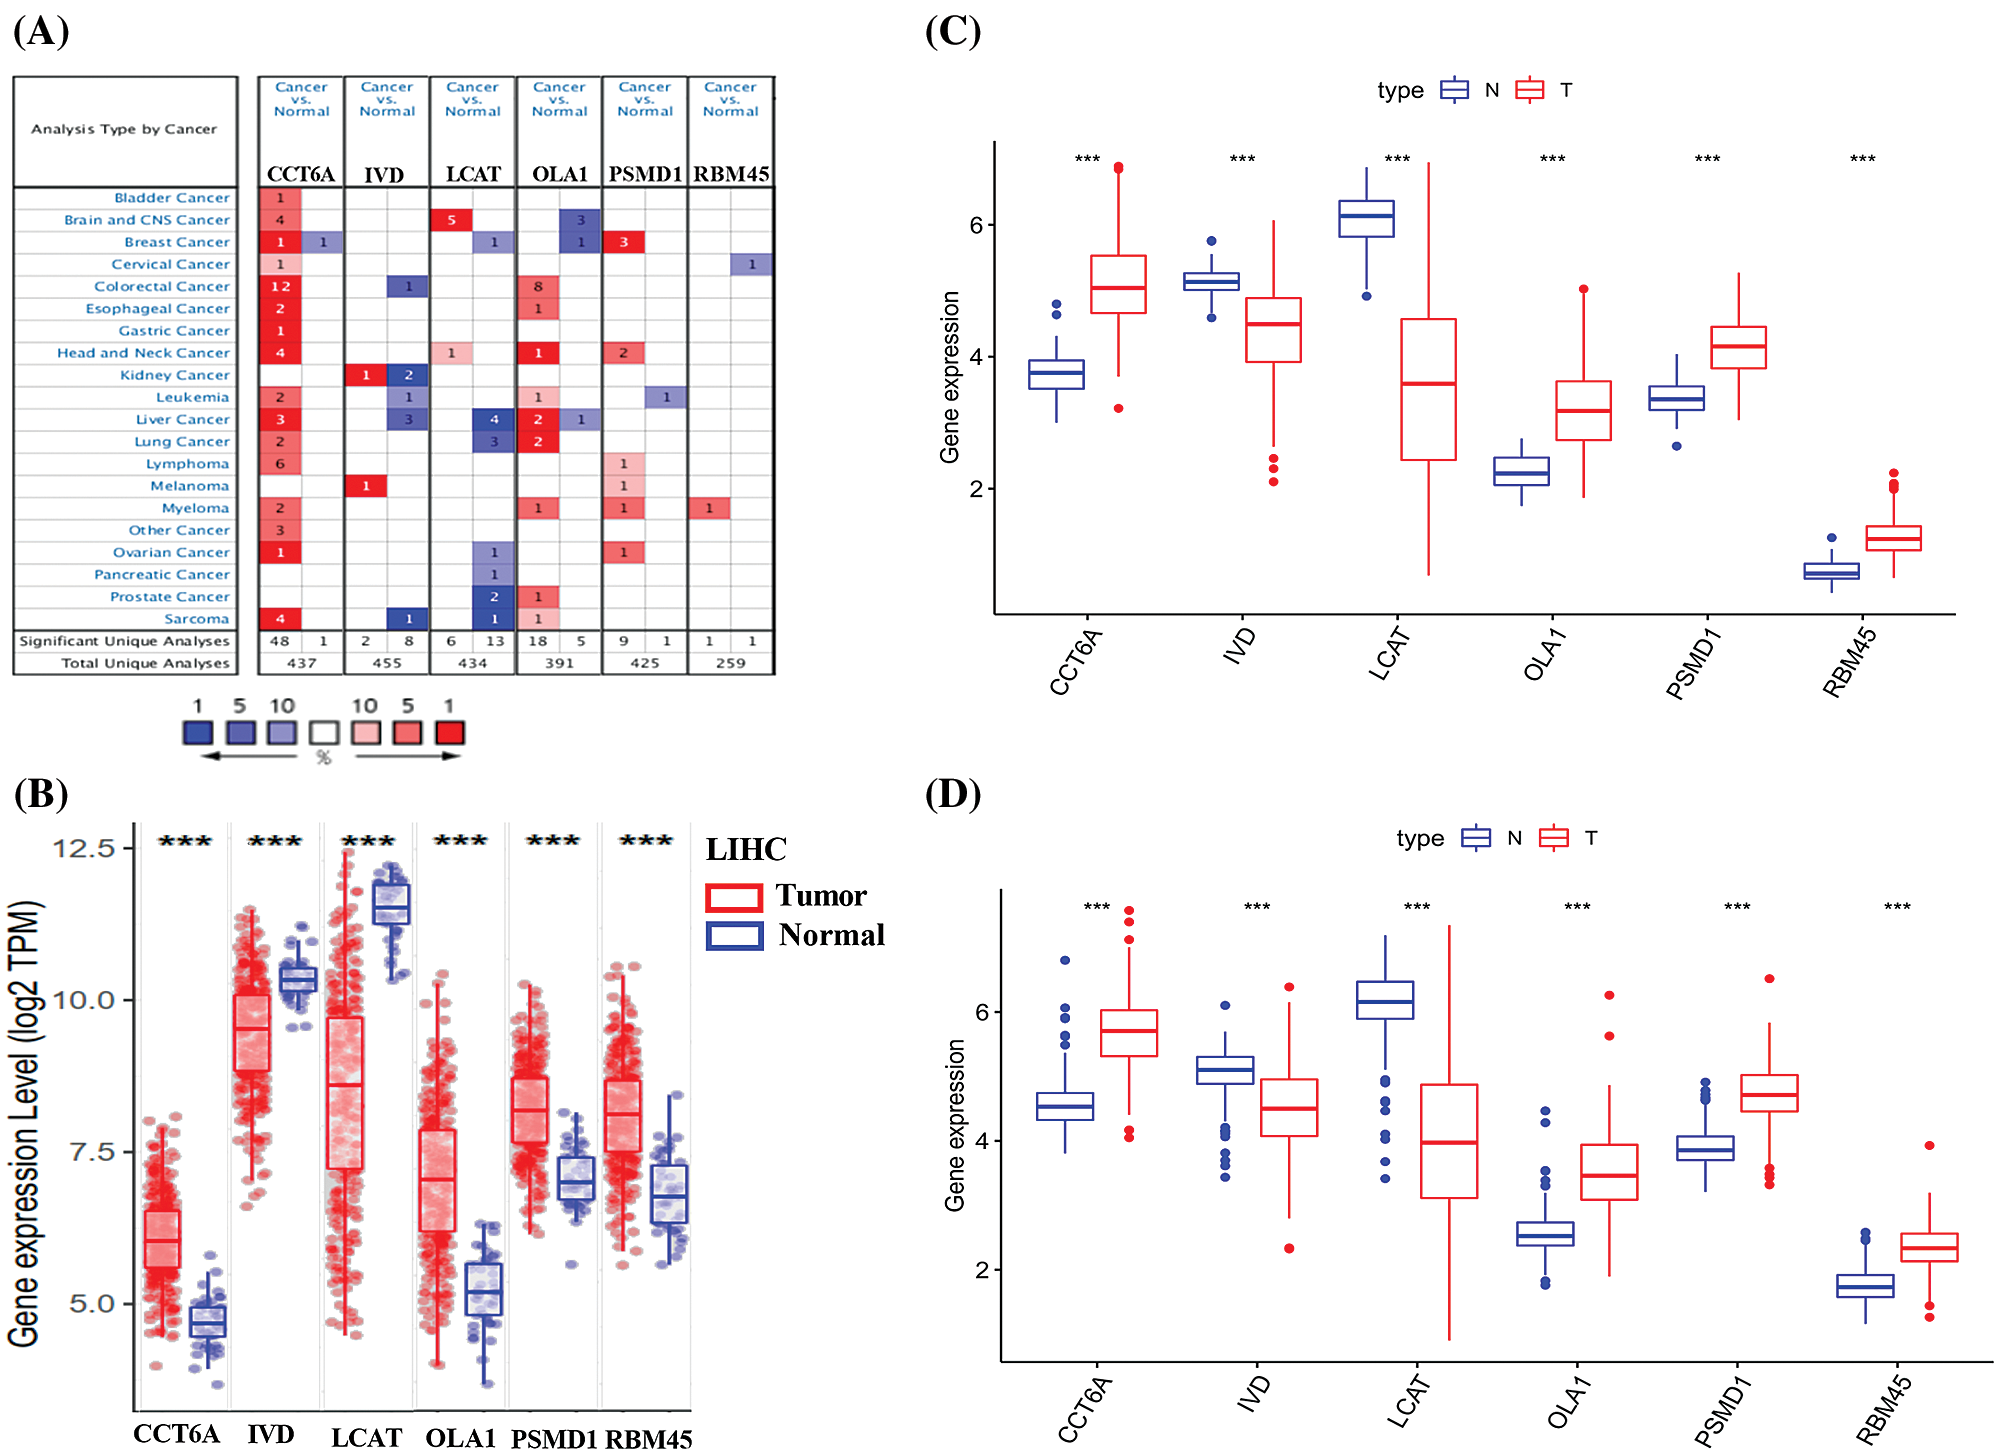
Figure 8: Expression of the six predictive genes in HCC. (A) The expression profiles of the six genes in the Oncomine database. Data of PSMD1 and RBM45 in HCC were not found in the database. (B) The expression of the six predictive genes in TIMER-LIHC database. (C–D) The expression of six predictive genes in TCGA-LIHC and ICGC-LIHC database.
We carried on the Gene Set Enrichment Analysis (GSEA) between PSMD14 (high/low) expression and high/low risk model data sets in TCGA-LIHC. GSEA revealed significant difference (FDR < 0.05, NOM P < 0.05) in enrichment of MSigDB collection (c2.cp.kegg.v7.0.symbols.gmts). We selected the most significantly enriched signaling pathways based on their normalized enrichment score (NES). A great majority of the enriched pathways were metabolism related, such as the purine metabolism, pyrimidine metabolism and ubiquitin mediated proteolysis are differentially enriched in PSMD14 high expression and high-risk group phenotype (Fig. 9A). Besides, the glycine serine and threonine metabolism, primary bile acid biosynthesis and retinol metabolism were enriched in PSMD14 low expression and low-risk group phenotype (Fig. 9B).
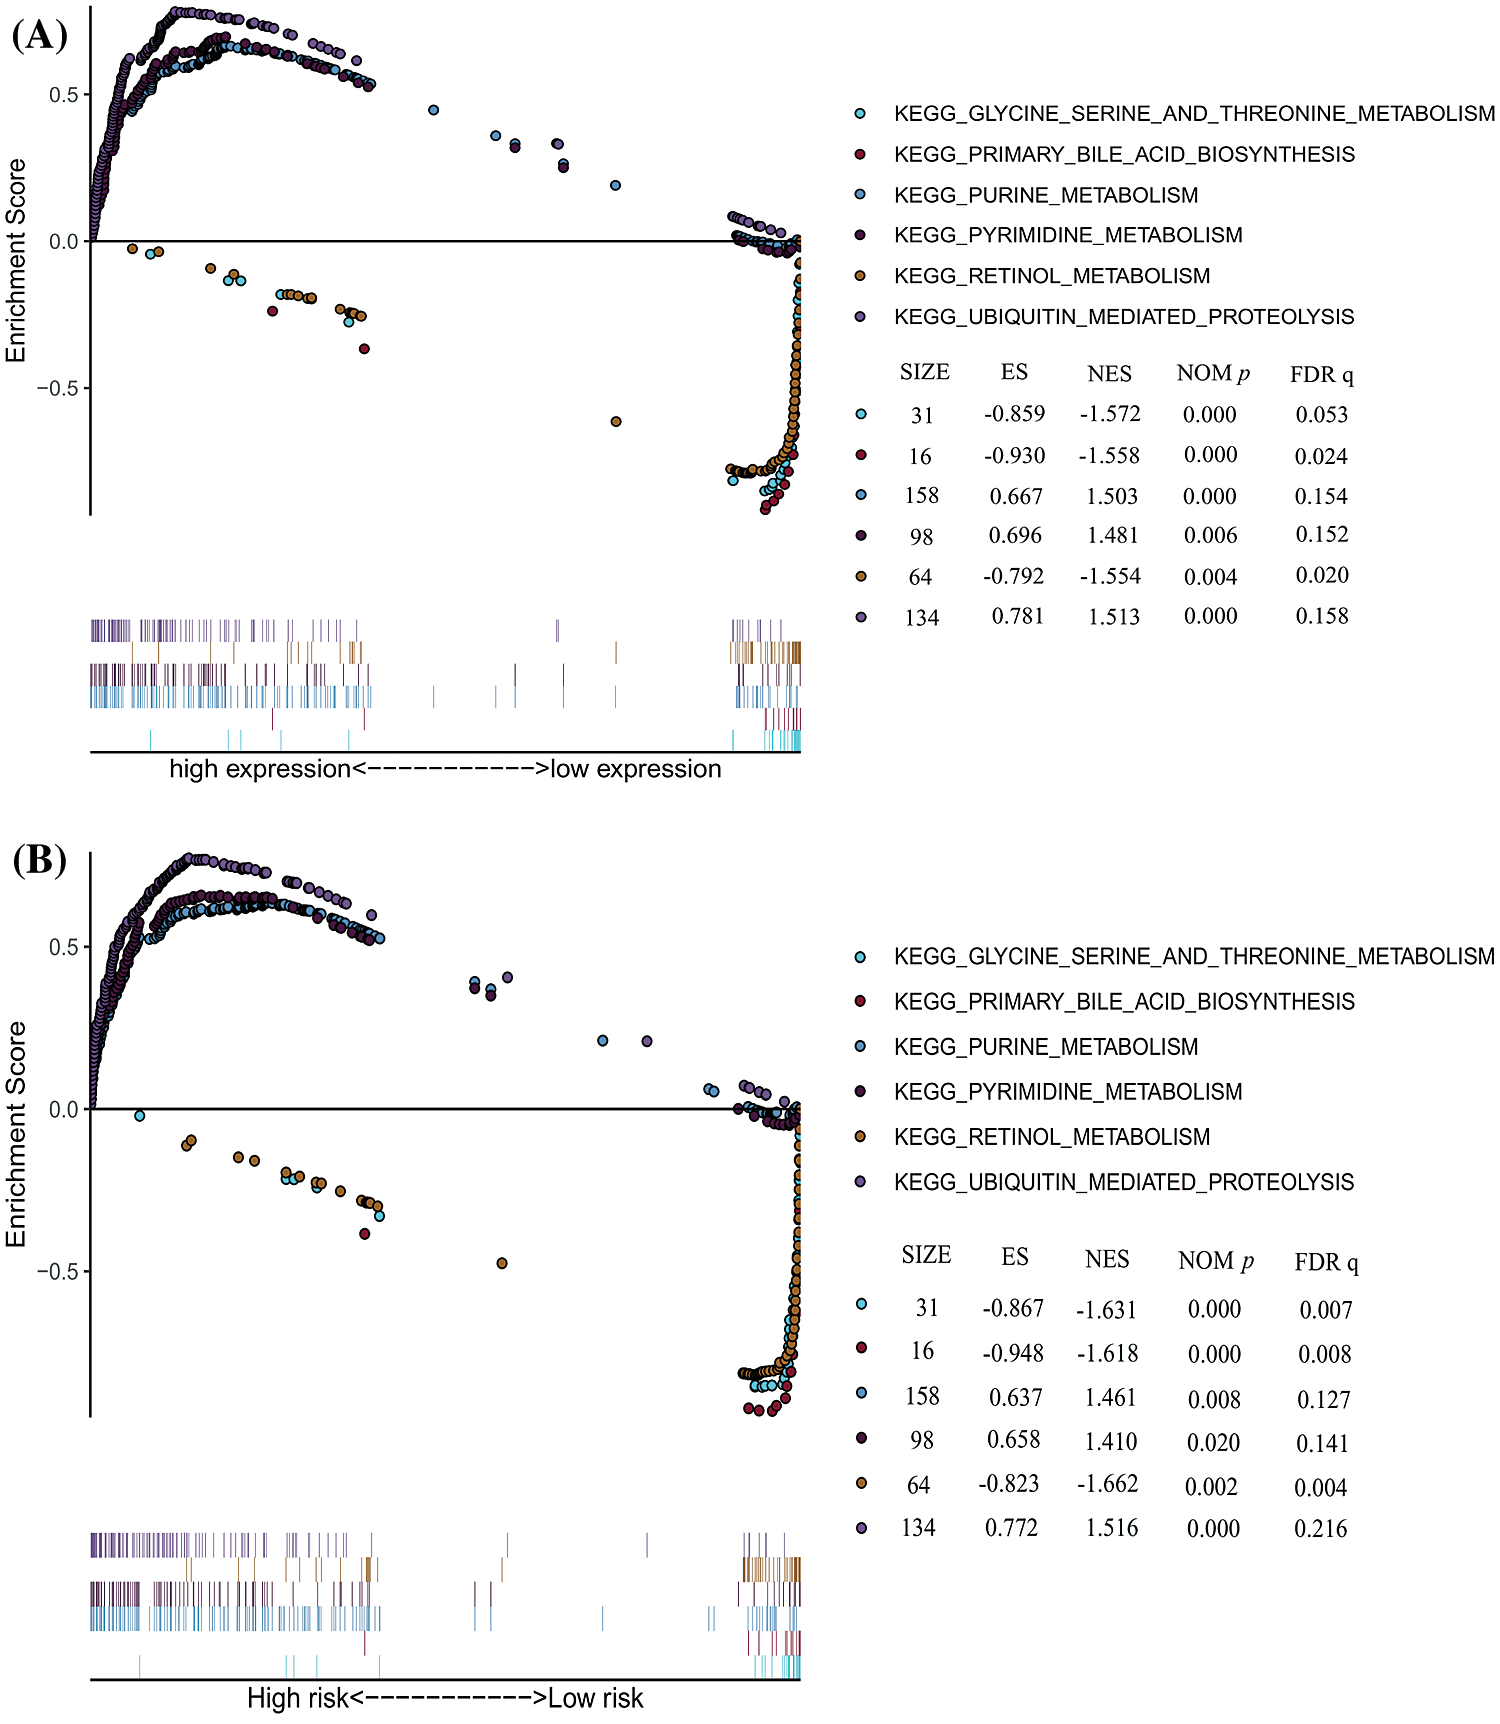
Figure 9: The significantly enriched KEGG pathways in TCGA-LIHC database by GSEA. (A) Six representative KEGG pathways in PSMD14 expression. (B) Six representative KEGG pathways in risk model.
Seven genes expression is correlated with immune infiltration level
We investigated the expression of seven genes (PSMD14, RBM45, PSMD1, OLA1, CCT6A, LCAT and IVD) in human HCC cell lines Hep3B and HepG2. Compared to the normal liver cell L02, IVD and LCAT were significantly downregulated, the PSMD14, PSMD1, RBM45, OLA1 and CCT6A gens were significantly upregulated in the Hep3B and HepG2 cells (Fig. 10A).
In addition, we analyzed the correlation between seven prognostic genes (PSMD14, RBM45, PSMD1, OLA1, CCT6A, LCAT, and IVD) expression and 6 types of infiltrating immune cells (B cells, CD4+ T cells, CD8+ T cells, neutrophils, macrophages, and dendritic cells) in LIHC via TIMER database. The results showed that PSMD14 expression levels had a significantly positive correlation with infiltrating levels of B Cell (r = 0.245, P = 4.27 × 10⁻⁶), CD8+ T cell (r = 0.205, P = 1.30 × 10⁻⁴), CD4+ T cell (r = 0.266, P = 5.57 × 10⁻⁷), macrophage (r = 0.374, P = 9.16 × 10⁻¹³), neutrophils (r = 0.445, P = 3.30 × 10⁻¹⁸) and dendritic cells (r = 0.317, P = 2.33 × 10⁻⁹). RBM45 expression levels had a significantly positive correlation with infiltrating levels of B cell (r = 0.35, P = 2.39 × 10⁻¹¹), CD8+ T cell (r = 0.26, P = 1.07 × 10⁻⁶), CD4+ T cell (r = 0.367, P = 2.12 × 10⁻¹²), macrophage (r = 0.461, P = 2.55 × 10⁻¹⁹), neutrophils (r = 0.471, P = 1.72 × 10⁻²⁰) and dendritic cells (r = 0.419, P = 6.90 × 10⁻¹⁶). PSMD1 expression levels had a significantly positive correlation with infiltrating levels of B cell (r = 0.257, P = 1.31 × 10⁻⁶), CD8+ T cell (r = 0.192, P = 3.50 × 10⁻⁶), CD4+ T cell (r = 0.299, P = 1.55 × 10⁻⁸), macrophage (r = 0.393, P = 4.53 × 10⁻¹⁴), neutrophils (r = 0.447, P = 2.22 × 10⁻¹⁸) and dendritic cells (r = 0.355, P = 1.50 × 10⁻¹¹). OLA1 expression levels had a significantly positive correlation with infiltrating levels of B cell (r = 0.359, P = 6.46 × 10⁻¹²), CD8+ T cell (r = 0.27, P = 3.89 × 10⁻⁷), CD4+ T cell (r = 0.328, P = 4.51 × 10⁻¹⁰), macrophage (r = 0.444, P = 6.18 × 10⁻¹⁸), neutrophils (r = 0.382, P = 1.98 × 10⁻¹³) and dendritic cells (r = 0.399, P = 1.93 × 10⁻¹⁴). CCT6A expression levels had a significantly positive correlation with infiltrating levels of B cell (r = 0.322, P = 9.24 × 10⁻¹⁰), CD8+ T cell (r = 0.16, P = 3.06 × 10⁻³), CD4+ T cell (r = 0.352, P = 1.72 × 10⁻¹¹), macrophage (r = 0.462, P = 1.90 × 10⁻¹⁹), neutrophils (r = 0.367, P = 2.04 × 10⁻¹²) and dendritic cells (r = 0.313, P = 3.45 × 10⁻⁹). None of the above five genes had no significant correlations with tumor purity (P > 0.05) (Figs. 10B–10G).
LCAT expression was significantly negatively related to tumor purity (r = −0.124, P = 2.12 × 10⁻²) and had a significantly negative correlation with infiltrating levels of B cell (r = −0.197, P = 2.35 × 10⁻⁴), CD8+ T cell (r = −0.103, P = 5.59 × 10⁻²), CD4+ T cell (r = −0.174, P = 1.16 × 10⁻³), macrophage (r = −0.244, P = 5.21 × 10⁻⁶), neutrophils (r = −0.202, P = 1.53 × 10⁻⁴) and dendritic cells (r = −0.194, P = 3.12 × 10⁻⁴) (Fig. 10F). IVD expression was significantly positive related to tumor purity (r = 0.121, P = 2.45 × 10⁻²) and had a significantly negative correlation with infiltrating levels of B cell (r = −0.173, P = 1.31 × 10⁻³), CD8+ T cell (r = −0.097, P = 7.37 × 10⁻²), CD4+ T cell (r = −0.135, P = 1.20 × 10⁻²), macrophage (r = −0.171, P = 1.49 × 10⁻³) and dendritic cells (r = −0.145, P = 7.53 × 10⁻³) and no significant correlations with neutrophils (r = −0.065, P = 2.271 × 10⁻¹) (Fig. 10H).
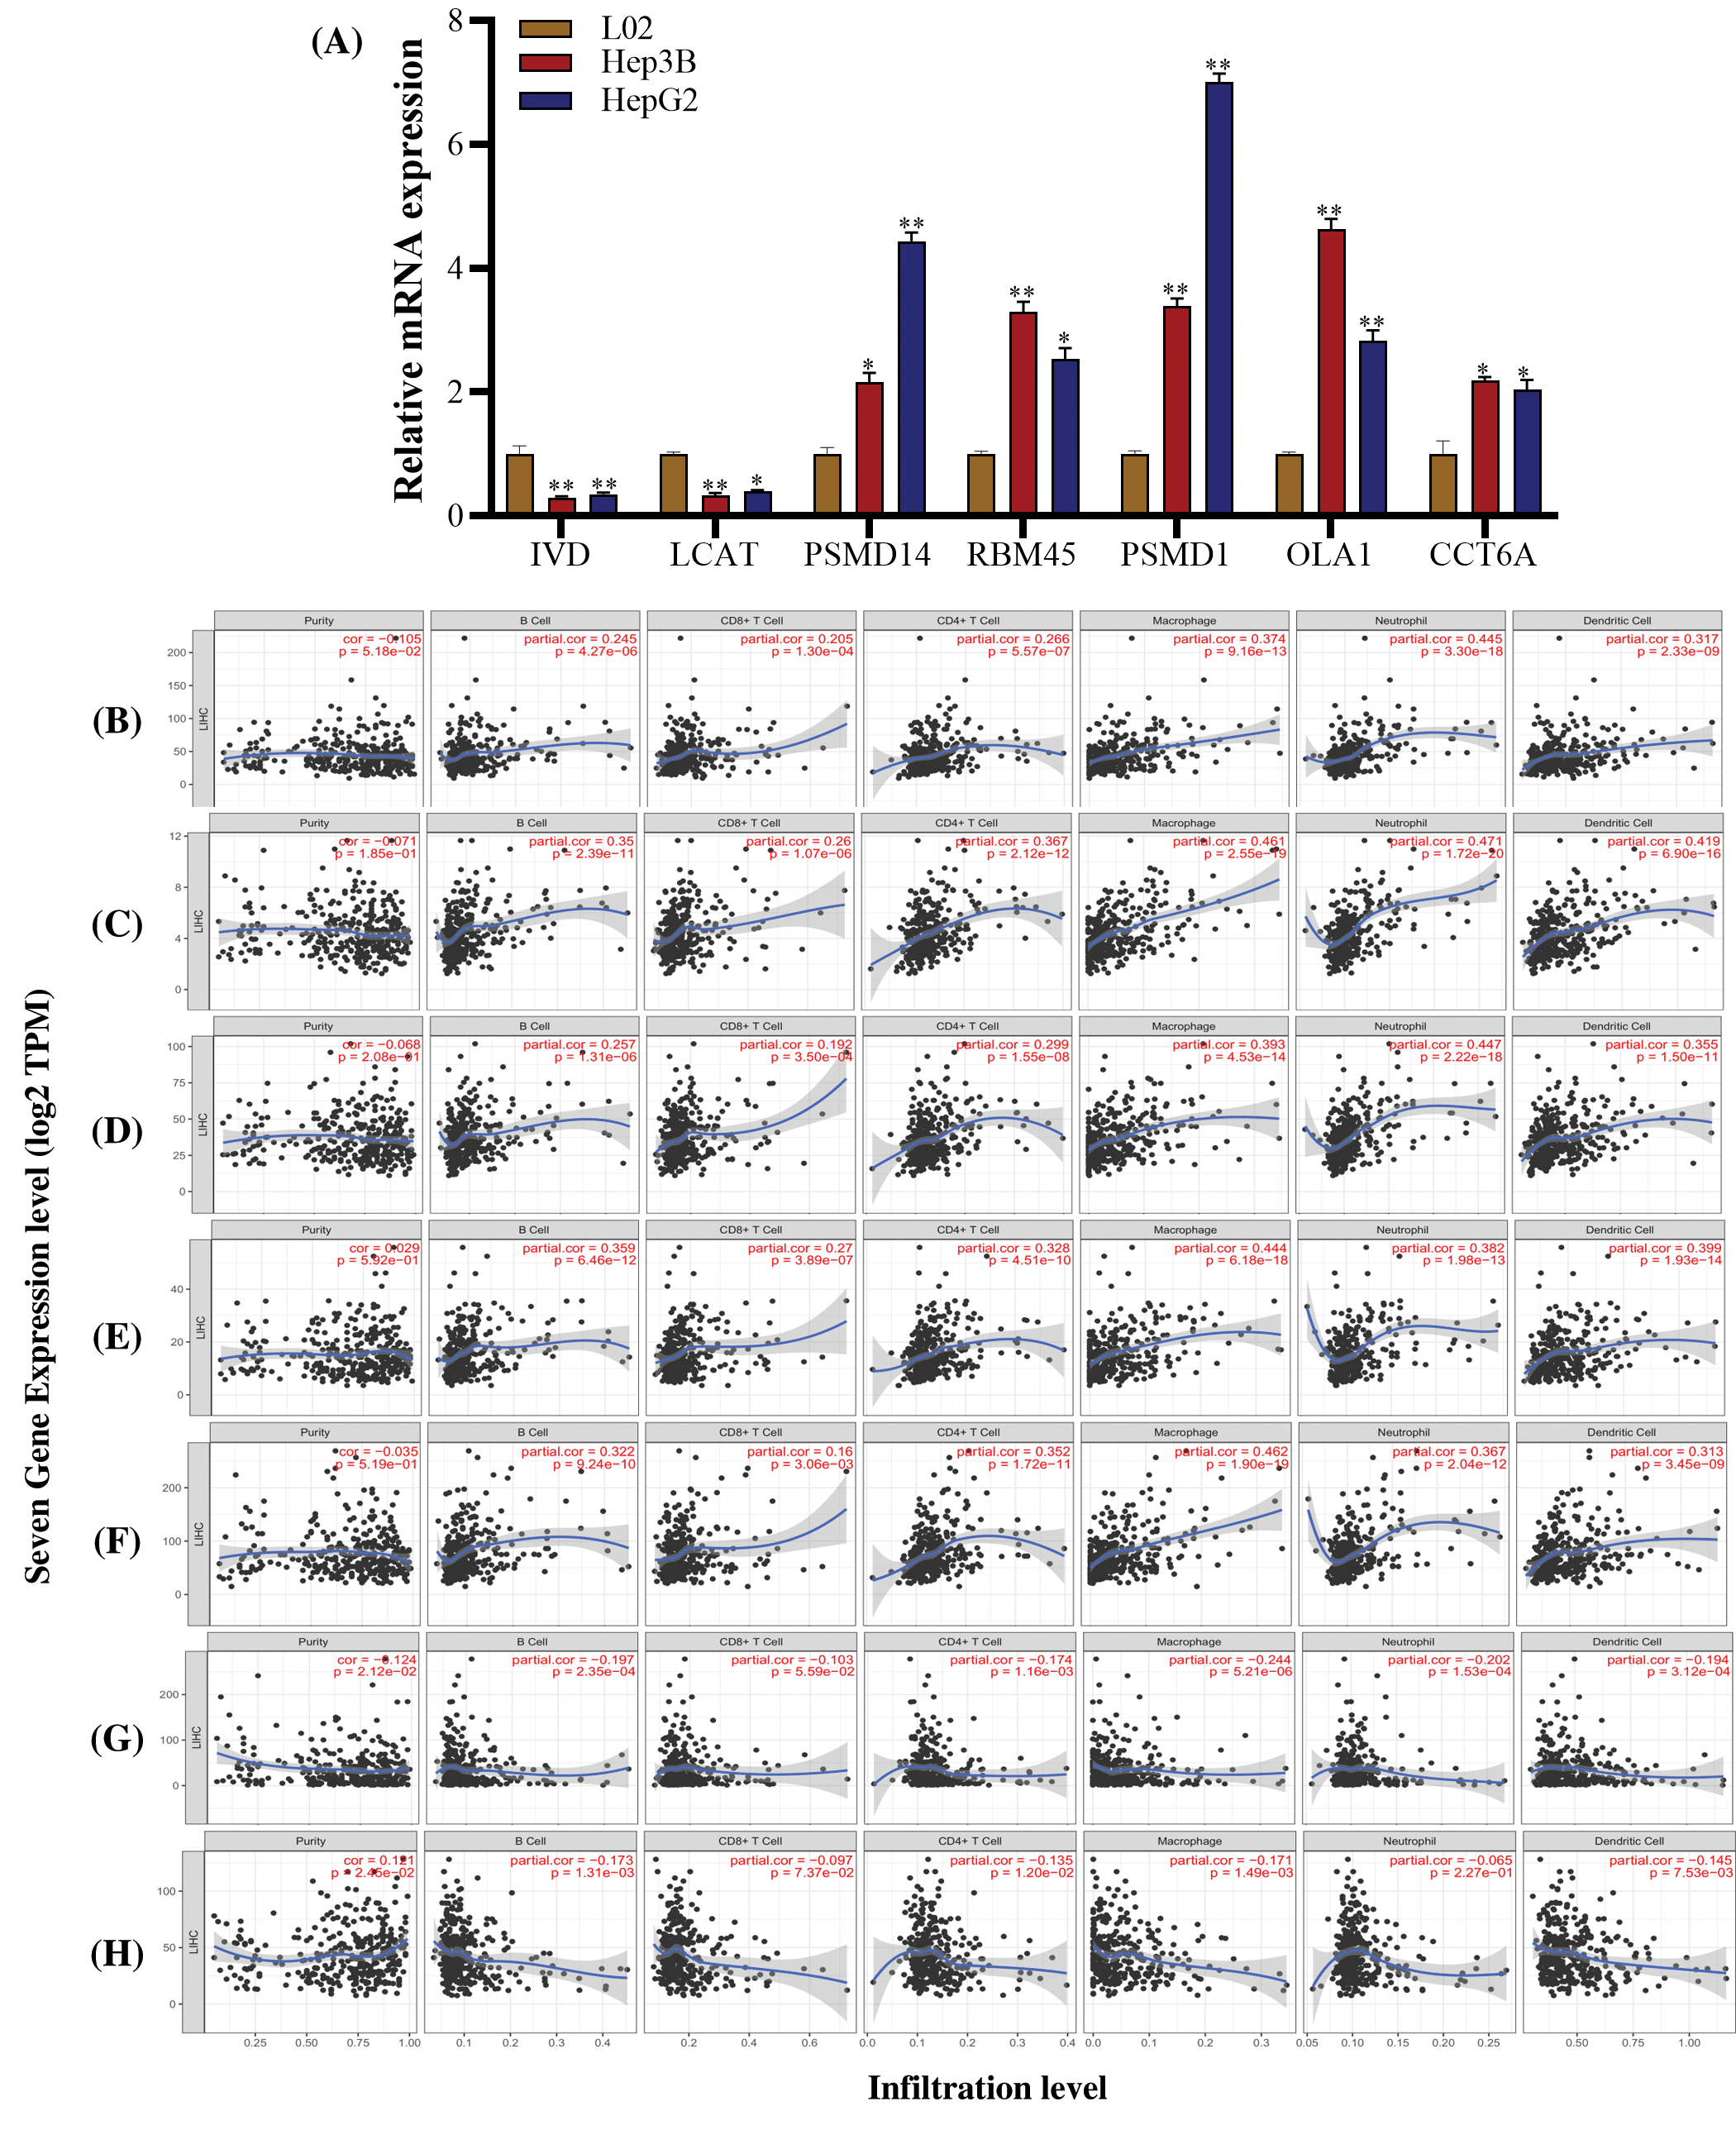
Figure 10: Correlation of seven genes expression with immune infiltration level in LIHC. (A) The levels of seven genes expression were examined in human HCC cell lines Hep3B, HepG2 and the normal liver cell L02. (B–F) PSMD14, RBM45, PSMD1, OLA1 and CCT6A mRNA expression level was significantly positively correlated with infiltrating levels of B cell, CD8+ T cell, CD4+ T cell, macrophage, neutrophils, and dendritic cells. (G) LCAT expression was significantly negatively related to tumor purity and had a significantly negative correlation with infiltrating levels of B cell, CD8+ T cell, CD4+ T cell, macrophage, neutrophils, and dendritic cells. (H) IVD expression was significantly positive related to tumor purity and had a significantly negative correlation with infiltrating levels of B cell, CD8+ T cell, CD4+ T cell, macrophage and dendritic cells and no significant correlations with neutrophils.
Correlation of PSMD14 with the proportion of TICs
To further confirm the correlation of PSMD14 expression with the proportion of tumor-infiltrating immune subsets was analyzed using CIBERSORT algorithm, and 21 kinds of immune cell profiles in LIHC samples were constructed. The results from the difference and correlation analyses showed that a total of six kinds of TICs were correlated with the expression of PSMD14 (Fig. 11). Among them, three kinds of TICs were positively correlated with PSMD14 expression, including Macrophage M0, T cells CD4 memory activated and NK cells resting; three kinds of TICs were negatively correlated with PSMD14 expression, including B cells naïve, NK cells activated and T cells CD4 memory resting. These results further supported that the levels of PSMD14 affected the immune activity of TICs.
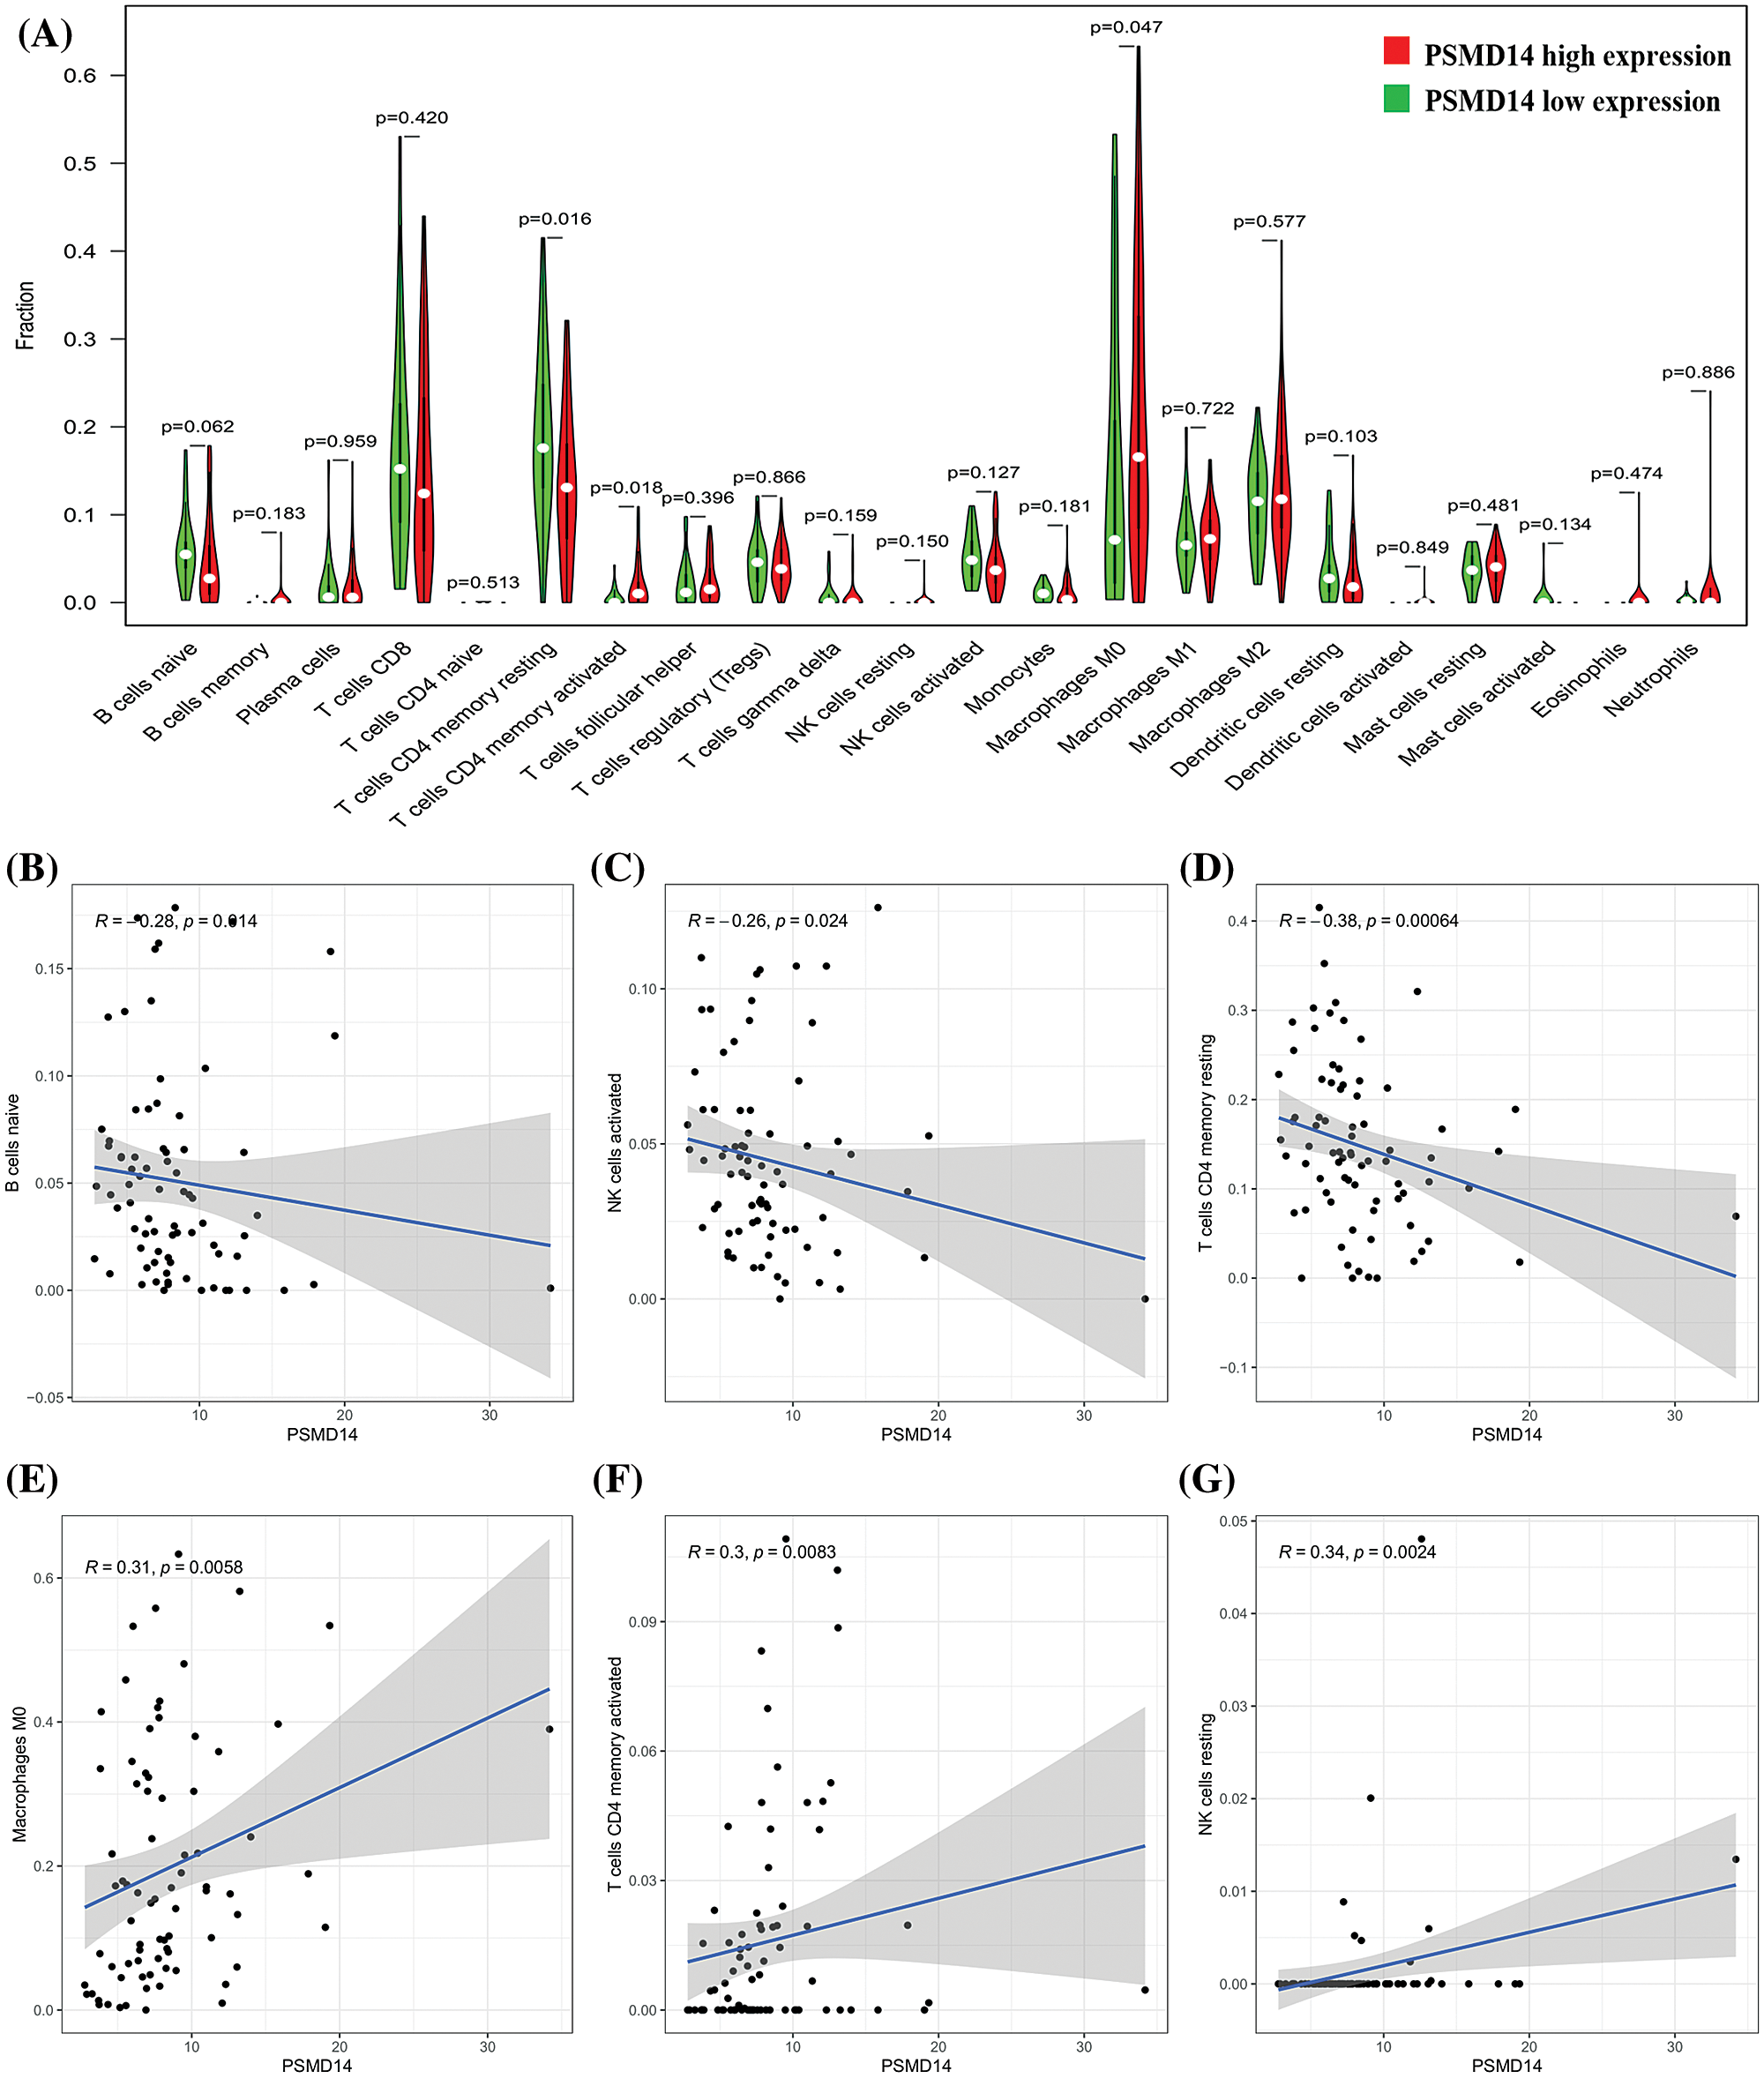
Figure 11: Correlation of TICs proportion with PSMD14 expression. (A) Violin plot showed the ratio differentiation of 21 kinds of immune cells between LIHC tumor samples with low or high PSMD14 expression relative to the median of PSMD14 expression level, and Wilcoxon rank sum was used for the significance test. (B–G) Scatter plot showed the correlation of 6 kinds of TICs proportion with the PSMD14 expression (P < 0.05). The blue line in each plot was fitted linear model indicating the proportion tropism of the immune cell along with PSMD14 expression, and Pearson coefficient was used for the correlation test.
HCC remains a common malignant tumor in the world, with a low survival rate. Thus, in view of the low survival rate for HCC, investigation of novel biomarkers and models is necessary. Recently, PSMD14-based signatures have revealed excellent potential in prognosis prediction of multiple cancers. The prognosis value of PSMD14 in cancers have been reported, including HCC, esophageal cancer, breast cancer (Luo et al., 2017; Lv et al., 2020; Zhu et al., 2018). Our results are in accordance with these studies, implying that PSMD14 could be a potential prognostic gene for HCC (Lv et al., 2020). To our knowledge, the expression of PSMD14 and its potential immune prognostic impact on HCC has not yet been explored. The present study focused on the potential immune prognostic role of PSMD14 and its associated genes in HCC.
In the present study, we verified the high expression of PSMD14 in HCC through Multiple databases, including ONCOMINE, TIMER, HPA, TCGA, ICGC. Bioinformatic analysis from TCGA and ICGC database demonstrated that high expression of PSMD14 in HCC was associated with clinical pathologic characteristics (high grade, histologic stage, surgical approach, T stage), survival time and poor prognosis. Univariate and multivariate cox regression shows PSMD14 as an independent prognostic factor (Tab. 4). In addition, we identified the PSMD14 associated novel biomarkers base on TCGA data set and confirmed PSMD14 associated genes model significantly correlated with prognosis using cox regression and lasso analysis. Finally, six genes (RBM45, PSMD1, OLA1, CCT6A, LCAT and IVD) were selected to fabricate a prognostic signature for HCC, validated its efficiency in TCGA and ICGC data set. A robust nomogram consisted of the 6-genes signature, age, gender, vascular invasion, tumor status and the stage were constructed for prognostic prediction of HCC patients. At the same time, the AUC value of the signature-based nomogram was nearly better than the AUC values of age, grade status and stage in 1-, 3-, 5-years. Next, we further verified the mRNA expression of 6-genes (RBM45, PSMD1, OLA1, CCT6A , LCAT and IVD) for HCC patients in the Oncomine, TIMER, TCGA and ICGC database, which is consistent with the results of previous studies (Huang et al., 2020; Long et al., 2019; Tan et al., 2019; Zeng et al., 2019). There are no reports of RBM45 and IVD genes in HCC. They may become new targets for the treatment of HCC, which need to be further studied.
A total of 7 key prognostic genes of HCC patients were selected in this paper. However, no review had been studied about intriguing mechanisms of these key genes in HCC except PSMD14 and CCT6A. PSMD14 was first found as a human pad1 homologue in 1997, a previously unidentified component of the human 26 s proteasome, which degrades proteins targeted for destruction by the ubiquitin pathway (Long et al., 2019). Lv et al. (2020) revealed that PSMD14, as a novel posttranslational regulator of GRB2, inhibits degradation of GRB2 via deubiquitinating this oncoprotein in HCC cells. Overexpressed CCT6A contributes to cancer cell growth by affecting the G1-to-S phase transition and predicts a negative prognosis in Hepatocellular Carcinoma. CCT6A may contribute to HCC cell proliferation by accelerating the G1-to-S transition and predicts a negative prognosis in Hepatocellular Carcinoma (Zeng et al., 2019). Consistent with the previously published papers, the high expression of PSMD14 and CCT6A were found positively related to the poor prognostic of HCC patients in our research.
Enrichment analysis revealed many significantly enriched pathways for the signature, of which most were metabolism related. To further investigate the functions of PSMD14 and its associated genes in HCC, we performed GSEA using TCGA data, GSEA showed that purine metabolism, pyrimidine metabolism and ubiquitin mediated proteolysis are differentially enriched between PSMD14 gene high expression and PSMD14 associated genes high risk phenotype. Besides, glycine serine and threonine metabolism, primary bile acid biosynthesis and retinol metabolism are differentially enriched between PSMD14 gene low expression and PSMD14 associated genes low risk phenotype.
Another important aspect of this study, seven genes mRNA expression was correlated with diverse immune infiltration levels in LIHC. PSMD14, RBM45, PSMD1, OLA1 and CCT6A mRNA expression level was significantly positively correlated with infiltrating levels of B Cell, CD8+ T cell, CD4+ T cell, Macrophage, Neutrophils and Dendritic cells. In addition, LCAT mRNA expression had a significantly negative correlation with infiltrating levels of tumor purity, B Cell, CD8+ T cell, CD4+ T cell, Macrophage, Neutrophils and Dendritic cells. IVD mRNA expression was significantly positive related to tumor purity and had a significantly negative correlation with infiltrating levels of B Cell, CD8+ T cell, CD4+ T cell, macrophage and dendritic cells and no significant correlations with neutrophils. Moreover, the correlation between seven immune genes expression and the signature genes of immune cells imply the role of its in regulating tumor immunology. In previous studies, when RNA seq data were used to analyze the relationship between gene mRNA levels and infiltrating immune cells, the correlation coefficients were mostly uncorrelated or a weak and moderate correlation. These genes have important guiding significance for the screening and application of immune cell infiltration. Of note, among the 7 genes, only the PSMD14 and CCT6A, have been reported that correlated with diverse immune cells levels. For instance, PSMD14 deficiency in macrophages resulting in deubiquitination of pro-IL-1β that restrains inflammatory responses for the maintenance of immune homeostasis (Zhang et al., 2018). CCT6A research shown that CD8+ T cells provide functional in cytokine secretion and lytic activity upon of their cognate antigens, it was used in personalized adoptive T-cell therapy of melanoma (Höfflin et al., 2015). These correlations could be indicative of a potential mechanism for 7 immune-related genes regulate immune cells in HCC. The above suggested that PSMD14 and signature genes could play a significant role in recruitment and regulation of immune infiltrating cells in HCC.
Lv et al. (2020) revealed the functional significance of PSMD14 in HCC progression and the underlying mechanism. However, the related functions and mechanisms of PSMD14-based signature have not been reported. We must acknowledge that there are potential limitations in our analysis. Because of limitations in our study design, the correlation between PSMD14-based signature mRNA and protein expression could not be clearly assessed in this report, the function and the mechanism of participation. Further study in HCC cells and tissues were required.
We systematically analyzed the expression and prognosis of PSMD14 and screened the immune prognostic genes significantly related to PSMD14 from the open database to construct and verify the immune-related genes. We found that (PSMD14, RBM45, PSMD1, OLA1, CCT6A, LCAT and IVD) are immune prognostic signatures of HCC. Therefore, this study deepens our understanding of HCC IRGs and provides new potential biomarkers for prognosis and treatment.
Authors’ Contribution: Chuan Tian and Mubalake Abudoureyimu wrote the paper. Xinrong Lin and Hao Zhou assisted in the preparation of the manuscript and editing. Xiaoyuan Chu and Rui Wang coordinated all the research activities, from the design of the experiment to the final correction of the manuscript. All authors read and approved the final manuscript.
Availability of Data and Materials: The datasets generated during and/or analysed during the current study are available from the corresponding author on reasonable request.
Funding Statement: This work was supported by grants from the National Natural Science Foundation of China (81772995 and 81472266), the Excellent Youth Foundation of Jiangsu Province, China (BK20140032) and Jiangsu Province’s Key Provincial Talents Program (ZDRCA2016090).
Conflicts of Interest: The authors declare that they have no conflicts of interest to report regarding the present study.
Butler LR, Densham RM, Jia J, Garvin AJ, Stone HR et al. (2012). The proteasomal de-ubiquitinating enzyme POH1 promotes the double-strand DNA break response. EMBO Journal 31: 3918–3934. [Google Scholar]
Byrne A, Mclaren RP, Mason P, Chai L, Dufault MR et al. (2010). Knockdown of human deubiquitinase PSMD14 induces cell cycle arrest and senescence. Experimental Cell Research 316: 258–271. [Google Scholar]
Cai MJ, Cui Y, Fang M, Wang Q, Zhang AJ et al. (2019). Inhibition of PSMD4 blocks the tumorigenesis of hepatocellular carcinoma. Gene 702: 66–74. [Google Scholar]
Chen X, Cheung ST, So S, Fan ST, Barry C et al. (2002). Gene expression patterns in human liver cancers. Molecular Biology of the Cell 13: 1929–1939. [Google Scholar]
Höfflin S, Prommersberger S, Uslu U, Schuler G, Schmidt CW et al. (2015). Generation of CD8+ T cells expressing two additional T-cell receptors (TETARs) for personalised melanoma therapy. Cancer Biology & Therapy 16: 1323–1331. [Google Scholar]
Huang S, Zhang C, Sun C, Hou Y, Zhang Y et al. (2020). Obg-like ATPase 1 (OLA1) overexpression predicts poor prognosis and promotes tumor progression by regulating P21/CDK2 in hepatocellular carcinoma. Sedentary Life and Nutrition 12: 3025. [Google Scholar]
Long J, Chen P, Lin J, Bai Y, Yang X et al. (2019). DNA methylation-driven genes for constructing diagnostic, prognostic, and recurrence models for hepatocellular carcinoma. Theranostics 9: 7251. [Google Scholar]
Luo G, Hu N, Xia X, Zhou J, Ye C (2017). RPN11 deubiquitinase promotes proliferation and migration of breast cancer cells. Molecular Medicine Reports 16: 331–338. [Google Scholar]
Lv J, Zhang S, Wu H, Lu J, Lu Y et al. (2020). Deubiquitinase PSMD14 enhances hepatocellular carcinoma growth and metastasis by stabilizing GRB2. Cancer Letters 469: 22–34. [Google Scholar]
Pan L, Fang J, Chen MY, Zhai ST, Zhang B et al. (2020). Promising key genes associated with tumor microenvironments and prognosis of hepatocellular carcinoma. World Journal of Gastroenterology 26: 789. [Google Scholar]
Rimassa L, Danesi R, Pressiani T, Merle P (2019). Management of adverse events associated with tyrosine kinase inhibitors: Improving outcomes for patients with hepatocellular carcinoma. Cancer Treatment Reviews 77: 20–28. [Google Scholar]
Roessler S, Jia HL, Budhu A, Forgues M, Ye QH et al. (2010). A unique metastasis gene signature enables prediction of tumor relapse in early-stage hepatocellular carcinoma patients. Cancer Research 70: 10202–10212. [Google Scholar]
Seo D, Jung SM, Park JS, Lee J, Ha J et al. (2019). The deubiquitinating enzyme PSMD14 facilitates tumor growth and chemoresistance through stabilizing the ALK2 receptor in the initiation of BMP6 signaling pathway. EBioMedicine 49: 55–71. [Google Scholar]
Shi Y, Men X, Li X, Yang Z, Wen H (2020). Research progress and clinical prospect of immunocytotherapy for the treatment of hepatocellular carcinoma. International Immunopharmacology 82: 106351. [Google Scholar]
Song Y, Li S, Ray A, Das D, Qi J et al. (2017). Blockade of deubiquitylating enzyme Rpn11 triggers apoptosis in multiple myeloma cells and overcomes bortezomib resistance. Oncogene 36: 5631–5638. [Google Scholar]
Tan Y, Jin Y, Wu X, Ren Z (2019). PSMD1 and PSMD2 regulate HepG2 cell proliferation and apoptosis via modulating cellular lipid droplet metabolism. BMC Molecular Biology 20: 24. [Google Scholar]
Wang B, Ma A, Zhang L, Jin WL, Qian Y et al. (2015). POH1 deubiquitylates and stabilizes E2F1 to promote tumour formation. Nature Communications 6: 8704. [Google Scholar]
Wang B, Xu X, Yang Z, Zhang L, Liu Y et al. (2019). POH1 contributes to hyperactivation of TGF-β signaling and facilitates hepatocellular carcinoma metastasis through deubiquitinating TGF-β receptors and caveolin-1. EBioMedicine 41: 320–332. [Google Scholar]
Wurmbach E, Chen YB, Khitrov G, Zhang W, Roayaie S et al. (2007). Genome-wide molecular profiles of HCV-induced dysplasia and hepatocellular carcinoma. Hepatology 45: 938–947. [Google Scholar]
Zeng G, Wang J, Huang Y, Lian Y, Chen D et al. (2019). Overexpressing CCT6A contributes to cancer cell growth by affecting the G1-To-S phase transition and predicts a negative prognosis in hepatocellular carcinoma. OncoTargets and Therapy 12: 10427. [Google Scholar]
Zhang L, Liu Y, Wang B, Xu G, Yang Z et al. (2018). POH1 deubiquitinates pro-interleukin-1β and restricts inflammasome activity. Nature Communications 9: 4225. [Google Scholar]
Zhu R, Liu Y, Zhou H, Li L, Li Y et al. (2018). Deubiquitinating enzyme PSMD14 promotes tumor metastasis through stabilizing SNAIL in human esophageal squamous cell carcinoma. Cancer Letters 418: 125–134. [Google Scholar]
 | This work is licensed under a Creative Commons Attribution 4.0 International License, which permits unrestricted use, distribution, and reproduction in any medium, provided the original work is properly cited. |