DOI:10.32604/biocell.2021.015053
www.techscience.com/journal/biocell
| Biocell DOI:10.32604/biocell.2021.015053 | www.techscience.com/journal/biocell |
| Article |
Development and characterization of Simple Sequence Repeat (SSR) markers from the genomic sequence of sweet potato [Ipomoea batatas L. (Lam)]
Department of Biotechnology, College of Coastal Agricultural Sciences, Guangdong Ocean University, Zhanjiang, 524088, China
*Address correspondence to: Hongbo Zhu, tdzhu@126.com
Received: 18 November 2020; Accepted: 11 January 2021
Abstract: Sweet potato is a multifunctional root crop with many essential nutrients and bioactive compounds. Due to its genetic complexity and lack of genomic resources, efficient genetic studies and cultivar development lag far behind other major crops. Simple sequence repeats (SSRs) offer an effective molecular marker technology for molecular-based breeding and for locating important loci in crop plants, but only a few have previously been developed in sweet potato. To further explore new SSR markers and accelerate their use in sweet potato genetic studies, genome-wide characterization and development of SSR markers were performed using the recently published genome of sweet potato cultivar, Taizhong6. In this study, a set of 2,431 primer pairs were developed from 133,727 SSRs identified in the sweet potato genome using the Perl script MISA software. The average frequency was one SSR per 6.26 kb, with dinucleotides (38.5%) being the most dominant repeat motif. The main motif types in all repeats were AT/AT, AAT/ATT, A/T, AAAT/ATTT, AAAAT/ATTTT and AAAAAT/ATTTTT accounting for 78.29% of the total SSRs. 50% of the 100 randomly selected primer pairs amplified 251 alleles, and the average number of alleles was 5.02 per locus for values ranging between 1 and 13. The UPGMA cluster analysis grouped the 24 sweet potato genotypes into four clusters at a similarity coefficient of 0.68. The SSR markers currently developed will provide valuable genetic resources for germplasm identification, genetic diversity analysis, and functional genomics studies in sweet potato and related species.
Keywords: SSR markers; Sweet potato; Genetic diversity; Polymorphism
Sweet potato [Ipomoea batatas L. (Lam)] is an essential food crop belonging to the Convolvulaceae family. Currently, cultivated sweet potato is extensively cultured in over 100 countries worldwide but originally native to Central America (Rozen and Skaletsky, 2000), traversing the Orinoco River of Venezuela and the Yucatán Peninsula of Mexico. Hence, this region is considered the center of diversity and rich morphological variation of sweet potato (Roullier et al., 2013). Sweet potato is of great economic importance due to the excellent supply of dietary fiber, vitamins, minerals, and phenolic compounds (Lebot et al., 2016). Furthermore, it is appreciated greatly for its health-promoting functions such as anti-carcinogenic and cardiovascular disease-preventing properties, in addition to its radical-scavenging activity (Chandrasekara and Josheph Kumar, 2016). Sweet potato is a highly heterogeneous auto-hexaploid (2n = 6x = 90) plant with complex genetics and large genome size (~3 Gb). These complexities, coupled with the lack of genomic resources (Yan et al., 2015), hinder breeding progress. Thus, genetic and functional analyses, as well as cytological studies in sweet potato, lag far behind other major food crops such as wheat rice, and maize.
The advancement of next-generation sequencing has generated scores of datasets for many plant species that provide useful genomic materials for developing efficient molecular markers for genetic analyses (Yang et al., 2015a). Molecular marker technology, benefiting from advancement in high-throughput DNA-sequencing has been reported to play an essential role in genetic diversity and relationship assessment in plants (Kumar et al., 2009). Currently, this technology has been widely used as an effective tool through marker-assisted selection to improve genomic selection and accelerate breeding progress in many plant species. In recent years, molecular markers such as random amplified polymorphic DNA (RAPD), amplified fragment length polymorphism (AFLP), single nucleotide polymorphism (SNP), and microsatellite or simple sequence repeat (SSR) have been employed for origin and dispersal study (Roullier et al., 2011), genetic diversity analysis (Tumwegamire et al., 2011), and construction of genetic linkage maps (Zhao et al., 2013) in sweet potato. Interestingly, despite the rapid development of a new generation of molecular markers such as InDels and SNPs (a more stable and abundant type of genetic marker), SSR markers remain indispensable for many genetic-based studies in sweet potato (Edwards and Batley, 2010; Liu et al., 2012). Simple Sequence Repeat (SSR) is a short repeat sequence composed of 1–6 bases, widely distributed in the genomes of both prokaryotic and eukaryotic organisms (Venter et al., 2001). SSR markers are extensively used as molecular markers for crop improvement and other genetic-based studies due to their allele specificity, high polymorphism, co-dominant and multi-allelic nature (Silva et al., 2013; Yue et al., 2014). In sweet potato, SSR markers are utilized extensively for the construction of genetic maps, diversity analysis, and variety identification (Ngailo et al., 2016; Yada et al., 2015; Yang et al., 2015b). They are widely distributed in both transcribed and non-coding sequences, generally described as EST- and genomic-SSRs, respectively (Morgante et al., 2002). EST-SSRs are mostly restricted to highly conserve transcribed regions and are less polymorphic. In contrast, genomic-SSRs are widely distributed throughout the genome and highly polymorphic (La Rota et al., 2005). Recent advances in molecular marker technology have accelerated the large-scale development of genomic-SSR markers in many plants (Iniguez-Luy et al., 2008; Nunome et al., 2009; Wang et al., 2011a; Wen et al., 2010). To a greater extent, SSR markers in sweet potato are derived from expressed sequences mined from public databases (Wang et al., 2011b), genomic libraries (Hu et al., 2004), and pyrosequencing (Tao et al., 2012; Xie et al., 2012).
Though some SSR markers have been developed and used in sweet potato, their number, quality, and availability are restricted, in that only a few could amplify or show polymorphisms among the diverse sweet potato varieties (Schafleitner et al., 2010; Wang et al., 2011b), and most of them are EST-SSR markers. However, the development and application of genomic-SSR markers remain limited in sweet potato due to challenges to its genome sequence dissection. Thus, there is a great need to develop novel genomic-SSR markers to accelerate genomic and genetic studies in sweet potato. In this study, we evaluated the frequency and relative number of SSRs in the sequenced genome of sweet potato (cv. Taizhong6), developed a set of 2,431 SSR markers from the assembled genomic sequences, and assessed the genetic diversity in 24 sweet potato cultivars. These SSR markers will offer new genetic resources for marker-assisted selection in sweet potato breeding, adding up to the available resources for analyzing the molecular phylogeny and genetic diversity of sweet potato and related species.
Plant materials and DNA extraction
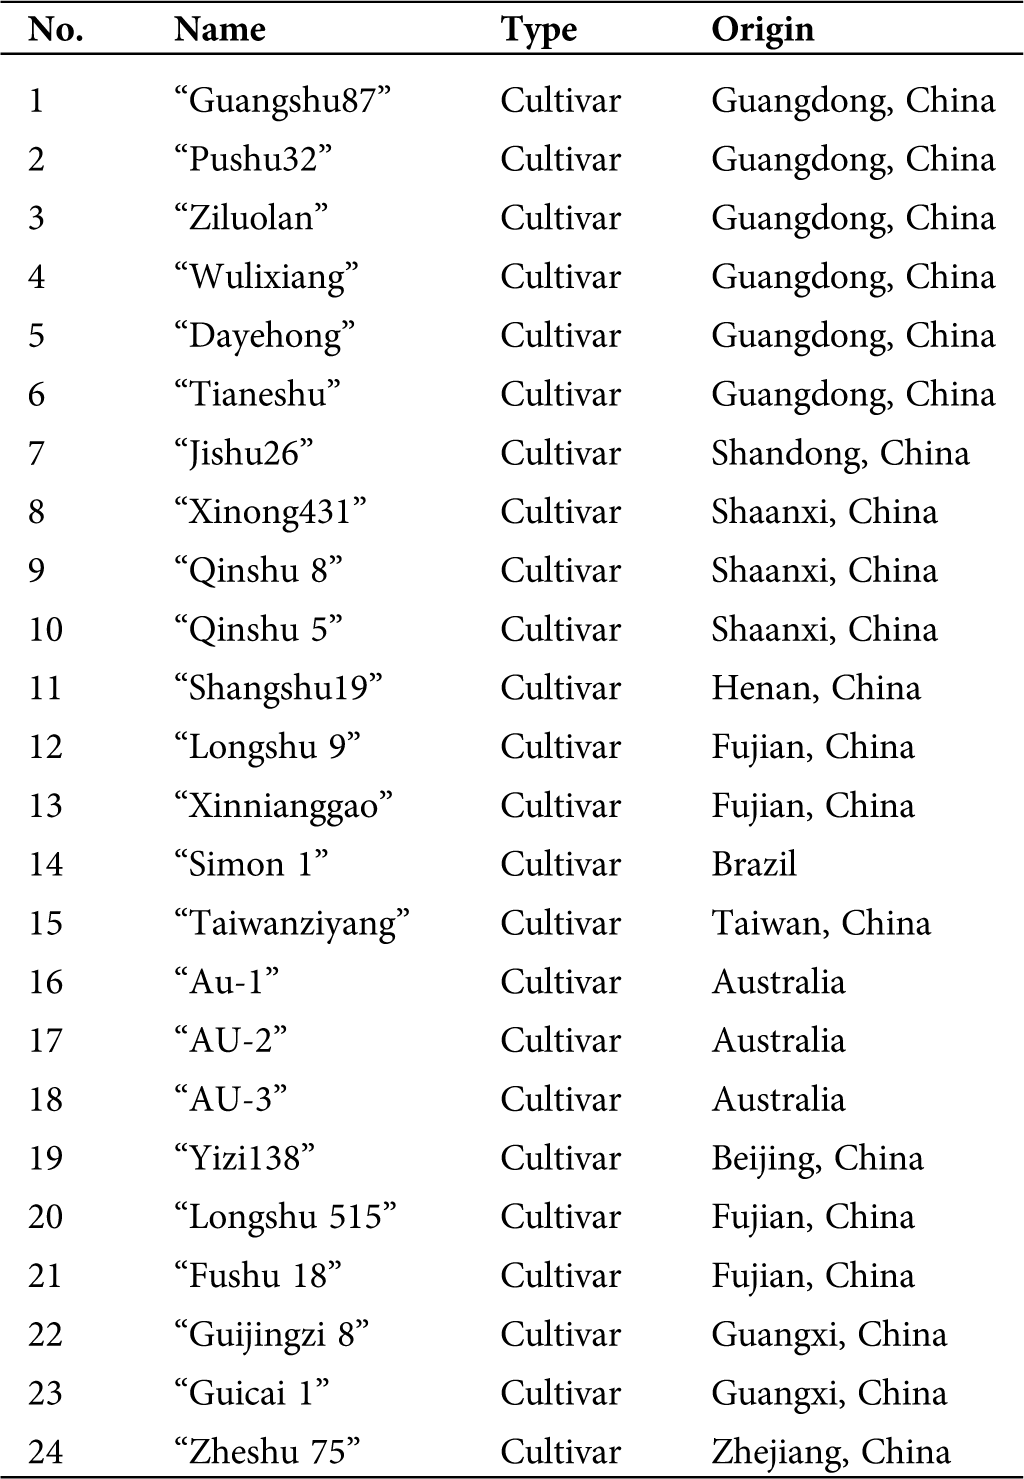
A total of 24 sweet potato genotypes were sampled (Tab. 1) for this study. The test materials were obtained from the Research Field of Guangdong Ocean University, Guangdong, China. Genomic DNA from fresh young leaves was extracted using the CTAB (cetyltrimethyl ammonium bromide) protocol with few modifications (Porebski et al., 1997). DNA concentration and quality were determined using NanoDrop ND-2000 (Thermo Scientific, Wilmington, DE, USA) and 1% agarose gel electrophoresis. Finally, the DNA was liquefied in 1× TE buffer (10 mM Tris-HCl and 1 mM EDTA, pH 8.0), and the working concentration was adjusted to 50 ng/μL with ddH2O. The genomic sequences of sweet potato cv. Taizhong6 was downloaded from the Ipomoea Genome Hub (https://ipomoea-genome.org/download_genome.htm).
Table 1: List of 24 sweet potato genotypes used in the study
SSRs from the sweet potato genome were identified using the Perl Script MISA (MIcroSAtellite) identification software (http://pgrc.ipk-gatersleben.de/misa, Thiel et al., 2003). The minimum consecutive repeat units for mono- to hexa-nucleotide sequences were 20, 10, 7, 5, 4, and 4, respectively. A total of 2,431 SSR primer pairs were designed based on the selected SSR motifs using Primer3 ver. 4.0.0 (http://bioinfo.ut.ee/primer3/, Untergasser et al., 2012). The amplified product size was 100–280 bp, primer length ranged between 18–27 bp (optimum; 20 bp), and the minimum interval between two SSR sequences was 100 bp. The CG contents ranged between 20% and 80%, the mean melting temperature (Tm) was 60°C (from 57°C to 63°C), and all other parameters were default values.
SSR primer validation and marker amplification
From the developed primers, 50 primer pairs with good amplification effects and clear stable bands were selected after the initial screening to amplify the genomic DNA of 24 sweet potato genotypes. The frequency and distribution of all SSRs were analyzed and measured as one SSR per kb of sequence. SSR markers were grouped according to the location of the SSR motifs in the gene. To optimize PCR amplification condition, a reaction volume of 20 μL was used containing 1.5 μL genomic DNA (20 ng/μL), 0.4 μL Taq enzyme (3 U/μL), 2 μL 10× PCR buffer, 0.2 μL dNTP (10 mmol/L), 1 μL each of the Forward and Reverse primers (2 μmol/L), and sterile double distilled water added to make the final volume (Xie et al., 2017). PCR reaction procedure was; pre-denaturation at 94°C for 5 min, followed by 33 cycles of denaturation at 94°C for 30 s, annealing at 55°C for 30 s, extension at 72°C for 30 s, and a final extension at 72°C for 5 min using the Takara PCR Thermal Cycler Dice.
Allele identification and genetic diversity analysis
Amplified products were identified and separated on a 6% non-denaturing polyacrylamide gel electrophoresis (PAGE). The electrophoresis buffer contained 1× TBE (100 mM Tris–HCl, 83 mM boric acid, 1 mM Na2EDTA, pH 8.0) (Han et al., 2008). Electrophoresis at 200 V and 100 mA for 120 min was executed after loading of samples. The silver staining method was employed for allele visualization and selection of suitable SSR primers. Markers were scored manually, and the polymorphic ones were selected for genetic analysis (Chevallet et al., 2006).
Each SSR allele for a given primer pair was scored 1 and 0 for samples with and without band, respectively, and a “0, 1” binary matrix was established. PowerMarker ver.3.25 was used to calculate the number of alleles per locus for the genotypes (Liu and Muse, 2005). The clustering analysis based on the genetic similarity coefficient was calculated by the unweighted pair group method with arithmetic average (UPGMA) method (Nei and Li, 1979) and a dendrogram generated using the Numerical Taxonomy and Multivariate Analysis System (NTSYS) software Ver. 2.02 (Rohlf, 2000).
Distribution of SSRs in the sweet potato genome
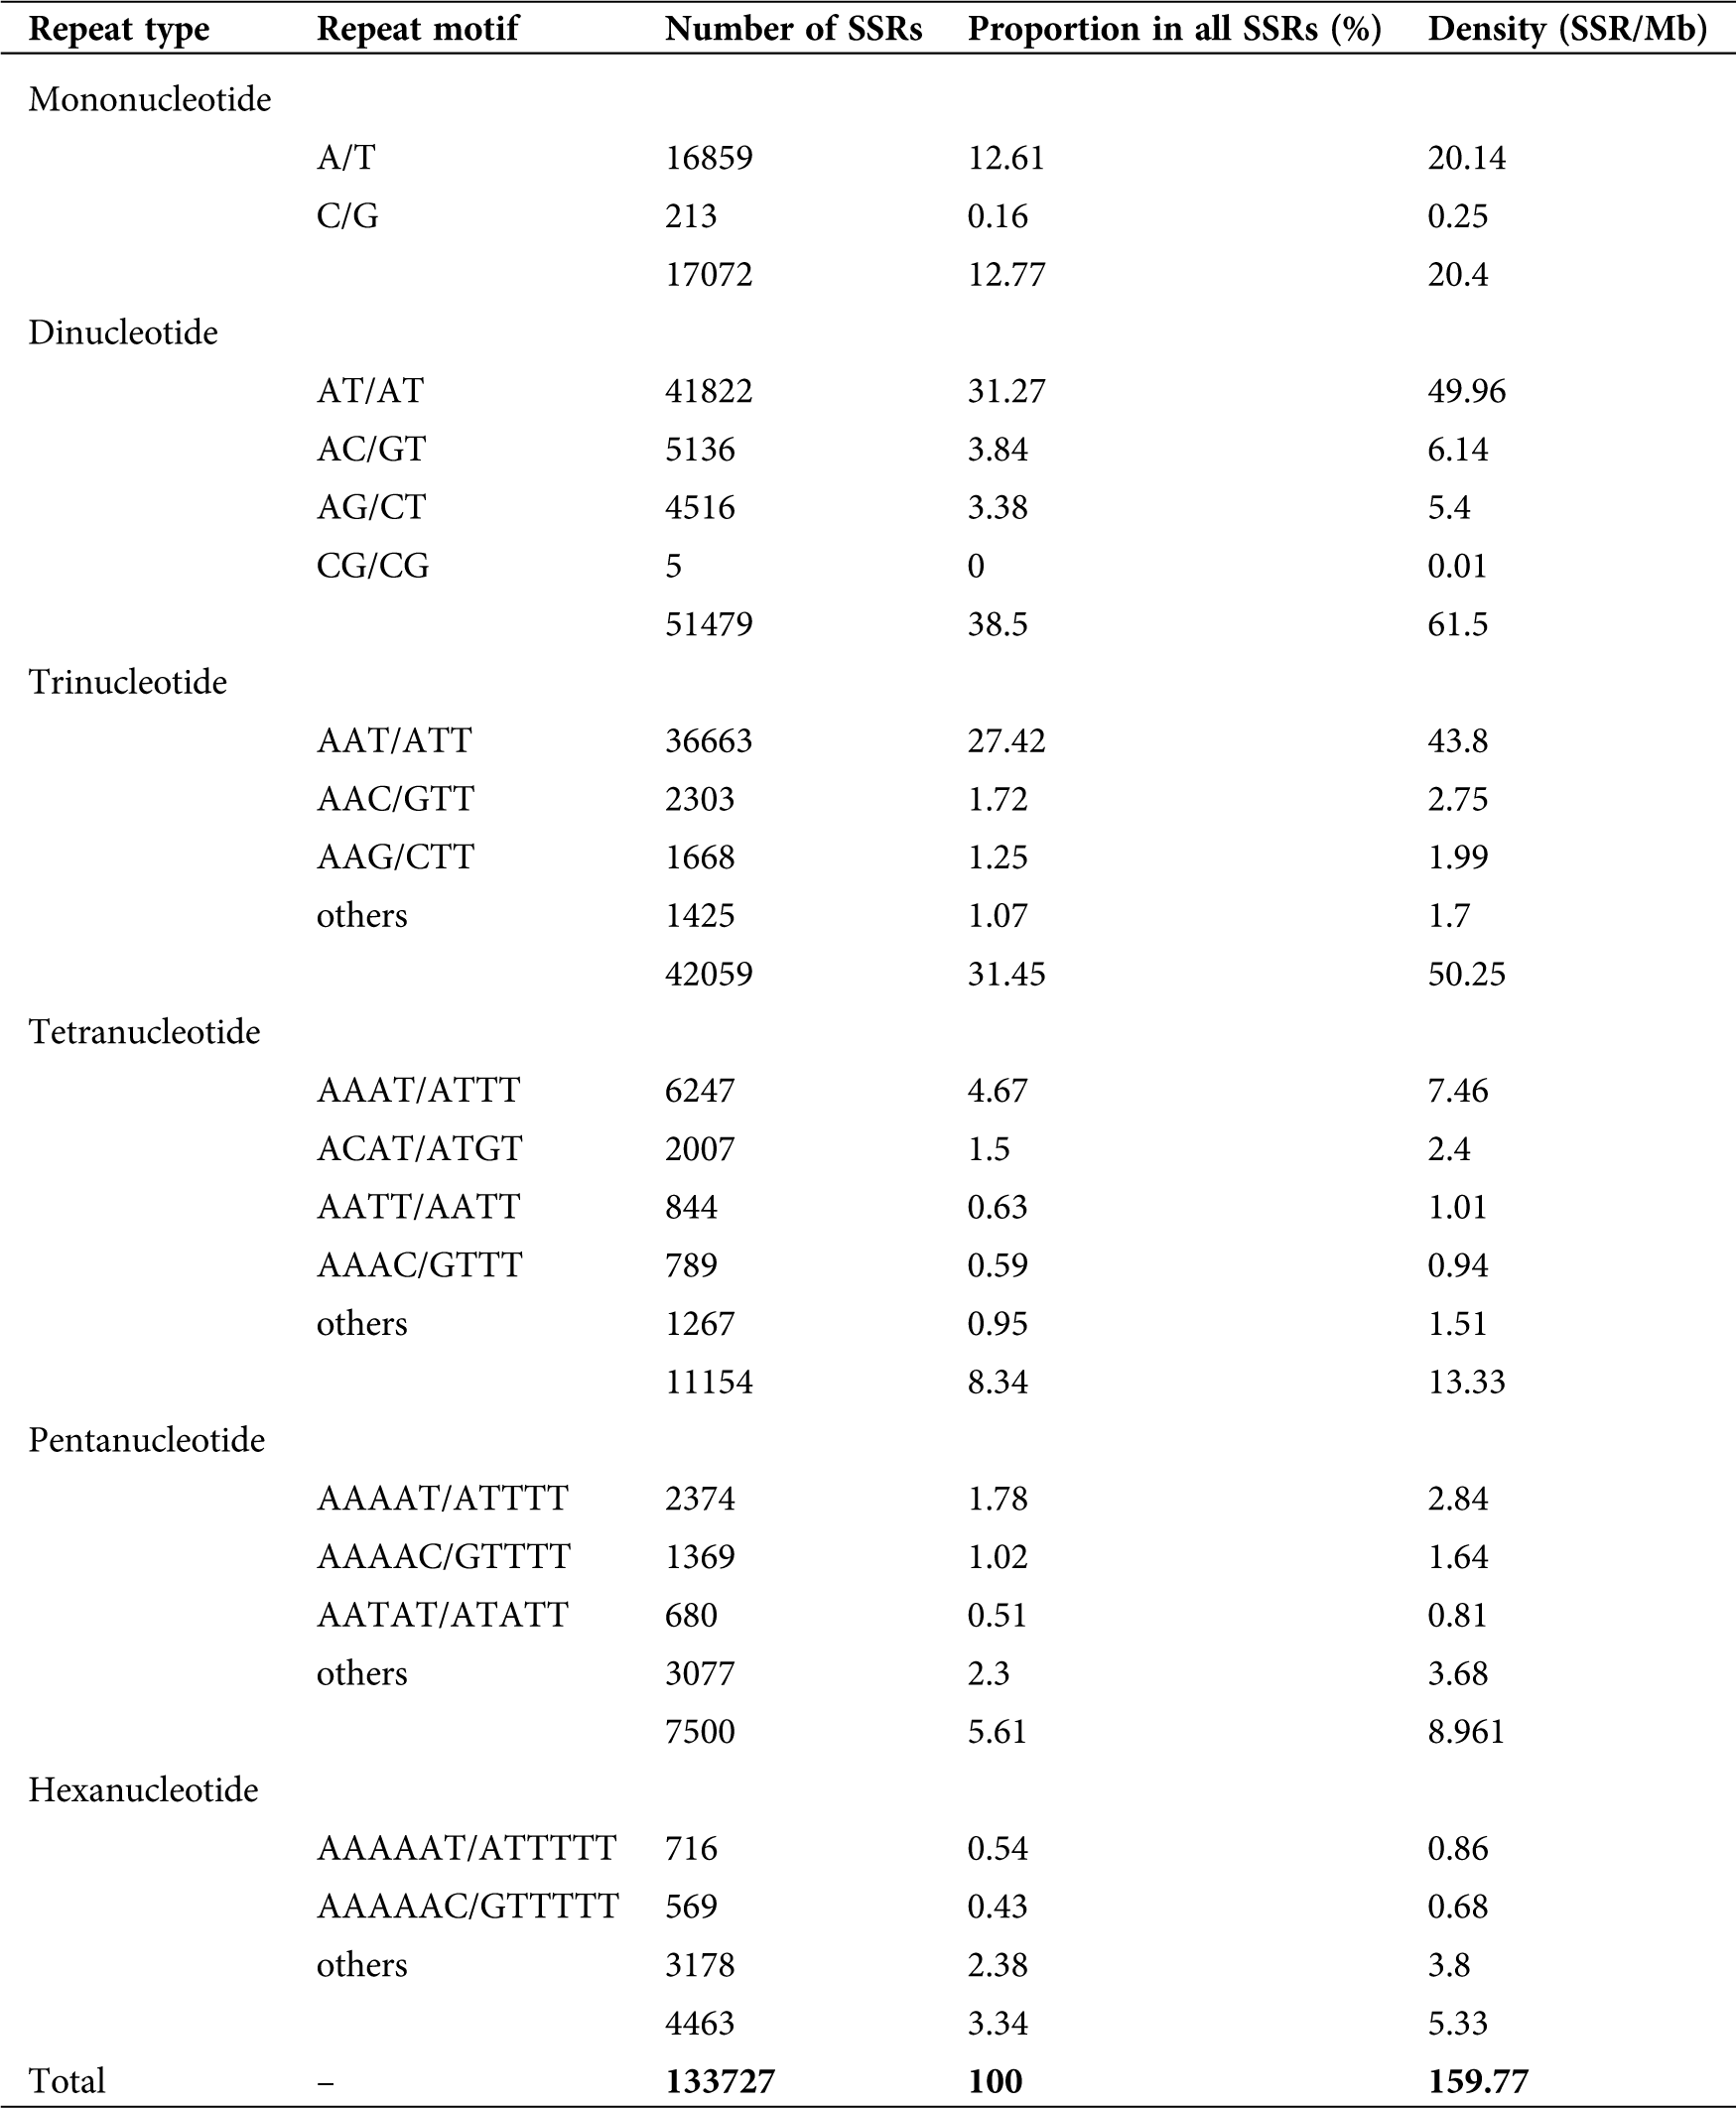
Based on the sweet potato (cv. Taizhong6) genome sequence, SSRs identified were characterized as mono- to hexa-nucleotides. The 133,727 SSRs identified had a density of 159.77 SSR/Mb or one SSR per 6.26 kb of sequence on average. Dinucleotides (38.50%), trinucleotides (31.45%), and mononucleotides (12.77%) were the most abundant repeat motif representing 82.71% of the total SSR, while the remaining repeat motifs represented 17.29% (Tab. 2; Suppl. Fig. A1). The most dominant motifs accounted for 78.29% of all SSRs; among them, AT/AT (81.24%), AC/GT (9.98%), and AG/CT (8.77%) were the most abundant dinucleotide repeats, while A/T (98.75%), AAT/ATT (87.17%) and AAAT/ATTT (56.01%) were the most dominant motifs among mononucleotides, trinucleotides and tetra nucleotides respectively (Tab. 2; Suppl. Fig. A1). Of all the repeating sequences, AT/AT were the most common representing 31.27% followed by AAT/ATT (27.42%), A/T (12.61%), AAAT/ATTT (4.67%), AC/GT (3.84%), AG/CT (3.38%), and AAAAT/ATTTT (1.7%; Tab. 2).
Table 2: Distribution of SSRs in the sweet potato genome
SSR marker development and characterization
To ascertain the novelty of the designed SSR primer pairs, the SSR-containing sequences from the genomic sequence of sweet potato cv. Taizhong6 was analyzed. A total of 133,727 SSRs were identified for mono- to hexa-nucleotide repeats. Of these repeat sequences, dinucleotides (38.50%), trinucleotides (31.45%), and mononucleotides (12.77%) represented 82.71% of the total SSRs (Tab. 2; Suppl. Fig. A1). Out of the 2,431 SSR primer pairs designed, 100 primer pairs were randomly selected for validation.
The efficiency of the SSR primer pairs was evaluated and validated in 24 sweet potato genotypes using the 100 randomly selected primer pairs. Out of these primers, 50 primer pairs (50%) effectively amplified clear bands, with 27 primer pairs being polymorphic. The amplification results also showed that the 50 primer pairs amplified 251 alleles in the 24 sweet potato genotypes with a mean allele number of 5.02 per locus for the values ranging between 1 and 13 (Tab. 3). Several bands are shown in the profile (Fig. 1) to depict the PCR amplification in the 24 cultivars used for this study, while the characteristics of the 50 randomly selected primer pairs are outlined in Tab. 3.
Table 3: Characteristics of the 50 SSR primer pairs validated in 24 sweet potato genotypes
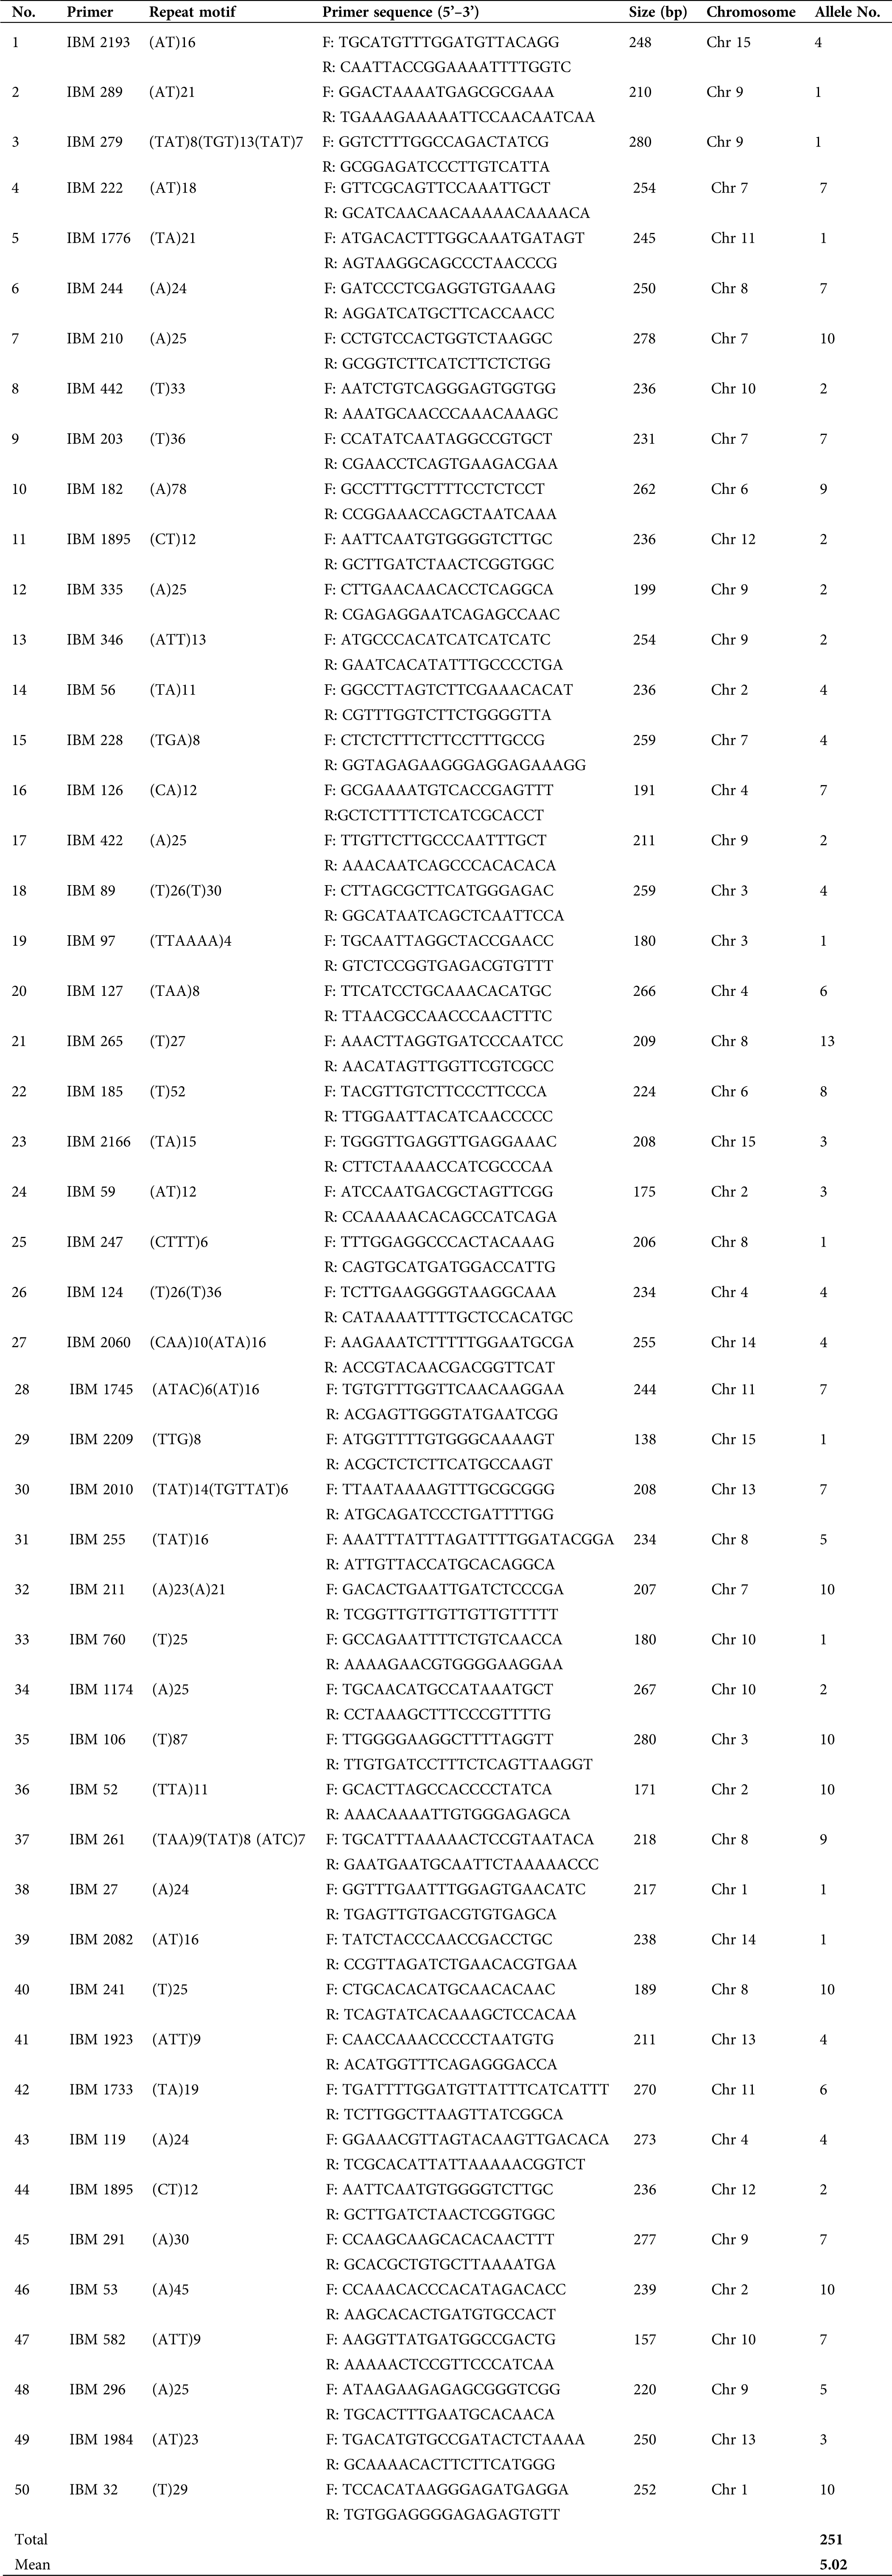
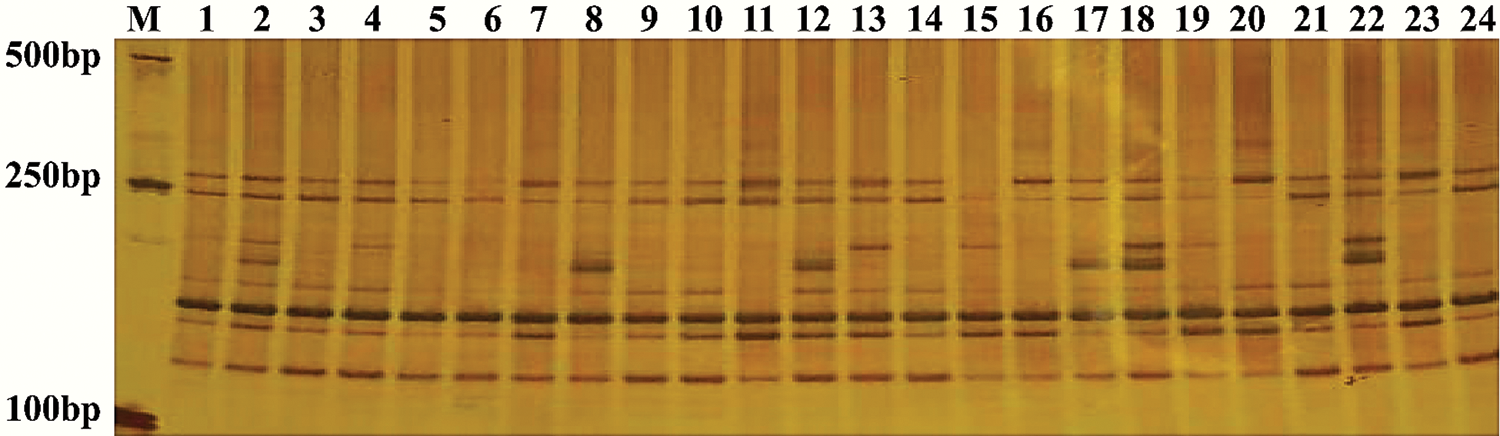
Figure 1: Amplification results generated by IBM 241 in the 24 sweet potato varieties.
The genetic diversity of 24 sweet potato varieties as analyzed by the 50 primer pairs revealed a genetic distance range of 0.605 to 1.00 with an average distance of 0.740 among the 24 sweet potato varieties studied (Suppl. Tab. A1). According to the UPGMA clustering results, the genetic similarity coefficient between the 24 sweet potato germplasms was relatively high-ranging between 0.66 and 0.87 with an average of 0.765 (Fig. 2). The dendrogram generated grouped the 24 resources into 4 clusters (Cluster I–IV; Fig. 2) at a similarity coefficient of 0.68. Among them, Dayehong and Fushu18 were the same with the closest genetic association, and the similarity coefficient was 0.745. The clustering results revealed no direct relationship with the geographical sources of germplasm, indicating a more frequent exchange of germplasm in sweet potato cultivation and breeding.
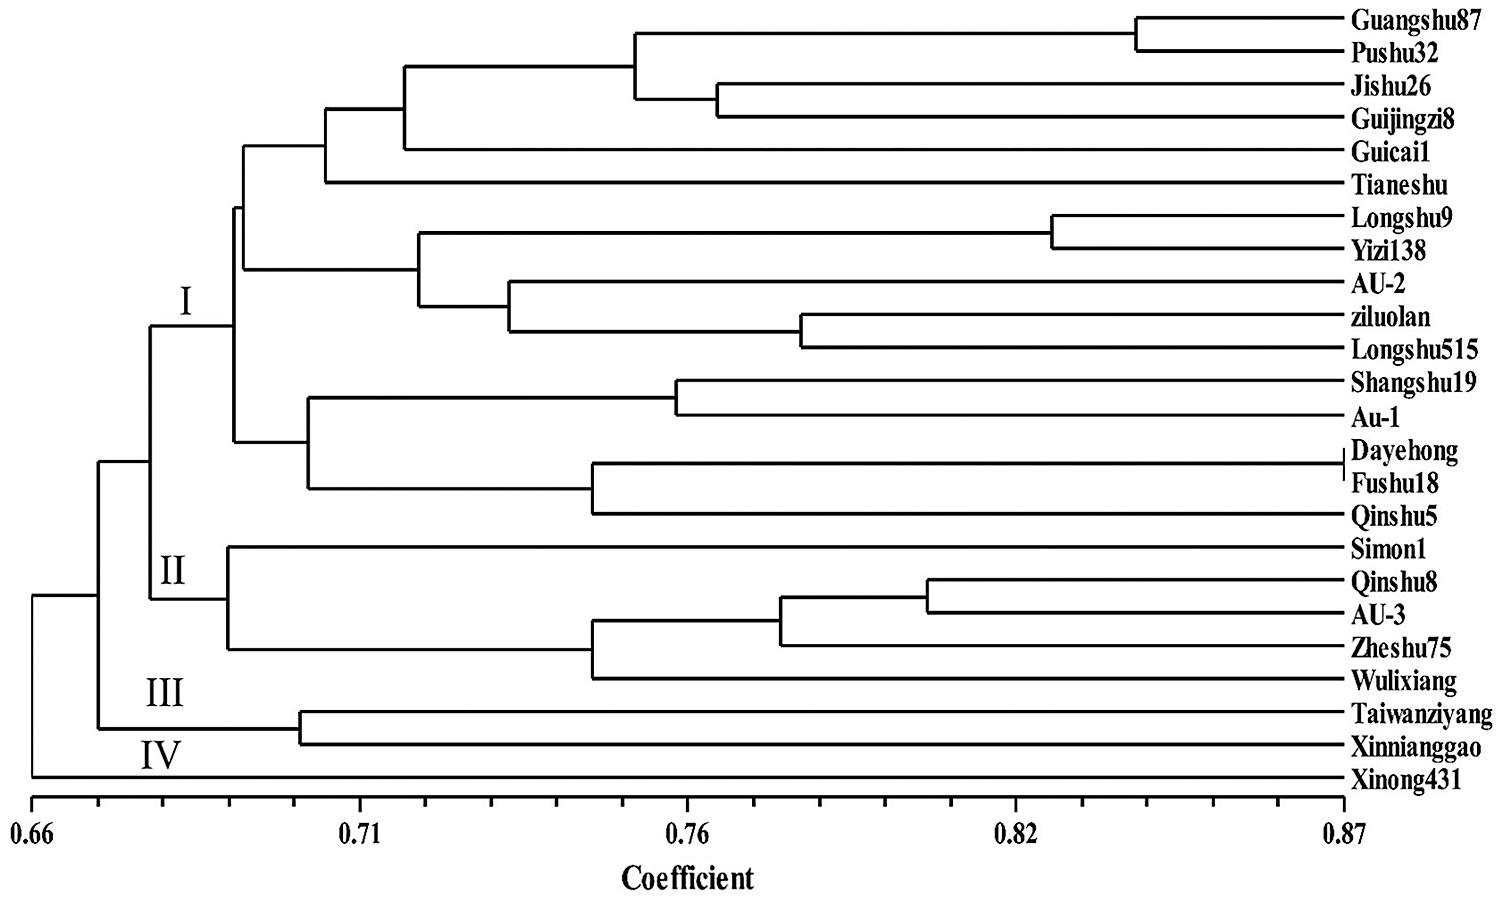
Figure 2: UPGMA dendrogram of the genetic relationships among 24 sweet potato accessions.
Recent advances in high throughput DNA sequencing technology offer new information to accelerate the development of molecular markers. Molecular markers are widely used in many plant genetic and genomic-based studies. SSR markers are distributed in both transcribed and non-coding sequences referred to as EST- and genomic-SSRs, respectively. With the advantages of being co-dominant, PCR-based, highly polymorphic, chromosome-specific, reproducible, and consistent (Karihaloo, 2015) compared to other molecular markers, SSR markers have been widely used in many genetic and molecular-based studies in sweet potato including variety identification, genetic diversity analysis, and construction of linkage maps (Ngailo et al., 2016; Yada et al., 2015; Yang et al., 2015b). Although several studies have reported the use of SSR markers in sweet potato, most of them evolved from investigating transcriptome libraries and expressed sequence tags (ESTs). Again, their number and availability are limited, with only a few being polymorphic compared to other crops. Therefore, there is a great need to develop novel SSR markers that are highly polymorphic and distributed throughout the genome.
To identify valuable genomic-SSR markers for sweet potato genetic improvement, the sweet potato genome was searched, and a total of 2,431 SSR markers were successfully developed based on the SSR-containing sequences. The distribution density was 159.77 Mb per SSR or 6.26 kb per one SSR on average, which was lower than the average density recorded for sweet potato (7.1 kb), pigeon pea (8.4 kb), cotton (20.0 kb), and soybean (23.80 kb) but almost the same as that of sesame (6.55 kb), and relatively higher compared to that of rice (3.4 kb) and radish (4.93 kb) (Cardle et al., 2000; Wang et al., 2011b; Zhai et al., 2014). However, the differences in frequency and abundance could be attributed to the size of the database, tools for SSR data-mining, length of repeat motifs, and application of different repeat unit thresholds; hence, it is practically difficult to directly compare the frequency and abundance estimates of different studies (Dutta et al., 2011). In our current study, mono-, di- and trinucleotides were the most common SSRs with dinucleotides showing the highest frequency (38.50%) followed by trinucleotides (31.46%) and mononucleotide (12.77%; Suppl. Fig. A1). Feng et al. (2020) identified dinucleotides (9439, 51.52%) as the most abundant repeats followed by trinucleotides (7636, 41.68%) in the sweet potato, which is consistent with the results of this study. Our findings contrast with previous reports showing trinucleotides as the most dominant repeat motifs in sweet potato followed by dinucleotides (Tao et al., 2012; Wang et al., 2011b). Other studies also suggested trinucleotides as the second predominant repeat motifs in sweet potato, which is in agreement with our current findings (Xie et al., 2012).
The main repeat types among the identified SSRs were A/T (12.61%), AT/AT (61.51%), AAT/ATT (27.42%), and AAAT/ATTT (13.32%, Suppl. Fig. A1). In agreement with our current study, Wang et al. (2011b) identified AAT/ATT as the most dominant SSR motif in the sweet potato. Similarly, Yang et al. (2015a) identified AAAT/ATTT as the most frequent repeat motif among tetranucleotides in Welsh onion. However, previous studies identified AG/CT, AAG/CTT, and AT/TA motifs as the most dominant motif types in sweet potato (Zhang et al., 2016), conflicting with our findings.
In this study, 100 primer pairs were randomly selected to validate the SSR markers and assess their usefulness in sweet potato. Of these, 50 primer pairs (50%) produced clear stable bands. The PCR amplification rate (50%) in this study was much lower than the reported 75–90% EST-SSR amplification rate in sweet potato (Hu et al., 2004; Schafleitner et al., 2010; Wang et al., 2011b). However, the amplification efficiency of genomic-SSRs has always been lower than EST-SSRs in sweet potato, which is in line with our results (Buteler et al., 1999; Hu et al., 2004). The reason being that genomic-SSR primers are designed randomly from genomic libraries, whereas EST-SSRs are from relatively highly conserved transcribed regions. Due to this reason, EST-SSRs are reported to be highly applicable and transferable to related species but less polymorphic compared to genomic-SSRs (Aggarwal et al., 2007). The 50 working primer pairs amplified 251 alleles in the 24 sweet potato genotypes (Tab. 3). The number of alleles recorded was 5.02 per locus on average for values ranging between 1 and 13 alleles. Previous studies reported a higher number of alleles per locus using SSR markers to analyze the genetic diversity of sweet potato germplasm. This indicates a high polymorphism among the sweet potato accessions studied. Several studies have also reported high number of alleles ranging between 2–23 alleles per loci, similar to that reported in our studies (Buteler et al., 1999; Roullier et al., 2011; Tumwegamire et al., 2011; Veasey et al., 2008; Yada et al., 2010). Conversely, Hwang et al. (2002) had low polymorphism and recorded 1 to 4 alleles per SSR using varied annealing temperatures and SSR primers. The result of our current study confirms the exceptional discriminatory ability of SSR markers (Gichuru et al., 2005). As a hexaploid plant, distinguishing between homozygous and heterozygous sites becomes difficult; hence, dominant markers are preferred over co-dominant markers (Silva et al., 2013; Yue et al., 2014). Previous studies reported the high polymorphism of sweet potato which is attributed to the large genome size and high heterozygosity (Hwang et al., 2002) influenced by its mating systems (self-incompatibility and outcrossing). Again, the polyploidy (autohexaploid) of sweet potato combined with the large chromosome number (2n = 6x = 90) makes sweet potato SSR primers highly polymorphic (Li et al., 2015; Ngailo et al., 2016). Hence, it is likely for sweet potato genotypes to have huge genetic distances among them, even in smaller populations (Gruneberg et al., 2015). In our study, we recorded 27 (54%) primer pairs exhibiting polymorphism among the 50 primer pairs. This value was higher than the 41.9% polymorphism recorded by Wang et al. (2011b) in the eight cultivated sweet potato varieties tested but lower than the 67.2% and 62.5% polymorphism reported in different sweet potato test materials (Hu et al., 2004; Schafleitner et al., 2010). Differences in polymorphism are attributed to the different geographic origins of samples and the number of DNA samples used. For instance, Chavarriaga-Aguirre et al. (1998) observed a relatively high polymorphism when the number of accessions increased from 38 to over 500 in cassava. Generally, genetic linkage mapping, comparative genomics, diversity analysis, gene-based association, and evolutionary studies require polymorphic SSR markers. Thus, the SSR markers in this study could be used for such studies in sweet potato. However, the polymorphic information content (PIC) of the SSRs was not determined because sweet potato exhibits a high overlap of homoeoallelic SSR variations with allelic ones, in that a clear single amplified SSR band may well be from two or three loci.
The average SSR-based genetic distance among the 24 sweet potato varieties was 0.740 average for values ranging between 0.605 and 1.00 (Suppl. Tab. A1). The genetic similarity coefficient range of 0.66 to 0.87 with a mean value of 0.765 recorded in this study is high, indicating a low diversity in the sweet potato genotypes studied (Fig. 2). The result is consistent with the high similarity coefficient of 0.64 on average recorded by Hwang et al. (2002) and thus concluded a low diversity among the accessions studied. On the contrary, Yada et al. (2010) reported an average similarity coefficient of 0.57 by evaluating the genetic diversity of cultivars from Uganda. Zhang et al. (2000) observed a low similarity coefficient (0.588) among the sweet potato varieties from South America. In another study, Tumwegamire et al. (2011) also recorded a similarity coefficient of 0.54 on average when the genetic diversity of farmer varieties of both white- and orange-fleshed sweet potato from East Africa were assessed. Similarly, David et al. (2018) reported a low genetic similarity coefficient of 0.54 on average and concluded a high diversity among the studied accessions. Thus, the differences could be attributed to the number and type of markers used and the genotypic variances. The clustering results revealed no direct relationship between the national and regional sources of germplasm, indicating a more frequent exchange of germplasm in sweet potato cultivation and breeding. The findings of this study provide background information for the development of genomic-SSR markers in the sweet potato.
To facilitate marker-assisted selection (MAS) and explore new molecular markers in sweet potato, we developed a set of SSR markers from the reference genome of cultivated sweet potato (cv. Taizhong6) using MISA software. A total of 133,727 SSRs were identified, from which 2,431 new SSR markers were developed. About 50% of the randomly selected SSR markers showed good amplification effects and produced clear, stable bands. The findings of this study will help update the sweet potato genomic-SSR marker database and aid future genetic and genomic studies. Also, the ability of the markers to analogize cultivars qualify them to be utilized as background data and resources for germplasm identification, genetic relationship studies, and diversity analysis in sweet potato and related species.
Acknowledgement: We are thankful to Mr. Eric Amenyogbe, Mr. Gyan Ray Watson and Miss Linda Adzigbli for the critical review and useful suggestions during the manuscript preparation.
Availability of Data and Materials: All data and materials associated with this research work have been provided in this article and its additional files.
Author Contribution: The authors confirm contribution to the paper as follows: study conception and design: Hongbo Zhu, Hanna Amoanimaa-Dede; data collection: Hanna Amoanimaa-Dede, Jiacheng Zhang, Chuntao Su; analysis and interpretation of results: Hanna Amoanimaa-Dede, Jiacheng Zhang; draft manuscript preparation: Hanna Amoanimaa-Dede. All authors reviewed the results and approved the final version of the manuscript.
Ethics Approval: Not applicable.
Supplementary Material: The supplementary material is available online at DOI 10.32604/biocell.2021.015053.
Funding Statement: This research was funded by the National Natural Science Foundation of China-Guangdong Joint Fund, China and Studies on Resistance Resources and Molecular Mechanisms of Sweet potato Weevil in South China (Grant No. U1701234).
Conflicts of Interest: The authors declare that there is no conflict of interest to report regarding this current study.
Aggarwal RK, Hendre PS, Varshney RK, Bhat PR, Krishnakumar V, Singh L (2007). Identification, characterization and utilization of EST-derived genic microsatellite markers for genome analyses of coffee and related species. Theoretical and Applied Genetics 114: 359–372. DOI 10.1007/s00122-006-0440-x. [Google Scholar] [CrossRef]
Buteler M, Jarret R, Labonte D (1999). Sequence characterization of microsatellites in diploid and polyploid Ipomoea. Theoretical and Applied Genetics 99: 123–132. DOI 10.1007/s001220051216. [Google Scholar] [CrossRef]
Cardle L, Ramsay L, Milbourne D, Macaulay M, Marshall D, Waugh R (2000). Computational and experimental characterization of physically clustered simple sequence repeats in plants. Genetics 156: 847–854. [Google Scholar]
Chandrasekara A, Josheph Kumar T (2016). Roots and tuber crops as functional foods: A review on phytochemical constituents and their potential health benefits. International Journal of Food Science 2016: 3631647. DOI 10.1155/2016/3631647. [Google Scholar] [CrossRef]
Chavarriaga-Aguirre P, Maya MM, Bonierbale MW, Kresovich S, Fregene MA, Tohme J, Kochert G (1998). Microsatellites in cassava (Manihot esculenta CrantzDiscovery, inheritance and variability. Theoretical and Applied Genetics 97: 493–501. DOI 10.1007/s001220050922. [Google Scholar] [CrossRef]
Chevallet M, Luche S, Rabilloud T (2006). Silver staining of proteins in polyacrylamide gels. Nature Protocols 1: 1852–1858. DOI 10.1038/nprot.2006.288. [Google Scholar] [CrossRef]
David MC, Diaz FC, Mwanga RO, Tumwegamire S, Mansilla RC, Grüneberg WJ (2018). Gene pool subdivision of East African sweetpotato parental material. Crop Science 58: 2302–2314. DOI 10.2135/cropsci2017.11.0695. [Google Scholar] [CrossRef]
Dutta S, Kumawat G, Singh BP, Gupta DK, Singh S, Dogra V, Gaikwad K, Sharma TR, Raje RS, Bandhopadhya TK, Datta S, Singh MN, Bashasab F, Kulwal P, Wanjari KB, Varshney R, Cook DR, Singh NK (2011). Development of genic-SSR markers by deep transcriptome sequencing in pigeonpea [Cajanus cajan (L.) Millspaugh]. BMC Plant Biology 11: 17. DOI 10.1186/1471-2229-11-17. [Google Scholar] [CrossRef]
Edwards D, Batley J (2010). Plant genome sequencing: Applications for crop improvement. Plant Biotechnology Journal 8: 2–9. DOI 10.1111/j.1467-7652.2009.00459.x. [Google Scholar] [CrossRef]
Feng J, Zhao S, Li M, Zhang C, Qu H, Li Q, Li J, Lin Y, Pu Z (2020). Genome-wide genetic diversity detection and population structure analysis in sweetpotato (Ipomoea batatas) using RAD-seq. Genomics 112: 1978–1987. DOI 10.1016/j.ygeno.2019.11.010. [Google Scholar] [CrossRef]
Gichuru V, Aritua V, Lubega G, Edema R, Adipala E, Rubaihayo P (2005). A preliminary analysis of diversity among East African sweetpotato landraces using morphological and simple sequence repeats (SSR) markers. In: Tan SL (eds.II International Symposium on Sweetpotato and Cassava: Innovative Technologies for Commercialization 703. pp. 159–164. Kuala Lumpur: Malaysia. [Google Scholar]
Gruneberg W, Ma D, Mwanga R, Carey E, Huamani K, Diaz F, Eyzaguirre R, Guaf E, Jusuf M, Karuniawan A, Tjintokohadi K, Song YS, Anil SR, Hossain M, Rahaman E, Attaluri SI, Some K, Afuape SO, Adofo K, Lukonge E, Karanja L, Ndirigwe J, Ssemakula G, Agili S, Randrianaivoarinovy JM, Chiona M, Chipungu F, Laurie SM, Ricardo J, Andrade M, Rausch Fernandes F, Mello AS, Khan MA, Labonte DR, Yencho GC (2015). Advances in sweetpotato breeding from 1992 to 2012. In: Low J, Nyongesa M, Quinn S, Parker M, eds. Potato and Sweetpotato in Africa: Transforming the Value Chains for Food and Nutrition Security. pp. 3–68. Wallingford, UK: CABI International. [Google Scholar]
Han YC, Teng CZ, Hu ZL, Song YC (2008). An optimal method of DNA silver staining in polyacrylamide gels. Electrophoresis 29: 1355–1358. DOI 10.1002/elps.200700558. [Google Scholar] [CrossRef]
Hu J, Nakatani M, Mizuno K, Fujimura T (2004). Development and characterization of microsatellite markers in sweetpotato. Breeding Science 54: 177–188. DOI 10.1270/jsbbs.54.177. [Google Scholar] [CrossRef]
Hwang SY, Tseng YT, Lo HF (2002). Application of simple sequence repeats in determining the genetic relationships of cultivars used in sweet potato polycross breeding in Taiwan. Scientia Horticulturae 93: 215–224. DOI 10.1016/S0304-4238(01)00343-0. [Google Scholar] [CrossRef]
Iniguez-Luy FL, Voort AV, Osborn TC (2008). Development of a set of public SSR markers derived from genomic sequence of a rapid cycling Brassica oleracea L. genotype. Theoretical and Applied Genetics 117: 977–985. DOI 10.1007/s00122-008-0837-9. [Google Scholar] [CrossRef]
Karihaloo J (2015). DNA fingerprinting techniques for plant identification. In: Bahadur B, Venkat Rajam M, Sahijram L, Krishnamurthy KV (eds). Plant Biology and Biotechnology: Volume II: Plant Genomics and Biotechnology. pp. 205–221. New Delhi: Springer. DOI 10.1007/978-81-322-2283-5_9. [Google Scholar] [CrossRef]
Kumar P, Gupta V, Misra A, Modi D, Pandey B (2009). Potential of molecular markers in plant biotechnology. Plant Omics 2: 141. [Google Scholar]
La Rota M, Kantety RV, Yu JK, Sorrells ME (2005). Nonrandom distribution and frequencies of genomic and EST-derived microsatellite markers in rice, wheat, and barley. BMC Genomics 6: 23. DOI 10.1186/1471-2164-6-23. [Google Scholar] [CrossRef]
Lebot V, Michalet S, Legendre L (2016). Identification and quantification of phenolic compounds responsible for the antioxidant activity of sweet potatoes with different flesh colours using high performance thin layer chromatography (HPTLC). Journal of Food Composition and Analysis 49: 94–101. DOI 10.1016/j.jfca.2016.04.009. [Google Scholar] [CrossRef]
Li R, Zhai H, Kang C, Liu D, He S, Liu Q (2015). De novo transcriptome sequencing of the orange-fleshed sweet potato and analysis of differentially expressed genes related to carotenoid biosynthesis. International Journal of Genomics 2015: Article ID 843802, p. 10. DOI 10.1155/2015/843802. [Google Scholar] [CrossRef]
Liu J, Huang S, Sun M, Liu S, Liu Y, Wang W, Zhang X, Wang H, Hua W (2012). An improved allele-specific PCR primer design method for SNP marker analysis and its application. Plant Methods 8: 34. DOI 10.1186/1746-4811-8-34. [Google Scholar] [CrossRef]
Liu K, Muse SV (2005). PowerMarker: An integrated analysis environment for genetic marker analysis. Bioinformatics 21: 2128–2129. DOI 10.1093/bioinformatics/bti282. [Google Scholar] [CrossRef]
Morgante M, Hanafey M, Powell W (2002). Microsatellites are preferentially associated with nonrepetitive DNA in plant genomes. Nature Genetics 30: 194–200. DOI 10.1038/ng822. [Google Scholar] [CrossRef]
Nei M, Li WH (1979). Mathematical model for studying genetic variation in terms of restriction endonucleases. Proceedings of the National Academy of Sciences of the United States of America 76: 5269–5273. DOI 10.1073/pnas.76.10.5269. [Google Scholar] [CrossRef]
Ngailo S, Shimelis H, Sibiya J, Amelework B, Mtunda K (2016). Genetic diversity assessment of Tanzanian sweetpotato genotypes using simple sequence repeat markers. South African Journal of Botany 102: 40–45. DOI 10.1016/j.sajb.2015.08.001. [Google Scholar] [CrossRef]
Nunome T, Negoro S, Kono I, Kanamori H, Miyatake K, Yamaguchi H, Ohyama A, Fukuoka H (2009). Development of SSR markers derived from SSR-enriched genomic library of eggplant (Solanum melongena L.). Theoretical and Applied Genetics 119: 1143–1153. DOI 10.1007/s00122-009-1116-0. [Google Scholar] [CrossRef]
Porebski S, Bailey LG, Baum BR (1997). Modification of a CTAB DNA extraction protocol for plants containing high polysaccharide and polyphenol components. Plant Molecular Biology Reporter 15: 8–15. DOI 10.1007/BF02772108. [Google Scholar] [CrossRef]
Rohlf F (2000). NTSYS 2.1: Numerical taxonomic and multivariate analysis system. New York, Exeter Software. [Google Scholar]
Roullier C, Kambouo R, Paofa J, Mckey D, Lebot V (2013). On the origin of sweet potato (Ipomoea batatas (L.) Lam.) genetic diversity in New Guinea, a secondary centre of diversity. Heredity 110: 594–604. DOI 10.1038/hdy.2013.14. [Google Scholar] [CrossRef]
Roullier C, Rossel G, Tay D, Mckey D, Lebot V (2011). Combining chloroplast and nuclear microsatellites to investigate origin and dispersal of New World sweet potato landraces. Molecular Ecology 20: 3963–3977. DOI 10.1111/j.1365-294X.2011.05229.x. [Google Scholar] [CrossRef]
Rozen S, Skaletsky H (2000). Primer3 on the WWW for general users and for biologist programmers. In: Misener S, Krawetz SA (eds.Bioinformatics Methods and Protocols. pp. 365–386. Totowa, NJ: Humana Press. DOI 10.1385/1-59259-192-2:365. [Google Scholar] [CrossRef]
Schafleitner R, Tincopa LR, Palomino O, Rossel G, Robles RF, Alagon R, Rivera C, Quispe C, Rojas L, Pacheco JA, Solis J, Cerna D, Young Kim J, Hou J, Simon R (2010). A sweetpotato gene index established by de novo assembly of pyrosequencing and Sanger sequences and mining for gene-based microsatellite markers. BMC Genomics 11: 604. DOI 10.1186/1471-2164-11-604. [Google Scholar] [CrossRef]
Silva PI, Martins AM, Gouvea EG, Pessoa-Filho M, Ferreira ME (2013). Development and validation of microsatellite markers for Brachiaria ruziziensis obtained by partial genome assembly of Illumina single-end reads. BMC Genomics 14: 17. DOI 10.1186/1471-2164-14-17. [Google Scholar] [CrossRef]
Tao X, Gu YH, Wang HY, Zheng W, Li X, Zhao CW, Zhang YZ, Freitag M (2012). Digital gene expression analysis based on integrated de novo transcriptome assembly of sweet potato [Ipomoea batatas (L.) Lam.]. PLoS One 7: e36234. DOI 10.1371/journal.pone.0036234. [Google Scholar] [CrossRef]
Thiel T, Michalek W, Varshney R, Graner A (2003). Exploiting EST databases for the development and characterization of gene-derived SSR-markers in barley (Hordeum vulgare L.). Theoretical and Applied Genetics 106: 411–422. DOI 10.1007/s00122-002-1031-0. [Google Scholar] [CrossRef]
Tumwegamire S, Rubaihayo P, Labonte D, Diaz F, Kapinga R, Mwanga ROM, Grüneberg WJ (2011). Genetic diversity in white-and orange-fleshed sweetpotato farmer varieties from East Africa evaluated by simple sequence repeat markers. Crop Science 51: 1132–1142. DOI 10.2135/cropsci2010.07.0407. [Google Scholar] [CrossRef]
Untergasser A, Cutcutache I, Koressaar T, Ye J, Faircloth BC, Remm M, Rozen SG (2012). Primer3—New capabilities and interfaces. Nucleic Acids Research 40: e115. DOI 10.1093/nar/gks596. [Google Scholar] [CrossRef]
Veasey EA, Borges A, Rosa MS, Queiroz-Silva JR, Bressan EDA, Peroni N (2008). Genetic diversity in Brazilian sweet potato (Ipomoea batatas (L.) Lam., Solanales, Convolvulaceae) landraces assessed with microsatellite markers. Genetics and Molecular Biology 31: 725–733. DOI 10.1590/S1415-47572008000400020. [Google Scholar] [CrossRef]
Venter JC, Adams MD, Myers EW, Li PW, Mural RJ et al. (2001). The sequence of the human genome. Science 291: 1304–1351. DOI 10.1126/science.1058040. [Google Scholar] [CrossRef]
Wang Y, Samuels T, Wu Y (2011a). Development of 1,030 genomic SSR markers in switchgrass. Theoretical and Applied Genetics 122: 677–686. DOI 10.1007/s00122-010-1477-4. [Google Scholar] [CrossRef]
Wang Z, Li J, Luo Z, Huang L, Chen X, Fang B, Li Y, Chen J, Zhang X (2011b). Characterization and development of EST-derived SSR markers in cultivated sweetpotato (Ipomoea batatas). BMC Plant Biology 11: 139. DOI 10.1186/1471-2229-11-139. [Google Scholar] [CrossRef]
Wen M, Wang H, Xia Z, Zou M, Lu C, Wang W (2010). Developmenrt of EST-SSR and genomic-SSR markers to assess genetic diversity in Jatropha Curcas L. BMC Research Notes 3: 42. DOI 10.1186/1756-0500-3-42. [Google Scholar] [CrossRef]
Xie F, Burklew CE, Yang Y, Liu M, Xiao P, Zhang B, Qiu D (2012). De novo sequencing and a comprehensive analysis of purple sweet potato (Impomoea batatas L.) transcriptome. Planta 236: 101–113. DOI 10.1007/s00425-012-1591-4. [Google Scholar] [CrossRef]
Xie J, Zhang M, Sun J, Zhang F (2017). Genome-wide genic SSR marker development for the endangered Dongxiang wild rice (Oryza rufipogon). Plant Genetic Resources 15: 566–569. DOI 10.1017/S1479262116000332. [Google Scholar] [CrossRef]
Yada B, Brown-Guedira G, Alajo A, Ssemakula GN, Mwanga RO, Yencho GC (2015). Simple sequence repeat marker analysis of genetic diversity among progeny of a biparental mapping population of sweetpotato. HortScience 50: 1143–1147. DOI 10.21273/HORTSCI.50.8.1143. [Google Scholar] [CrossRef]
Yada B, Tukamuhabwa P, Wanjala B, Kim DJ, Skilton RA, Alajo A, Mwanga ROM (2010). Characterization of Ugandan sweetpotato germplasm using fluorescent labeled simple sequence repeat markers. HortScience 45: 225–230. DOI 10.21273/HORTSCI.45.2.225. [Google Scholar] [CrossRef]
Yan L, Lai X, Li X, Wei C, Tan X, Zhang Y (2015). Analyses of the complete genome and gene expression of chloroplast of sweet potato [Ipomoea batata]. PLoS One 10: e0124083. DOI 10.1371/journal.pone.0124083. [Google Scholar] [CrossRef]
Yang L, Wen C, Zhao H, Liu Q, Yang J, Liu L, Wang Y (2015a). Development of polymorphic genic SSR markers by transcriptome sequencing in the welsh onion (Allium fistulosum L.). Applied Sciences 5: 1050–1063. DOI 10.3390/app5041050. [Google Scholar] [CrossRef]
Yang X, Su W, Wang L, Lei J, Chai S, Liu Q (2015b). Molecular diversity and genetic structure of 380 sweetpotato accessions as revealed by SSR markers. Journal of Integrative Agriculture 14: 633–641. DOI 10.1016/S2095-3119(14)60794-2. [Google Scholar] [CrossRef]
Yue XY, Liu GQ, Zong Y, Teng YW, Cai DY (2014). Development of genic SSR markers from transcriptome sequencing of pear buds. Journal of Zhejiang University Science B 15: 303–312. DOI 10.1631/jzus.B1300240. [Google Scholar] [CrossRef]
Zhai L, Xu L, Wang Y, Cheng H, Chen Y, Gong Y, Liu L (2014). Novel and useful genic-SSR markers from de novo transcriptome sequencing of radish (Raphanus sativus L.). Molecular Breeding 33: 611–624. DOI 10.1007/s11032-013-9978-x. [Google Scholar] [CrossRef]
Zhang D, Carbajulca D, Ojeda L, Rossel G, Milla S, Herrera C, Ghislain M (2000). Microsatellite analysis of genetic diversity in sweetpotato varieties from Latin America. CIP Program Report 2000: 295–301. [Google Scholar]
Zhang K, Wu Z, Tang D, Lv C, Luo K, Zhao Y, Liu X, Huang Y, Wang J (2016). Development and identification of SSR markers associated with starch properties and β-carotene content in the storage root of sweet potato (Ipomoea batatas L.). Frontiers in Plant Science 7: 223. [Google Scholar]
Zhao N, Yu X, Jie Q, Li H, Li H, Hu J, Zhai H, He S, Liu Q (2013). A genetic linkage map based on AFLP and SSR markers and mapping of QTL for dry-matter content in sweetpotato. Molecular Breeding 32: 807–820. DOI 10.1007/s11032-013-9908-y. [Google Scholar] [CrossRef]
Figure A1: Characteristics of SSRs in the sweetpotato genome.
a. Distribution of different repeat types
b. Frequency distribution of major repeat motifs
c. Frequency distribution of main motif sequence in I. Dinucleotide, II. Trinucleotide and III. Tetranucleotide repeats.
Table A1: Genetic distances generated from the SSR marker analysis of sweetpotato germplasm (1-24) in this study.
 | This work is licensed under a Creative Commons Attribution 4.0 International License, which permits unrestricted use, distribution, and reproduction in any medium, provided the original work is properly cited. |