DOI:10.32604/biocell.2021.014972
www.techscience.com/journal/biocell
| Biocell DOI:10.32604/biocell.2021.014972 | www.techscience.com/journal/biocell |
| Article |
TRIP13 is identified as a prognosis biomarker for renal clear cell carcinoma and promotes renal cell carcinoma cell proliferation, migration and invasion
1Fujian Provincial Key Laboratory of Transplant Biology, Department of Urology, Dongfang Hospital (900 Hospital of the Joint Logistics Team), School of Medicine, Xiamen University, Fuzhou, 350025, China
2Department of Neurology, Affiliated Mindong Hospital of Fujian Medical University, Fu’an, 355000, China
3Institute of Ningde Urological Research and Department of Urology, Affiliated Mindong Hospital of Fujian Medical University, Fu’an, 355000, China
*Address correspondence to: Jianming Tan, tanjm156@xmu.edu.cn
Received: 12 November 2020; Accepted: 09 December 2020
Abstract: This work aimed to discover new therapeutic targets in renal clear cell carcinoma by bioinformatics and detect the effect of candidate gene TRIP13 in renal cell carcinoma (RCC) cell proliferation, migration, and invasion. Differentially expressed mRNAs were screened based on The Cancer Genome Atlas (TCGA)-Kidney Renal Clear Cell Carcinoma (KIRC) databases, and functional enrichments, survival analysis, receiver operating characteristic curve (ROC), and Protein–Protein Interaction (PPI) protein interaction analysis were performed by R software to screen the candidate gene TRIP13. Then, the expression of candidate gene TRIP13 in 92 pairs of cancer and adjacent normal tissues of renal clear cell carcinoma patients were detected by qRT-PCR, western blotting, and immunochemical analysis. The TRIP13 level and clinicopathological characteristics of patients with renal clear cell carcinoma were analyzed. Using 186-O and ACHN RCC cell lines with TRIP13 overexpressing or downregulating, the effect of TRIP13 on cell viability and proliferation were detected by CCK8 and EdU staining, respectively. The migration and invasion were detected by Transwell assays. A total of 19858 differentially expressed genes, 5823 differentially expressed genes, 3657 up-regulated genes, and 2166 down-regulated genes were identified. TRIP13 was closed associated with cell cycle regulation, and survival and prognosis of renal clear cell carcinoma were selected as a candidate gene. The mRNA and protein levels of TRIP13 in cancer tissues were higher than that in adjacent normal tissues. TRIP13 level was significantly associated with tumor size, tumor stage, Fuhrman grade, and lymph node metastasis. TRIP13 overexpression significantly increased cell viability, proliferation, migration, and invasion, while downregulating of TRIP13 had opposite effects in both 186-O and ACHN cells. Therefore, TRIP13 promotes RCC proliferation and metastasis, which should be a novel biomarker for early diagnosis, treatment, and prognosis of RCC.
Keywords: Renal cell carcinoma; Bioinformatics; TRIP13; Proliferation; Migration; Invasion; Metastasis
Renal cell carcinoma is the third-largest urinary tract tumor after bladder tumor and prostate cancer (Torre et al., 2015). The incidence rate of renal cancer is 3% of all adult cancers in China (Chen et al., 2016). The average age of the patients is 50–70 years old, and the incidence rate has increased in recent years (Chen et al., 2017; Feng et al., 2019). The overall incidence rate of renal cell carcinoma has increased by 10 times (Chandrashekar et al., 2017). With the progress of medical science and technology, more and more asymptomatic renal cell carcinoma patients have been found, but the death rate of renal cell carcinoma remains high (Chen et al., 2016). Renal cell carcinoma is divided into many pathological types. The most common is renal clear cell carcinoma, accounting for 70–80% of the total incidence rate of renal cell carcinoma (Hsieh et al., 2017; Jonasch et al., 2020). At present, surgical treatment is the most important treatment for early renal cell carcinoma (De Raffele et al., 2020; Tosoian et al., 2020). However, surgery can only solve the visible tumor, but there is still a lack of effective means for the recurrence of the tumor and the treatment of recurrent tumor (Chin et al., 2006; De Raffele et al., 2020). Statistics show that the recurrence rate of patients receiving nephrectomy can be as high as 20% (de Raffele et al., 2020). Moreover, because of its special clinical manifestations, renal cell carcinoma has no obvious signs. When it is clinically diagnosed, most patients are accompanied by distant metastasis of the tumor. For these patients with advanced tumors, surgical intervention often cannot achieve ideal results (Hsieh et al., 2017; Jonasch et al., 2020). Interleukin-α and sunitinib have been used as the standard first-line drugs for renal cell carcinoma but the effective rate is only 15%, while chemotherapy drugs such as gemcitabine and fluorouracil are only effective in the treatment of metastatic non-clear cell carcinoma (Amato and Khan, 2008). Renal clear cell carcinoma is not sensitive to radiotherapy and chemotherapy (Huang et al., 2021; Xu et al., 2020).
With the development of molecular biology, more and more targeted drugs have been found and used in clinical practice. In 2008, the National Comprehensive Cancer Network (NCCN) and the European Association of Urology (EAU) have approved sorafenib as therapeutic drugs for renal cell carcinoma (Bandini et al., 2018; Cella et al., 2018). In 2017, the Food and Drug Administration (FDA) has approved cabozantinib for the treatment of patients with advanced renal cell carcinoma, which offers benefits over sunitinib (Chen et al., 2020). The application of targeted drugs makes up for the lack of surgical treatment in patients with advanced tumors and improves the prognosis of patients with renal cell carcinoma (Ruppin et al., 2009). However, its side effects are large and individual reactions are different, which can only meet the needs of some patients (Omae et al., 2016). In recent years, anti-angiogenic therapies were developed, although these drugs yield only partial responses in a minority of patients (Di Lorenzo et al., 2016; Tamma et al., 2019; Zeng and Fu, 2020; Zeng et al., 2019a). New and efficient biomarkers for renal cell carcinoma are becoming more and more important. With the development and realization of the human genome project, the function of genes and the genome has attracted more and more attention. Bioinformatics facilitates the discovery of new therapeutic targets (Li et al., 2020; Xie et al., 2020). We used the Cancer Genome Atlas (TCGA) database to explore the expression of genes related to the prognosis of renal clear-cell carcinoma, screened out the gene TRIP13 with obvious differential expression, and discussed the prognostic value of TRIP13 as a new biomarker.
Thyroid hormone receptor-interacting protein 13 (TRIP13) is a member of the AAA+ protein family (Zhu et al., 2019). TRIP13 protein is mainly involved in DNA double-strand break repair, chromosome recombination and cell cycle checkpoint regulation (Vader, 2015). In recent years, more and more studies have shown that TRIP13 plays an important role in the occurrence and development of tumors (Di et al., 2019; Kurita et al., 2016). The abnormal high expression of TRIP13 was detected in hepatocellular carcinoma, colorectal cancer, bladder cancer and esophageal squamous cell carcinoma, and its expression level was closely related to the malignant degree of the tumor (Di et al., 2019; Kurita et al., 2016; Niu et al., 2019; Zhu et al., 2019). However, the relationship between TRIP13 and renal clear cell carcinoma has not been reported. Therefore, this study will focus on the expression of TRIP13 in renal clear cell carcinoma and its mechanism in the occurrence and development of the disease. Therefore, we will compare the expression of TRIP13 mRNA and protein in renal clear cell carcinoma and adjacent tissues and analyze the relationship between the expression of TRIP13 and clinicopathological characteristics and prognosis of patients with renal clear cell carcinoma, and explore the effect of TRIP13 on proliferation, migration, and invasion of renal clear cell carcinoma cells through a series of experiments. These results will provide a new theoretical basis for the early diagnosis, timely treatment, and prognosis of renal clear cell carcinoma.
Patients with primary renal clear cell carcinoma were identified using universal morphology codes (8050/3, 8260/3, 8310/3, 8317/3, 8318/3, and 8319/3) based on the International Classification of Diseases for Oncology codes (3rd edition). The diagnoses were confirmed by histological examination. Patients who were under 18 years old at diagnosis or had missing data on tumor stage, Fuhrman grade, tumor size, and lymph node metastasis were all excluded from the study. In the end, 92 renal clear cell carcinoma patients at Dongfang hospital fulfilled the inclusion criteria and were included in the study. Demographic and clinical variables such as age at diagnosis, sex, Fuhrman grade (Grades I–II, Grades III–IV), Tumor classification (T1–T2, T3–T4), tumor size (larger or smaller than 4 cm), and lymph node metastasis (Yes, No) were all captured. The AJCC Cancer Staging Manual (7th edition, 2010) was employed to evaluate tumor stages. All participating patients signed informed consent. The collection and utilization of the clinical samples were approved by the Ethical Committee of the Dongfang Hospital affiliated with Xiamen University. The qPCR, western blot, and Immunohistochemistry (IHC) of TRIP13 were performed for all the 92 pair samples.
TCGA-KIRC data and differentially expressed mRNA analysis
The Cancer Genome Atlas (TCGA)-Kidney Renal Clear Cell Carcinoma (KIRC) mRNA RNAseq reads count data and clinical data were downloaded using TCGA biolinks R package (Colaprico et al., 2016). The mRNA expression data of 606 samples (72 precancerous tissue samples and 534 cancer tissue samples) and clinical data of 621 samples were downloaded. The Deseq2 R package was used to standardize the data and calculate the difference. The parameters p-value and fold-change were set to be less than 0.05 and 2, respectively. The volcano map was drawn with the ggplot2 R package.
Through the functional enrichment analysis of the differential gene set, we can find out which biological functions or pathways are significantly related to the differential genes under different conditions. Clusterprofiler R package was used to analyze the enrichment of Go (Gene Ontology) function and KEGG (Kyoto Encyclopedia of Genes and Genomes) pathway. Enrichment analysis is based on the principle of hypergeometric distribution (Yu et al., 2012). GO is a comprehensive database describing gene function, which can be divided into three parts: biological process and cellular component molecular function. For GO functional enrichment, a p-value less than 0.05 is the threshold of significant enrichment. KEGG is a comprehensive database integrating genomic, chemical, and systemic functional information. For KEGG pathway enrichment, a p-value less than 0.05 is the threshold of significant enrichment.
Survival and survminer packages were used to analyze the effect of 5823 differential gene expression on survival and prognosis. The survival data were input using survival function, and the Kaplan Meier (KM) survival curves were created using survfit function and visualized using the ggsurvplot function. The difference in survival rates of groups was analyzed using the survdiff function with a p-value less than 0.05. The patients were divided into high and low expression groups by using the median expression. The genes significantly associated with the survival and prognosis of patients were screened out.
Receiver operating characteristic curve (ROC) and Protein-Protein Interaction (PPI) analysis
The ROC package was used to analyze the gene expression in 2887 genes and the corresponding survival state of the sample. An area under the curve (AUC) greater than 0.65 were screened out. String database Version: 11.0 was used to find out the genes interact with each other (Szklarczyk et al., 2019). Using the Centiscape2.2 plug-in of Cytoscape software, we calculated the node degree of 206 protein interactions with a score greater than 0.4 and displayed the size of nodes according to the size of degree and established the protein interaction network model.
Tissues were fixed with 10% formaldehyde solution and then soaked in paraffin subsequently. Paraffin-embedded tissue sections (4 μm) were incubated with anti-TRIP13 for 60 min at 37°C, rewashed in PBS three times, 5 min each, and then used horseradish peroxidase coupled secondary antibodies incubated 40 min at 37°C. The tissue sections were then in PBS washed three times, 5 min each, and incubated in diaminobenzidine (DAB) for 1 min. The tissue sections were finally counterstained with hematoxylin stain for 2 min and dehydrated with step alcohol. Images were observed by an optical microscope (Leica Microsystems Ltd., Wetzlar, Germany) at 200× magnification. The positive cells in the nucleus or cytoplasm showed yellow or yellow-brown.
The 786-O and ACHN cell lines (the Cell Bank of the Chinese Academy of Sciences, Shanghai, China) were maintained in DMEM medium supplemented with 10% fetal bovine serum (FBS, Hyclone) and 1% antibiotic-antimycotic solution (10000 U/mL penicillin, 10000 μg/mL streptomycin, and 25 μg/mL Amphotericin B, Life Technologies, USA) in a humidified atmosphere with 37°C and 5% CO2.
When cell growth about 50–60% confluence, cells were washed with PBS and starved with 4 mL DMEM medium without FBS for 2 h at 37°C. Then, mixtures of 500 μL of DMEM (Invitrogen, USA) without FBS and 30 μL lipofectamine3000 reagent (Invitrogen, USA), and 20 μg plasmid (pcDNA3.0 empty plasmid, pcDNA3.0-TRIP13, shCTRLACCGAGTTTGAAAGATCCATGTCAA, and shTRIP13 ACCTGAGTGTTAGAAAGCTACTCAA, respectively, Genepharma, USA) and 30 μL lipofectamine3000 reagent were mixed and placed for 5 min at room temperature, and then incubated the cells for 15 min. After 6 h, the medium was replaced by fresh DMEM containing 10% FBS. Cell transfection efficiency was detected by qRT-PCR after 24 h and confirmed by Western blot after 48 h. In this study, we obtained a 70% transfection efficiency.
The cells were divided into five groups: control group, pcDNA3.0 empty plasmid, pcDNA3.0-TRIP13, shCTRL, and shTRIP13. The cells were seeded in a 96-well plate with 5000 cells/well, and 6 multiple wells were set in each group. After 6–8 h, the cells were changed into a medium containing 10% FBS and cultured in a 37°C incubator. After 48 h of transfection, 10 μL of CCK-8 (Beyotime, China) was added into each well. The 96-well plate was placed in an incubator for 2 h, and the absorbance at 450 nm was determined by an enzyme reader.
Real-time quantitative polymerase chain reaction (qRT-PCR)
The tissue was fully ground in liquid nitrogen, and 1 mL Trizol (cat. 9109, Takara, Japan), shaken and mixed, placed at 4°C for 5 min; 0.2 mL of chloroform was added, shaken violently for 15 s, placed at 4°C for 3 min, and centrifuged (12000 rpm) at 4°C for 15 min to transfer the upper water phase into a new tube. An equal volume of isopropyl alcohol was added, mixed well, and let stand at −20°C for 20 min; then, the sample was centrifuged (12000 rpm) at 4°C for 15 min to remove the supernatant; the precipitate was washed with 1 mL of 75% DEPC alcohol and centrifuged (8000 rpm) at 4°C for 5 min. After drying at room temperature, 30 μL of ddH2O water treated by DEPC was added to dissolve RNA, and 1.5 uL of sample solution was determined by Ultra Micro Ultraviolet Analyzer (q6000uv, Quawell Technology) and frozen at −80°C for standby. Using 2 μg total RNA as a template, the reverse transcription reaction system was prepared according to the instructions of the Bestar qPCR RT Kit (cat.2220, DBI). The total system was 10 μL, 37°C, 15 min; 98°C, 5 min. The first strand of cDNA was synthesized with sequence (5’–3’) of primers as below: GAPDH (F) TGTTCGTCATGGGGTGAAC, GAPDH (R) ATGGCATGGACTGTGGTCAT, TRIP13 (F) ACTGTTGCACTTCACATTTTCCA, and TRIP13 (R) TCGAGGAGATGGGATTTGACT. The reaction system of real-time PCR was 20 μL Sybr Green qPCR master Mix (cat. 2043, DBI). The PCR reaction conditions were 95°C for 2 min, 94°C for 20 s, 58°C for 20 s, 72°C for 20 s, 40 cycles. Melting curve analysis: 94°C for 30 s, 65°C for 30 s, 94°C for 30 s, each sample repeated three times. Agilent Stratagene fluorescence quantitative PCR (Mx3000p, Agilent) was used to carry out a fluorescent quantitative PCR experiment. The data were processed by the 2−ΔΔCt method.
Protein was extracted by RIPA (Beyotime, China). BCA kit (Beyotime, China) was used to detect the protein concentration. The extracted protein samples were boiled in a water bath for about 10–15 min and centrifuged at a speed of 12000 × g for 5 min at room temperature. SDS-PAGE gel electrophoresis at constant voltage 80 V, 110 min. The protein was transferred to the PVDF membrane with a constant current of 260 mA and 120 min. PVDF membrane was blocked in 5% skimmed milk prepared with 100 mL.
Table 1: The top 30 genes with significant prognosis
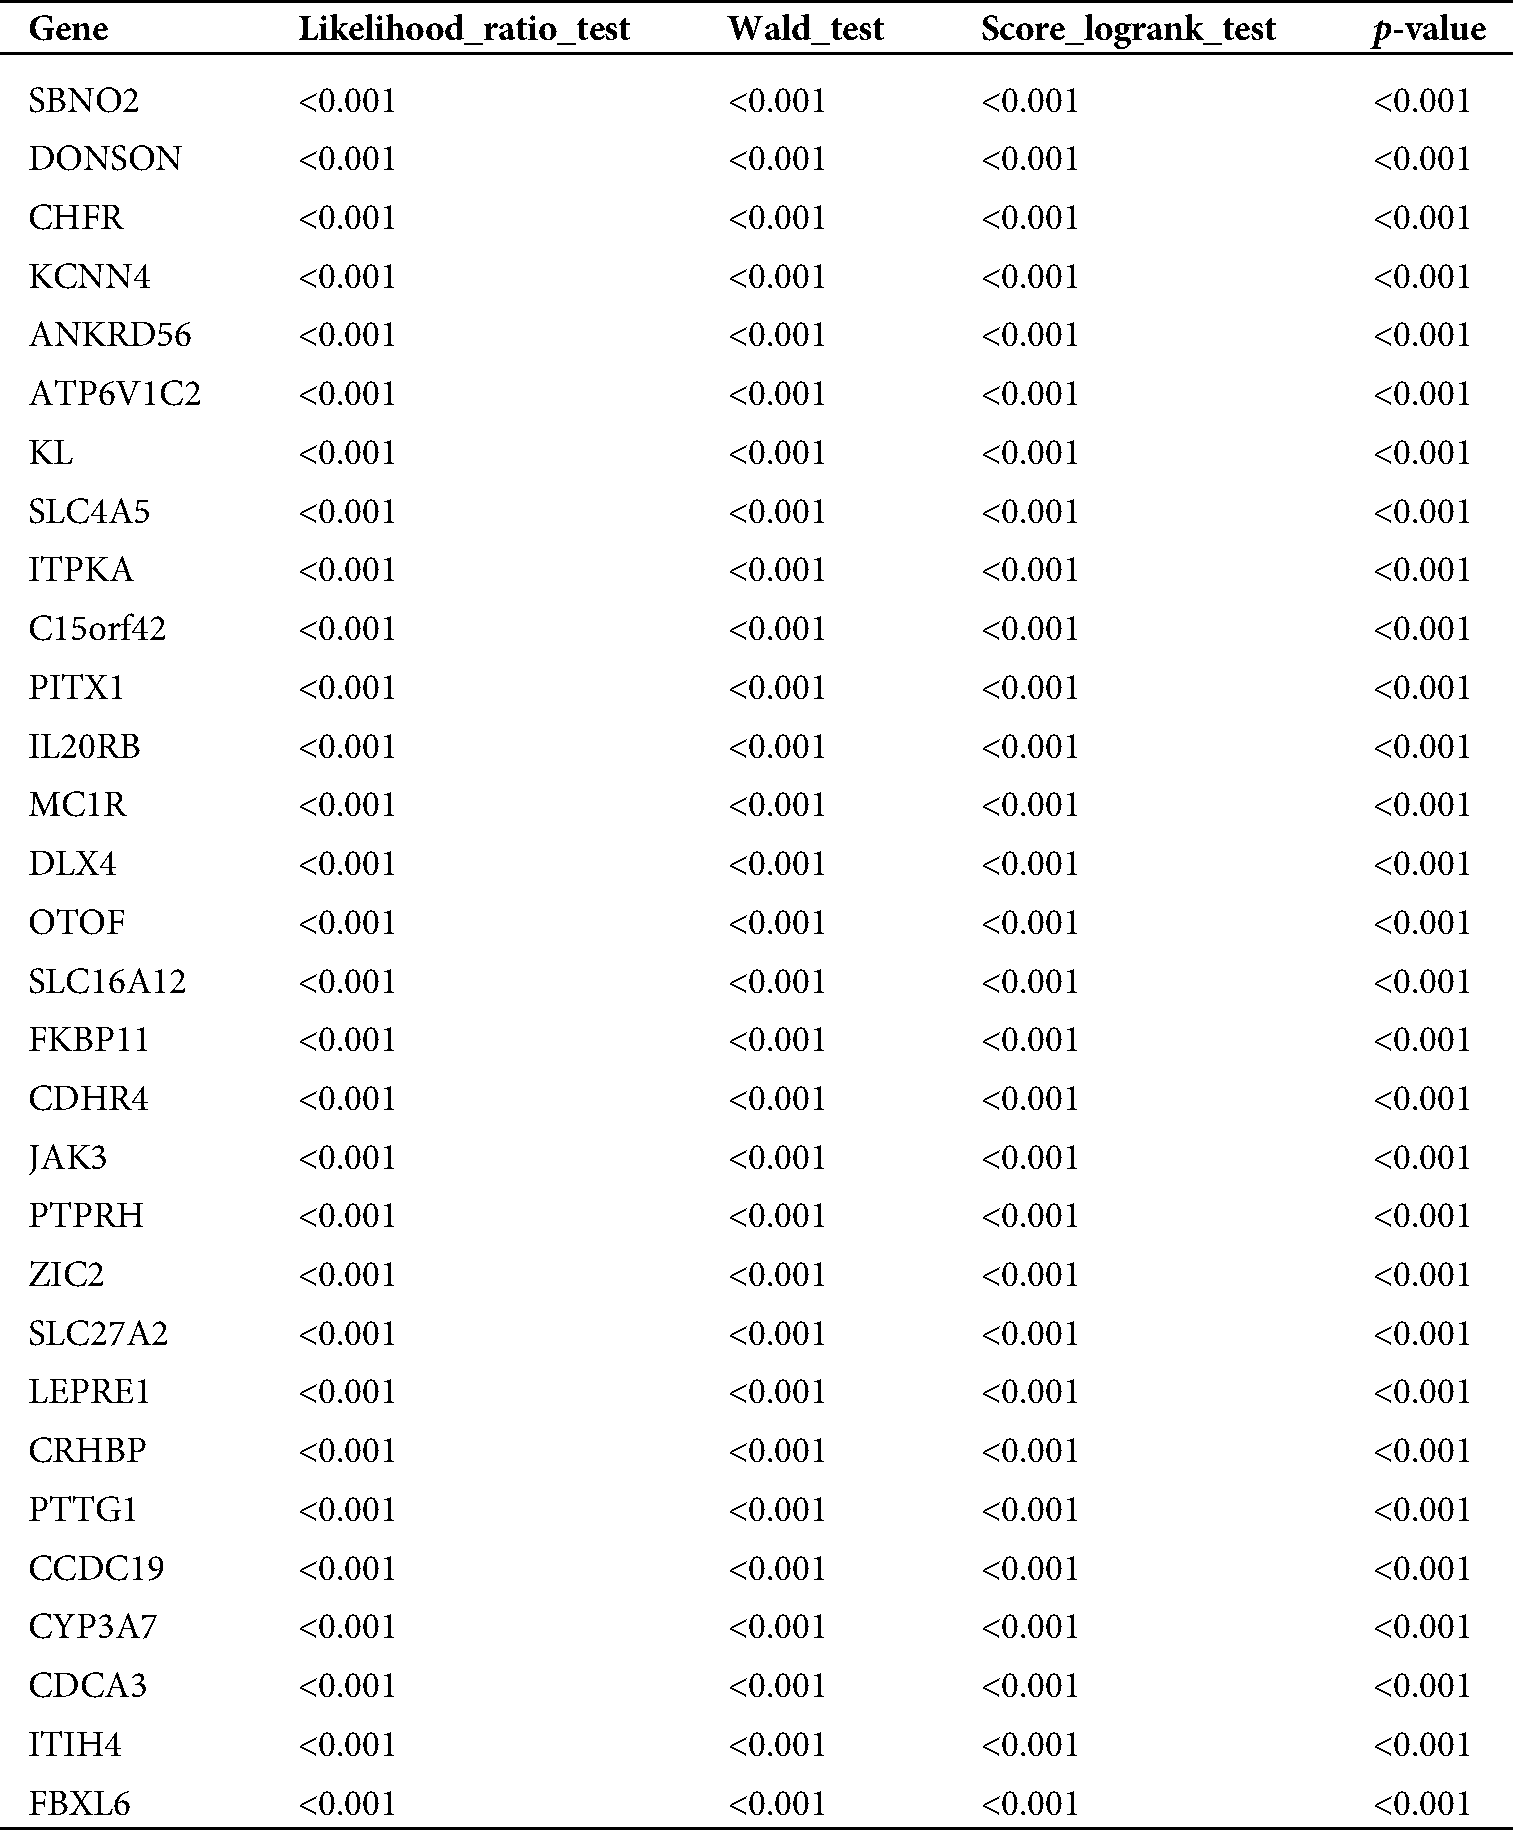
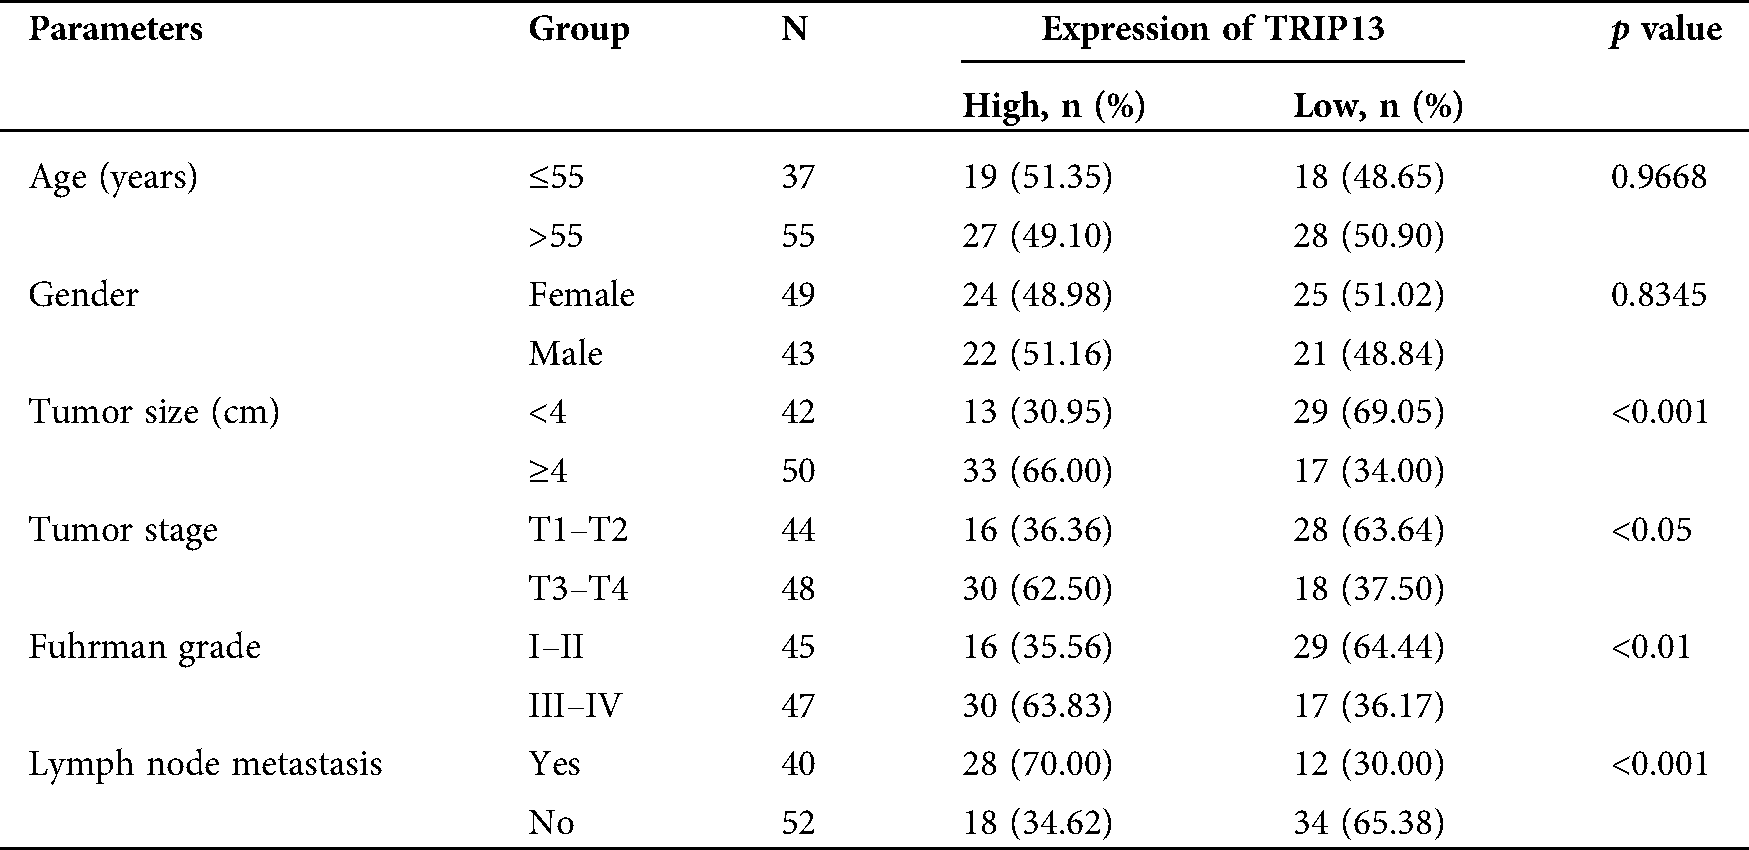
Table 2: Association between TRIP13 expression and clinicopathological features in RCC patients
TBST solution for 2 h. 2% BSA in TBST was prepared for dilution of primary antibody anti-TRIP13 (1:200, ab128153, Abcam, USA). The primary antibody was incubated overnight in a shaker in a refrigerator at 4°C. HPR-conjugated secondary antibody (1:5000, mouse anti-rabbit IgG, Beyotime, China) was used to incubate for 2 h. Immunolabeling was detected with ECL chemiluminescence (Millipore, USA) according to the manufacturer’s instructions.
Cells were suspended to single-cell suspension with a density of 5 × 10⁵/mL. Transwell (Matrigel pre-coated for invasion, but not for migration; Corning, USA) was placed into a 24-well culture plate. 100 μL cell suspension (about 5 × 10⁴ cells) was added into the upper chamber, and 500 μL DMEM containing 10% FBS was added into the lower chamber. The 24 well plates were incubated in 5% CO2 and at 37°C in an incubator for 24 h. The cells in the upper chamber were carefully wiped off with cotton balls, fixed with 4% paraformaldehyde for 20 min, washed with PBS twice, stained with 0.1% crystal violet for 30 min, washed with PBS twice, and then observed and photographed directly under the microscope.
SPSS software (v19.0, SPSS, USA) was used to analyze the experimental data. The association between differentially expressed genes and pathological characteristics were analyzed by chi-square test. The measurement data were expressed by mean ± standard deviation (X ± SD), and the difference of data was compared by t-test, and the statistical significance between multiple groups of samples was compared by analysis of variance (ANOVA). When p < 0.05, there was a statistical difference.
TRIP13 is closely associated with RCC survival and prognosis
TCGA database was downloaded for differential mRNA screening (Fig. 1A). A total of 19858 differentially expressed genes, 5823 differentially expressed genes, 3657 up-regulated genes, and 2166 down-regulated genes were identified (Suppl. Tab. 1). GO analysis, pathway analysis, and PPI analysis were performed on the differentially expressed mRNAs (Figs. 1B–1D). From the results of GO enrichment analysis, the most significant 30 terms (the top 10 for each classification) were selected to draw a histogram, as shown in the Fig. 1B. The top 10 BP included T cell activation, regulation of leukocyte activation, leukocyte cell-cell adhesion, regulation of cell-cell adhesion, regulation of lymphocyte activation, positive regulation of cell adhesion, regulation of T cell activation, leukocyte proliferation, regulation of leukocyte cell-cell adhesion, and regulation of leukocyte proliferation. The top 10 CC included extracellular matrix, collagen-containing extracellular matrix, external side of the plasma membrane, plasma membrane protein complex, side of the membrane, receptor complex, transmembrane transporter complex, transporter complex, ion channel complex, and the anchored component of membrane. The top 10 MF included passive transmembrane transporter activity, channel activity, substrate-specific channel activity, receptor regulator activity, ion gated channel activity, gated channel activity, receptor-ligand activity, ion channel activity, glycosaminoglycan binding, and metal ion transmembrane transporter activity. The differentially expressed genes in the Top 30 GO items are shown in Suppl. Tab. 2. From the KEGG enrichment results, the most significant 20 KEGG pathways were selected to draw the bubble diagram, as shown in Fig. 1C. The top 20 KEGG pathways included: Cytokine-cytokine receptor interaction, Neuroactive ligand-receptor interaction, Staphylococcus aureus infection, Cell adhesion molecules, Complement and coagulation cascades, Viral protein interaction with cytokine and cytokinereceptor, Allograft rejection, Intestinal immune network for IgA production, Graft-versus-host disease, Autoimmune thyroid disease, Protein digestion and absorption, Type I diabetes mellitus, Systemic lupus erythematosus, Retinol metabolism, Hematopoietic cell lineage, Phagosome, Rheumatoid arthritis, Viral myocarditis, Asthma, and Antigen processing and presentation. The differentially expressed genes in the Top 20 KEGG pathways are shown in Suppl. Tab. 3. Among 5823 differentially expressed genes, 2887 genes had a significant effect on survival and prognosis. The top 30 genes significantly associated with prognosis were SBNO2, DONSON, CHFR, KCNN4, ANKRD56, ATP6V1C2, KL, SLC4A5, ITPKA, C15orf42, PITX1, IL20RB, MC1R, DLX4, OTOF, SLC16A12, FKBP11, CDHR4, JAK3, PTPRH, ZIC2, SLC27A2, LEPRE1, CRHBP, PTTG1, CCDC19, CYP3A7, CDCA3, ITIH4, and FBXL6 (Tab. 1). Among the 2887 genes, a total of 206 genes with AUC greater than 0.65 were screened out (Suppl. Tab. 4), and the protein interaction regulatory network of 206 genes was investigated (Fig. 1D). TRIP13 was closed associated with regulation of cell cycle phase, with survival (p < 0.001, Fig. 1E), and with a specificity of 0.63 and a sensitivity of 0.66 (Fig. 1F) were selected as a candidate gene.
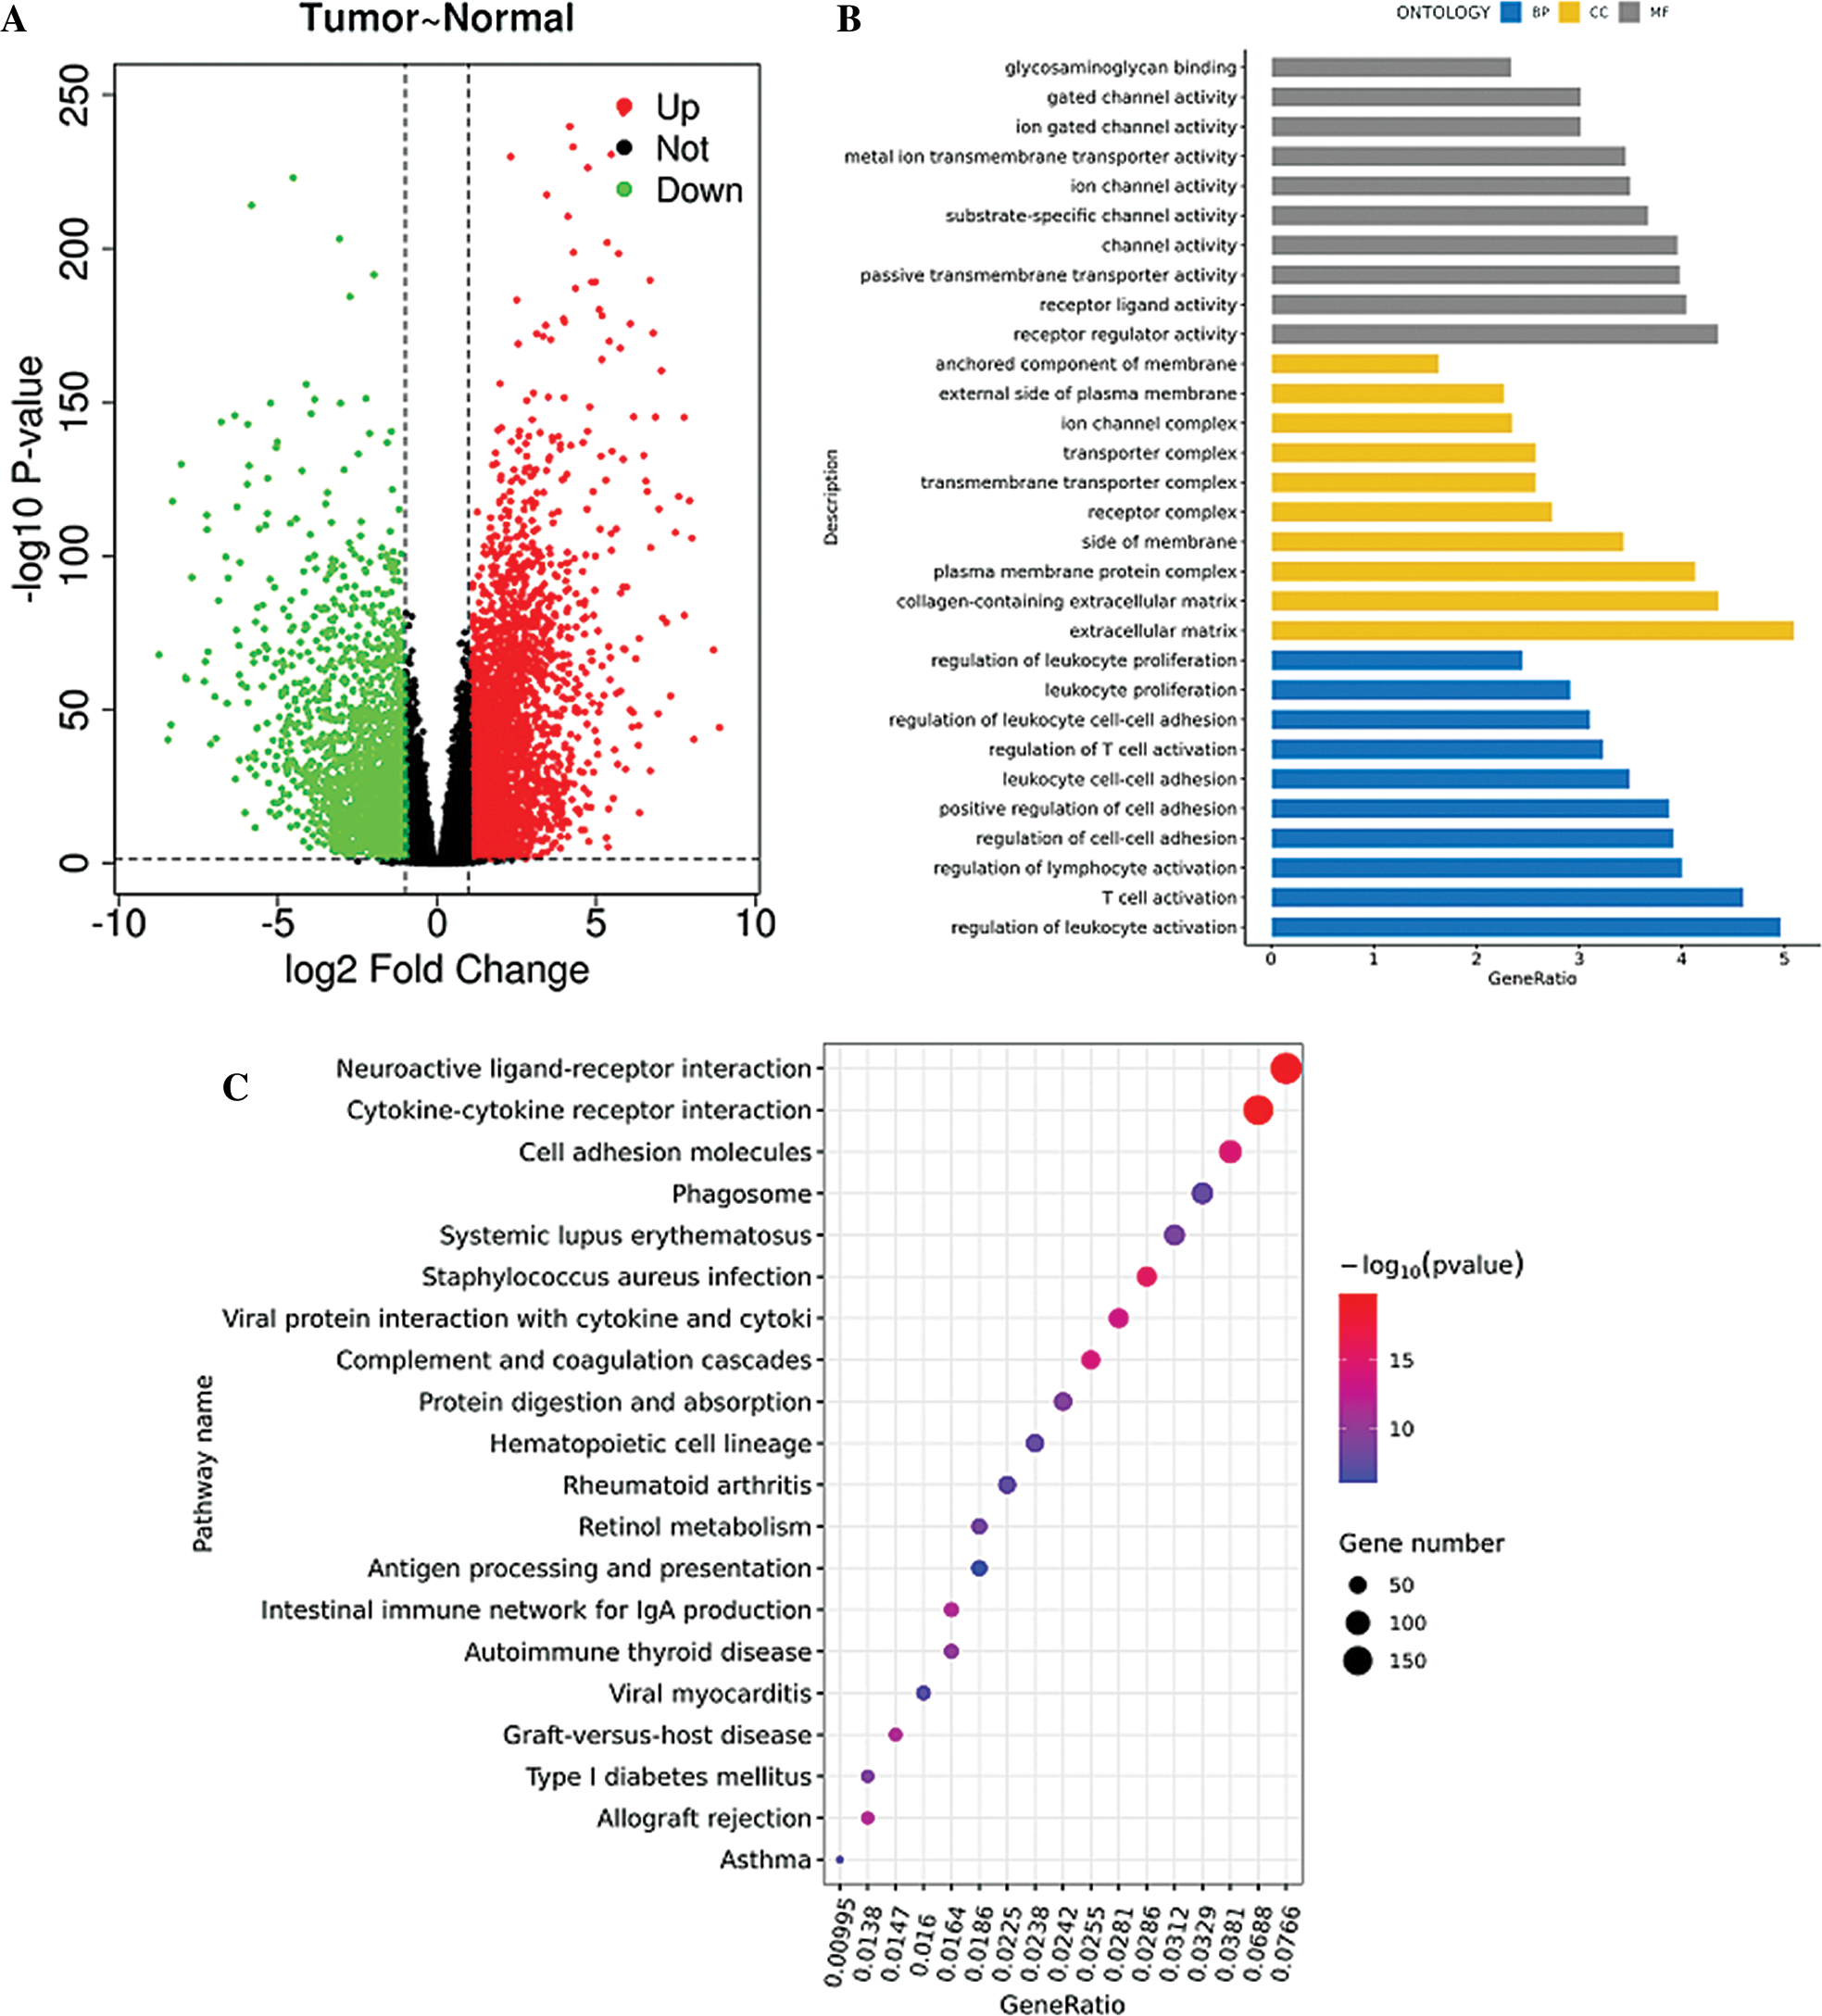
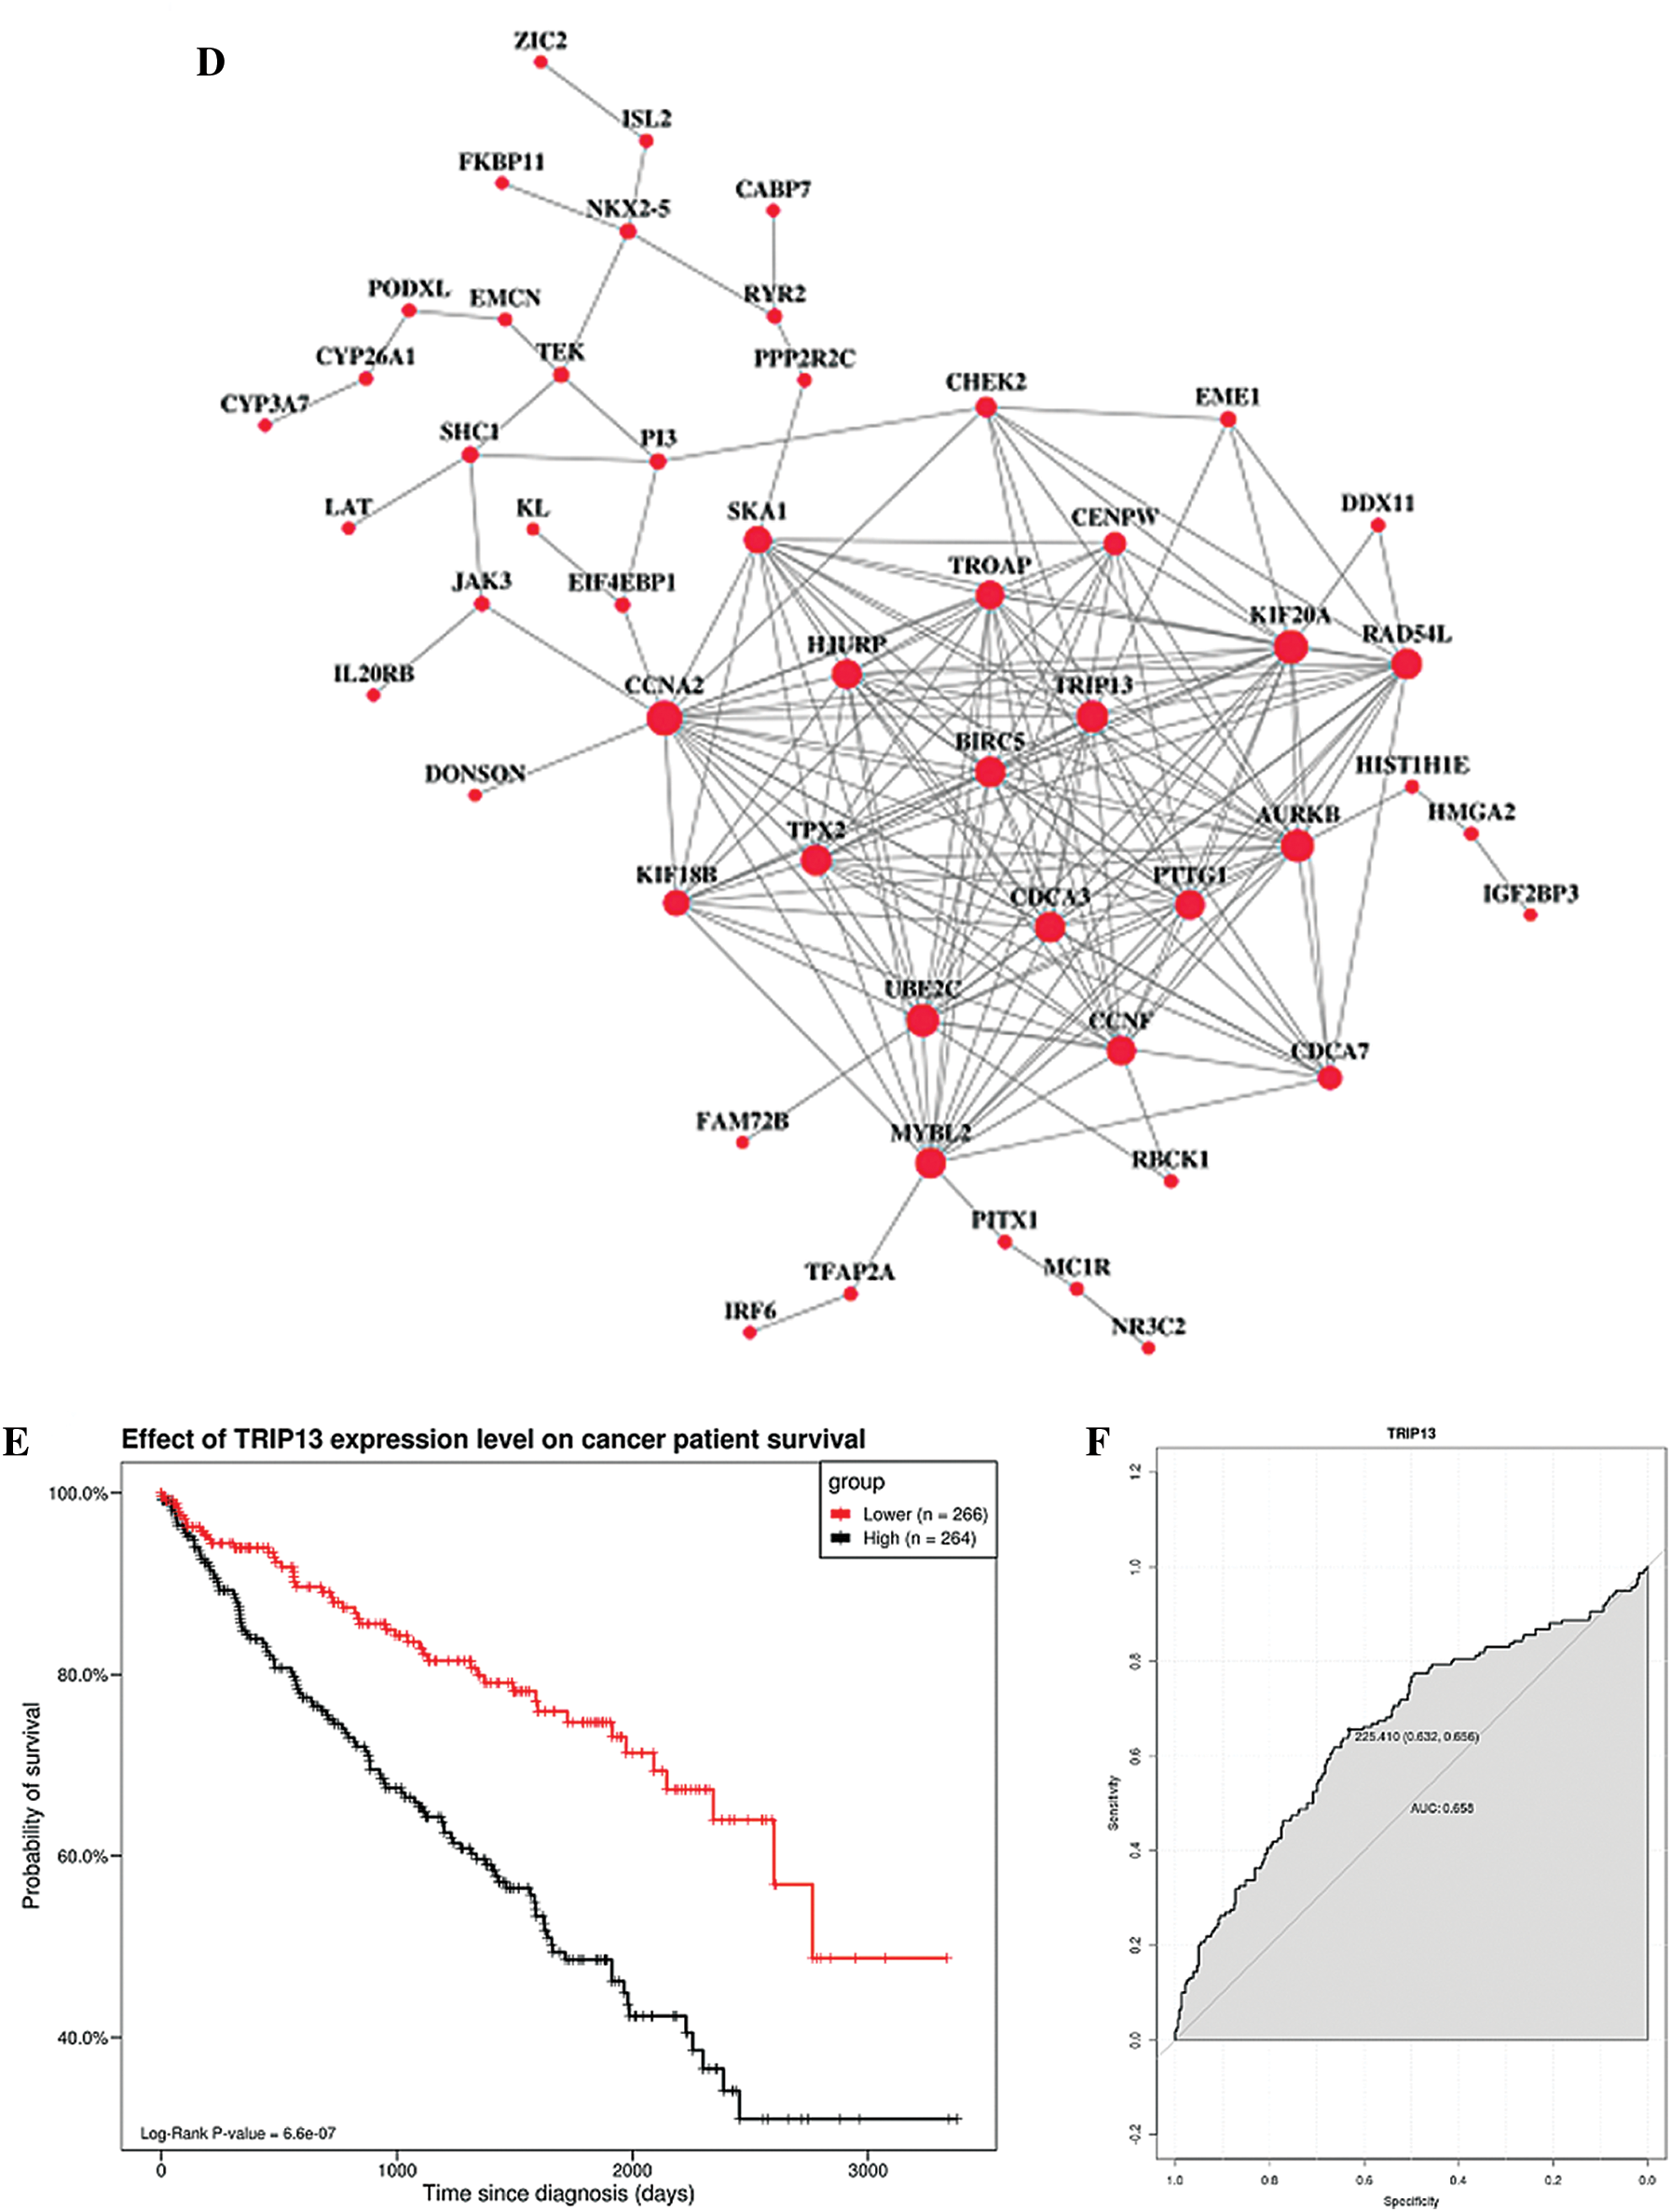
Figure 1: Screening of the gene closely associated with RCC survival and prognosis. (A) The volcano map of differentially expressed genes. In the volcano map, red represents upregulated genes, green represents downregulated genes, and black represents genes with no significant difference. The abscissa of the volcano map is log2 fold-change. Fold-change is the fold of differential expression. The higher the log2 fold-change value is, the greater the upregulation of the gene is. p-value indicated that the difference was statistically significant. (B) GO enrichment analysis. The abscissa is the GO term, and the ordinate is the percentage of genes under the GO term. Different colors represent BP, CC, and MF. (C) KEGG pathway analysis. The abscissa is the ratio of the number of enriched differential genes to the total number of differential genes, and the ordinate is the KEGG pathway. The point size represents the number of enriched genes in the KEGG pathway. Color from blue to red represents the significance of enrichment. (D) Protein interaction regulatory network (combined score > 0.4). There are 50 genes in this network. (E) Survival curve of TRIP13. The patients were divided into high and low expression groups by using the median expression. (F) ROC curve of TRIP13. Threshold (specificity, sensitivity) and AUC were shown.
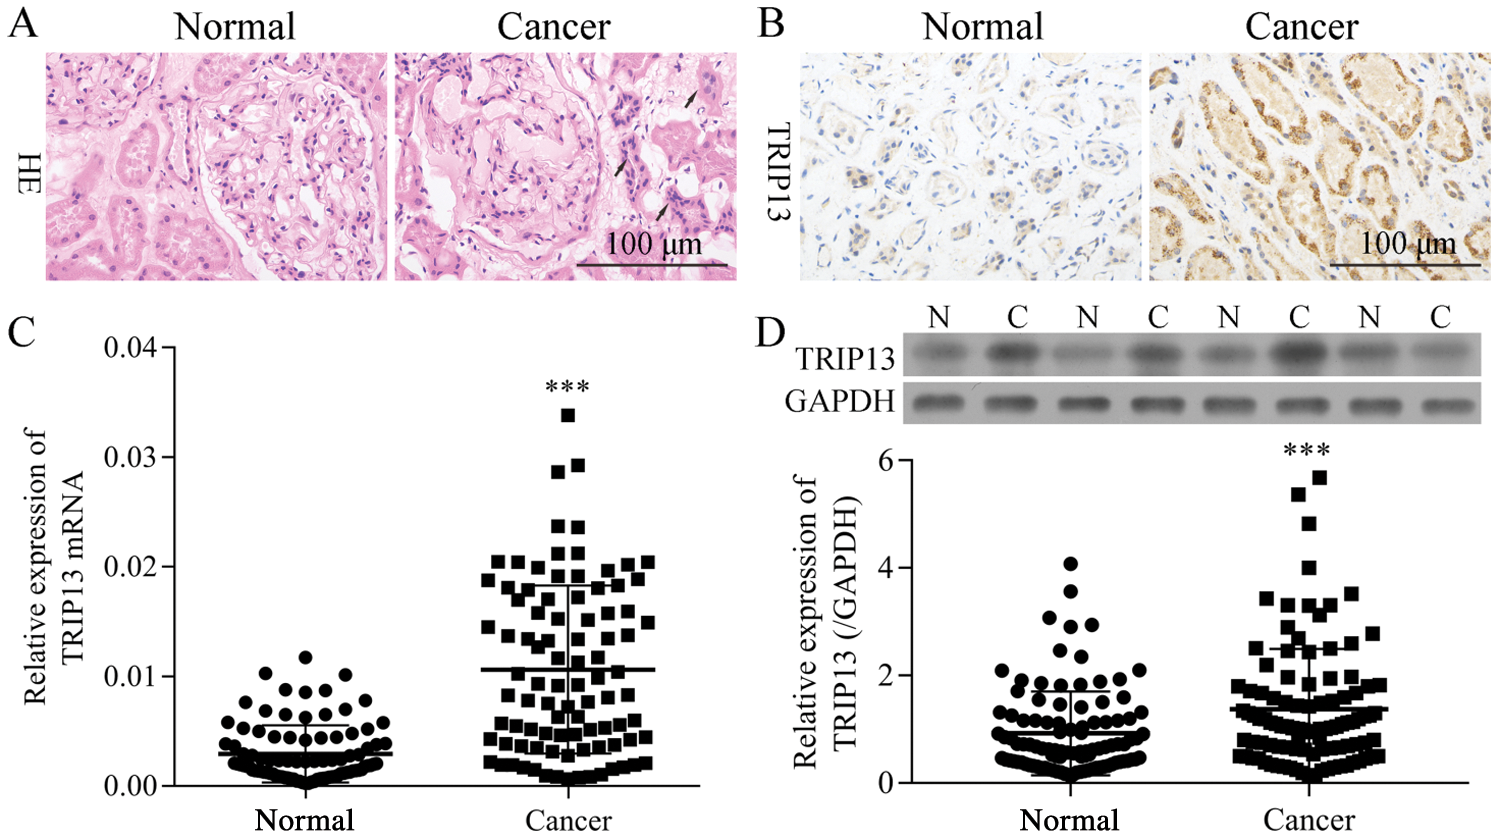
Figure 2: The mRNA and protein levels of TRIP13 in RCC patients. (A) HE-staining of RCC cancer (Cancer) and adjacent normal (Normal) tissues. The tissue-specific differences were indicated by arrows. (B) IHC staining of TRIP13. (C) mRNA level of TRIP13 in 92 patients. (D) A represent blot images of TRIP13 in 4 pairs of RCC tissues. N, paracancerous normal tissue; C, RCC cancer tissue. ***p < 0.001 vs. normal.
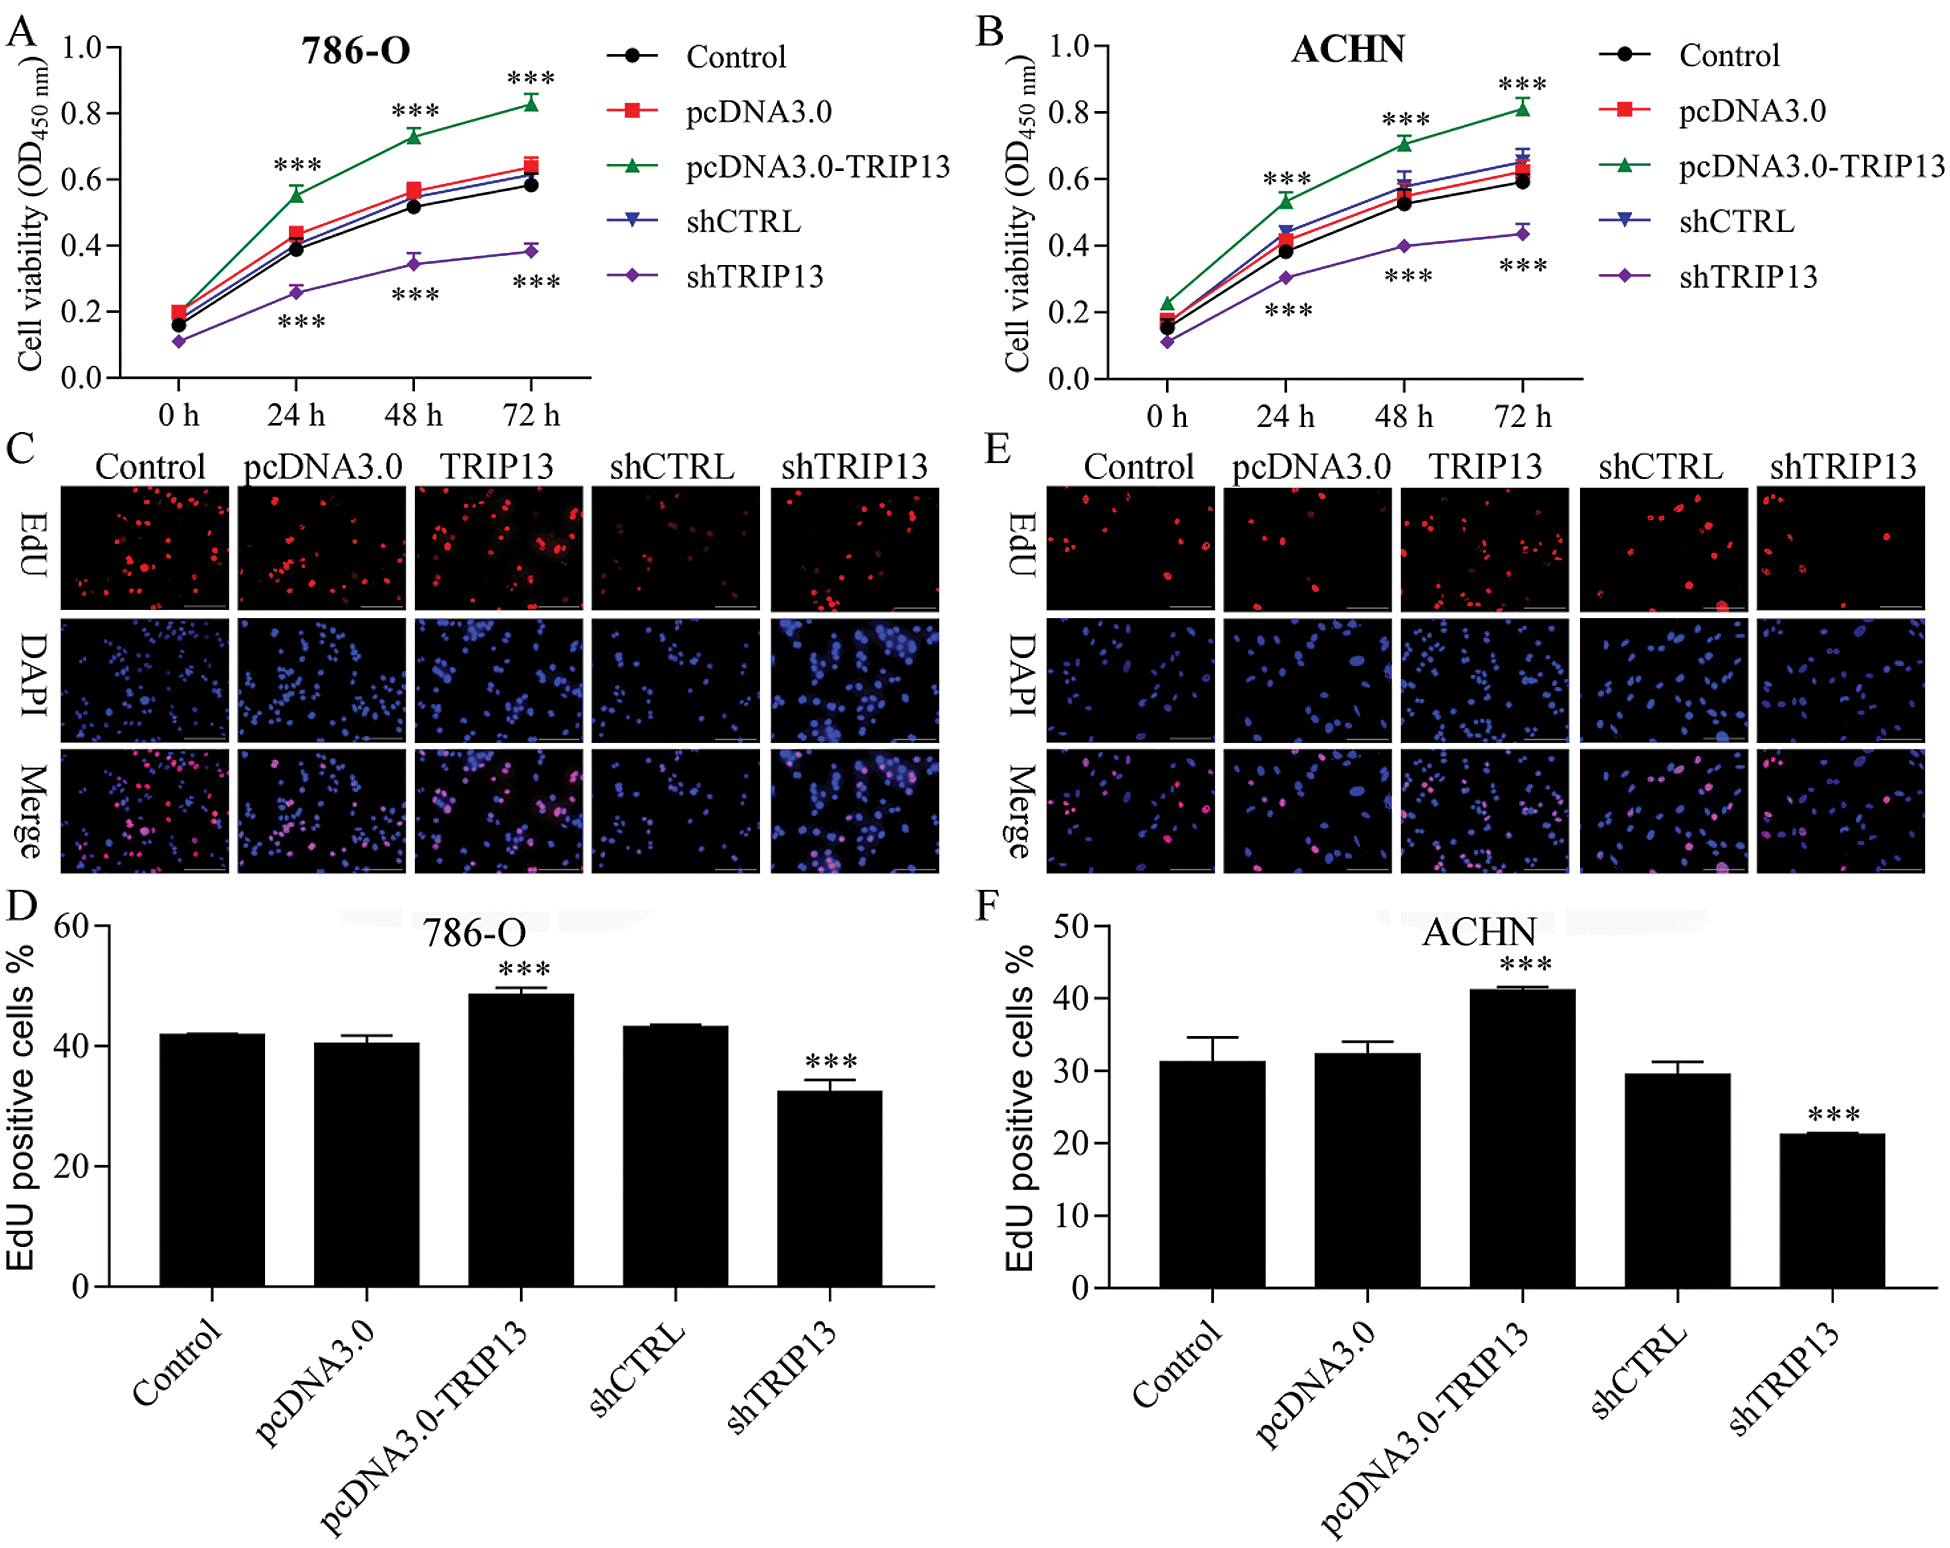
Figure 3: Effect of TRIP13 on RCC cell proliferation.
TRIP13 is correlated with RCC progression and metastasis
The mRNA and protein levels of TRIP13 were detected by qPCR, Western blot, and IHC (Fig. 2), and the association between the expression level and pathological characteristics were analyzed (Tab. 2). As shown in Figs. 2A and 2B, the histological change was consistent with TRIP13 increasing in RCC cancer tissues. TRIP13 were significantly associated with tumor size (p < 0.001), tumor stage (p < 0.05), Fuhrman grade (p < 0.01), and lymph node metastasis (p < 0.001), but not significantly associated with age and gender (Tab. 2), suggesting TRIP13 was involved in RCC progression and metastasis. TRIP13 mRNA and protein were increased in RCC cancer tissues compared with paracancerous normal tissues (p < 0.001, Figs. 2C and 2D).
TRIP13 induced RCC cell proliferation
To detect the role of TRIP13 in RCC, cell viability and proliferation were detected by CCK8 and EdU staining (Fig. 3). Both 786-O and ACHN cells were transfected with TRIP13 overexpressing and shRNA vectors. Results showed that TRIP13 overexpression significantly increased the cell viability of 786-O and ACHN cells, while TRIP13 shRNA significantly inhibited the cell viability (Figs. 3A and 3B). The proliferation of 786-O and ACHN cells were significantly increased by TRIP13 overexpression and significantly reduced by TRIP13 shRNA (Figs. 3C–3F). Thus, TRIP13 induced RCC cell viability and proliferation.
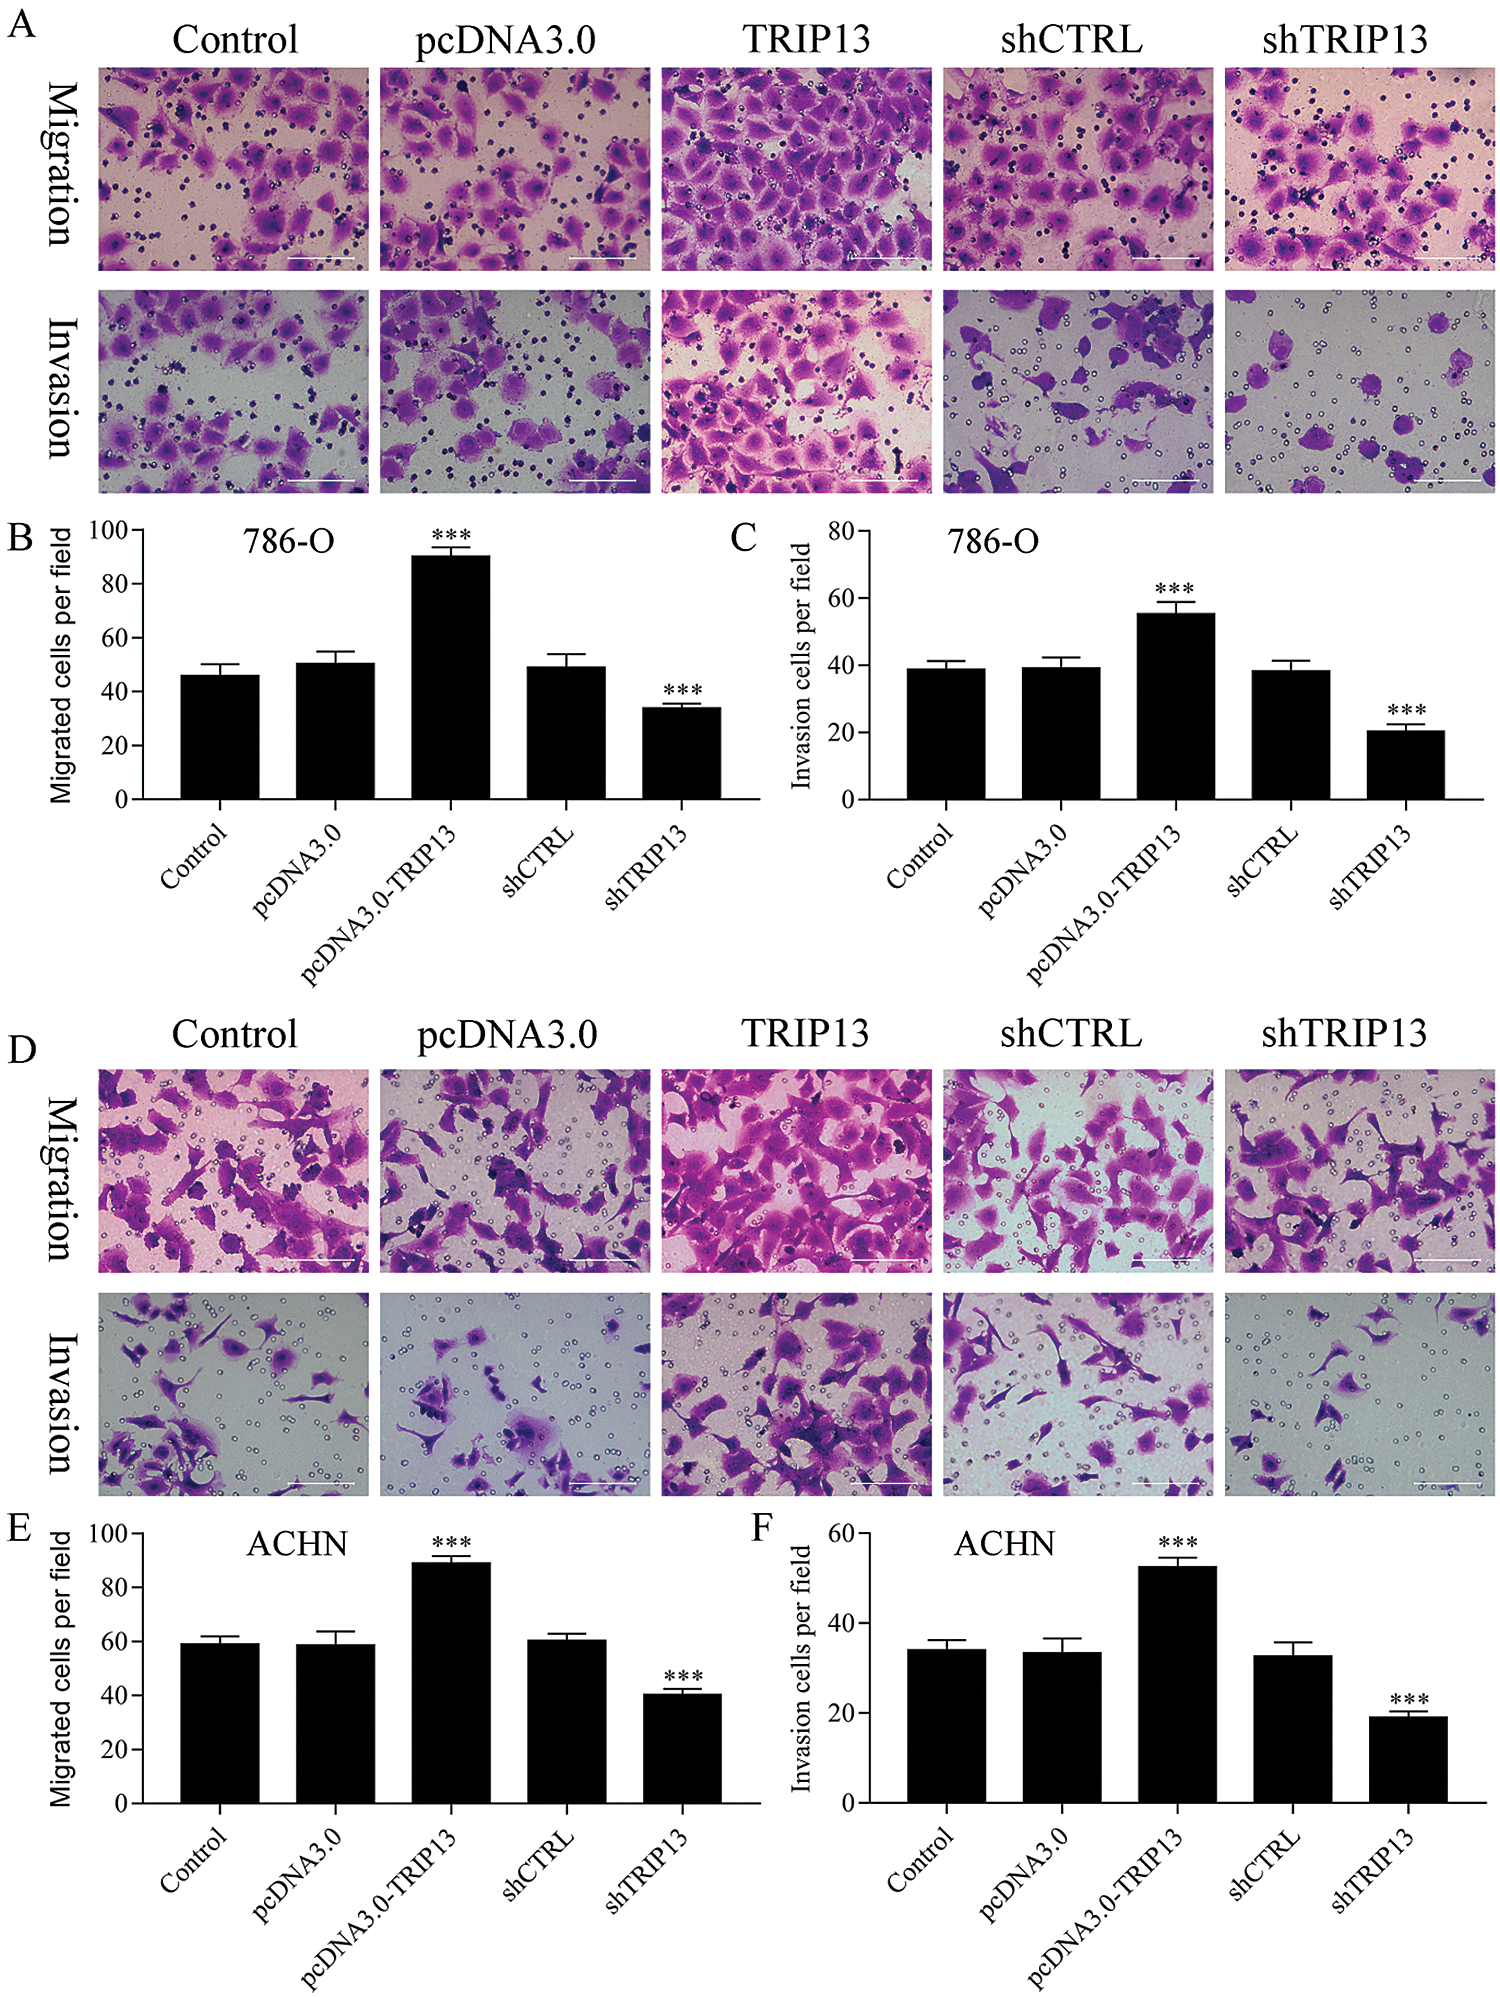
Figure 4: Effect of TRIP13 on RCC cell migration and invasion.
TRIP13 induced RCC cell migration and invasion
To evaluate the role of TRIP13 in RCC metastasis, cell migration and invasion were detected by Transwell assays (Fig. 4). Both 786-O and ACHN cells were transfected with TRIP13 overexpressing and shRNA vectors. Results showed that TRIP13 overexpression significantly increased cell migration of 786-O and ACHN cells, while TRIP13 shRNA significantly inhibited the cell migration (Figs. 4A, 4B, 4D, and 4E). The invasion of 786-O and ACHN cells were significantly increased by TRIP13 overexpression and significantly reduced by TRIP13 shRNA (Figs. 4A, 4C, 4D, and 4F). Thus, TRIP13 induced RCC cell migration and invasion, suggesting a critical role of TRIP13 in RCC metastasis.
In this study, we analyzed high-throughput RNA SEQ data from the TCGA database to screen differentially expressed genes related to the development and prognosis of renal clear cell carcinoma and verified TRIP13 with a large number of clinical samples. The biological function of TRIP13 was also studied.
The ability of rapid proliferation of malignant tumor cells is different from that of normal cells (Mier, 2019; Nakagawa et al., 2020). The imbalance of cell cycle will affect the proliferation and apoptosis of tumor, and the invasion and migration of tumor cells are considered to be the main cause of death (Zeng, 2018; Zeng et al., 2019). Therefore, it is important to elucidate the proliferation, cycle, apoptosis, invasion, and migration of malignant tumors for targeted therapy of cancer. The pathogenesis of renal clear cell carcinoma is complex. A wide range of signal pathways and regulatory factors play an important role in the occurrence and development of renal clear cell carcinoma. Any change of cell signal pathway will lead to the loss of cell proliferation, apoptosis, cycle, invasion, and migration, and promote the occurrence and development of renal clear cell carcinoma (Hsieh et al., 2017; Jonasch et al., 2020).
TRIP13 is a member of the AAA+ ATPase superfamily (Zhu et al., 2019). At present, studies have confirmed that TRIP13 is closely related to tumor proliferation, cycle, invasion, and migration. TRIP13, as a key regulatory protein, can restore the integrity of damaged DNA by promoting the repair mechanism of genomic DNA, and maintain spindle assembly during cell division (Di et al., 2019; Kurita et al., 2016). This study found that TRIP13 plays an important role in the biological function of renal clear cell carcinoma cells. Downregulation of TRIP13 expression in renal clear cell carcinoma cell lines 186-O and ACHN by transfection of interference plasmid can significantly inhibit the proliferation, invasion and migration, induce cell cycle arrest, and promote apoptosis.
Sheng et al. (2018) found that the expression of TRIP13 in colorectal cancer is significantly higher than that in normal tissues, and its expression level is closely related to tumor stage, metastasis, and prognosis of patients (Sheng et al., 2018). They believe that TRIP13 can be used as a potential molecular marker of colorectal cancer. Zhang et al. (2019) found that TRIP13 was highly expressed in glioma cells, and the proliferation, migration, and invasion of glioma cells (Zhang et al., 2019). It is suggested that TRIP13 plays an important role in glioma. Further study of its mechanism showed that TRIP13 could stabilize c-myc by inhibiting the transcription of FBXW7, the E3 ubiquitin ligase of c-myc, directly binding to the promoter region of FBXW7, and knockdown of TRIP13 expression could significantly inhibit reducing the expression of FBXW7 (Zhang et al., 2019). Wang et al. also confirmed in the study that TRIP13 can promote the progress of multiple myeloma, and the small molecule inhibitor DCZ0415 of TRIP13 can bind with TRIP13, thus playing its anti-myeloma activity. Kurita et al. (2016) confirmed in the study that TRIP13 is highly expressed in colorectal cancer tissues, and interference with TRIP13 can significantly inhibit the proliferation, migration, and invasion of colorectal cancer cells. Downregulation of TRIP13 inhibited the growth of myeloma cells, induced apoptosis, and reduced the burden of the tumor. Overexpression of TRIP13 in human myeloma cells can promote cell growth and drug resistance. At the same time, interfering with the expression of TRIP13 can significantly inhibit the growth of myeloma cells in xenografted nude mice, induce apoptosis, and reduce the tumor load. The mechanism is that TRIP13 induces proteasome-mediated MAD2 degradation through the Akt pathway, thus destroying spindle physical examination points. Tumor invasion and migration-related epithelial–mesenchymal transition (EMT) need to be further studied (Yang and Tian, 2019; Zhang, 2019). In addition, renal clear cell carcinoma is fundamentally a metabolic disease and it is characterized by reprogramming of energetic metabolism. In particular, the metabolic flux through glycolysis is partitioned (Bianchi et al., 2017; Lucarelli et al., 2019), and mitochondrial bioenergetics and OxPhox are impaired as well as lipid metabolism (Lucarelli et al., 2018). It is important and needed to test whether TRIP13 induces modifications in cancer cell metabolism through the AKT/mTOR signaling via interacting, for example, with ACTN4 in the future.
In conclusion, overexpression of TRIP13 promotes proliferation, migration and invasion, and knockdown of TRIP13 inhibits proliferation, migration and invasion. The specific mechanism of TRIP13 regulating the biological function of renal clear cell carcinoma cells needs to be further explored. Recent studies have shown that overexpression of TRIP13 was associated with reduced sensitivity to anticancer drugs in squamous cell carcinoma of the head and neck (Banerjee et al., 2014). It would be interesting to evaluate if knockdown of TRIP13 in renal clear cell carcinoma cells is associated with increased sensitivity of chemotherapy such as cisplatin.
Author Contribution: The authors confirm contribution to the paper as follows: Study conception and design: BenJiang Qian, Jianming Tan; data collection: BenJiang Qian, XiaoYan Ying, HuiZhang Li; analysis and interpretation of results: BenJiang Qian, JianMing Tan, Guang Yang; draft manuscript preparation: BenJiang Qian. All authors reviewed the results and approved the final version of the manuscript.
Availability of Data and Materials: The datasets used during the current study are available from the corresponding author on reasonable request.
Supplementary Material: The supplementary material is available online at DOI: 10.32604/biocell.2021.014972.
Ethics Approval: The collection and utilization of the clinical samples were approved by the Ethical Committee of the Dongfang Hospital affiliated with Xiamen University.
Funding Statement: The study was supported by Grants from the Nature Science Foundation of Fujian, China (Nos. 2010J01372, 2015J01571).
Conflicts of Interest: The authors declare that they have no conflicts of interest to report regarding the present study.
Amato RJ, Khan M. (2008). A phase I clinical trial of low-dose interferon-α-2A, thalidomide plus gemcitabine and capecitabine for patients with progressive metastatic renal cell carcinoma. Cancer Chemotherapy and Pharmacology 61: 1069–1073. DOI 10.1007/s00280-007-0568-7. [Google Scholar] [CrossRef]
Bandini M, Smith A, Marchioni M, Pompe RS, Martel TF, Cindolo L, Montorsi F, Shariat SF, Briganti A, Kapoor A, Capitanio U, Karakiewicz PI. (2018). Adjuvant therapies in nonmetastatic renal-cell carcinoma: A review of the literature. Clinical Genitourinary Cancer 16: 176–183. DOI 10.1016/j.clgc.2018.01.003. [Google Scholar] [CrossRef]
Banerjee R, Russo N, Liu M, Basrur V, Bellile E, Palanisamy N, Scanlon CS, van Tubergen E, Inglehart RC, Metwally T, Mani RS, Yocum A, Nyati MK, Castilho RM, Varambally S, Chinnaiyan AM, D’Silva NJ. (2014). TRIP13 promotes error-prone nonhomologous end joining and induces chemoresistance in head and neck cancer. Nature Communications 5: 4527. DOI 10.1038/ncomms5527. [Google Scholar] [CrossRef]
Bianchi C, Meregalli C, Bombelli S, di Stefano V, Salerno F, Torsello B, De Marco S, Bovo G, Cifola I, Mangano E, Battaglia C, Strada G, Lucarelli G, Weiss RH, Perego RA. (2017). The glucose and lipid metabolism reprogramming is grade-dependent in clear cell renal cell carcinoma primary cultures and is targetable to modulate cell viability and proliferation. Oncotarget 8: 113502–113515. DOI 10.18632/oncotarget.23056. [Google Scholar] [CrossRef]
Cella D, Motzer RJ, Rini BI, Cappelleri JC, Ramaswamy K, Hariharan S, Arondekar B, Bushmakin AG. (2018). Important group differences on the functional assessment of cancer therapy-kidney symptom index disease-related symptoms in patients with metastatic renal cell carcinoma. Value in Health 21: 1413–1418. DOI 10.1016/j.jval.2018.04.1371. [Google Scholar] [CrossRef]
Colaprico A, Silva TC, Olsen C, Garofano L, Cava C, Garolini D, Sabedot TS, Malta TM, Pagnotta SM, Castiglioni I, Ceccarelli M, Bontempi G, Noushmehr H. (2016). TCGAbiolinks: an R/Bioconductor package for integrative analysis of TCGA data. Nucleic Acids Research 44: e71. DOI 10.1093/nar/gkv1507. [Google Scholar] [CrossRef]
Chandrashekar DS, Bashel B, Balasubramanya SAH, Creighton CJ, Ponce-Rodriguez I, Chakravarthi BVSK, Varambally S. (2017). UALCAN: A portal for facilitating tumor subgroup gene expression and survival analyses. Neoplasia 19: 649–658. DOI 10.1016/j.neo.2017.05.002. [Google Scholar] [CrossRef]
Chen RC, Choueiri TK, Feuilly M, Meng J, Lister J, Marteau F, Falchook AD, Morris MJ, George DJ, Feldman DR. (2020). Quality-adjusted survival with first-line cabozantinib or sunitinib for advanced renal cell carcinoma in the CABOSUN randomized clinical trial (Alliance). Cancer 126: 5311–5318. DOI 10.1002/cncr.33169. [Google Scholar] [CrossRef]
Chen W, Zheng R, Baade PD, Zhang S, Zeng H, Bray F, Jemal A, Yu XQ, He J. (2016). Cancer statistics in China, 2015. CA: A Cancer Journal for Clinicians 66: 115–132. DOI 10.3322/caac.21338. [Google Scholar] [CrossRef]
Chen W, Zheng R, Zhang S, Zeng H, Xia C, Zuo T, Yang Z, Zou X, He J. (2017). Cancer incidence and mortality in China. Cancer Letters 401: 63–71. [Google Scholar]
Chin AI, Lam JS, Figlin RA, Figlin RA, Belldegrun AS. (2006). Surveillance strategies for renal cell carcinoma patients following nephrectomy. Reviews in Urology 8: 1–7. [Google Scholar]
De Raffele E, Mirarchi M, Casadei R, Ricci C, Brunocilla E, Minni F. (2020). Twenty-year survival after iterative surgery for metastatic renal cell carcinoma: A case report and review of literature. World Journal of Clinical Cases 8: 4450–4465. DOI 10.12998/wjcc.v8.i19.4450. [Google Scholar] [CrossRef]
Di Lorenzo G, de Placido S, Pagliuca M, Ferro M, Lucarelli G, Rossetti S, Bosso D, Puglia L, Pignataro P, Ascione I, De Cobelli O, Caraglia M, Aieta M, Terracciano D, Facchini G, Buonerba C, Sonpavde G. (2016). The evolving role of monoclonal antibodies in the treatment of patients with advanced renal cell carcinoma: A systematic review. Expert Opinion on Biological Therapy 16: 1387–1401. DOI 10.1080/14712598.2016.1216964. [Google Scholar] [CrossRef]
Di S, Li M, Ma Z, Guo K, Li X, Yan X. (2019). TRIP13 upregulation is correlated with poor prognosis and tumor progression in esophageal squamous cell carcinoma. Pathology—Research and Practice 215: 152415. DOI 10.1016/j.prp.2019.04.007. [Google Scholar] [CrossRef]
Feng RM, Zong YN, Cao SM, Xu RH. (2019). Current cancer situation in China: Good or bad news from the 2018 Global Cancer Statistics? Cancer Communications 39: 22. DOI 10.1186/s40880-019-0368-6. [Google Scholar] [CrossRef]
Hsieh JJ, Purdue MP, Signoretti S, Swanton C, Albiges L, Schmidinger M, Heng DY, Larkin J, Ficarra V. (2017). Renal cell carcinoma. Nature Reviews Disease Primers 3: 131. DOI 10.1038/nrdp.2017.9. [Google Scholar] [CrossRef]
Huang S, Tuergong G, Zhu H, Wang X, Weng G, Ren Y. (2021). Norcantharidin induces G2/M arrest and apoptosis via activation of ERK and JNK, but not p38 signaling in human renal cell carcinoma ACHN cells. Acta Pharmaceutica 71: 267–278. [Google Scholar]
Jonasch E, Walker CL, Rathmell WK. (2020). Clear cell renal cell carcinoma ontogeny and mechanisms of lethality. Nature Reviews Nephrology 68: 394. DOI 10.1038/s41581-020-00359-2. [Google Scholar] [CrossRef]
Kurita K, Maeda M, Mansour MA, Kokuryo T, Uehara K, Yokoyama Y, Nagino M, Hamaguchi M, Senga T. (2016). TRIP13 is expressed in colorectal cancer and promotes cancer cell invasion. Oncology Letters 12: 5240–5246. DOI 10.3892/ol.2016.5332. [Google Scholar] [CrossRef]
Li SL, Jiang TQ, Cao QW, Liu SM. (2020). Transmembrane protein ADAM29 facilitates cell proliferation, invasion and migration in clear cell renal cell carcinoma. Journal of Chemotherapy 18: 1–11. DOI 10.1080/1120009X.2020.1842035. [Google Scholar] [CrossRef]
Lucarelli G, Loizzo D, Franzin R, Battaglia S, Ferro M, Cantiello F, Castellano G, Bettocchi C, Ditonno P, Battaglia M. (2019). Metabolomic insights into pathophysiological mechanisms and biomarker discovery in clear cell renal cell carcinoma. Expert Review of Molecular Diagnostics 19: 397–407. DOI 10.1080/14737159.2019.1607729. [Google Scholar] [CrossRef]
Lucarelli G, Rutigliano M, Sallustio F, Ribatti D, Giglio A, Lepore Signorile M, Grossi V, Sanese P, Napoli A, Maiorano E, Bianchi C, Perego RA, Ferro M, Ranieri E, Serino G, Bell LN, Ditonno P, Simone C, Battaglia M. (2018). Integrated multi-omics characterization reveals a distinctive metabolic signature and the role of NDUFA4L2 in promoting angiogenesis, chemoresistance, and mitochondrial dysfunction in clear cell renal cell carcinoma. Sedentary Life and Nutrition 10: 3957–3985. [Google Scholar]
Mier JW. (2019). The tumor microenvironment in renal cell cancer. Current Opinion in Oncology 31: 194–199. DOI 10.1097/CCO.0000000000000512. [Google Scholar] [CrossRef]
Nakagawa T, Lanaspa MA, Millan IS, Fini M, Rivard CJ, Sanchez-Lozada LG, Andres-Hernando A, Tolan DR, Johnson RJ. (2020). Fructose contributes to the Warburg effect for cancer growth. Cancer & Metabolism 8: 269. DOI 10.1186/s40170-020-00222-9. [Google Scholar] [CrossRef]
Niu L, Gao Z, Cui Y, Yang X, Li H. (2019). Thyroid receptor-interacting protein 13 is correlated with progression and poor prognosis in bladder cancer. Medical Science Monitor 25: 6660–6668. DOI 10.12659/MSM.917112. [Google Scholar] [CrossRef]
Omae K, Kondo T, Kennoki T, Takagi T, Iizuka J, Kobayashi H, Hashimoto Y, Tanabe K. (2016). Efficacy and safety of sorafenib for treatment of Japanese metastatic renal cell carcinoma patients undergoing hemodialysis. International Journal of Clinical Oncology 21: 126–132. DOI 10.1007/s10147-015-0871-y. [Google Scholar] [CrossRef]
Ruppin S, Protzel C, Klebingat KJ, Hakenberg OW. (2009). Successful sorafenib treatment for metastatic renal cell carcinoma in a case with chronic renal failure. European Urology 55: 986–988. DOI 10.1016/j.eururo.2008.10.027. [Google Scholar] [CrossRef]
Sheng N, Yan L, Wu K, You W, Gong J, Hu L, Tan G, Chen H, Wang Z. (2018). TRIP13 promotes tumor growth and is associated with poor prognosis in colorectal cancer. Cell Death & Disease 9: 177. DOI 10.1038/s41419-018-0434-z. [Google Scholar] [CrossRef]
Szklarczyk D, Gable AL, Lyon D, Junge A, Wyder S, Huerta-Cepas J, Simonovic M, Doncheva NT, Morris JH, Bork P, Jensen LJ, Mering CV. (2019). STRING v11: Protein-protein association networks with increased coverage, supporting functional discovery in genome-wide experimental datasets. Nucleic Acids Research 47: D607–D613. DOI 10.1093/nar/gky1131. [Google Scholar] [CrossRef]
Tamma R, Rutigliano M, Lucarelli G, Annese T, Ruggieri S, Cascardi E, Napoli A, Battaglia M, Ribatti D. (2019). Microvascular density, macrophages, and mast cells in human clear cell renal carcinoma with and without bevacizumab treatment. Urologic Oncology 37: 355.e311–355.e319. [Google Scholar]
Torre LA, Bray F, Siegel RL, Ferlay J, Lortet-Tieulent J, Jemal A. (2015). Global cancer statistics, 2012. CA: A Cancer Journal for Clinicians 65: 87–108. DOI 10.3322/caac.21262. [Google Scholar] [CrossRef]
Tosoian JJ, Feldman AS, Abbott MR, Mehra R, Tiemeny P, Wolf JSJr, Stone S, Wu S, Daignault-Newton S, Taylor JMG, Wu CL, Morgan TM. (2020). Biopsy Cell cycle proliferation score predicts adverse surgical pathology in localized renal cell carcinoma. European Urology 78: 657–660. DOI 10.1016/j.eururo.2020.08.032. [Google Scholar] [CrossRef]
Vader G. (2015). Pch2(TRIP13Controlling cell division through regulation of HORMA domains. Chromosoma 124: 333–339. DOI 10.1007/s00412-015-0516-y. [Google Scholar] [CrossRef]
Xie J, Wu Z, Xu X, Liang G, Xu J. (2020). Screening and identification of key genes and pathways in metastatic uveal melanoma based on gene expression using bioinformatic analysis. Medicine 99: e22974. DOI 10.1097/MD.0000000000022974. [Google Scholar] [CrossRef]
Xu DD, Ding M, Tong P, Chong YY, Gu WY, Li Y, Fang XJ, Li N. (2020). Synergistic effects of low-dose chemotherapy and T cells in renal cell carcinoma. Oncology Reports 44: 897–908. DOI 10.3892/or.2020.7679. [Google Scholar] [CrossRef]
Yang C, Tian Y. (2019). SPAG9 promotes prostate cancer growth and metastasis. BIOCELL 43: 207–213. DOI 10.32604/biocell.2019.07258. [Google Scholar] [CrossRef]
Yu G, Wang LG, Han Y, He QY. (2012). clusterProfiler: An R package for comparing biological themes among gene clusters. OMICS: A Journal of Integrative Biology 16: 284–287. DOI 10.1089/omi.2011.0118. [Google Scholar] [CrossRef]
Zeng Y. (2018). Advances in mechanism and treatment strategy of cancer. Cellular and Molecular Biology 64: 1–3. DOI 10.14715/cmb/2018.64.6.1. [Google Scholar] [CrossRef]
Zeng Y, Fu BM. (2020). Resistance mechanisms of anti-angiogenic therapy and exosomes-mediated revascularization in cancer. Frontiers in Cell and Developmental Biology 8: 1560. [Google Scholar]
Zeng Y, Yao X, Liu X, He X, Li L, Liu X, Yan Z, Wu J, Fu BM. (2019). Anti-angiogenesis triggers exosomes release from endothelial cells to promote tumor vasculogenesis. Journal of Extracellular Vesicles 8: 1629865. DOI 10.1080/20013078.2019.1629865. [Google Scholar] [CrossRef]
Zhang G, Zhu Q, Fu G, Hou J, Hu X, Cao J, Peng W, Wang X, Chen F, Cui H. (2019). TRIP13 promotes the cell proliferation, migration and invasion of glioblastoma through the FBXW7/c-MYC axis. British Journal of Cancer 121: 1069–1078. DOI 10.1038/s41416-019-0633-0. [Google Scholar] [CrossRef]
Zhang X. (2019). Effects of polydatin on the proliferation, migration, and invasion of ovarian cancer. BIOCELL 43: 313–319. DOI 10.32604/biocell.2019.07973. [Google Scholar] [CrossRef]
Zhu MX, Wei CY, Zhang PF, Gao DM, Chen J, Zhao Y, Dong SS, Liu BB. (2019). Elevated TRIP13 drives the AKT/mTOR pathway to induce the progression of hepatocellular carcinoma via interacting with ACTN4. Journal of Experimental & Clinical Cancer Research 38: 302. DOI 10.1186/s13046-019-1401-y. [Google Scholar] [CrossRef]
Supplementary Materials
TABLE 1: Differentially expressed genes in RCC cancer and paracancerous tissues
TABLE 2: Differentially expressed genes in Top 30 GO items
TABLE 3: Differentially expressed genes in Top 20 KEGG pathways
TABLE 4: Differentially expressed genes with AUC larger than 0.65
 | This work is licensed under a Creative Commons Attribution 4.0 International License, which permits unrestricted use, distribution, and reproduction in any medium, provided the original work is properly cited. |