DOI:10.32604/biocell.2021.013882
www.techscience.com/journal/biocell
| Biocell DOI:10.32604/biocell.2021.013882 | www.techscience.com/journal/biocell |
| Article |
Chemokine Ligand 13 Expression is Abundant in the Tumor Microenvironment and Indicates Poor Prognosis of Kidney Clear Cell Carcinoma
1Department of Biotherapy and Cancer Center/Collaborative Innovation Center for Biotherapy, West China Hospital, Sichuan University, Chengdu, 610041, China
2Guangdong Zhongsheng Pharmaceutical Co., Ltd., Shantou, 515041, China
*Address correspondence to: Yiwen Zhang, yiwenzhang@scu.edu.cn; Shijie Zhou, vicjaychou@hotmail.com
Received: 27 August 2020; Accepted: 05 November 2020
Abstract: The chemokine ligand 13-chemokine receptor 5 (CXCL13-CXCR5) axis has been characterized as a critical tumor-promoting signaling pathway in the tumor microenvironment (TME) in multiple types of solid tumors. In this study, we analyzed the expression profile of CXCL13 in kidney clear cell carcinoma (KIRC) and its correlation with tumor-infiltrating immune cells (TIICs). A monoclonal antibody against CXCL13 with high affinity and purity was generated in our lab for western blot and immunohistochemistry (IHC). Bioinformatic analysis was performed based on bulk-seq data from the Cancer Genome Atlas (TCGA)-KIRC and single-cell RNA-seq data from scRNASeqDB and PanglaoDB. Results showed that high CXCL13 expression in TME was associated with shorter progression-free survival (PFS), disease-specific survival (DSS), and overall survival (OS). KIRC cell lines, as well as several other cancer cell lines, had negative CXCL13 expression. IHC staining from the Human Protein Atlas (HPA) and our tissue array indicated that CXCL13 might be mainly expressed by TIICs, but not KIRC tumor cells. CXCL13 expression was strongly and positively correlated with γδ T cell abundance in TME. Besides, γδ T cell infiltration was associated with poor survival of KIRC. Methylation 450k array data showed that CXCL13 promoter hypomethylation was common in TIICs. The methylation level of cg16361705 within the CXCL13 promoter might play an important role in modulating CXCL13 transcription. In conclusion, our study revealed that CXCL13 expression and γδ T cell infiltration in TME is associated with unfavorable survival of KIRC. TIICs, most possibly γδ T cells, are the dominant source of CXCL13 in KIRC TME.
Keywords: CXCL13; Kidney clear cell carcinoma; Gamma/delta T cells; DNA methylation; Unfavorable survival
Abbreviations
| TME: | tumor microenvironment |
| CXCL13: | chemokine ligand 13 |
| CXCR5: | chemokine receptor 5 |
| IHC: | immunohistochemistry |
| TIICs: | tumor-infiltrating immune cells |
| KIRC: | kidney clear cell carcinoma |
| PFS: | progression-free survival |
| DSS: | disease-specific survival |
| OS: | overall survival |
| HPA: | Human Protein Atlas |
| DFS: | disease-free survival |
| TCGA: | the Cancer Genome Atlas |
| NTE: | new tumor event |
| TMA: | Tissue microarray |
| SPR: | Surface Plasmon Resonance |
| DCs: | follicular dendritic cells |
| TFH cells: | T follicular helper cells |
Chemokine (C-X-C motif) ligand 13 (CXCL13), which is also known as B cell-attracting chemokine 1 (BCA-1), is a protein-ligand encoded by the CXCL13 gene. It is selectively chemotactic for B cells via binding with CXCR5 expressed on B cell’s surface. Besides the role to induce lymphocyte migration, some recent studies also found its involvement in the TME (Irshad et al., 2017). Enhanced activation of the CXCL13/CXCR5 axis is closely associated with unfavorable prognosis of multiple types of solid tumors. CXCR5 is widely expressed in colon cancer cells. CXCL13 treatment stimulates the growth, invasion, and migration of colon cancer cells, by activating PI3K/AKT pathway in a CXCR5-dependent manner (Zhu et al., 2015). Elevated CXCL13 expression was positively correlated with larger tumor size and shorter OS in patients with gastric cancer (Wei et al., 2018). CXCL13 stimulation also induces the epithelial-to-mesenchymal transition of breast cancer cells via the CXCL13-CXCR5-RANKL-Src axis (Biswas et al., 2014). CXCL13/CXCR5 binding activates multiple tumor-promoting cell-signaling cascades in prostate TME, including ERK, PKCε/NF-kB, SAPK)/JNK, and PI3K/Akt (Hussain et al., 2019). One recent study observed that CXCL13 is significantly upregulated in KIRC tissue and was associated with poor OS and disease-free survival (DFS) (Xu et al., 2019). Another study reported that CXCL13 might stimulate the activation of the PI3K/AKT/mTOR signaling pathway in KIRC (Zheng et al., 2018). Targeting CXCL13/CXCR5 using siRNA or shRNA has manifested the therapeutic potential/validation in these solid tumors. Therefore, blocking the CXCL13/CXCR5 pathway has been considered as a potential therapeutic strategy.
For accurate targeting therapy, it is quite important to know the source of CXCL13. However, it has not been well characterized in TME. Previous studies revealed that CXCL13 is expressed by follicular dendritic cells (DCs) or stromal cells in lymphoid organs (Ohmatsu et al., 2007). However, in breast TME, CXCL13 is mainly expressed by T follicular helper cells (TFH cells) (Gu-Trantien et al., 2017). One recent study found a distinct CD103+/CD8+ T-cell population can secrete CXCL13 in TME (Workel et al., 2019). In comparison, follicular DCs are not potent CXCL13 producers (Gu-Trantien et al., 2017). Two recent studies reported that CXCL13 was overexpressed in KIRC tumor cell lines (Xu et al., 2019; Zheng et al., 2018). However, these findings are highly suspicious since CXCL13 expression is mainly restricted to immune cells.
In this study, we analyzed the expression profiles of CXCL13 in KIRC using a monoclonal antibody generated in our lab and also checked its correlation with tumor-infiltrating immune cells (TIICs). Our findings revealed that TIICs, most possibly γδ T cells are the dominant source of CXCL13 in KIRC TME.
Data retrieving from The Cancer Genome Atlas (TCGA)-KIRC
The normalized level-3 data of the KIRC cohort in the TCGA database was acquired using the UCSC Xena (http://xena.ucsc.edu/). Clinicopathological, RNA-seq, DNA methylation (quantified by Illumina HumanMethylation450 BeadChip), and survival data were extracted for further analysis. In brief, gender, AJCC pathological stages, and histological grade of tumors were extracted. RNA-seq data were represented as log2 (TPM + 0.001). Log2 (fold change, FC) was calculated between two groups. The methylation level of CpG sites was calculated and represented by the β value. Survival data included PFS, DFS, DSS, and OS. PFS refers to the period from the date of diagnosis until the date of the first occurrence of a new tumor event (NTE), which includes a progression of the disease, locoregional recurrence, distant metastasis, new primary tumor, or death with the tumor. Patients who were alive without these event types or died without tumor were censored. DSS event is defined as death from the disease (Liu et al., 2018).
A total of 530 primary tumor cases and 72 adjacent normal (adj. N) tissues with RNA-seq data were included. All 530 tumor cases had OS data, among which 528, 116 and 519 cases had PFS, DFS, and DSS data, respectively. Besides, 309 tumor cases and 23 adj. N cases have RNA-seq and methylation data at the same time.
Single-cell (sc)RNA-seq data retrieving from scRNASeqDB and PanglaoDB
ScRNA-seq data of previous publication datasets were examined using scRNASeqDB (https://bioinfo.uth.edu/scrnaseqdb/index.php?csrt=18377095680907440044) (Cao et al., 2017) and PanglaoDB (https://panglaodb.se/index.html) (Franzen et al., 2019). The former one currently collected 38 scRNA-seq datasets, while the latter one collected 305 human scRNA-seq datasets.
Data retrieving from The Human Protein Atlas (HPA)
Immunohistochemistry (IHC) staining of CXCL13 (antibody: HPA052613) in renal tumor tissues were retrieved from the HPA (https://www.proteinatlas.org/) (Uhlen et al., 2015; Uhlen et al., 2017). In this database, 11 renal cancer tissues were stained for CXCL13 expression, among which four were scored as low, while seven were scored as negative.
Human embryonic kidney cell line 293T, KIRC cell lines ORSC2 and 7860, renal cell carcinoma cell line ACHN, ovarian cancer cell line SKOV3, leukemia cell line K562, U266 were purchased from the ATCC. All cell lines were cultured at 37°C, 5% CO2 in a humidified incubator in standard cell culture media as indicated by the provider.
Preparation of a monoclonal antibody against human CXCL13 (18-C1-B3)
In brief, BALB/C mice were immunized using CXCL13 recombinant protein. To Monoclonal antibody was generated by hybridoma technology. Firstly, ELISA was used to select antibodies that bind to CXCL13 recombinant protein. Cell ELISA was performed to screen competitive antibodies. Surface Plasmon Resonance (SPR) was utilized to screen high-affinity antibodies. The hybridoma cells were sub-cloned at least two times by limiting dilution method. Finally, CXCL13 antibodies with high purity were obtained using protein G affinity chromatography. The purity of the antibodies was higher than 95%, as determined by SDS-PAGE. A monoclonal CXCL13 antibody (18-C1-B3) was used in the current study.
Whole-cell lysates of 293T, ORSC2, 7860, ACHN, SKOV3, K562, and U266 cells were prepared using RIPA buffer (Beyotime, Wuhan, China) supplemented with protease inhibitor PMSF (MilliporeSigma, St. Louis, MO, USA). Protein concentrations were determined using a BCA protein assay kit (Thermo, Waltham, MA, USA). Protein extracts and CXCL13 recombinant Protein (PeproTech, Rocky Hil, NJ, USA) were separated by 15% SDS-PAGE and transferred onto a PVDF membrane (MilliporeSigma). PVDF membrane was blocked in TBS containing 5% nonfat dry milk and 0.1% Tween 20 with gentle shaking for 1 h. Membranes were incubated with a primary antibody generated in our lab (18-C1-B3, 1:2000) or a commercially available antibody (AF801, 1:2000, R&D Systems, Minneapolis, MN, USA) diluted in the blocking buffer at 4°C overnight. Then, they were incubated for 1 h with the corresponding horseradish peroxidase-linked secondary antibodies (Zhong Shan Golden Bridge Biotechnology, China) diluted 1:5000 in blocking buffer. Images were captured by a ChmiScope 6000 Touch (Clinx, Shanghai, China).
CXCL13 expression in human KIRC tissues was evaluated using a human tissue microarray. Paraffin-embedded TMA was deparaffinized in xylene and rehydrated in gradients concentration of ethanol. TMA was treated with retrieval solution for 15 min at 99°C and incubated with anti-CXCL13 antibody in our lab overnight after blocking with goat serum for 1 h at room temperature. Following a wash, slides were incubated with DakoRealTMEnVisionTM horseradish peroxidase-conjugated anti-mouse antibody for 30 min at room temperature and then visualized using diaminobenzidine (Dako, Carpinteria, CA, USA). Staining was analyzed via Imagscope Viewer (Leica Biosystems, Buffalo Grove, IL, USA).
Data retrieving from The Cancer Immunome Atlas
The fractions of TIICs in TCGA-KIRC were acquired from the Cancer Immunome Atlas (https://tcia.at/home) (Charoentong et al., 2017). In this dataset, RNAs-seq data from TCGA was used to make an estimation using a strategy called CIBERSORT (Newman et al., 2019). This method characterizes the cell composition of complex tissues from their gene expression profiles. Briefly, it used 547 genes to distinguish 22 human hematopoietic cell phenotypes, including seven T cell types, naïve and memory B cells, plasma cells, NK cells, and myeloid subsets.
Statistical analysis was conducted using SPSS 25.0 and GraphPad Prism 8.1.2. Data were reported as the mean ± standard deviation (SD). Unequal variances t-test (Welch’s t-test) was performed for group-group comparison. Kaplan-Meier survival curves were generated. Survival difference was assessed by the Log-rank test. Correlation analysis was performed by calculating Pearson’s correlation coefficients. p < 0.05 was considered statistically significant.
High CXCL13 expression in KIRC tissue was associated with unfavorable survival outcomes
Several previous studies indicated that CXCL13 expression might serve as a valuable biomarker in terms of therapeutic responses and prognosis in multiple cancers, including gastric cancer (Wei et al., 2018), breast cancer (Razis et al., 2020), and renal cancer (Zheng et al., 2018). Using RNA-seq data from TCGA-KIRC, we confirmed that CXCL13 expression was significantly higher in KIRC tumor tissues (N = 530) than in adj. N tissues (N = 72, log2 FC = 5.387 ± 0.375, p < 0.001) (Figs. 1A–1B). No significant difference was observed between male and female patients (p = 0.26, Fig. 1C). However, CXCL13 expression was significantly higher in advanced stage (Stage III/IV vs. I/II, log2 FC = 1.529 ± 0.248, p < 0.001) and high grade (grade 3/4 vs. grade 1/2, log2 FC = 1.434 ± 0.239, p < 0.001) tumors (Figs. 1D–1E). Survival analysis confirmed that the groups with the highest quartile of CXCL13 expression had significantly worse PFS, DSS, and OS compared to the groups with the lowest quartile of CXCL13 expression (Figs. 1F–1H). In terms of DFS, we failed to identify a significant difference between the high and low CXCL13 expression groups by either quartile or median gene separation (Suppl. Figs. 1A–1B).
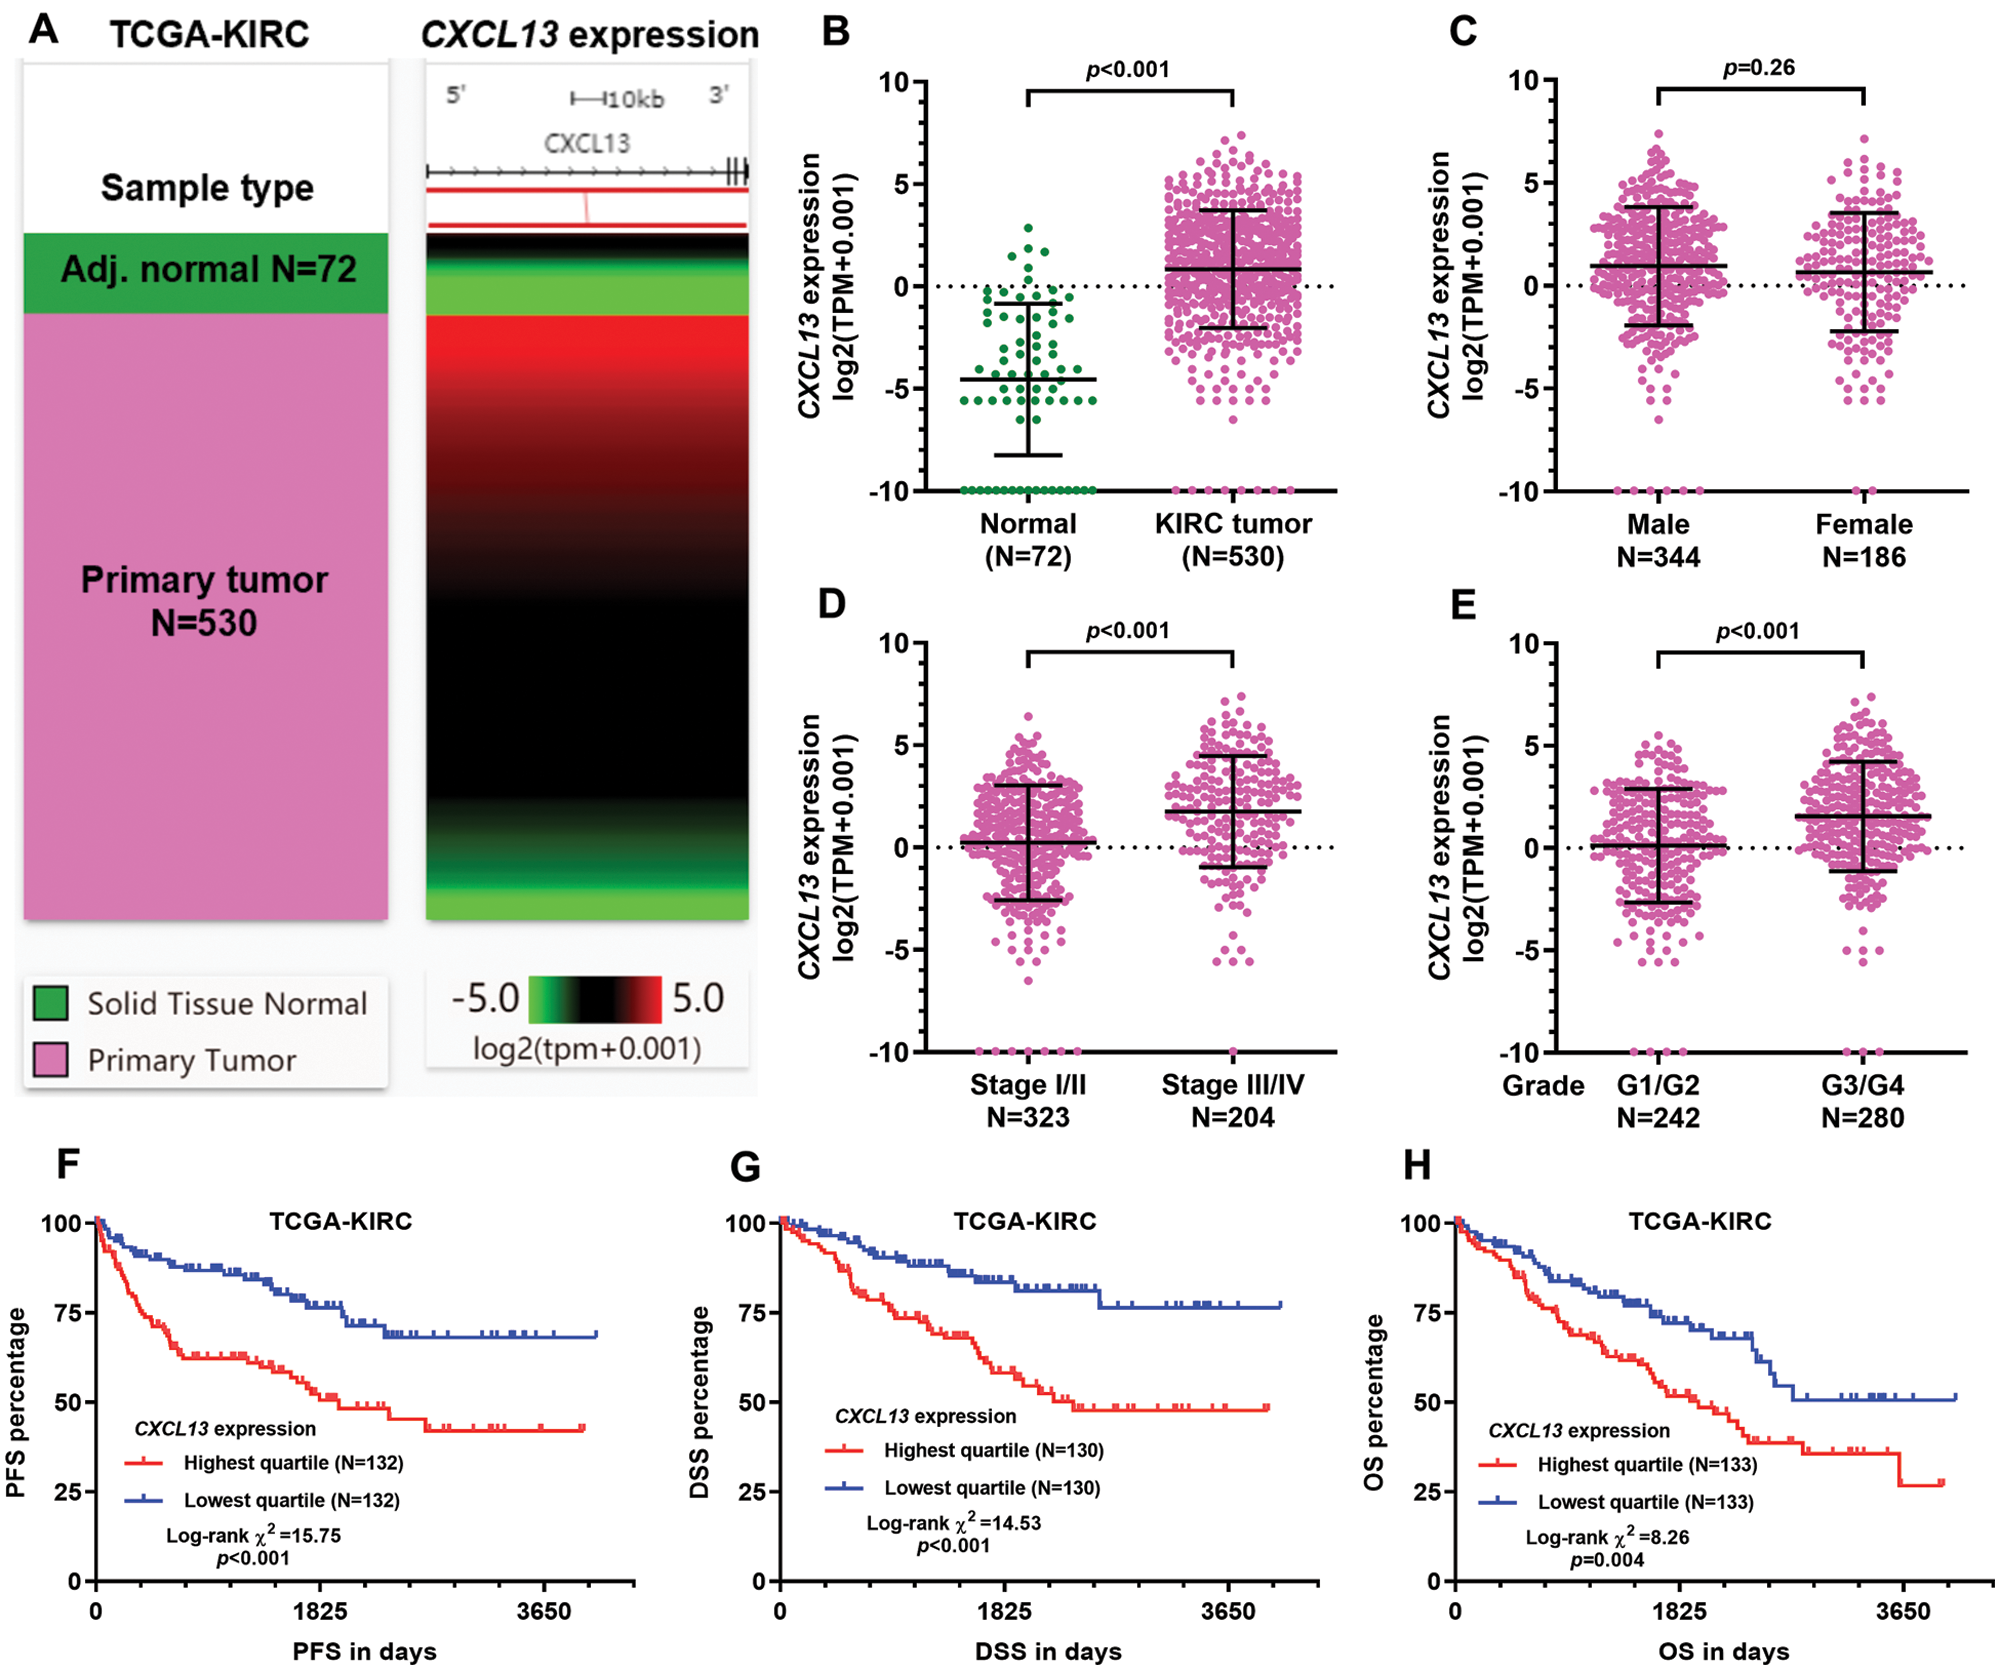
Figure 1: High CXCL13 expression in KIRC tissue was associated with unfavorable survival outcomes.
CXCL13 was mainly expressed by TIICs
Although we confirmed the association between CXCL13 expression and unfavorable survival outcomes using data from TCGA-KIRC, the source of CXCL13 in the TME has not been well-characterized since RNA-seq data in TCGA-KIRC are from on bulk tissue. Two recent studies reported that renal cancer cell lines had significantly upregulated CXCL13 expression (Xu et al., 2019; Zheng et al., 2018). However, these findings are highly suspicious since CXCL13 mRNA expression was very limited in most of the tumor cell lines, according to the results in the HPA (Fig. 2A). Only several myeloid and bone marrow-derived cell lines, such as U-266, HL-60, and RH-30, have positive CXCL13 expression (Fig. 2A). HEK 293 cells (a human embryonic kidney cell line) has negative CXCL13 expression (Fig. 2A, black arrow).
To verify the RNA expression in KIRC cells, we also checked one previous scRNA-seq dataset (N = 116, GSE73121) based on primary and metastatic tumor cells (Kim et al., 2016), using scRNASeqDB. In this dataset, 34 parental metastatic KIRC (mKIRC) tumor cells, 36 patient-derived xenograft (PDX)-mKIRC tumor cells, and 46 PDX-primary KIRC (pKIRC) tumor cells were subjected to scRNA-seq. Results showed that among these cells, only one cell in the mKIRC group showed positive CXCL13 expression, while the rest 115 cells all had zero CXCL13 expression (Fig. 2B).
To explore the real source of CXCL13, we checked data in PanglaoDB, which including 305 human scRNA-seq datasets covering nearly all human tissues. Results identified three datasets with positive CXCL13 expression (https://panglaodb.se/search.html?query=%22CXCL13%22&species=3&tumor=1&nonadult=1), among which two datasets were T cells (SRA767245 and SRA767245), and another one was fibroblasts from embryonic stem cell lines (SRA676027).
To characterize the expression of CXCL13 at the protein level, we generated a CXCL13 monoclonal antibody (18-C1-B3). Western blot data indicated that KIRC cell lines (ORSC2 and 7860), as well as several other cancer cell lines, were negative for CXCL13 expression (Fig. 2C). Similar results were observed using a commercial CXCL13 antibody from an R&D system (AF801) (Fig. 2C). However, both 18-C1-B3 and AF801 could recognize the recombined CXCL13 protein (Fig. 2C).
Therefore, we infer that high CXCL13 expression detected by bulk-seq data in TCGA-KIRC was not from tumor cells but from other cells in TME. To validate this hypothesis, we checked IHC staining of 11 renal cancer tissues in the HPA, which used a commercial primary antibody against CXCL13 from Millipore Sigma (HPA052613). According to the CXCL13 staining score, 4 cases were low (Fig. 2D, up), while the rest 7 cases were not detected. Based on the images, we clearly saw the four cases with low CXCL13 staining all had abundant TIICs, which were generally CXCL13 positive (Fig. 2D up, purple arrows). The tumor cells around the TIICs also presented positive CXCL13 staining. As a secreted chemokine that can bind to typical receptors (such as CXCR5) on the surface of tumor cells, we speculated that the tumor cells-associated CXCL13 staining was a reflection of the CXCL13-receptor binding. In comparison, TIICs were rare in the cases scored as CXCL13 negative (Fig. 2D, down). Meanwhile, tumor cells were CXCL13 negative if no TIICs were nearby (Fig. 2D, down). To validate these findings, we also performed IHC using KIRC tissue array with our own anti-CXCL13 (18-C1-B3). Results confirmed that the issues lacking TIICs were generally CXCL13 negative (Fig. 2E, left). In comparison, TIICs and the surrounding KIRC tumor cells were CXCL13 positive (Fig. 2E, middle and right). These findings collectively suggested that CXCL13 might be mainly expressed by TIICs but no KIRC tumor cells.
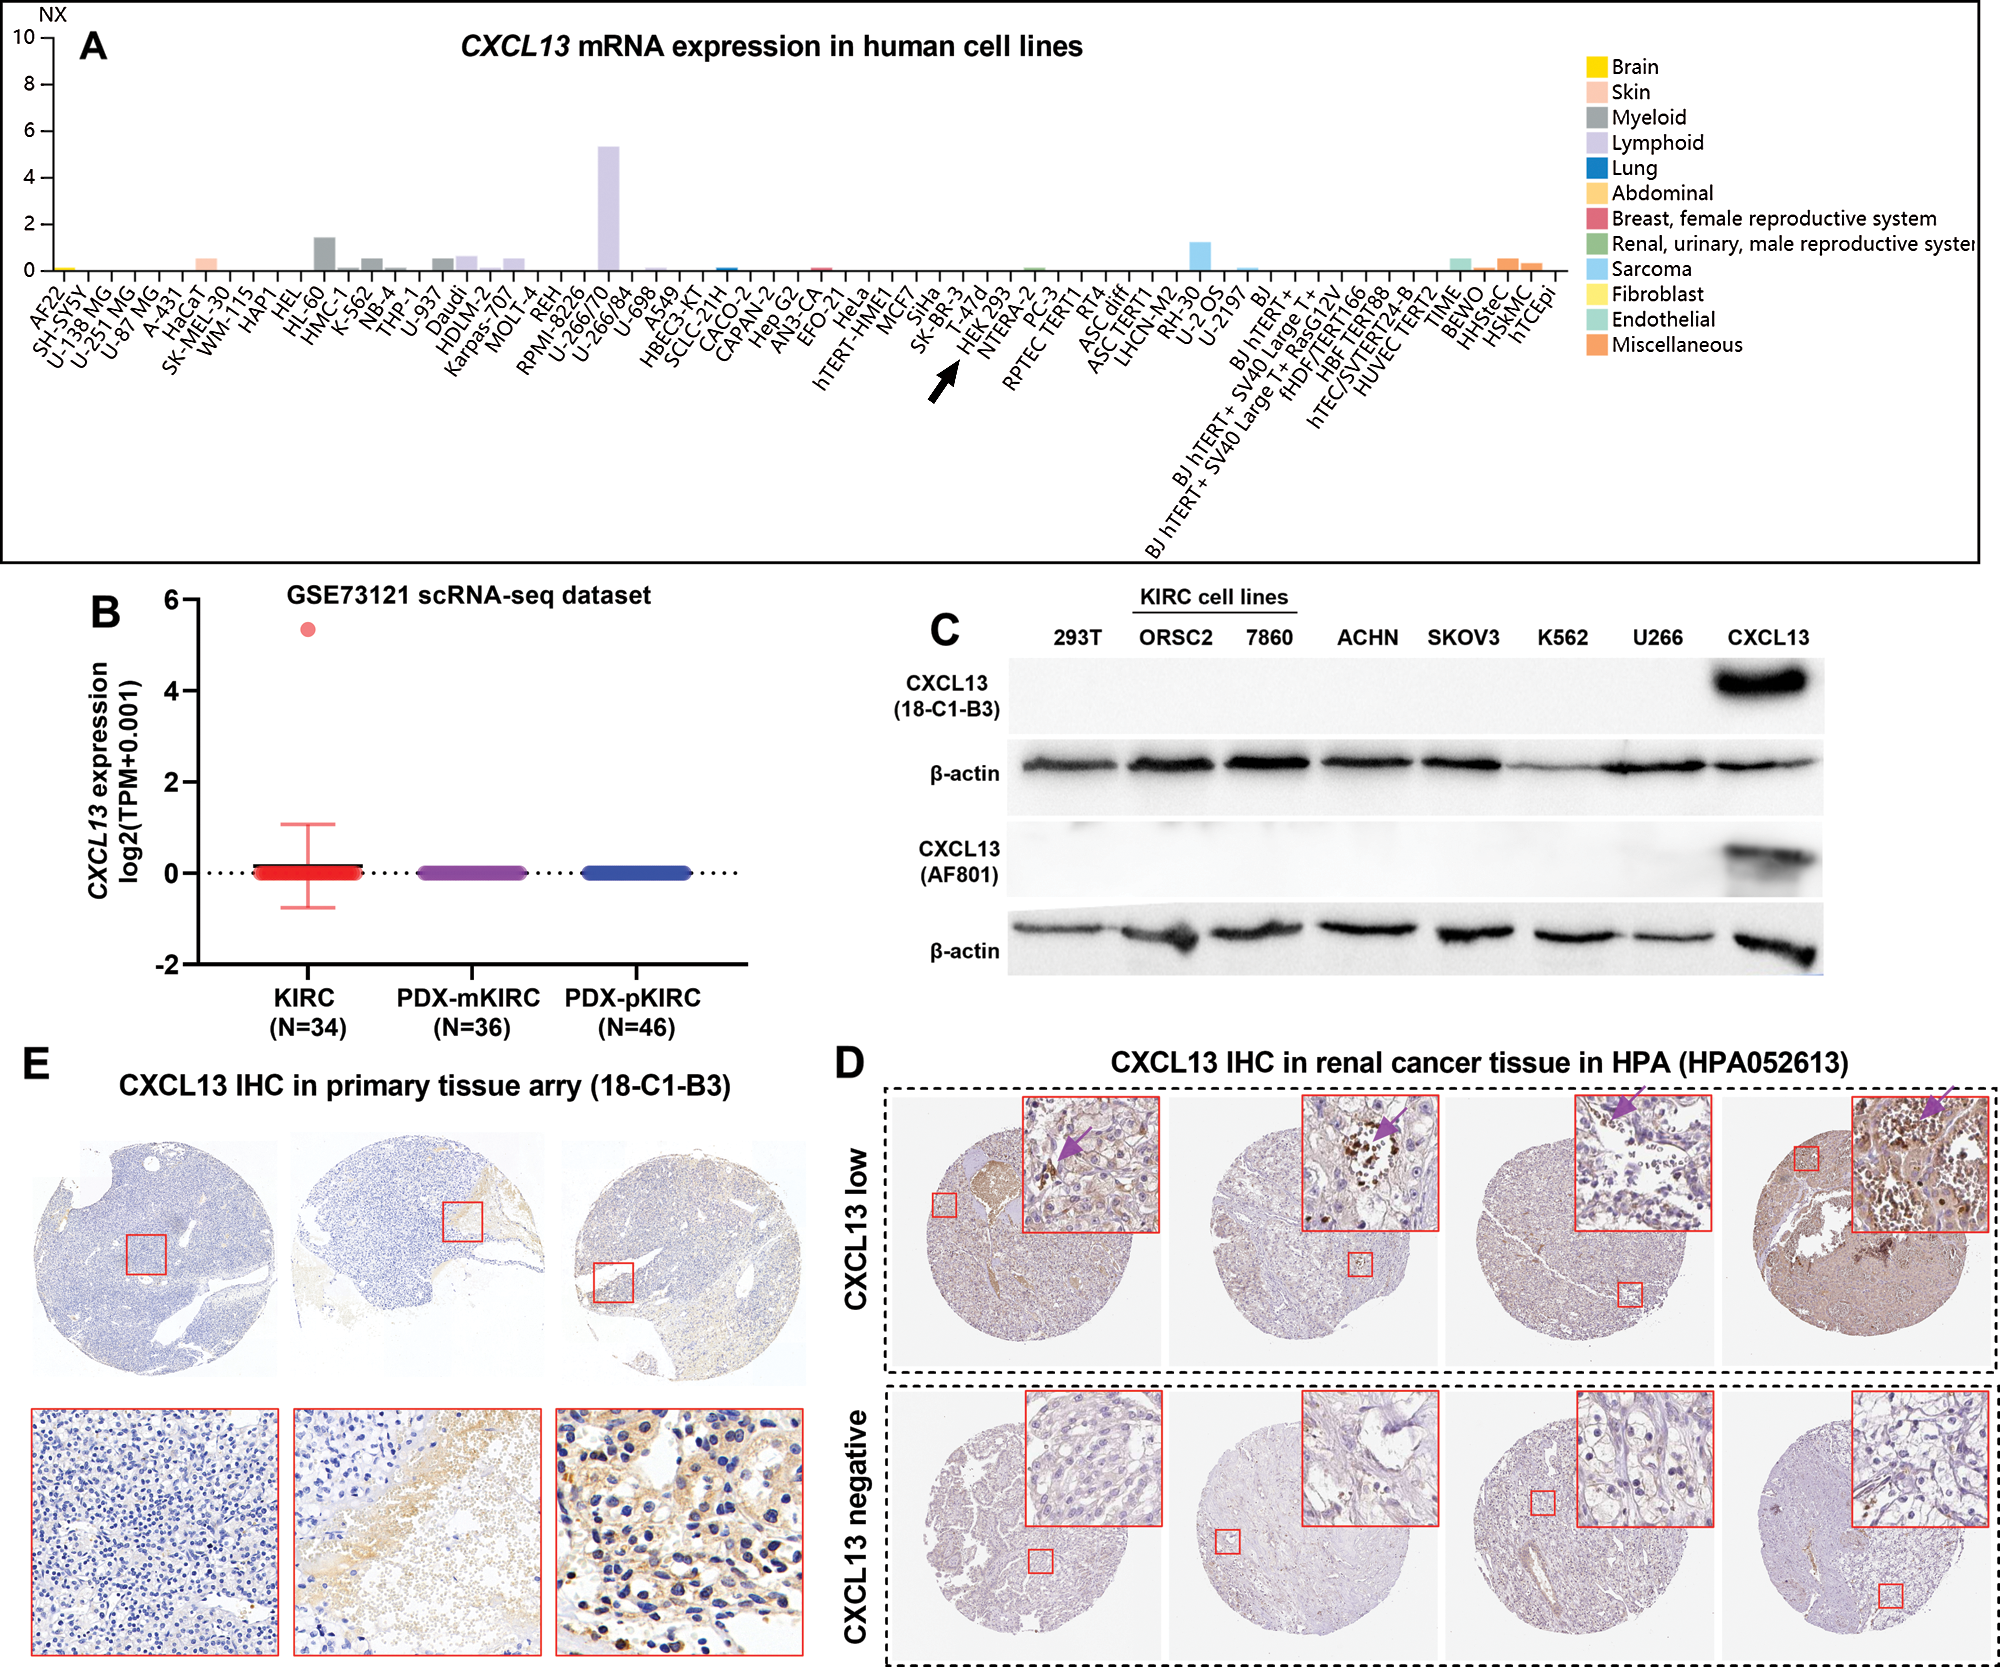
Figure 2: CXCL13 expression was mainly expressed by TIICs.
CXCL13 expression was correlated with multiple TIIC infiltrations
Since we confirmed that CXCL13 was expressed by TIICs, we then explored its association with the faction of TIICs in TCGA-KIRC. The fraction scores calculated by the CIBERSORT method was used. A total of 22 TIIC types were estimated using RNA-seq data from TCGA-KIRC (Fig. 3A). Then, we assessed the correlation between CXCL13 expression and the TIICs (Fig. 3A). By setting moderate correlation (|Pearson’s r| ≥ 0.4) as the cut-off, we found that CXCL13 expression was negatively correlated with activated dendritic cells and resting memory CD4+ T cells (Figs. 3A–3C) but was positively correlated with gamma delta (γδ) T cells (Figs. 3A and 3D). Then, we assessed the survival difference between patients with the highest and lowest quartile of these TIICs. No significant survival difference was observed between groups stratified by activated dendritic cells (Figs. 3E and 3H). In comparison, a higher fraction score of resting memory CD4+ T cells was associated with better PFS (p = 0.006) and DSS (p < 0.001) (Figs. 3F and 3I). In contrast, a higher γδ T cell fraction was associated with significantly worse PFS (p < 0.001) and DSS (p = 0.014) (Figs. 3G and 3J).
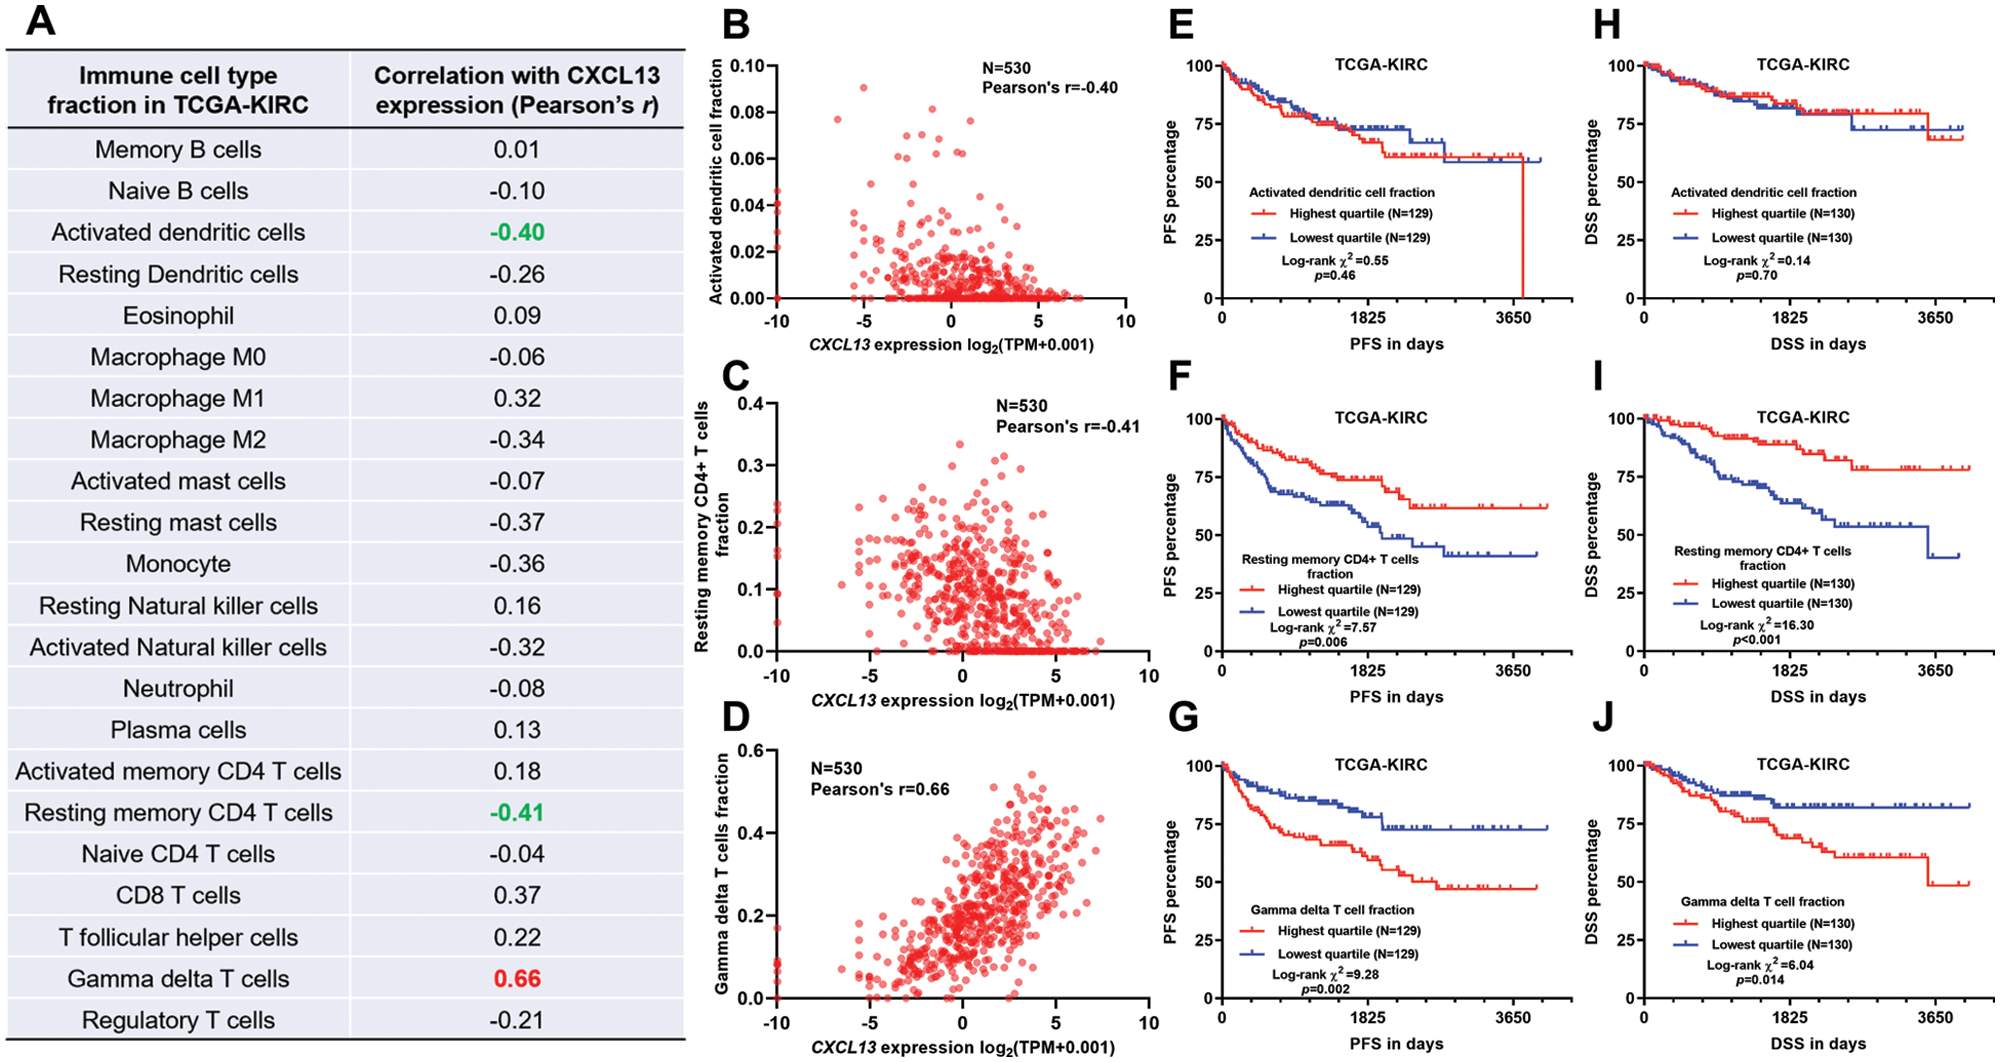
Figure 3: CXCL13 expression was correlated with multiple TIICs.
Promoter hypomethylation might contribute to CXCL13 upregulation in TIICs
Although CXCL13 dysregulation was confirmed in KIRC, the underlying mechanisms have not been explored yet. One recent study reported that CXCL13 might be transcriptionally silenced by CpG site methylation within its promoter (Ma et al., 2020). Therefore, we hypothesized that CpG site methylation might also influence CXCL13 expression in KIRC TME. Since we confirmed that CXCL13 was mainly expressed in TIICs in KIRC tissues, we infer that methylation 450k data in TCGA-KIRC could reflect CXCL13 DNA methylation profiles in TIICs. Therefore, we checked CXCL13 DNA methylation data in 309 KIRC tumors and 23 adj. N tissues with both RNA-seq and methylation data (Fig. 4A). Five CpG sites within the CXCL13 gene locus were included in the array, among which three sites were promoter-associated (cg16361705, cg17001652, and cg12020230) and two were gene-body associated (cg01134794 and cg06662476). Group comparison found four CpG sites (cg16361705, cg17001652, cg12020230, and cg01134794) were significantly hypomethylated in tumor tissues (Fig. 4B). Then, we generated plot charts to assess the correlation between CXCL13 expression and their methylation status (Figs. 4C–F). The methylation level of cg16361705 showed a nearly moderate negative correlation with CXCL13 expression (Pearson’s r = −0.38, p < 0.001, Fig. 4C).
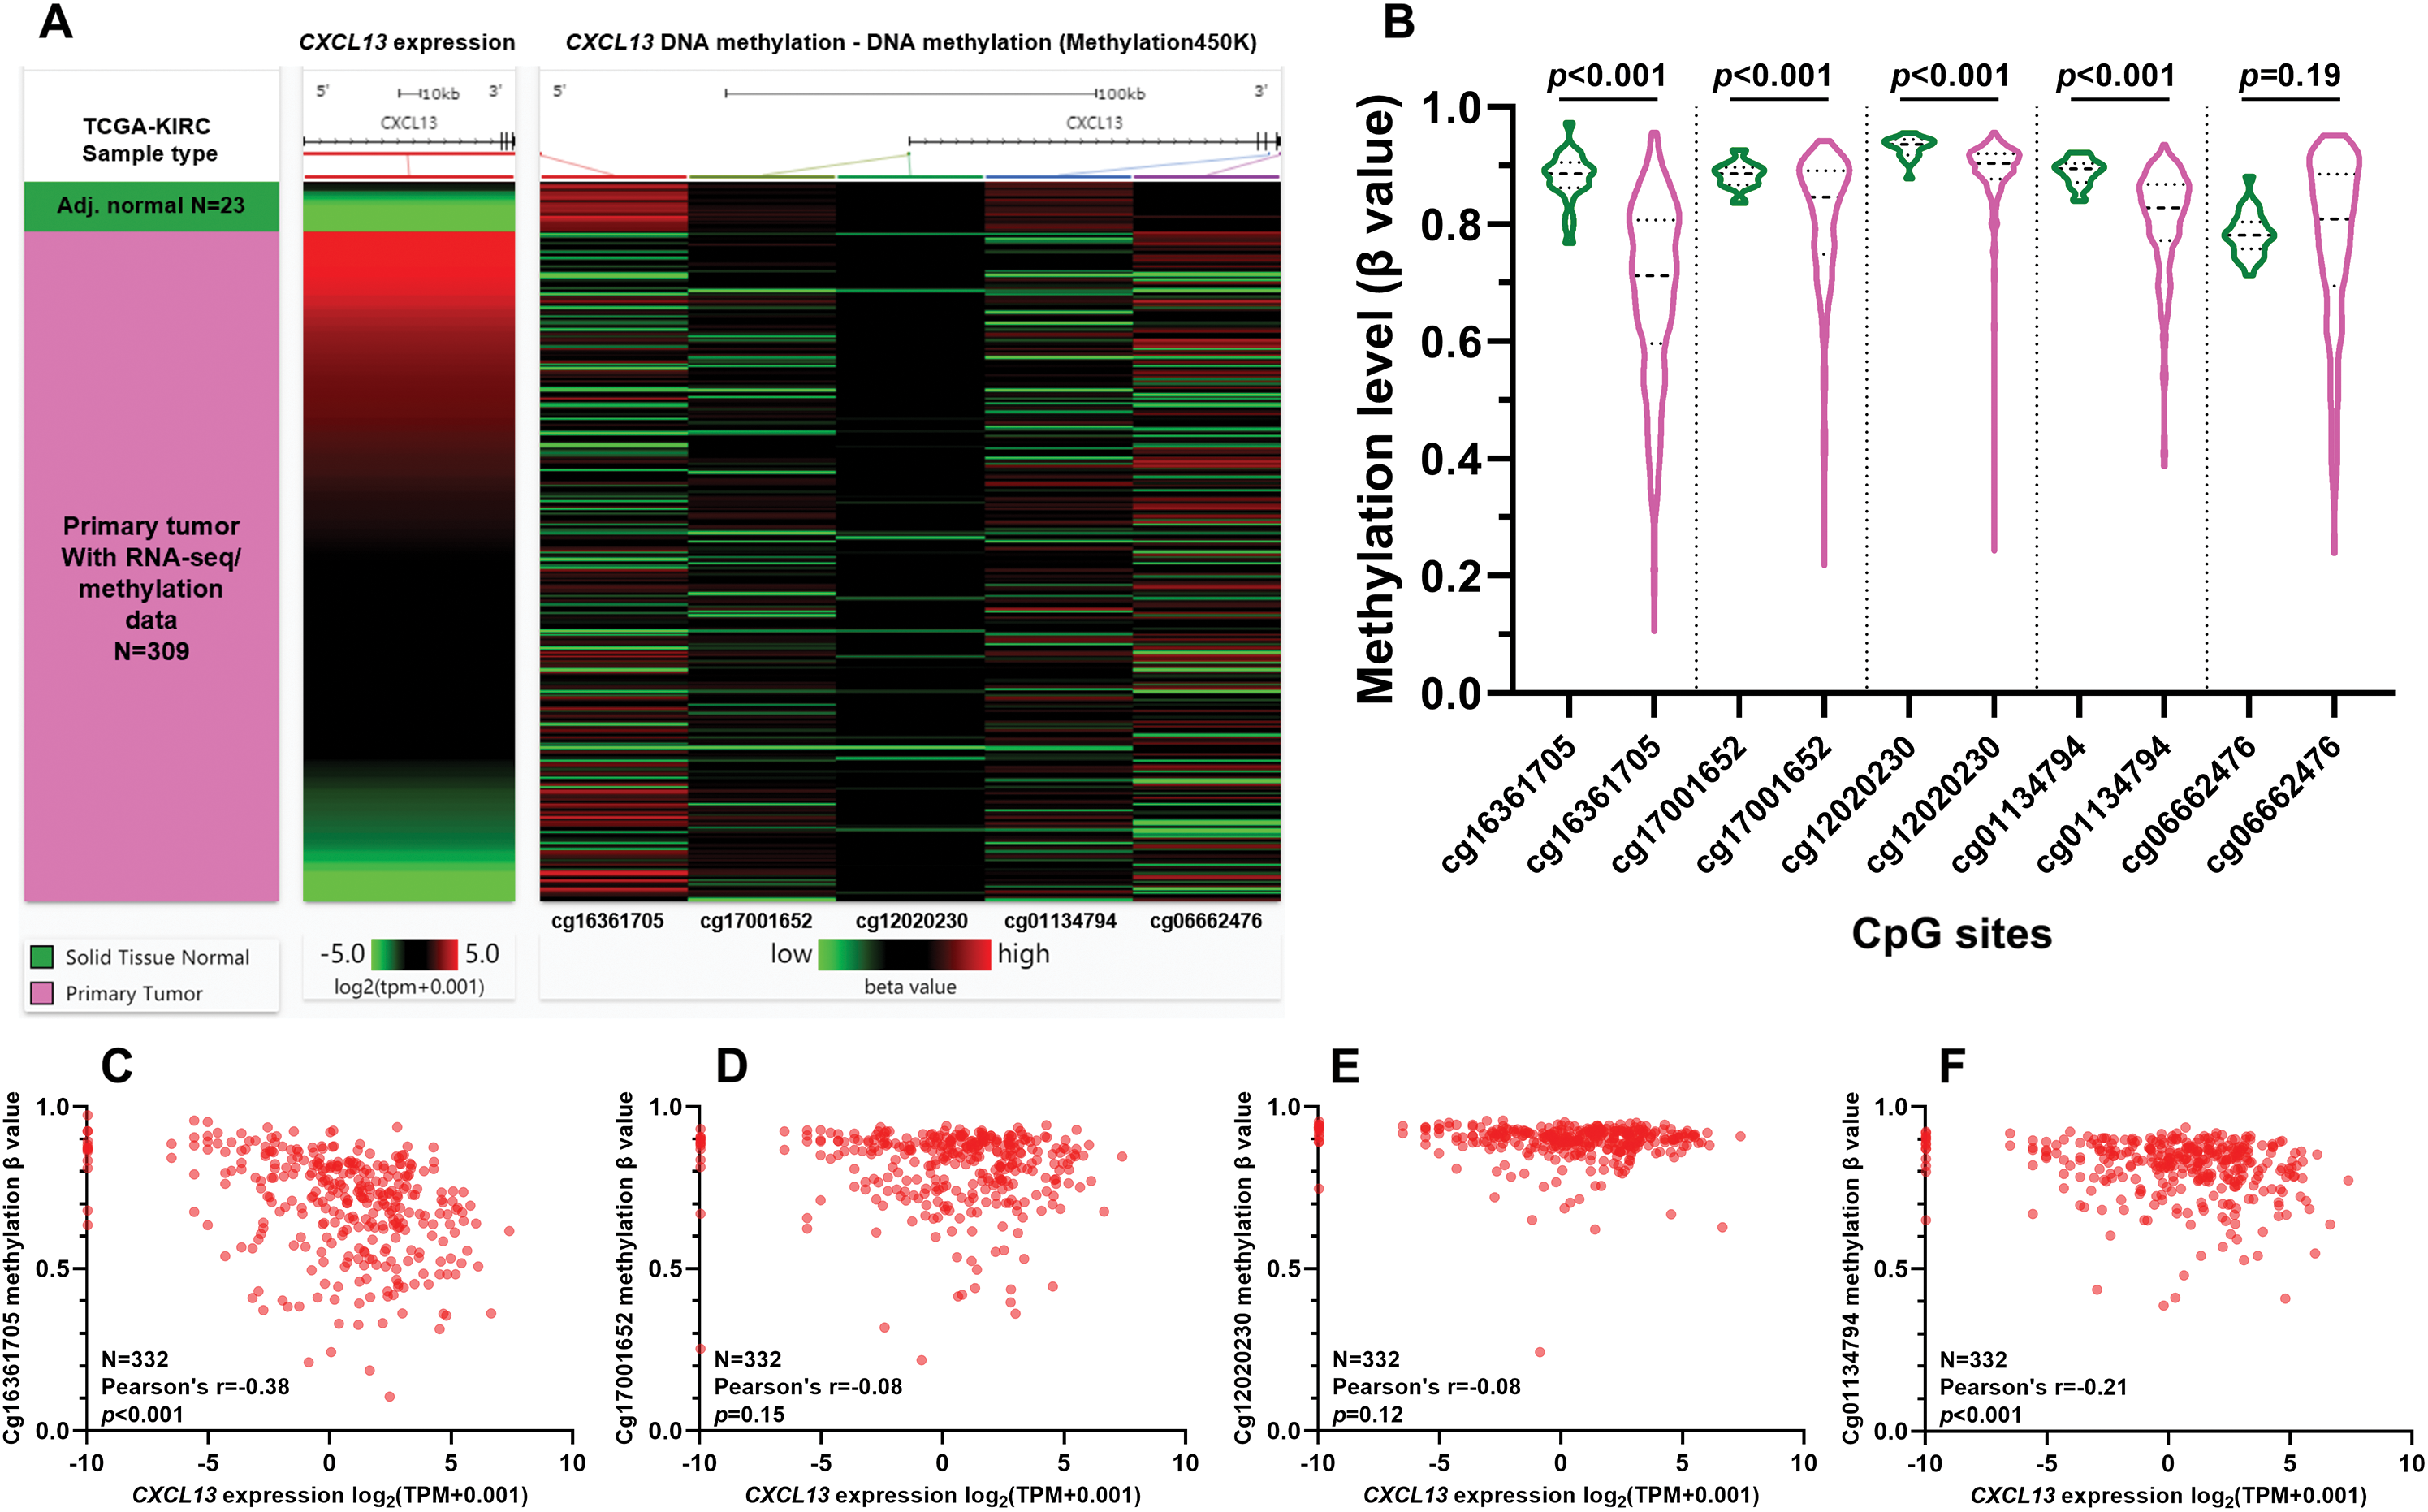
Figure 4: Promoter hypomethylation might contribute to CXCL13 upregulation in immune cells.
Although the CXCL13/CXCR5 axis has been demonstrated as an important tumor-promoting axis and may be a therapeutic target in KIRC (Xu et al., 2019; Zheng et al., 2018), the source of CXCL13 has not been clearly figured out. One reason for the controversial findings is the bulk RNA-seq data based on tumor tissues, which only provide the average expression signal of massive cells in TME. In this study, we systematically analyzed recent single-cell RNA-seq datasets and also generated a reliable CXCL13 monoclonal antibody to visualize its expression in TME. Our findings supported that CXCL13 might not be generated by KIRC tumor cells but was from TIICs in TME.
Via binding to CXCR5 on tumor cells, CXCL13 could augment the multiple tumor-promoting signalings, such as PI3K/Akt (Zhu et al., 2015), Raf/MEK/ERK (Xu et al., 2018), integrin 3/Src/FAK (El-Haibi et al., 2010) and DOCK2/Rac/JNK (El-Haibi et al., 2012). Besides, some recent studies suggest that the presence of CXCL13 may contribute to an immunosuppressive TME. In prostate cancer, CXCL13 recruits a subgroup of B cells expressing interleukin (IL)-10 and programmed death-ligand 1 (PD-L1) (Shalapour et al., 2015). It may recruit CD40+ myeloid-derived suppressor cells (MDSCs) to breast TME (Ding et al., 2015). Besides, in colon TME, CXCL13 secreted by HDC+ myeloid cells can recruit Foxp3+ Tregs (Chen et al., 2017).
In the current study, we revealed that in KIRC TME, CXCL13 expression was strongly and positively correlated with γδ T cell abundance. Besides, our survival analysis indicated that γδ T cell infiltration was associated with poor survival of KIRC. Early studies indicated that CXCL13 could be expressed by some subgroups of differentiated γδ T cells (Caccamo et al., 2012; Vermijlen et al., 2007). Based on their functions, γδ T cells can be divided into effector γδ T cells and regulatory γδ T cells (Zhao et al., 2018). The former subgroup exerts anti-tumor effects via their powerful lysing functions and promoting B-cell antibody secretion (Niu et al., 2015; Zhao et al., 2018), while the latter subgroup shows immunosuppressive and pro-tumor activities. γδ T cells can polarize into FOXP3+ γδ Treg, γδ T17 and Vδ1 γδ T cells, which have immunosuppressive effects. FOXP3+ γδ Tregs are able to suppress the proliferation of anti-CD3/anti-CD28 stimulated-peripheral blood mononuclear cells (PBMCs) (Casetti et al., 2009). γδ T17 cells can produce IL 17, which enhances angiogenesis (Silva-Santos, 2010) and supports the accumulation and expansion of MDSCs (Wu et al., 2014). One recent study reported that a subgroup of CD73+ Vδ1 T cells that represents around 20% of the whole Vδ1 population can produce IL8, IL-10, and adenosine and inhibit αβ T cell proliferation (Chabab et al., 2020). According to these findings, we infer that some subgroups of γδ T cells are the dominant source of CXCL13 in KIRC TME. However, the exact cell subset is worthy of future exploration.
In TCGA-KIRC, although the methylation 450k array data was obtained from bulk tumor tissue samples, considering the restricted expression of CXCL13 in TIICs, we postulated that the methylation data could reflect the methylation level of CXCL13 in TIICs. Results showed that promoter hypomethylation is common in TIICs. Among the four CpG sites assessed, we hypothesized that the methylation level of cg16361705 might play an important role in modulating CXCL13 transcription. However, future site-specific methylation and demethylation studies based on the CRISPR-Cas9 tool should be conducted for validation in the future.
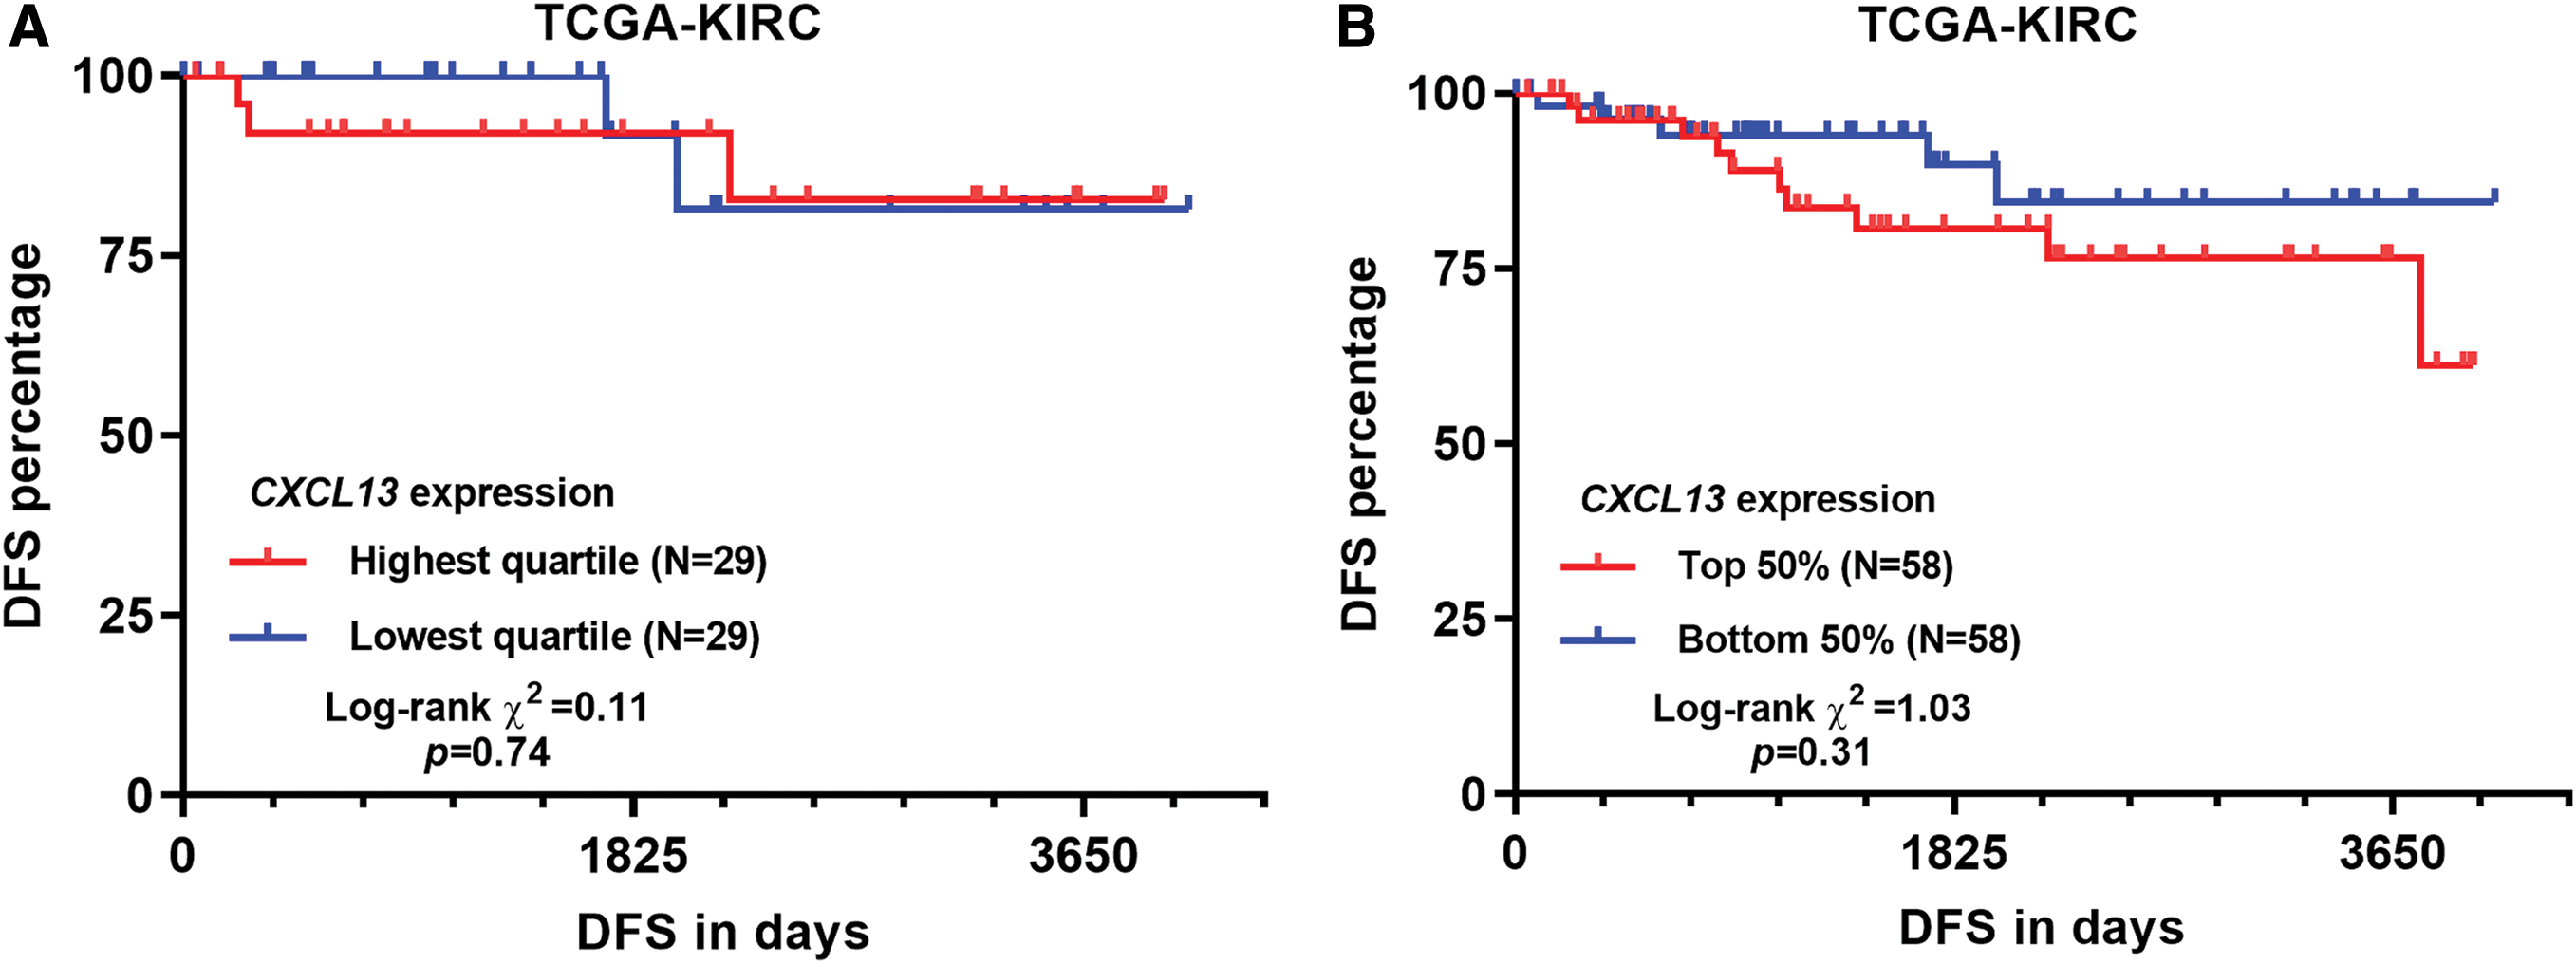
SUPPLEMENTARY Figure 1: DFS curves by different CXCL13 separation in TCGA-KIRC.
Acknowledgement: This study was funded by the National Science and Technology Major Project for Major New Drug Innovation and Development (2017ZX09302010).
Availability of Data and Materials: The datasets analyzed during the current study are available from the corresponding author on reasonable request.
Funding Statement: This study was funded by the National Science and Technology Major Project for Major New Drug Innovation and Development (2017ZX09302010).
Conflicts of Interest: The authors declare that they have no conflicts of interest to report regarding the present study.
Biswas S, Sengupta S, Roy Chowdhury S, Jana S, Mandal G, Mandal PK, Saha N, Malhotra V, Gupta A, Kuprash DV, Bhattacharyya A. (2014). CXCL13-CXCR5 co-expression regulates epithelial to mesenchymal transition of breast cancer cells during lymph node metastasis. Breast Cancer Research and Treatment 143: 265–276. DOI 10.1007/s10549-013-2811-8. [Google Scholar] [CrossRef]
Caccamo N, Todaro M, La Manna MP, Sireci G, Stassi G, Dieli F. (2012). IL-21 regulates the differentiation of a human gammadelta T cell subset equipped with B cell helper activity. PLoS One 7: e41940. DOI 10.1371/journal.pone.0041940. [Google Scholar] [CrossRef]
Cao Y, Zhu J, Jia P, Zhao Z. (2017). scRNASeqDB: a database for RNA-seq based gene expression profiles in human single cells. Genes 8: 368. DOI 10.3390/genes8120368. [Google Scholar] [CrossRef]
Casetti R, Agrati C, Wallace M, Sacchi A, Martini F, Martino A, Rinaldi A, Malkovsky M. (2009). Cutting edge: TGF-β1 and IL-15 induce FOXP3+ γδ regulatory T cells in the presence of antigen stimulation. Journal of Immunology 183: 3574–3577. DOI 10.4049/jimmunol.0901334. [Google Scholar] [CrossRef]
Chabab G, Barjon C, Abdellaoui N, Salvador-Prince L, Dejou C, Michaud HA, Boissiere-Michot F, Lopez-Crapez E, Jacot W, Pourquier D, Bonnefoy N, Lafont V. (2020). Identification of a regulatory Vδ1 gamma delta T cell subpopulation expressing CD73 in human breast cancer. Journal of Leukocyte Biology 107: 1057–1067. DOI 10.1002/JLB.3MA0420-278RR. [Google Scholar] [CrossRef]
Charoentong P, Finotello F, Angelova M, Mayer C, Efremova M, Rieder D, Hackl H, Trajanoski Z. (2017). Pan-cancer immunogenomic analyses reveal genotype-immunophenotype relationships and predictors of response to checkpoint blockade. Cell Reports 18: 248–262. DOI 10.1016/j.celrep.2016.12.019. [Google Scholar] [CrossRef]
Chen X, Takemoto Y, Deng H, Middelhoff M, Friedman RA, Chu TH, Churchill MJ, Ma Y, Nagar KK, Tailor YH, Mukherjee S, Wang TC. (2017). Histidine decarboxylase (HDC)-expressing granulocytic myeloid cells induce and recruit Foxp3+ regulatory T cells in murine colon cancer. OncoImmunology 6: e1290034. DOI 10.1080/2162402X.2017.1290034. [Google Scholar] [CrossRef]
Ding Y, Shen J, Zhang G, Chen X, Wu J, Chen W. (2015). CD40 controls CXCR5-induced recruitment of myeloid-derived suppressor cells to gastric cancer. Oncotarget 6: 38901–38911. DOI 10.18632/oncotarget.5644. [Google Scholar] [CrossRef]
El-Haibi CP, Singh R, Gupta P, Sharma PK, Greenleaf KN, Singh S, Lillard Jr JW. (2012). Antibody microarray analysis of signaling networks regulated by Cxcl13 and Cxcr5 in prostate cancer. Journal of Proteomics & Bioinformatics 5: 177–184. [Google Scholar]
El-Haibi CP, Sharma PK, Singh R, Johnson PR, Suttles J, Singh S, Lillard JWJr. (2010). PI3Kp110-, Src-, FAK-dependent and DOCK2-independent migration and invasion of CXCL13-stimulated prostate cancer cells. Molecular Cancer 9: 1710. DOI 10.1186/1476-4598-9-85. [Google Scholar] [CrossRef]
Franzen O, Gan LM, Bjorkegren JLM. (2019). PanglaoDB: a web server for exploration of mouse and human single-cell RNA sequencing data. Database 2019: 610. DOI 10.1093/database/baz046. [Google Scholar] [CrossRef]
Gu-Trantien C, Migliori E, Buisseret L, De Wind A, Brohee S, Garaud S, Noel G, Dang Chi VL, Lodewyckx JN, Naveaux C, Duvillier H, Goriely S, Larsimont D, Willard-Gallo K. (2017). CXCL13-producing TFH cells link immune suppression and adaptive memory in human breast cancer. JCI Insight 2: e91487. DOI 10.1172/jci.insight.91487. [Google Scholar] [CrossRef]
Irshad S, Flores-Borja F, Lawler K, Monypenny J, Evans R, Male V, Gordon P, Cheung A, Gazinska P, Noor F, Wong F, Grigoriadis A, Fruhwirth GO, Barber PR, Woodman N, Patel D, Rodriguez-Justo M, Owen J, Martin SG, Pinder SE, Gillett CE, Poland SP, Ameer-Beg S, McCaughan F, Carlin LM, Hasan U, Withers DR, Lane P, Vojnovic B, Quezada SA, Ellis P, Tutt ANJ, Ng T (2017). RORγt+ innate lymphoid cells promote lymph node metastasis of breast cancers. Cancer Research 77: 1083–1096. [Google Scholar]
Hussain M, Adah D, Tariq M, Lu Y, Zhang J, Liu J. (2019). CXCL13/CXCR5 signaling axis in cancer. Life Sciences 227: 175–186. DOI 10.1016/j.lfs.2019.04.053. [Google Scholar] [CrossRef]
Kim KT, Lee HW, Lee HO, Song HJ, Jeong Da E, Shin S, Kim H, Shin Y, Nam DH, Jeong BC, Kirsch DG, Joo KM, Park WY. (2016). Application of single-cell RNA sequencing in optimizing a combinatorial therapeutic strategy in metastatic renal cell carcinoma. Genome Biology 17: 992. DOI 10.1186/s13059-016-0945-9. [Google Scholar] [CrossRef]
Liu J, Lichtenberg T, Hoadley KA, Poisson LM, Lazar AJ, Cherniack AD, Kovatich AJ, Benz CC, Levine DA, Lee AV, Omberg L, Wolf DM, Shriver CD, Thorsson V, Cancer Genome Atlas Research N, Hu H. (2018). An integrated TCGA pan-cancer clinical data resource to drive high-quality survival outcome analytics. Cell 173: 400–416. [Google Scholar]
Ma D, Fan SB, Hua N, Li GH, Chang Q, Liu X. (2020). Hypermethylation of single CpG dinucleotides at the promoter of CXCL13 gene promoting cell migration in cervical cancer. Current Cancer Drug Targets 20: 355–363. DOI 10.2174/1568009620666200102123635. [Google Scholar] [CrossRef]
Newman AM, Steen CB, Liu CL, Gentles AJ, Chaudhuri AA, Scherer F, Khodadoust MS, Esfahani MS, Luca BA, Steiner D, Diehn M, Alizadeh AA. (2019). Determining cell type abundance and expression from bulk tissues with digital cytometry. Nature Biotechnology 37: 773–782. DOI 10.1038/s41587-019-0114-2. [Google Scholar] [CrossRef]
Niu C, Jin H, Li M, Xu J, Xu D, Hu J, He H, Li W, Cui J. (2015). In vitro analysis of the proliferative capacity and cytotoxic effects of ex vivo induced natural killer cells, cytokine-induced killer cells, and gamma-delta T cells. BMC Immunology 16: 1307. DOI 10.1186/s12865-015-0124-x. [Google Scholar] [CrossRef]
Ohmatsu H, Sugaya M, Kadono T, Tamaki K. (2007). CXCL13 and CCL21 are expressed in ectopic lymphoid follicles in cutaneous lymphoproliferative disorders. Journal of Investigative Dermatology 127: 2466–2468. DOI 10.1038/sj.jid.5700873. [Google Scholar] [CrossRef]
Razis E, Kalogeras KT, Kotsantis I, Koliou GA, Manousou K, Wirtz R, Veltrup E, Patsea H, Poulakaki N, Dionysopoulos D, Pervana S, Gogas H, Koutras A, Pentheroudakis G, Christodoulou C, Linardou H, Pavlakis K, Koletsa T, Pectasides D, Zagouri F, Fountzilas G. (2020). The role of CXCL13 and CXCL9 in early breast cancer. Clinical Breast Cancer 20: e36–e53. DOI 10.1016/j.clbc.2019.08.008. [Google Scholar] [CrossRef]
Shalapour S, Font-Burgada J, Di Caro G, Zhong Z, Sanchez-Lopez E, Dhar D, Willimsky G, Ammirante M, Strasner A, Hansel DE, Jamieson C, Kane CJ, Klatte T, Birner P, Kenner L, Karin M. (2015). Immunosuppressive plasma cells impede T-cell-dependent immunogenic chemotherapy. Nature 521: 94–98. DOI 10.1038/nature14395. [Google Scholar] [CrossRef]
Silva-Santos B. (2010). Promoting angiogenesis within the tumor microenvironment: The secret life of murine lymphoid IL-17-producing γδ T cells. European Journal of Immunology 40: 1873–1876. DOI 10.1002/eji.201040707. [Google Scholar] [CrossRef]
Uhlen M, Fagerberg L, Hallstrom BM, Lindskog C, Oksvold P, Mardinoglu A, Sivertsson A, Kampf C, Sjostedt E, Asplund A, Olsson I, Edlund K, Lundberg E, Navani S, Szigyarto CA, Odeberg J, Djureinovic D, Takanen JO, Hober S, Alm T, Edqvist PH, Berling H, Tegel H, Mulder J, Rockberg J, Nilsson P, Schwenk JM, Hamsten M, Von Feilitzen K, Forsberg M, Persson L, Johansson F, Zwahlen M, Von Heijne G, Nielsen J, Ponten F. (2015). Proteomics. Tissue-based map of the human proteome. Science 347: 1260419. [Google Scholar]
Uhlen M, Zhang C, Lee S, Sjostedt E, Fagerberg L, Bidkhori G, Benfeitas R, Arif M, Liu Z, Edfors F, Sanli K, Von Feilitzen K, Oksvold P, Lundberg E, Hober S, Nilsson P, Mattsson J, Schwenk JM, Brunnstrom H, Glimelius B, Sjoblom T, Edqvist PH, Djureinovic D, Micke P, Lindskog C, Mardinoglu A, Ponten F. (2017). A pathology atlas of the human cancer transcriptome. Science 357: 6352. DOI 10.1126/science.aan2507. [Google Scholar] [CrossRef]
Vermijlen D, Ellis P, Langford C, Klein A, Engel R, Willimann K, Jomaa H, Hayday AC, Eberl M. (2007). Distinct cytokine-driven responses of activated blood γδ T cells: Insights into unconventional T cell pleiotropy. Journal of Immunology 178: 4304–4314. DOI 10.4049/jimmunol.178.7.4304. [Google Scholar] [CrossRef]
Wei Y, Lin C, Li H, Xu Z, Wang J, Li R, Liu H, Zhang H, He H, Xu J. (2018). CXCL13 expression is prognostic and predictive for postoperative adjuvant chemotherapy benefit in patients with gastric cancer. Cancer Immunology, Immunotherapy 67: 261–269. DOI 10.1007/s00262-017-2083-y. [Google Scholar] [CrossRef]
Workel HH, Lubbers JM, Arnold R, Prins TM, Van Der Vlies P, De Lange K, Bosse T, Van Gool IC, Eggink FA, Wouters MCA, Komdeur FL, Van Der Slikke EC, Creutzberg CL, Kol A, Plat A, Glaire M, Church DN, Nijman HW, De Bruyn M. (2019). A transcriptionally distinct CXCL13+CD103+CD8+ T-cell population is associated with B-cell recruitment and neoantigen load in human cancer. Cancer Immunology Research 7: 784–796. DOI 10.1158/2326-6066.CIR-18-0517. [Google Scholar] [CrossRef]
Wu P, Wu D, Ni C, Ye J, Chen W, Hu G, Wang Z, Wang C, Zhang Z, Xia W, Chen Z, Wang K, Zhang T, Xu J, Han Y, Zhang T, Wu X, Wang J, Gong W, Zheng S, Qiu F, Yan J, Huang J. (2014). gammadeltaT17 cells promote the accumulation and expansion of myeloid-derived suppressor cells in human colorectal cancer. Immunity 40: 785–800. DOI 10.1016/j.immuni.2014.03.013. [Google Scholar] [CrossRef]
Xu L, Liang Z, Li S, Ma J. (2018). Signaling via the CXCR5/ERK pathway is mediated by CXCL13 in mice with breast cancer. Oncology Letters 15: 9293–9298. [Google Scholar]
Xu T, Ruan H, Song Z, Cao Q, Wang K, Bao L, Liu D, Tong J, Yang H, Chen K, Zhang X. (2019). Identification of CXCL13 as a potential biomarker in clear cell renal cell carcinoma via comprehensive bioinformatics analysis. Biomedicine & Pharmacotherapy 118: 109264. DOI 10.1016/j.biopha.2019.109264. [Google Scholar] [CrossRef]
Zhao Y, Niu C, Cui J. (2018). Gamma-delta (γδ) T cells: friend or foe in cancer development? Journal of Translational Medicine 16: 572. DOI 10.1186/s12967-017-1378-2. [Google Scholar] [CrossRef]
Zheng Z, Cai Y, Chen H, Chen Z, Zhu D, Zhong Q, Xie W. (2018). CXCL13/CXCR5 axis predicts poor prognosis and promotes progression through PI3K/AKT/mTOR pathway in clear cell renal cell carcinoma. Frontiers in Oncology 8: 894. DOI 10.3389/fonc.2018.00682. [Google Scholar] [CrossRef]
Zhu Z, Zhang X, Guo H, Fu L, Pan G, Sun Y. (2015). CXCL13-CXCR5 axis promotes the growth and invasion of colon cancer cells via PI3K/AKT pathway. Molecular and Cellular Biochemistry 400: 287–295. DOI 10.1007/s11010-014-2285-y. [Google Scholar] [CrossRef]
 | This work is licensed under a Creative Commons Attribution 4.0 International License, which permits unrestricted use, distribution, and reproduction in any medium, provided the original work is properly cited. |