
 Submit a Paper
 Propose a Special lssue
 Open Access
ARTICLE

Monitoring Vegetation Cover Changes in a Rapidly Urbanizing Region: A Case Study in Da Nang City, Vietnam
1 Innovation Startup Support Center, Hong Duc University, Thanh Hoa, 44000, Vietnam
2 Institute of Earth Sciences, Southern Federal University, Rostov-on-Don, 344090, Russia
* Corresponding Author: Bui Bao Thien. Email:
Revue Internationale de Géomatique 2025, 34, 151-168. https://doi.org/10.32604/rig.2025.062829
Received 28 December 2024; Accepted 24 February 2025; Issue published 21 March 2025
 View Full Text
 Download PDF
Abstract
Vegetation is crucial to ecosystems, thus, detecting and assessing changes in vegetation cover are receiving increasing attention. In this study, we combine remote sensing data and geographic information systems to assess vegetation cover changes in Da Nang city, Vietnam, between 1988 and 2022. Remote sensing images for the years 1988, 2000, and 2010 were obtained from Landsat 5-TM satellite data, and imagery for 2022 was obtained from Landsat 9-OLI/TIRS satellite data. In each satellite scene, we used supervised classification and spectral indices (NDWI—Normalized Difference Water Index, NDVI—Normalized Difference Vegetation Index, and SAVI—Soil Adjusted Vegetation Index) to classify land cover and assess vegetation cover. The land cover analysis revealed a significant decrease in vegetation cover and a significant increase in built-up land. The built-up land area increase of 120.12 km2 (12.25%) negatively impacted the area of vegetation, causing this land cover class to decrease by 97.69 km2 (9.96%) in 2022 compared to 1988. Overall, NDVI provides better estimates of vegetation cover variation than SAVI. The findings of this study can support planners in developing appropriate strategies to maintain ecological balance and prevent vegetation loss.Keywords
The distribution and structure of vegetation are key components in the function of terrestrial ecosystems throughout the world and play an important role in climate regulation, water exchange for carbon energy, and soil and water conservation [1–4]. Changes in vegetation will thus have a significant impact on the ecological environment. Vegetation changes can be driven by a variety of factors including climate change, natural disasters, and other natural processes, as well as anthropogenic factors such as land use change [3–5].
Land cover is often used to refer to the physical features of the Earth’s surface, including the distribution of vegetation, water, soil, and other surface features, including features created only by human activity such as settlements [6]. Land cover changes are also a major contributor to biodiversity loss; these changes are often associated with anthropogenic activities such as deforestation, population growth, industrialization, and urbanization [7]. Although land use-driven changes in land cover do not necessarily lead to land degradation, they are nonetheless one of the most important drivers of global change and widely affect both geographical and natural ecosystems [8–11]. Therefore, information about land cover, vegetation, and their changes is crucial for natural resource management, urban planning, and assessing and mitigating natural hazards.
Currently, remote sensing data in the form of satellite images, combined with geographic information systems (GIS), have been widely applied and recognized as a powerful tool for detecting changes in land cover [12–14]. Remote sensing data can be used to analyze changes in land cover to monitor urban areas, soil quality, environments, and ecology at different spatial scales [15–19]. Therefore, in this study, we detect and monitor changes in vegetation cover and other cover classes using freely available remote sensing tools and techniques and apply different indicators to create vegetation cover maps. The Normalized Disparity Water Index (NDWI) is commonly used to explain water availability, using the green and near-infrared bands of multispectral satellite images [18]. Similarly, the Normalized Difference Vegetation Index (NDVI) and the Soil Adjusted Vegetation Index (SAVI) are also useful for monitoring and assessing vegetation and are calculated using red and near-infrared bands—higher NDVI values generally represent healthier vegetation with a higher photosynthetic capacity [20].
Land use and land cover (LULC) changes, particularly those affecting vegetation dynamics, have been extensively studied worldwide, offering valuable insights into their ecological and socio-economic impacts. For instance, restoration efforts in the Loess Plateau, China, have demonstrated how ecological engineering measures can reverse land degradation by promoting vegetation recovery [2]. Similarly, in the Upper White Nile River Basin, the combined effects of climate change and human activities have significantly influenced vegetation patterns [4]. In tropical and subtropical regions, such as the Haihe River Basin in China and the East African Highlands, vegetation dynamics are shaped by a mix of climate variability, agricultural practices, and urbanization [5]. Agricultural land use changes, in particular, play a crucial role in altering vegetation cover. For example, in Dhaka, Bangladesh, rapid urban expansion has transformed agricultural lands into built-up areas, leading to notable vegetation loss [7]. These global examples provide a broader context for understanding regional challenges, such as in Vietnam, where shifts in farming systems, deforestation, and urbanization have resulted in significant transformations of land cover. Highlighting these cases underscores the need to study LULC changes comprehensively to inform sustainable land management and conservation strategies.
Given the current research in the area of interest, the present work aims to use remote sensing data to perform a detailed analysis of land cover and assess vegetation changes in Da Nang city, Vietnam, in the period from 1988 to 2022. To date, no previous studies have performed a detailed analysis of vegetation changes in this area. Thus, in this work, we aim to (1) detect and classify different types of LULC in the study area from 1988 to 2022, (2) determine vegetation cover from 1988 to 2022 using vegetation indices, and (3) analyze temporal and spatial changes in vegetation cover.
Da Nang is a centrally governed city situated in the South Central Coast region of Vietnam. It holds a strategic role within the Central Key Economic Region due to its central geographical location in Vietnam and its significance in socio-economic development and national defense/security in both the Central Highlands and the country as a whole. As a coastal city, Da Nang serves as a major transportation hub, integrating road, rail, sea, and air networks. With continuous investments in infrastructure, environmental improvements, and social security initiatives, Da Nang has earned the reputation of being “the most livable city in Vietnam”.
The total area of Da Nang spans 1285.4 km2, comprising seven mainland districts and one island district (Hoang Sa). This study focuses on the seven mainland districts, covering an area of 980.4 km2, located between 15°15′ and 16°40′ North latitude and 107°17′ and 108°20′ East longitude (Fig. 1). The study area features diverse natural landscapes, including seas, peninsulas, bays, hills, rivers, streams, and plains, which are centrally distributed within the city, fostering its economic growth and tourism development. Da Nang experiences a typical tropical monsoon climate characterized by high temperatures and limited variation. The climate features two distinct seasons: a rainy season from September to December and a dry season from January to August. Occasional mild and brief winter cold spells may occur. The annual average temperature is approximately 25.8°C, with the hottest months being June, July, and August (average 28°C–30°C) and the coolest months being December, January, and February (average 18°C–23°C). The city receives an average annual rainfall of 2153 mm and approximately 2182 h of sunshine annually. Da Nang is also subject to one to two storms or tropical depressions each year, often causing significant damage to the city.
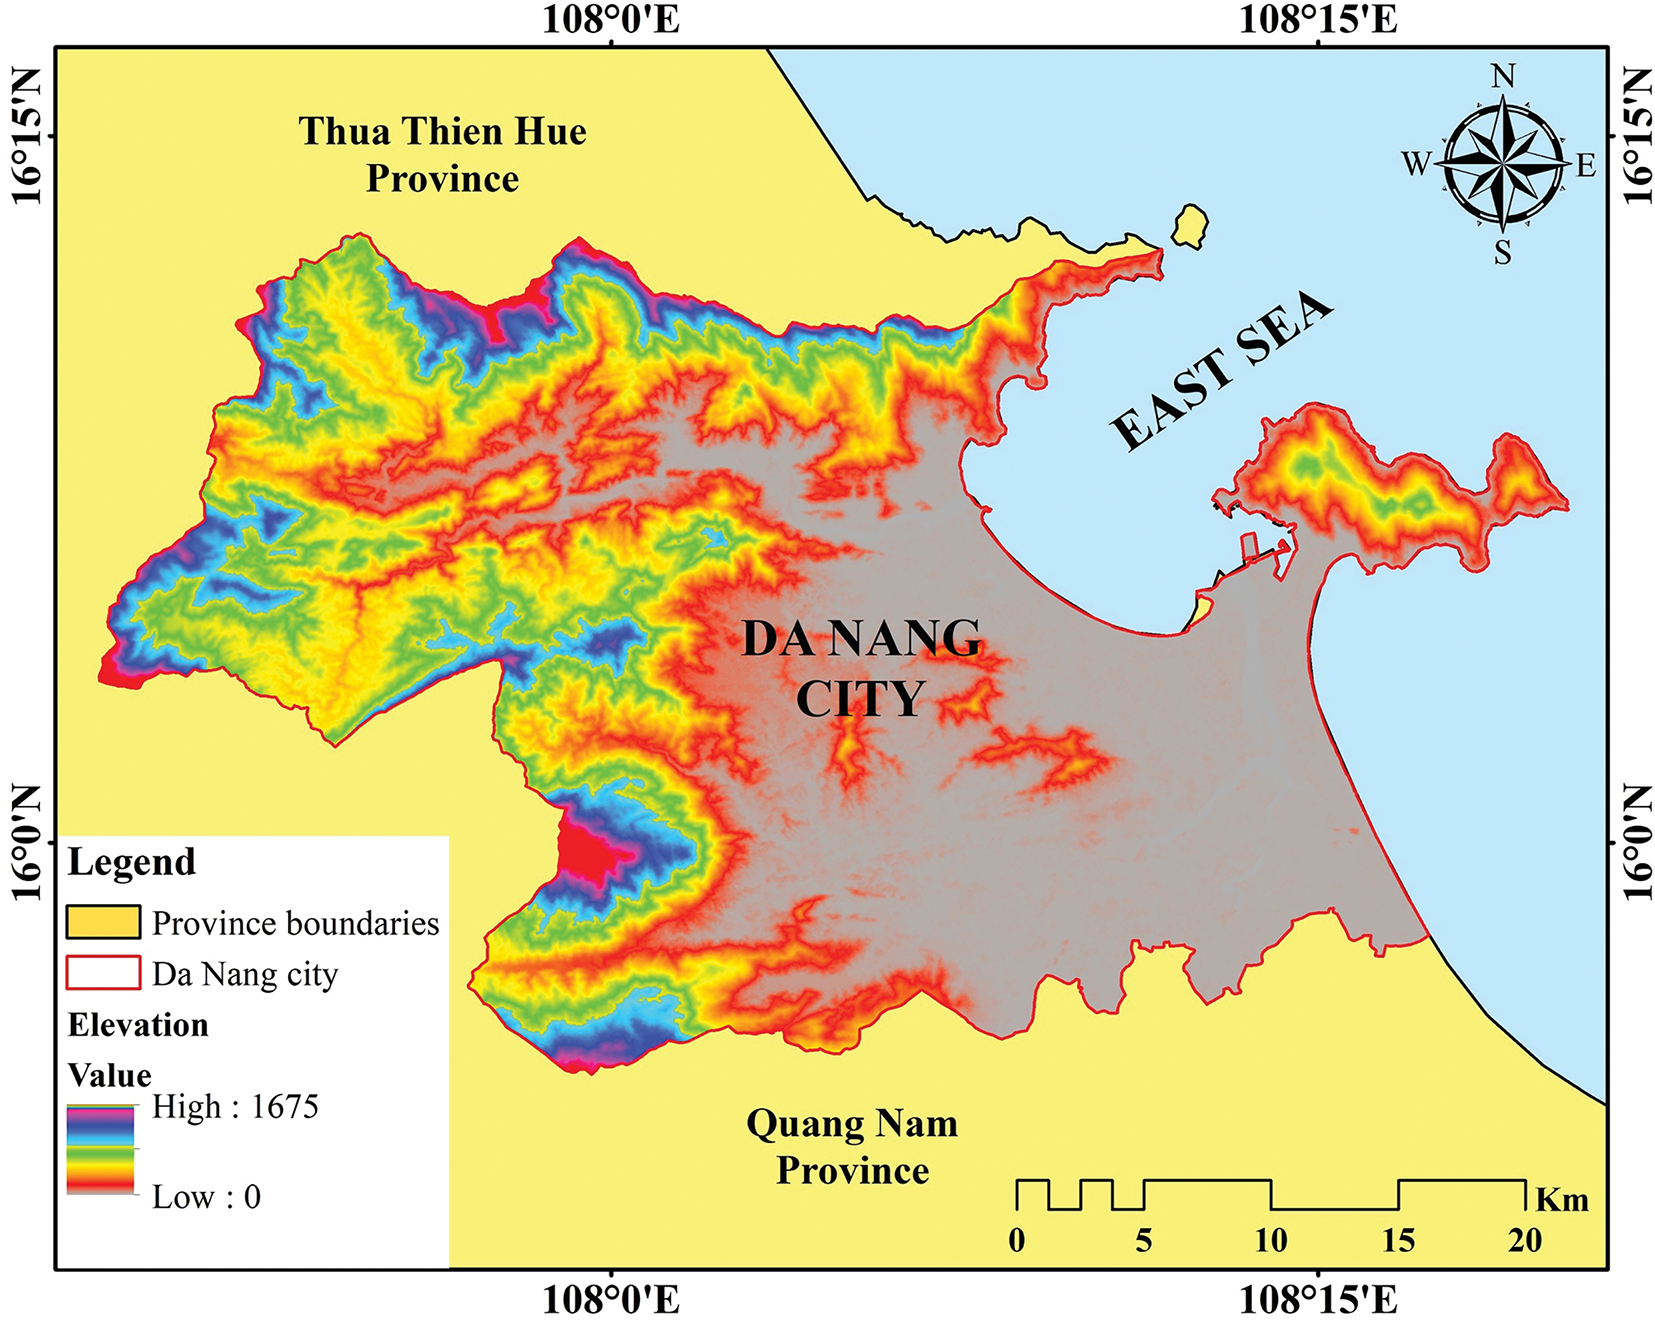
Figure 1: Map of the study area with elevation profile of Da Nang city, Vietnam
2.2 Satellite Image Data Acquisition
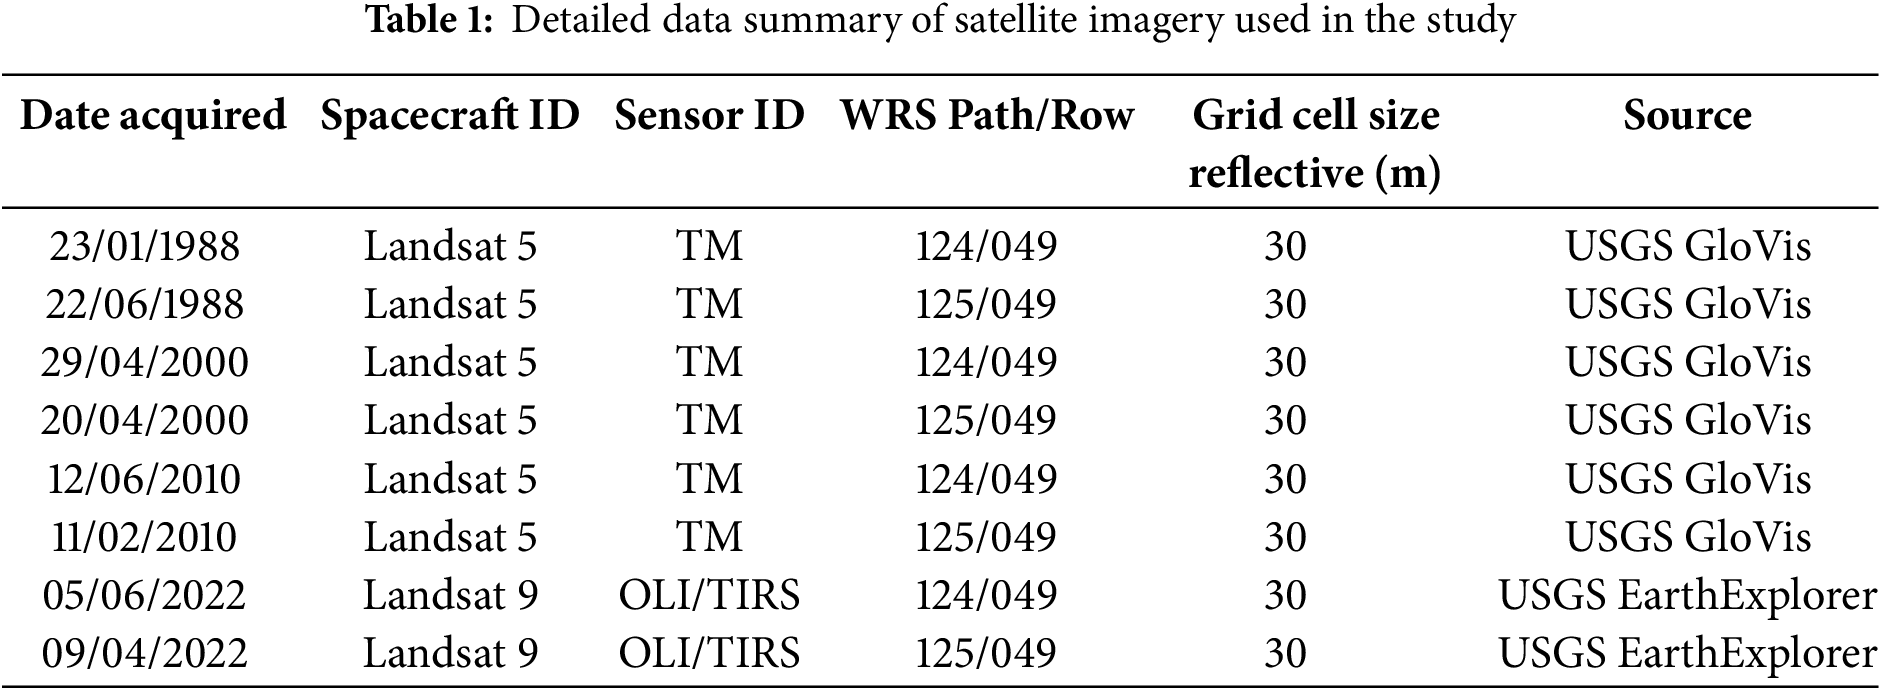
Satellite images were used to map the LULC in Da Nang city from 1988 to 2022 and assess vegetation health. The Landsat image data were downloaded from USGS EarthExplorer (https://earthexplorer.usgs.gov) (accessed on 23 February 2025) and USGS GloVis (https://glovis.usgs.gov) (accessed on 23 February 2025). Landsat 5-TM images were used for the years 1988, 2000, and 2010, and Landsat 9-OLI/TIRS images were used for 2022 in this study. The selected imagery, with a 30-meter spatial resolution, covered Worldwide Reference System (WRS) path/row combinations 124/049 and 125/049, ensuring comprehensive spatial coverage of the study area. These datasets were chosen for their temporal consistency and suitability for land use and land cover change analysis over a 34-year period. These years were selected based on the availability of high-quality imagery and their alignment with significant milestones in urbanization and policy changes in Da Nang. Specifically, 1988 represents the pre-urbanization baseline, as this period marked minimal anthropogenic impacts on land cover. The year 2000 reflects the influence of Vietnam’s Doi Moi economic reforms, which led to significant industrialization and urban expansion. The year 2010 captures a decade of rapid infrastructure development, reflecting the impacts of increasing investment and modernization in Da Nang. Finally, 2022 provides the most recent data, showcasing the cumulative changes and current state of vegetation and land use. A detailed summary of the data is described in Table 1.
2.3 Image Pre-Processing and Classification
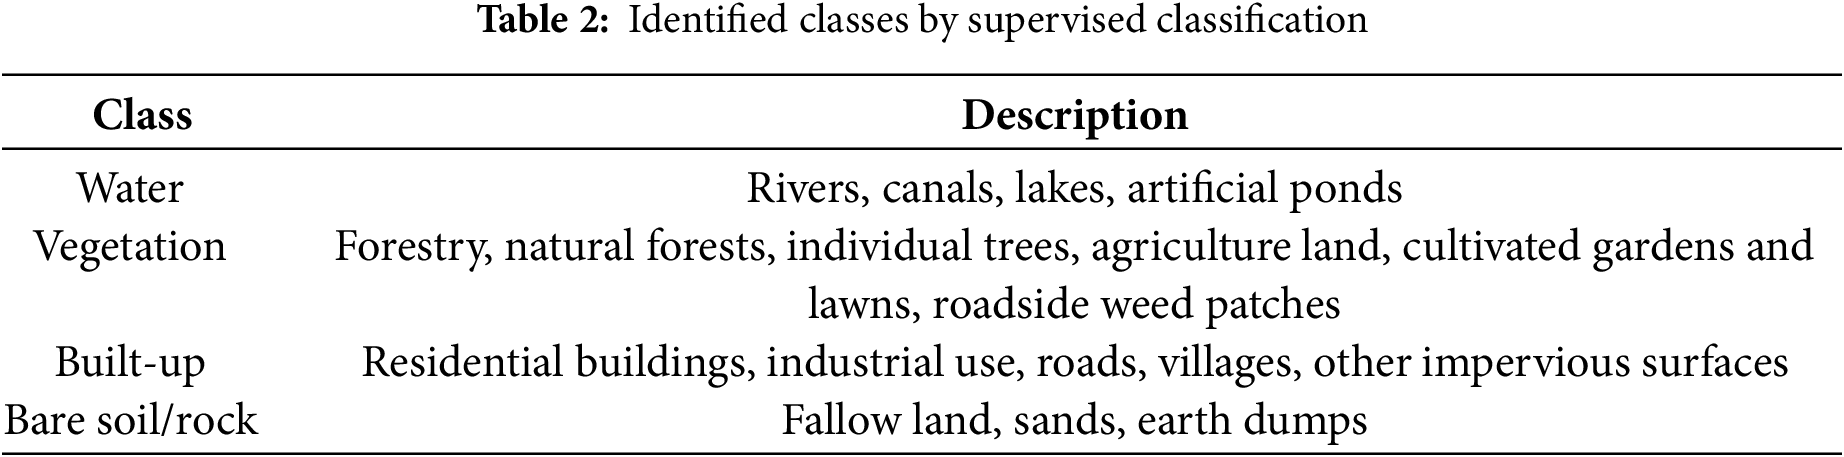
Image pre-processing was carried out to enhance the interpretability of satellite data by extracting relevant information [21]. The satellite imagery was analyzed by assigning spectral signatures to each pixel and delineating watersheds. The data were categorized into four LULC classes following the modified Anderson Level I classification scheme [22], Vietnam’s land use regulations, the existing environmental conditions of the study area, and the distinct spectral characteristics of various landscape features. The resulting classes included water, vegetation, built-up areas, and bare soil/rock, as outlined in Table 2.
Before performing change detection, the satellite images underwent pre-processing using the ArcGIS 10.8 software. The images listed in Table 1 were geometrically corrected to the WGS84 datum with the Universal Transverse Mercator (UTM) projection, specifically in zone 48N. As the Landsat images contained 11 bands, layer stacking was conducted to combine the bands into a single composite image. Subsetting was performed within ArcGIS 10.8 using the “Extract by Mask” tool to clip the images to the study area boundary [23]. For LULC classification, the study employed a rule-based supervised classification method using the Maximum Likelihood Classifier (MLC) algorithm for the datasets acquired in 1988, 2000, 2010, and 2022. Training samples representing known land cover types were collected based on ground truth data and compared against the spectral signatures of image pixels using defined decision rules [24]. This approach, primarily guided by the analyst, involved selecting representative pixels for each LULC class [25,26]. Post-classification refinement was applied to enhance accuracy and reduce classification errors, ensuring simplicity and effectiveness [27]. To generate LULC maps, supervised classification incorporated both the study area of interest and field survey data for training and validation purposes. The classified LULC images were subsequently reclassified in ArcGIS 10.8 to enable comparative analysis of changes across the study years. The detailed classification methodology is illustrated in Fig. 2.
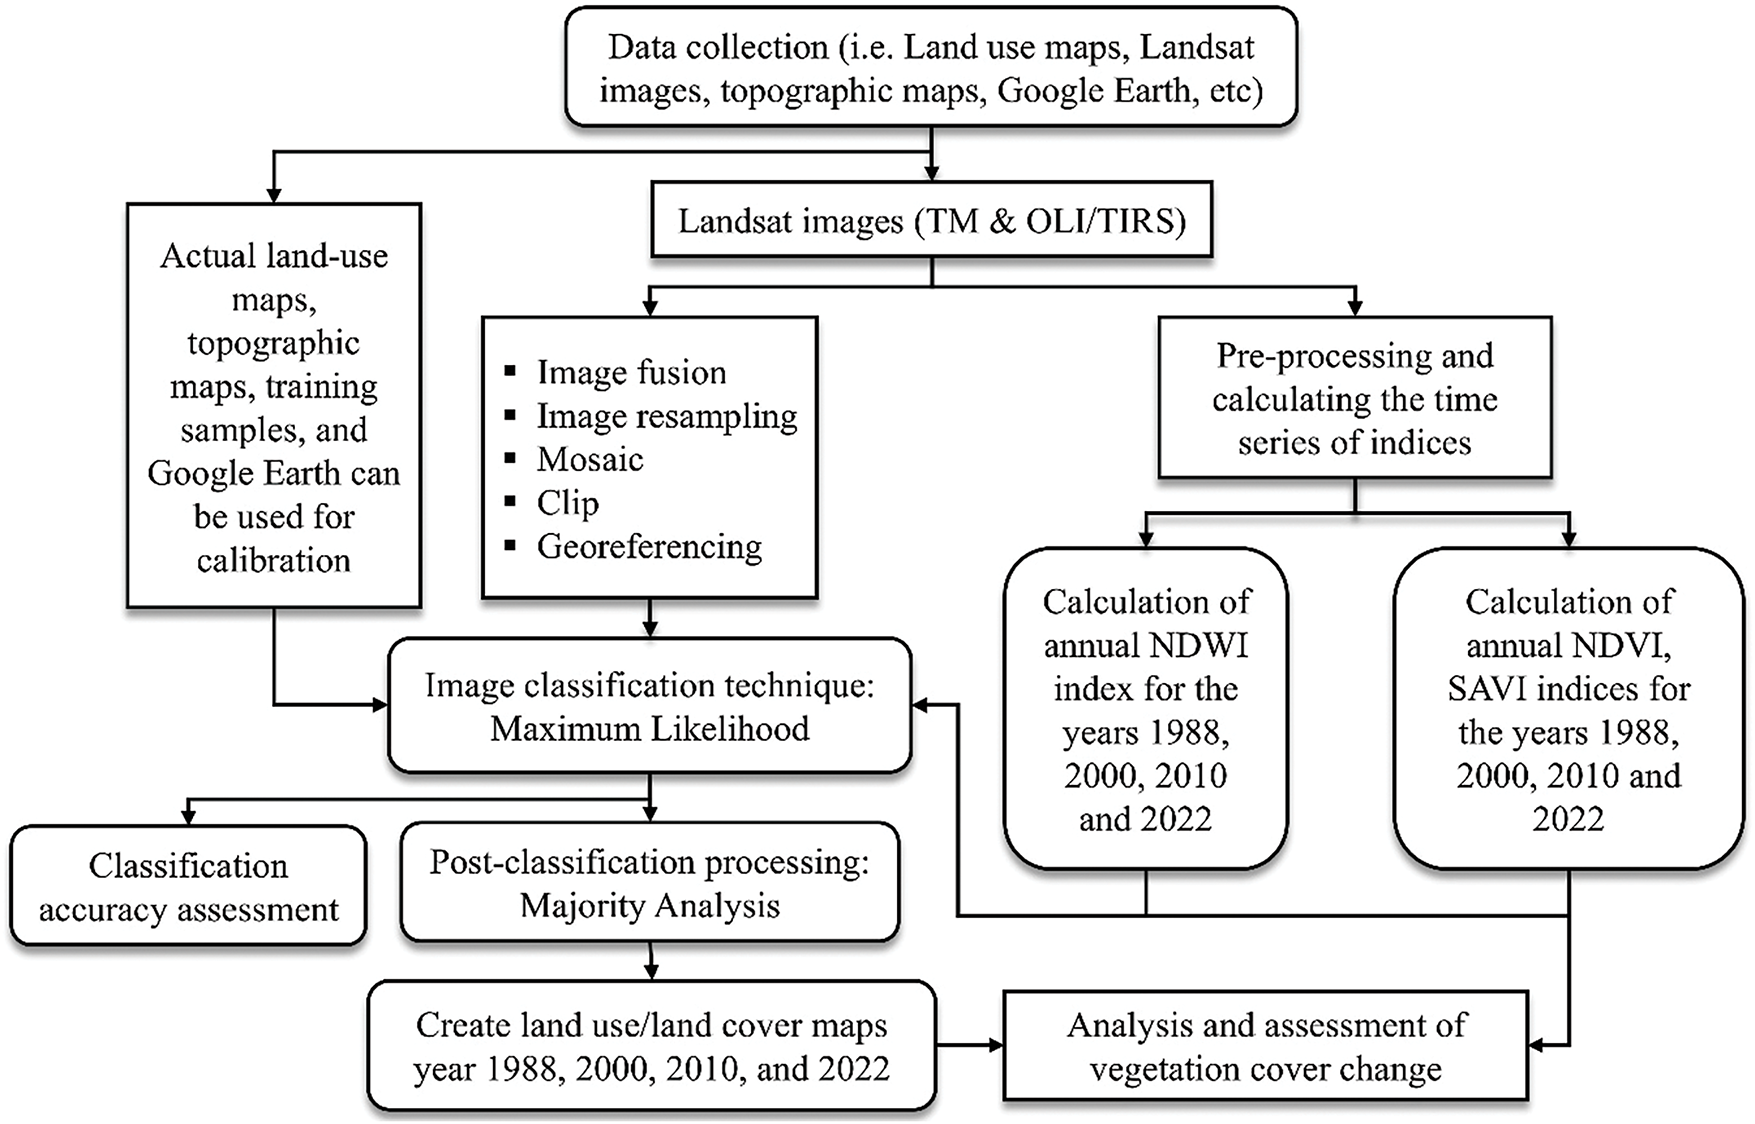
Figure 2: Overall process of forest cover change technique
2.4 Classification Accuracy Assessment
The accuracy assessment of the thematic maps produced in this study was conducted to evaluate the reliability of the information derived from the data [28,29]. The evaluation utilized a confusion matrix, overall accuracy, user accuracy, producer accuracy, and kappa coefficient metrics to measure the classification performance of the images. Validation was carried out using 250 points, derived from ground truth data, reference data obtained from Google Earth, and visual interpretation. The comparison between point data and classification results was performed through a confusion matrix. The equations for calculating the kappa coefficient, overall accuracy, user accuracy, and producer accuracy are among the most effective quantitative methods for evaluating the classification of satellite imagery and are presented in Eqs. (1)–(4), respectively [29].
where
2.5 NDVI, SAVI, and NDWI Analysis
The NDVI and SAVI methods are effective for assessing vegetation cover in the study area [30–32]. NDVI is a satellite-derived index used to measure vegetation greenness, providing insights into plant density and health. On the other hand, SAVI was designed as an enhancement of NDVI, incorporating a correction for soil brightness to improve accuracy in areas with sparse vegetation. NDVI values range from −1 to +1, reflecting the photosynthetic activity of green vegetation, with higher values indicating denser and healthier vegetation. The formulas for calculating NDVI and SAVI are provided in Eqs. (5) and (6), respectively [30,31].
where NIR is the reflectance radiated in the near-infrared wave band, and RED is the reflectance radiated in the visible red wave band of the satellite radiometer.
where L is 0.5, the default value.
Similarly, the NDWI is an index designed to assess open water features and the moisture content of vegetation [18]. This index serves as a crucial tool for monitoring drought conditions, water stress, and land degradation. NDWI is a dimensionless index with values ranging from −1 to +1. Higher NDWI values indicate greater water content in vegetation and open water bodies, while lower values signify reduced water content. The formula for calculating NDWI is provided in Eq. (7) [18].
where NIR is the reflection in the near-infrared spectrum, GREEN is the reflection in the green range spectrum.
3.1 LULC Classification and Accuracy Assessment
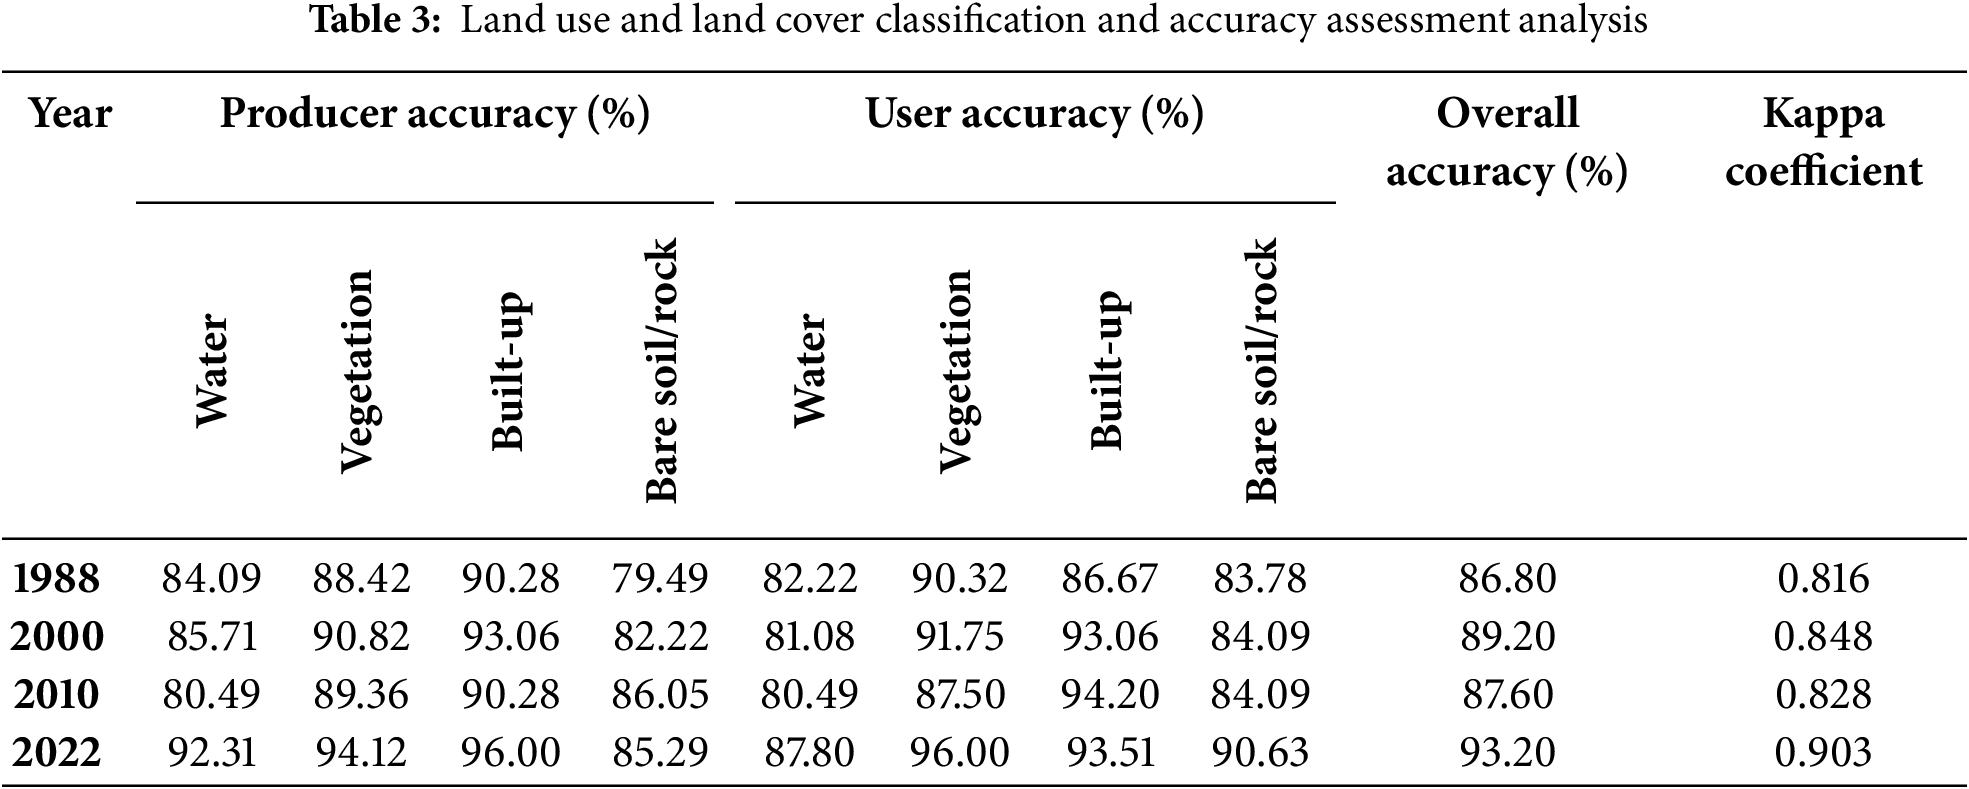
The results of Landsat satellite image classification using the maximum likelihood algorithm are shown for the years 1988 (Fig. 3a), 2000 (Fig. 3b), 2010 (Fig. 3c), and 2022 (Fig. 3d). The accuracy values of the LULC classification map, as assessed by the kappa coefficient, overall accuracy, user accuracy, and producer accuracy metrics, are shown in Table 3. The overall classification accuracy of the maps was 86.80%, 89.20%, 87.60%, and 93.20% for the years 1988, 2000, 2010, and 2022, respectively. These results confirm that the accuracy values for all years are considerably above 80%, indicating a high degree of LULC classification accuracy [28,29].
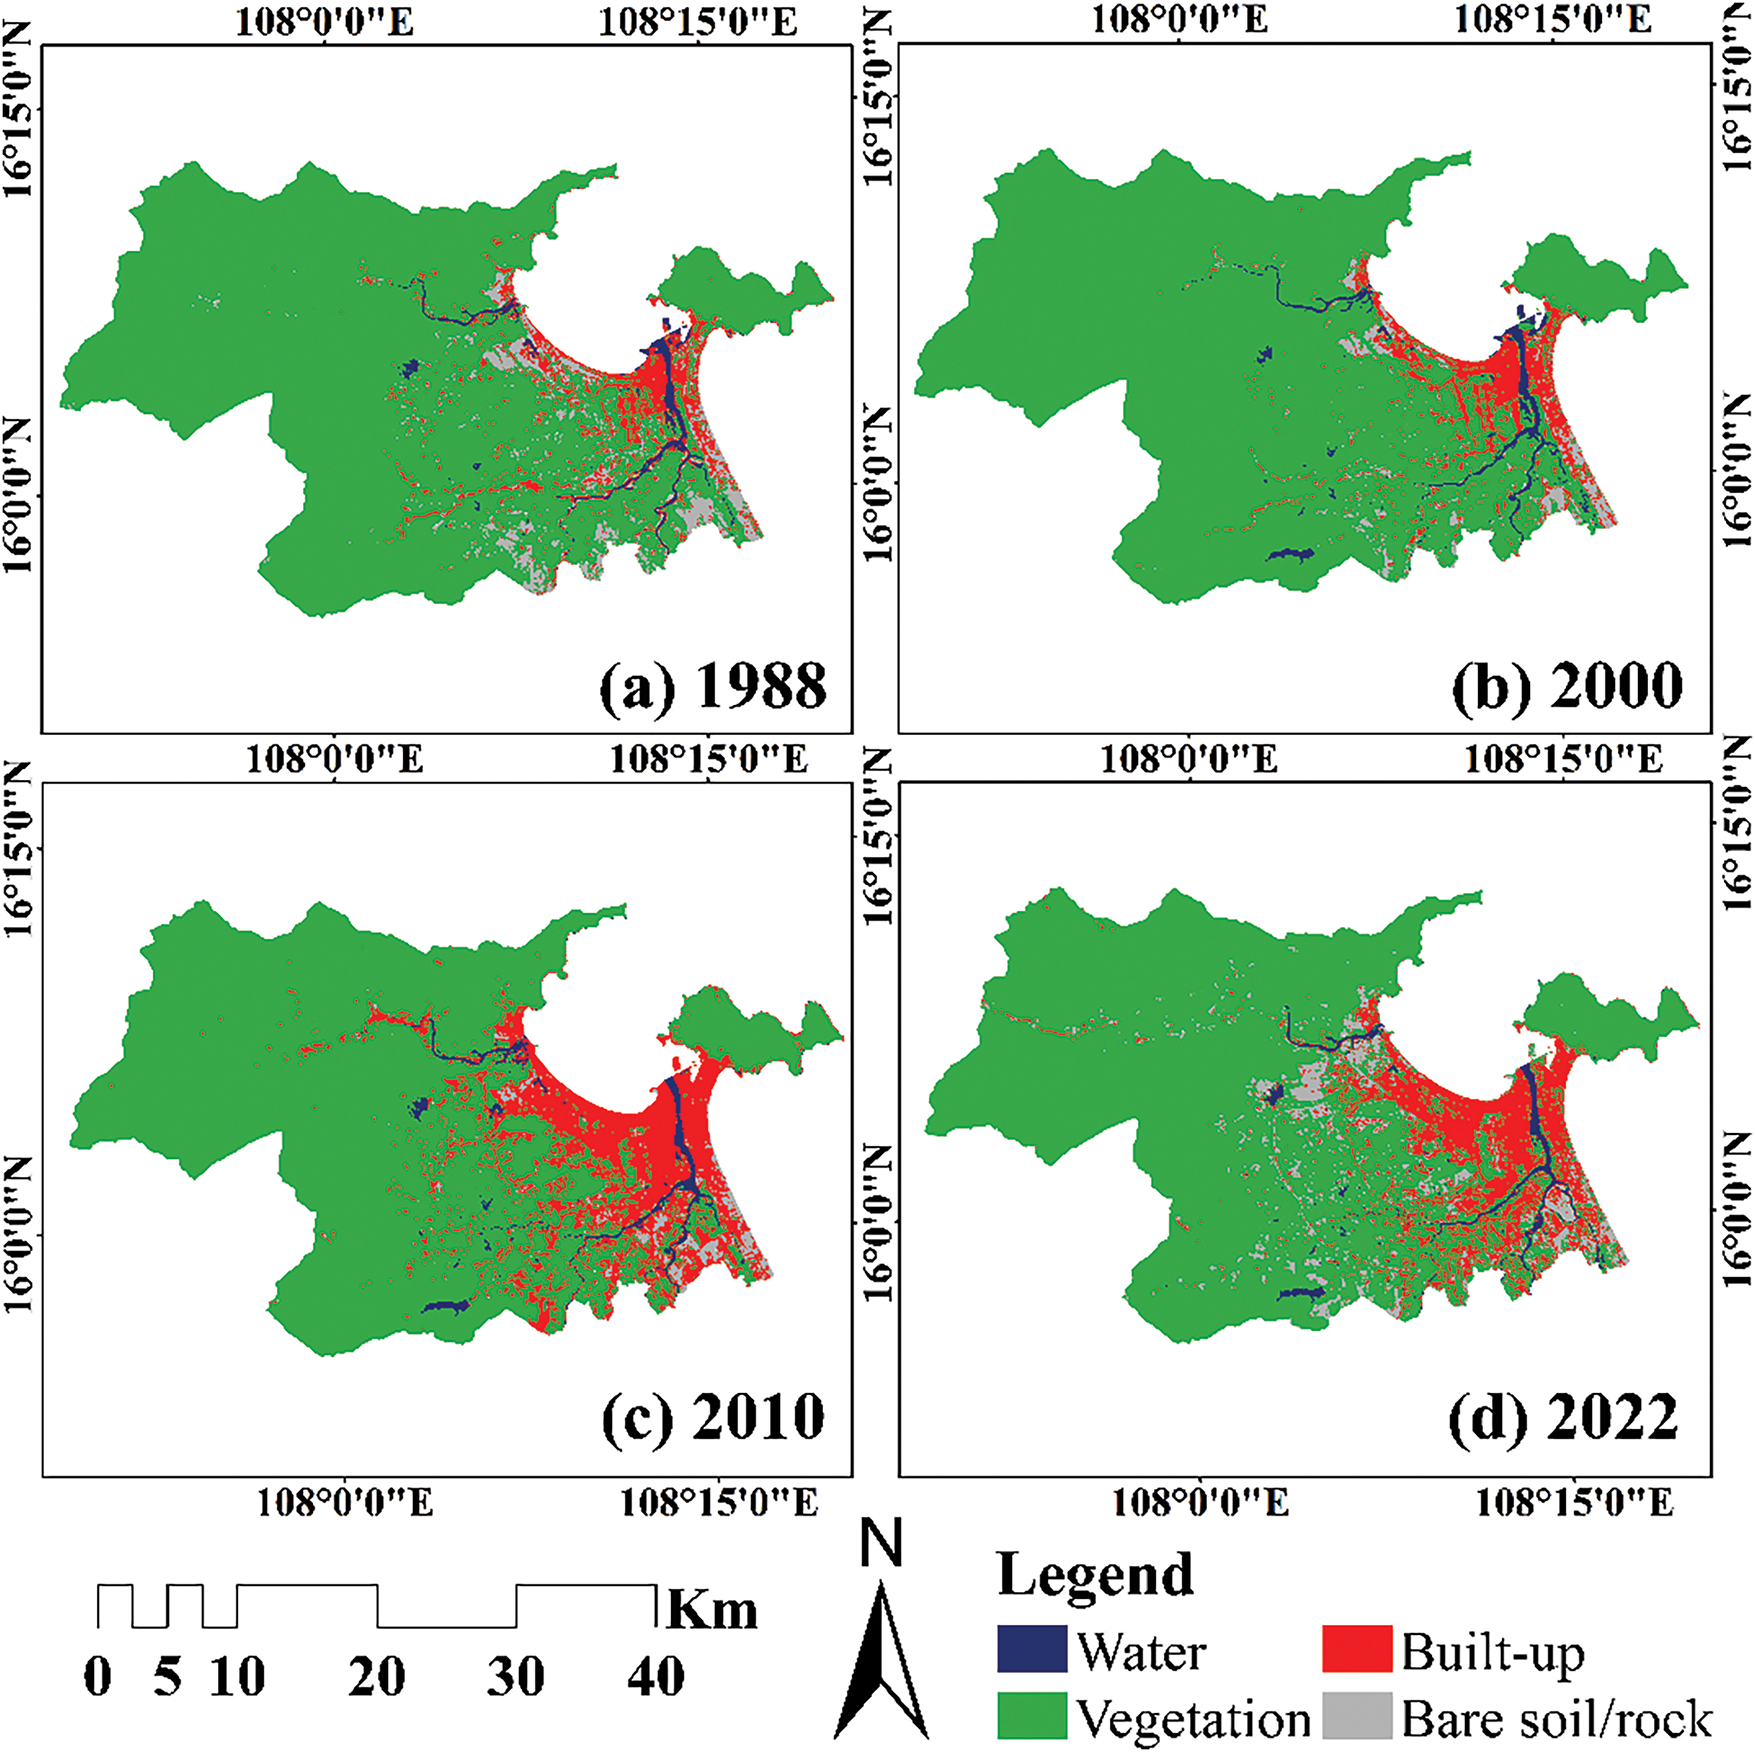
Figure 3: Land use and land cover classifications of Da Nang city in 1988 (a); 2000 (b); 2010 (c) and 2022 (d)
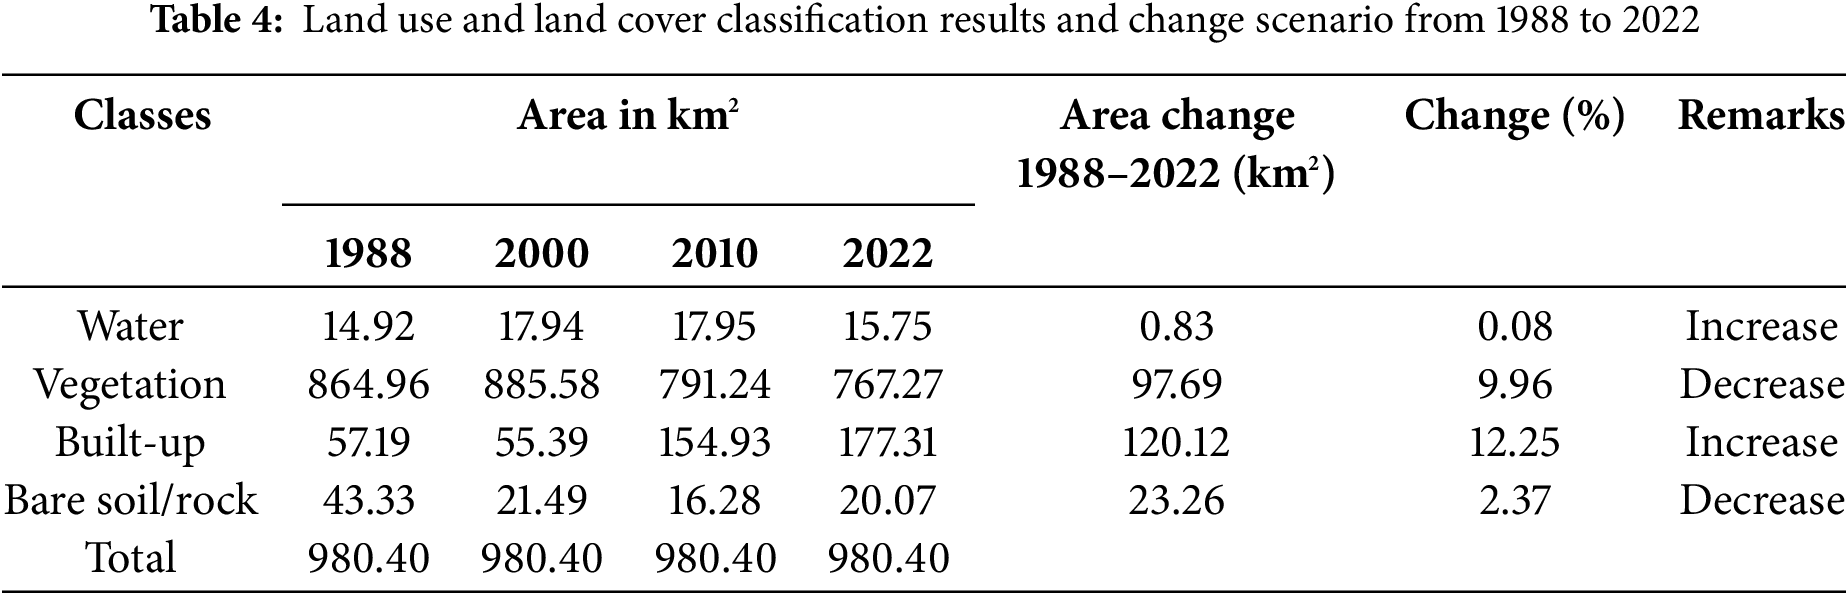
The data obtained from the LULC classification for the period 1988 to 2022 are presented in Table 4 to provide further insights into the land class changes. The results show that significant changes occurred in the coverage of each class. Vegetation covered an area of 864.96 km2 in 1988, which decreased to 767.27 km2 in 2022, representing a decrease of 9.96%. During this period, the built-up land class significantly increased in total area from 57.19 km2 (1988) to 177.31 km2 (2022) representing a total increase of 120.12 km2, equivalent to 12.25% of the total area. The smallest change was recorded in the area covered by the water class, increasing by 0.83 km2 (0.08%) in the period 1988–2022. In 1988, the area of bare soil/rock was 43.33 km2 (4.42%) and decreased by 20.07 km2 (2.05%) in 2022, a net decrease of 2.37% (Table 4).
3.2 Spatial Distribution of NDVI, SAVI, and NDWI from 1988 to 2022
The study area was analyzed using three widely used indices (NDVI, SAVI, and NDWI). Of these, NDVI and SAVI are suitable for detecting vegetation cover in the study area [33,34]. Fig. 4 shows the spatial distribution of NDVI values for the four studied years and ranges from −0.70 to 0.90. The water class is shown in dark purple, and its value is below 0. The built-up land and bare soil/rock classes are represented by white and light purple, with index values slightly above 0. Vegetation areas are shown in dark green and light green, with values of around 0.30 or more. Fig. 5 shows the spatial distribution of SAVI values for the four studied years, with values from −1.03 to 1.35. Dark blue represents the water class, and its value is below 0. Built-up land and bare soil/rock are shown in lighter blue, with values slightly above 0. Vegetation cover areas are dark green and light-yellow green, and their SAVI values are around 0.35 or more. Figs. 4 and 5 show that the extent of built-up land has expanded rapidly over the past three decades. The NDVI and SAVI results also show that the vegetation area decreased significantly during this period. This underscores the need for sustainable urban planning policies that integrate green infrastructure, such as urban forests and ecological corridors, to mitigate the negative effects of urbanization on vegetation cover [34]. Adopting stricter land-use policies, coupled with incentives for afforestation and reforestation, can help address vegetation loss while ensuring ecological balance.
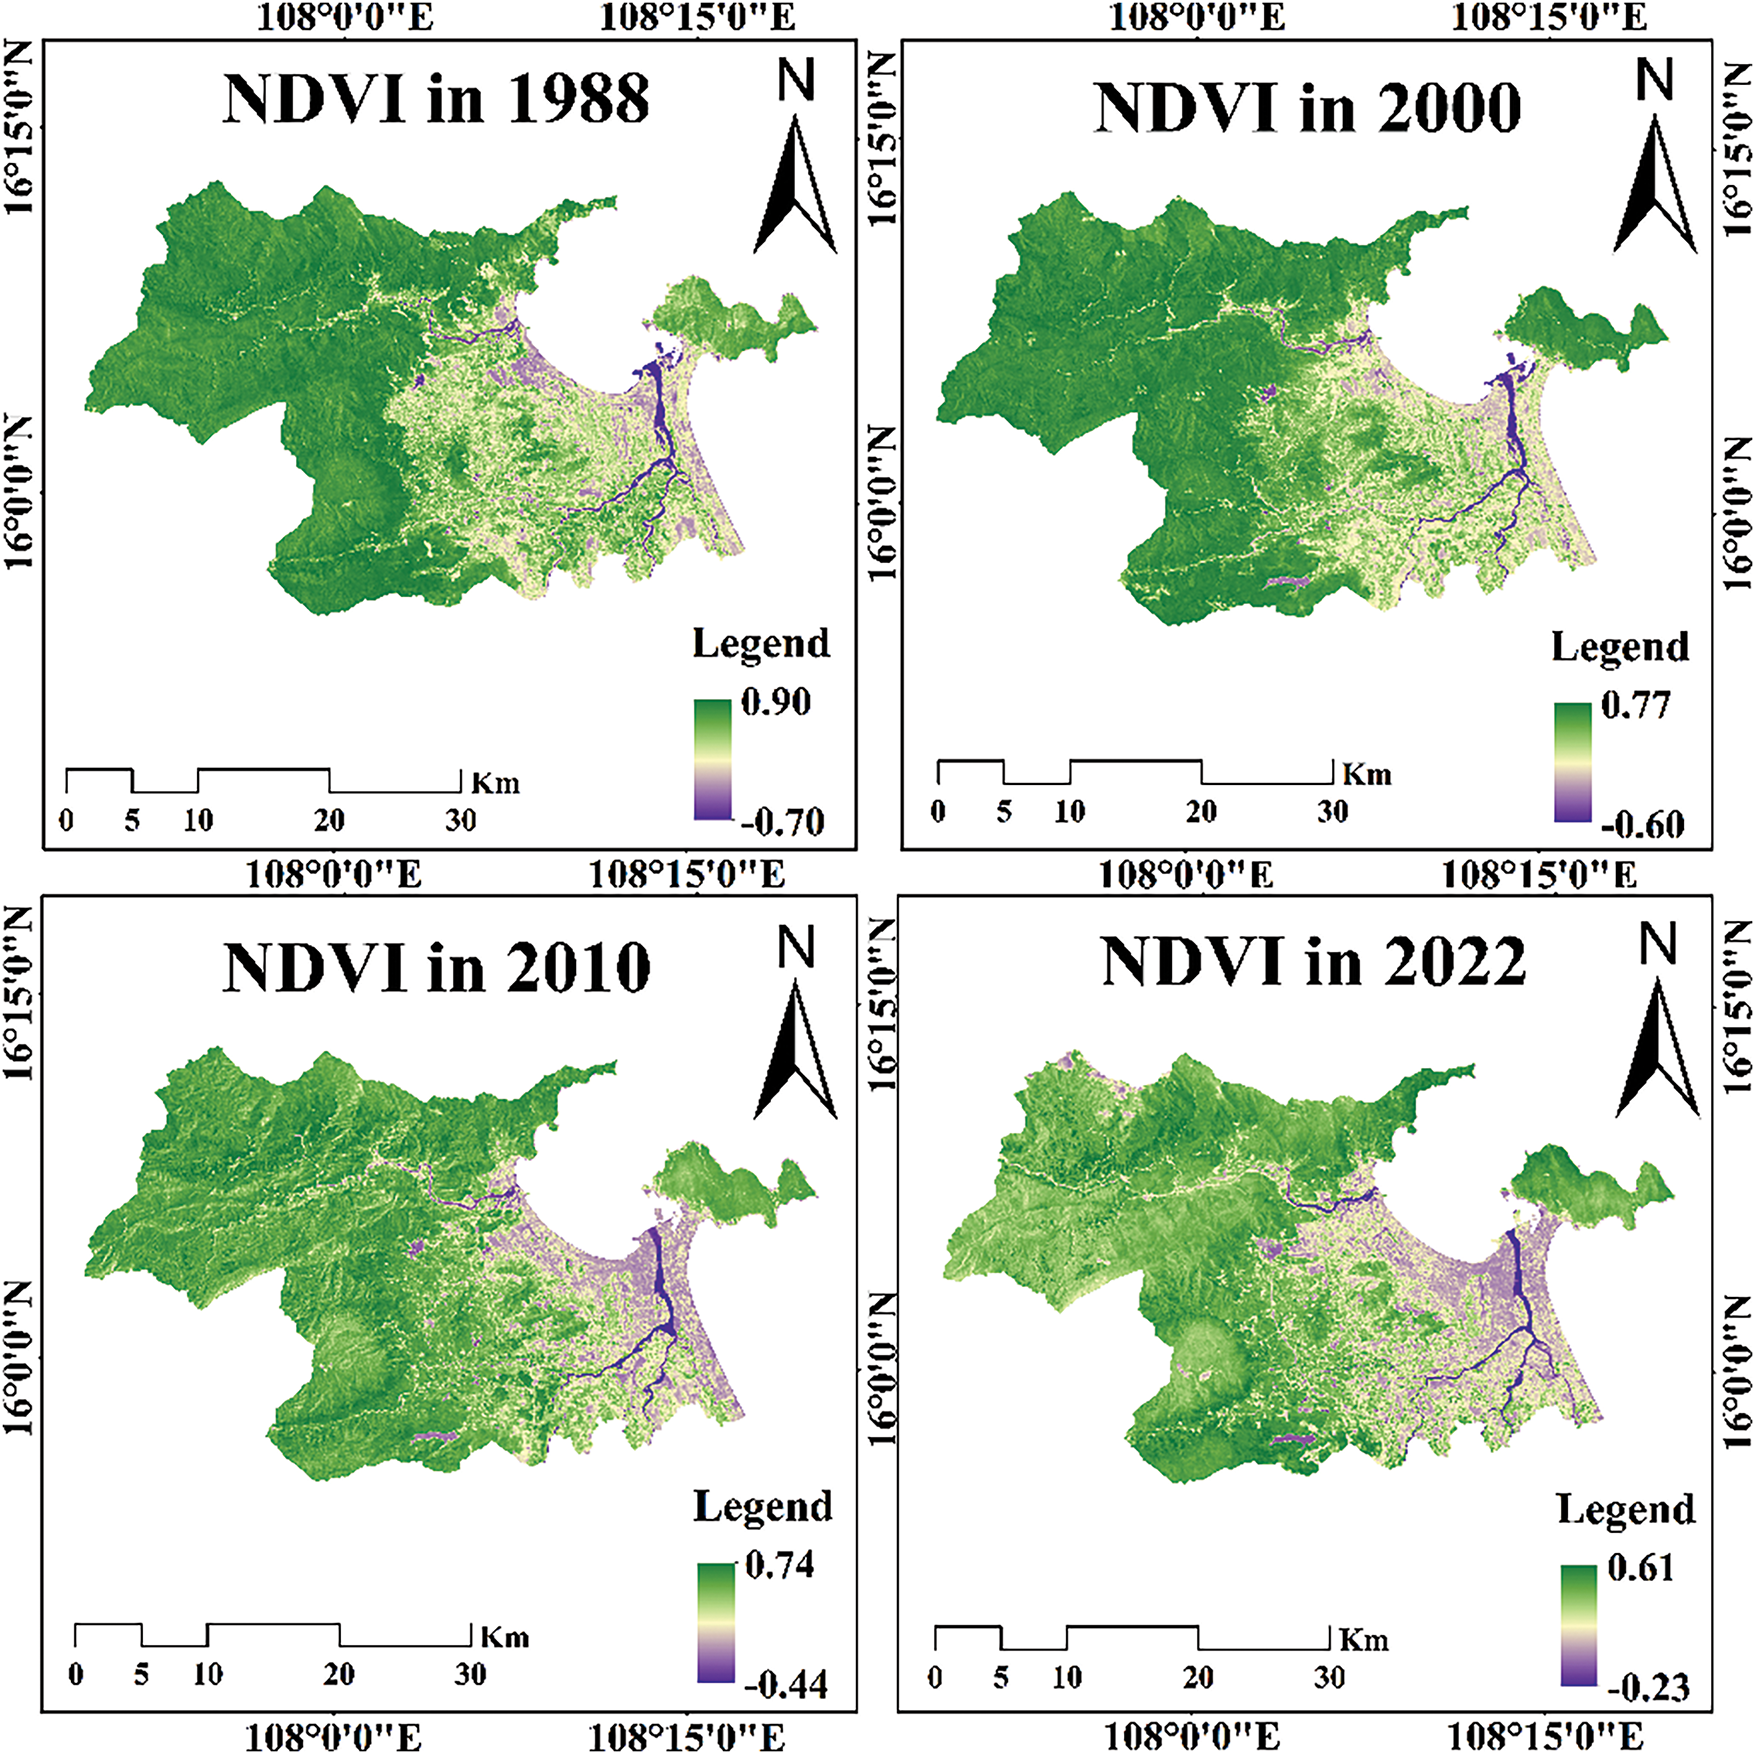
Figure 4: Spatial distribution of NDVI for 1988, 2000, 2010 and 2022
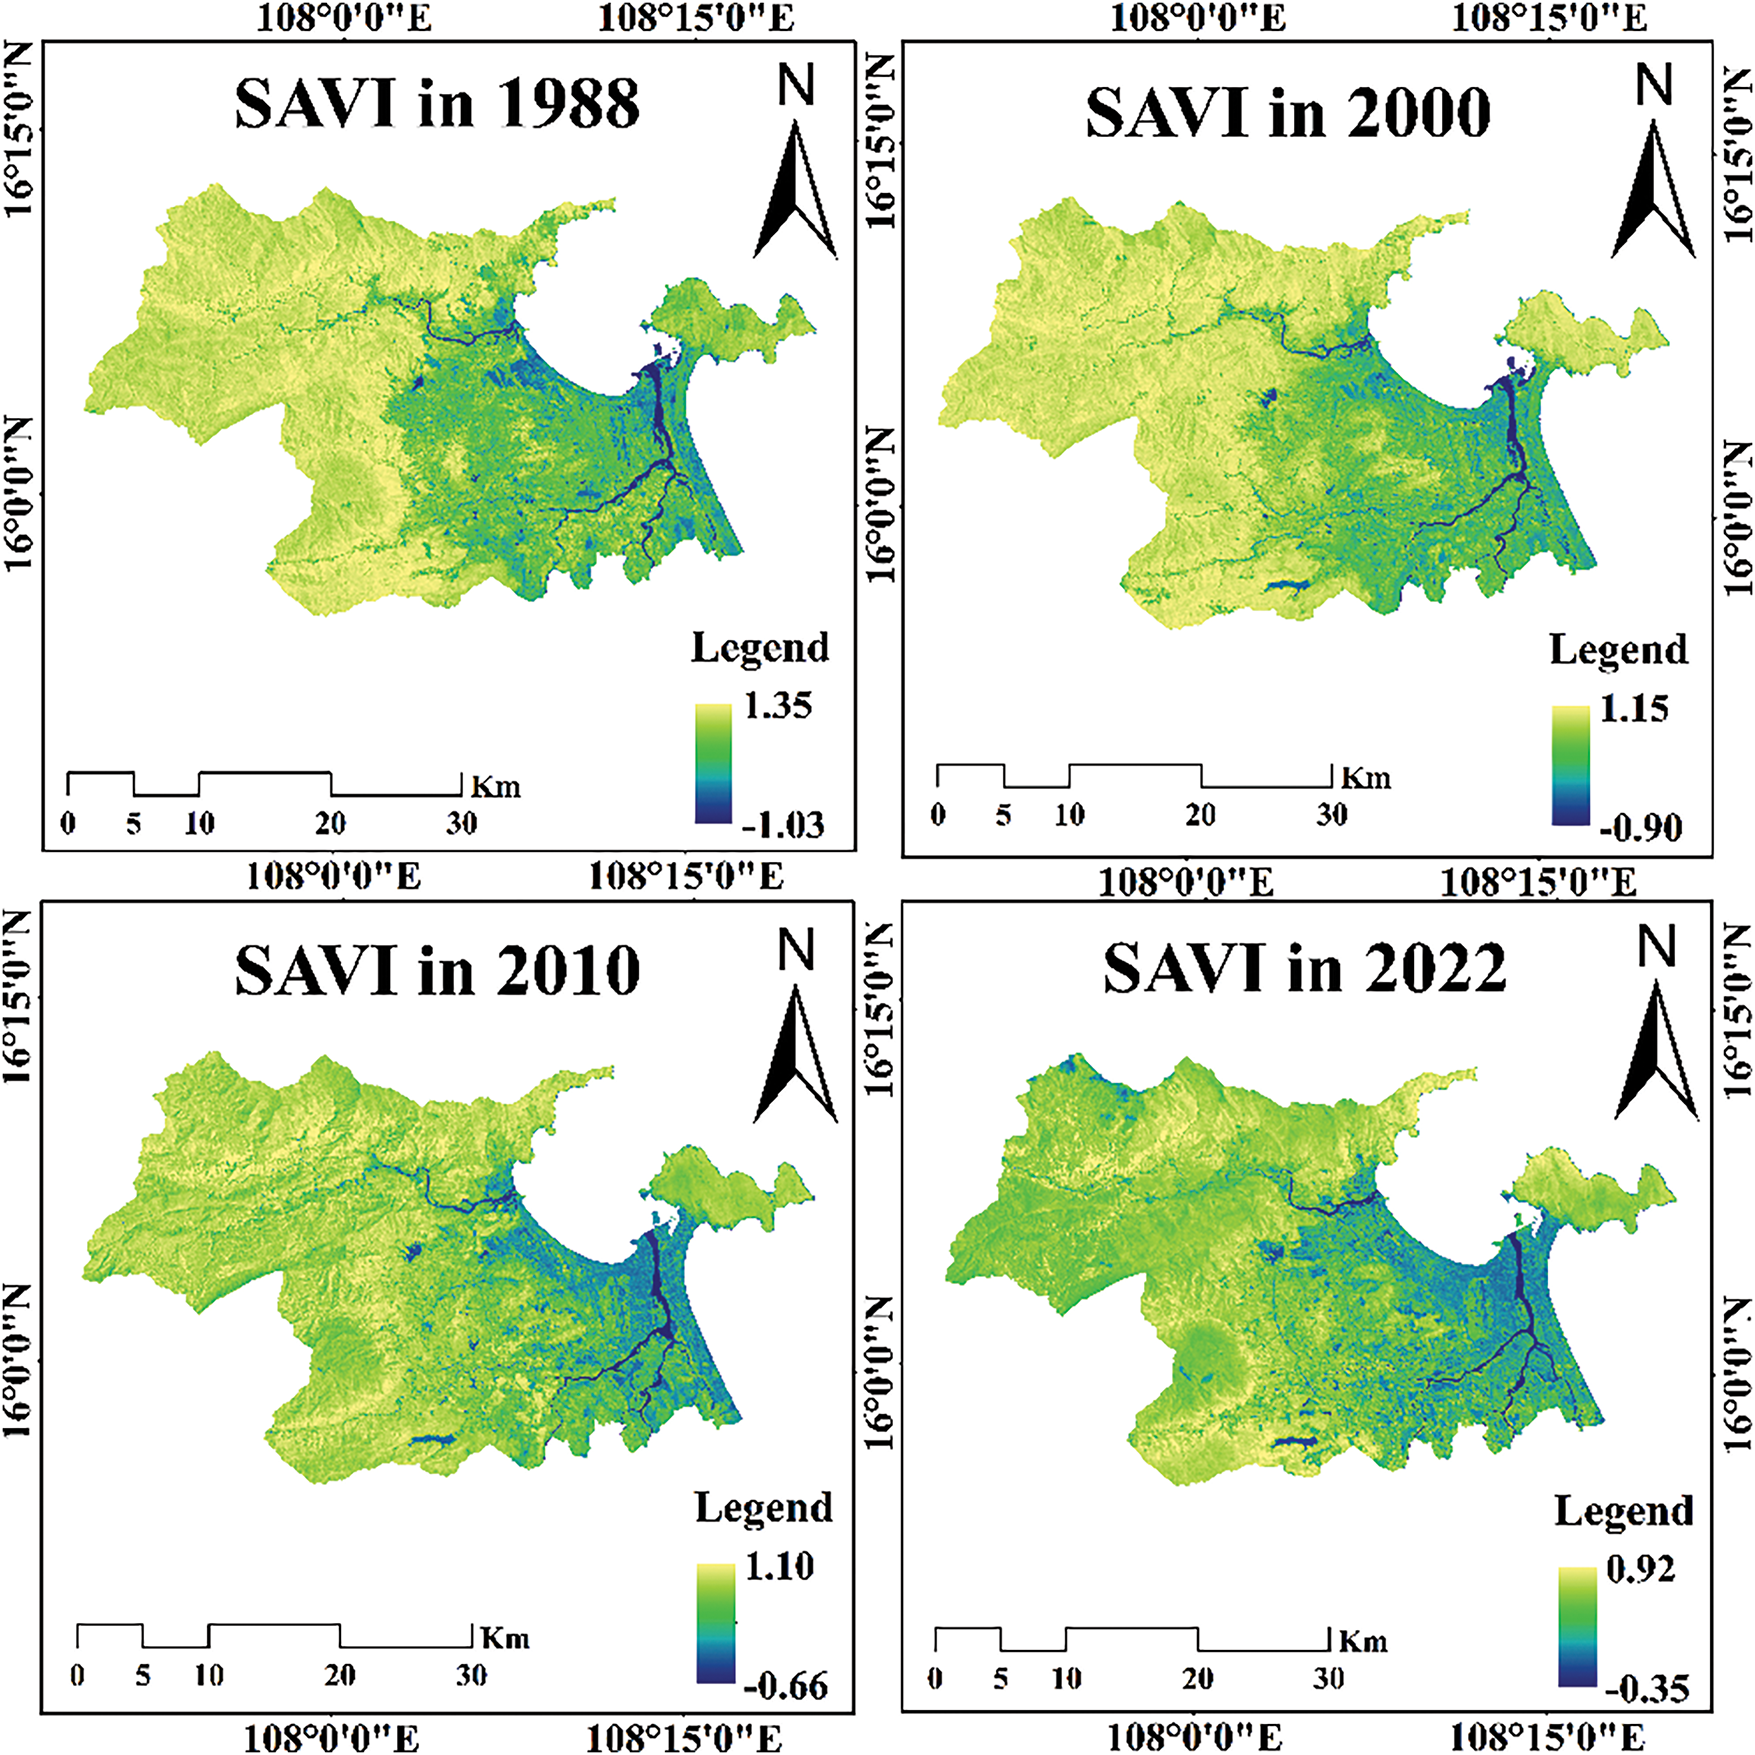
Figure 5: Spatial distribution of SAVI for 1988, 2000, 2010 and 2022
The NDWI method is commonly used to monitor the water stress of crops and wetland organisms. This indicator has been verified and used in studies of wetlands, rivers, lakes, and oceans [35,36]. The NDWI results for the study area are similar to the NDVI results. Fig. 6 shows the spatial distribution of the NDWI values for the four studied years, with values ranging from −0.71 to 0.66. The large area of vegetation cover is shown in dark green and light green, with values from approximately −0.71 to −0.30. Water areas are shown in dark purple, and their values are above zero. The areas shown in light brown and light purple color, corresponding to values between −0.30 and 0 (i.e., between vegetation and surface water classes), are built-up and vacant land classes. The NDWI analysis also shows a significant decrease in vegetation cover between 1988 and 2022; in addition, these results show a significant expansion of the built-up land class, indicating an increased demand for housing and services in the study area.
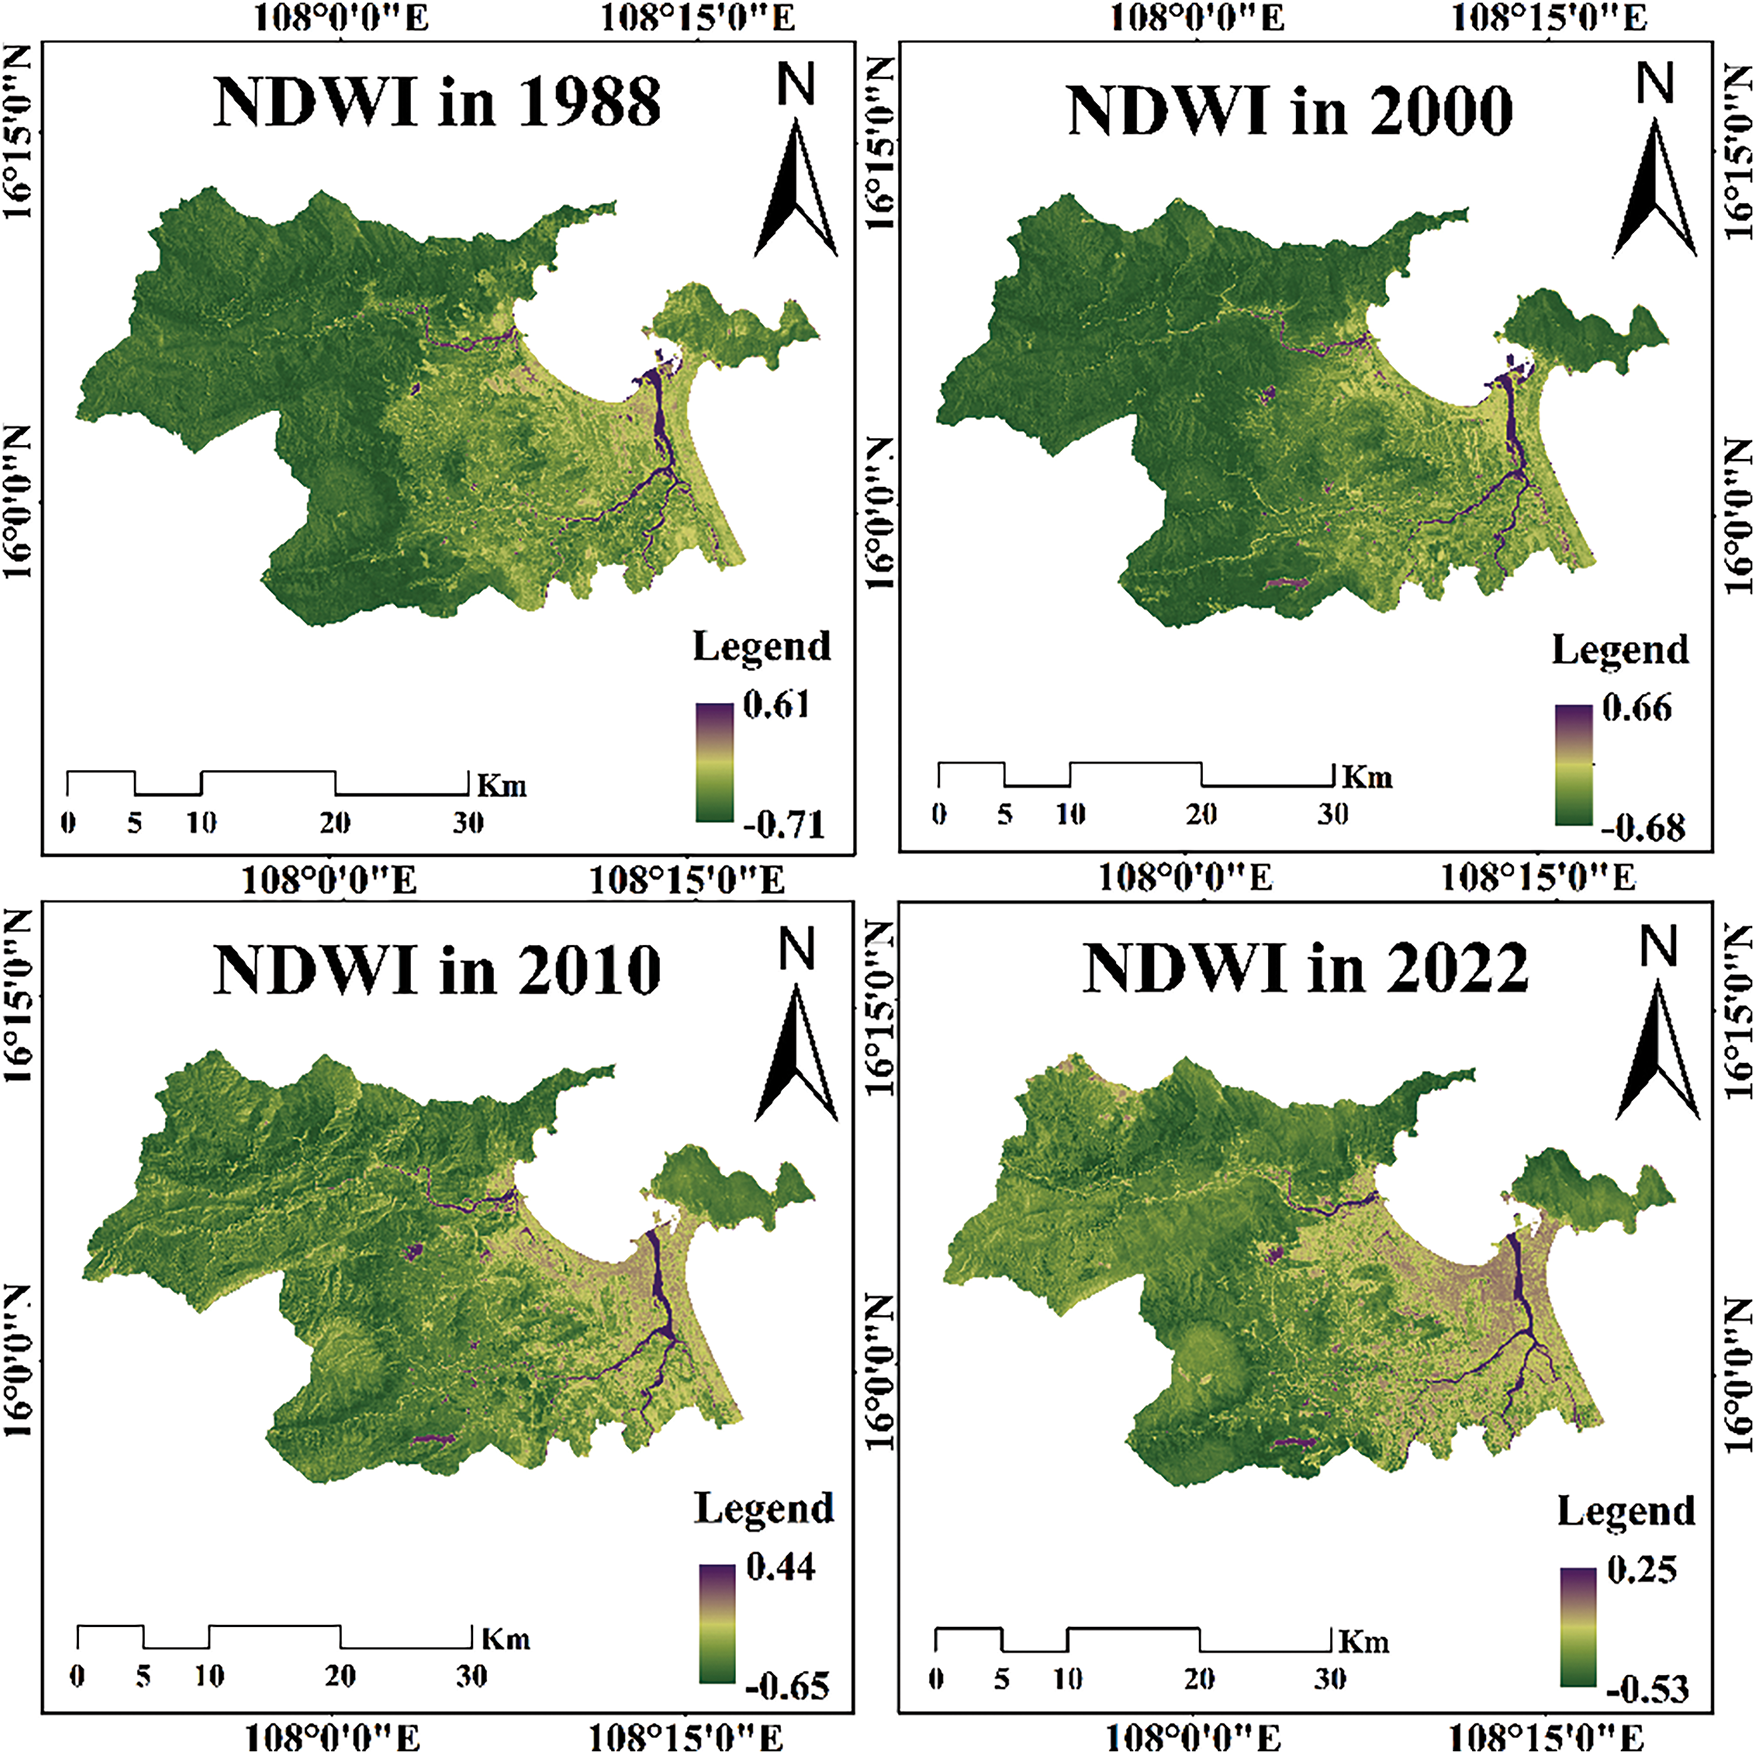
Figure 6: Spatial distribution of NDWI for 1988, 2000, 2010 and 2022
Fig. 7 shows notable changes in land cover during the studied period from 1988 to 2022. The most striking changes include a slight increase in vegetation cover from 88.23% in 1988 to 90.33% in 2000; however, this value gradually decreased to 80.71% in 2010 and 78.26% in 2022. Another notable change is the increase in built-up areas; this LULC class covered only 5.83% in 1988 but increased to 18.09% by 2022. In addition, Fig. 7 shows that the water and soil/bare rock classes also vary but represent a very small proportion of the total study area.
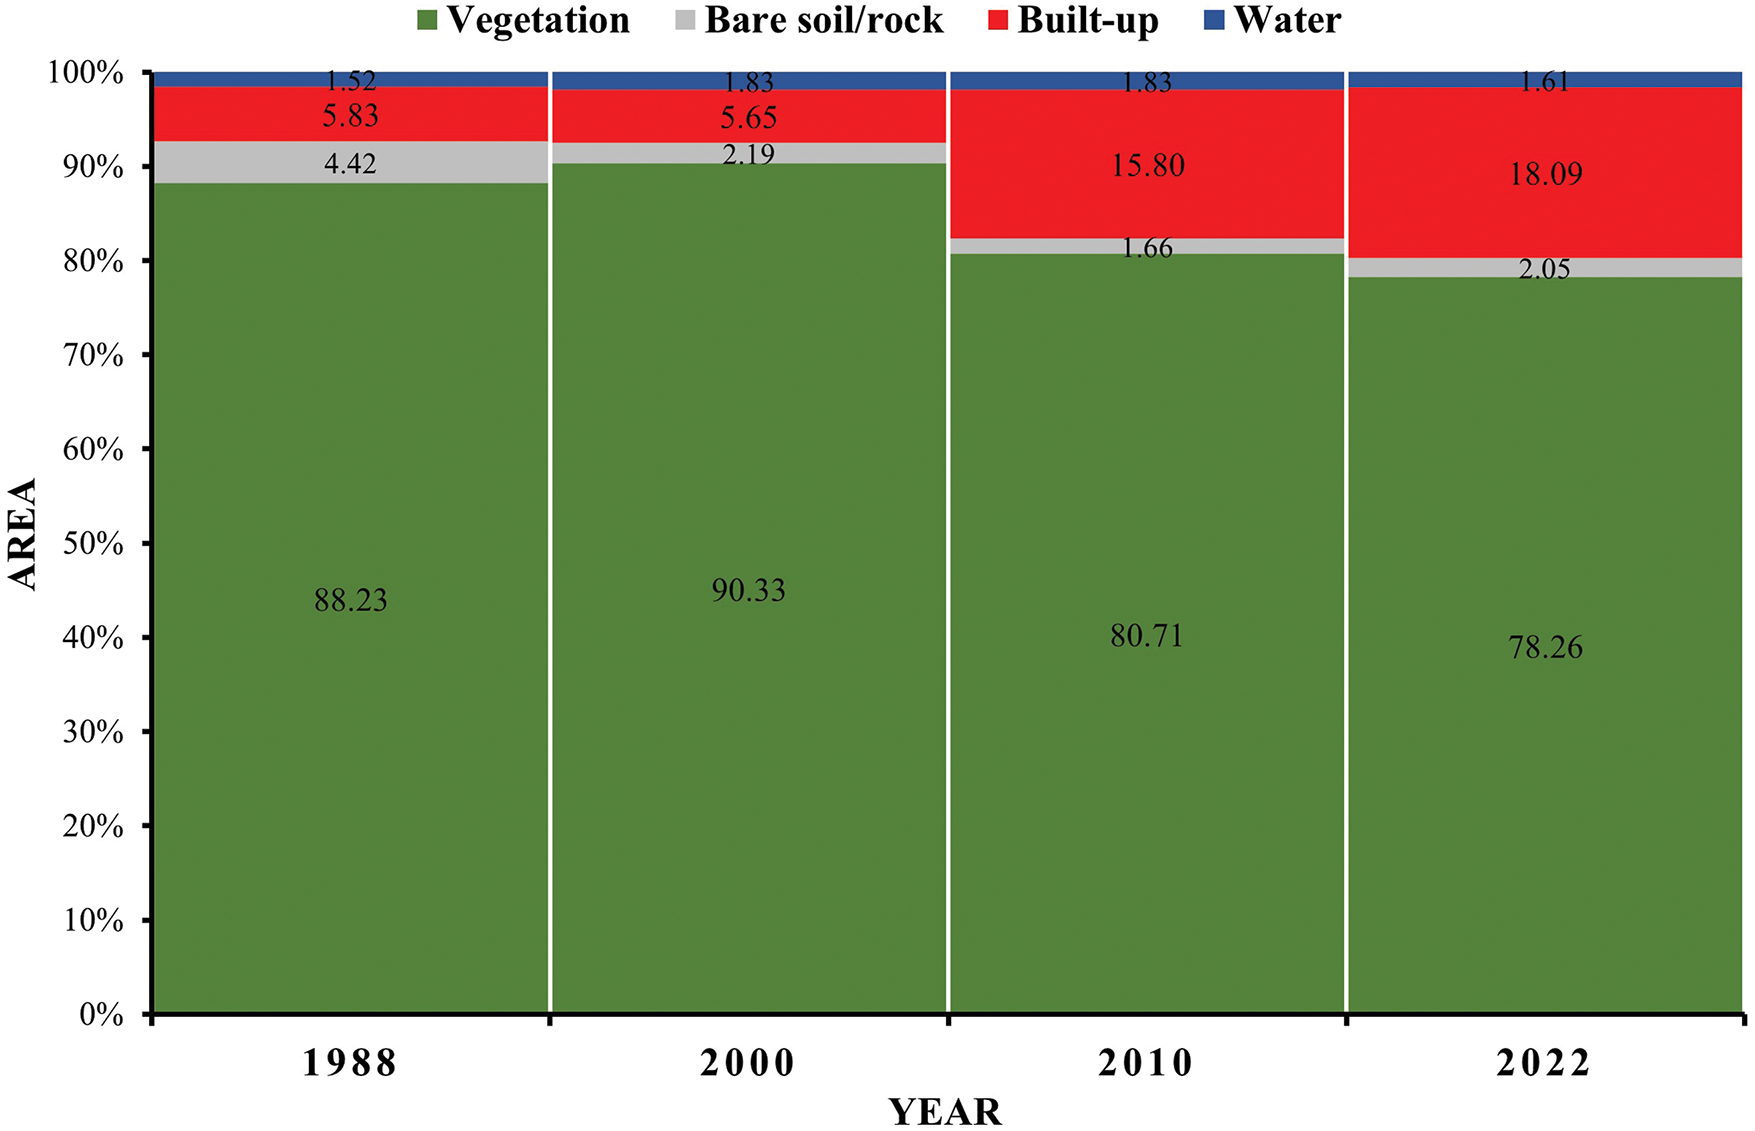
Figure 7: Trend of land use and land cover classes in Da Nang city from 1988 to 2022
The relationship between vegetation cover and built-up area is shown in Fig. 8. The regression analysis results show a close relationship between the decrease in vegetation area and the increase in built-up areas, with a correlation coefficient (R2) value of 0.98. A study by Huong et al. (2022) [37] also showed that the expansion of built-up land in the study area mainly corresponds to the conversion of extensive areas of vegetated land for further construction in Da Nang during its transition to a modern, strongly industrialized city with high service industry levels. Administrative displacement and urban population growth in urban areas are strong drivers of the transformation between these two land classes; thus, the processes of urbanization and socio-economic development have rapidly changed the urban environment of Da Nang.
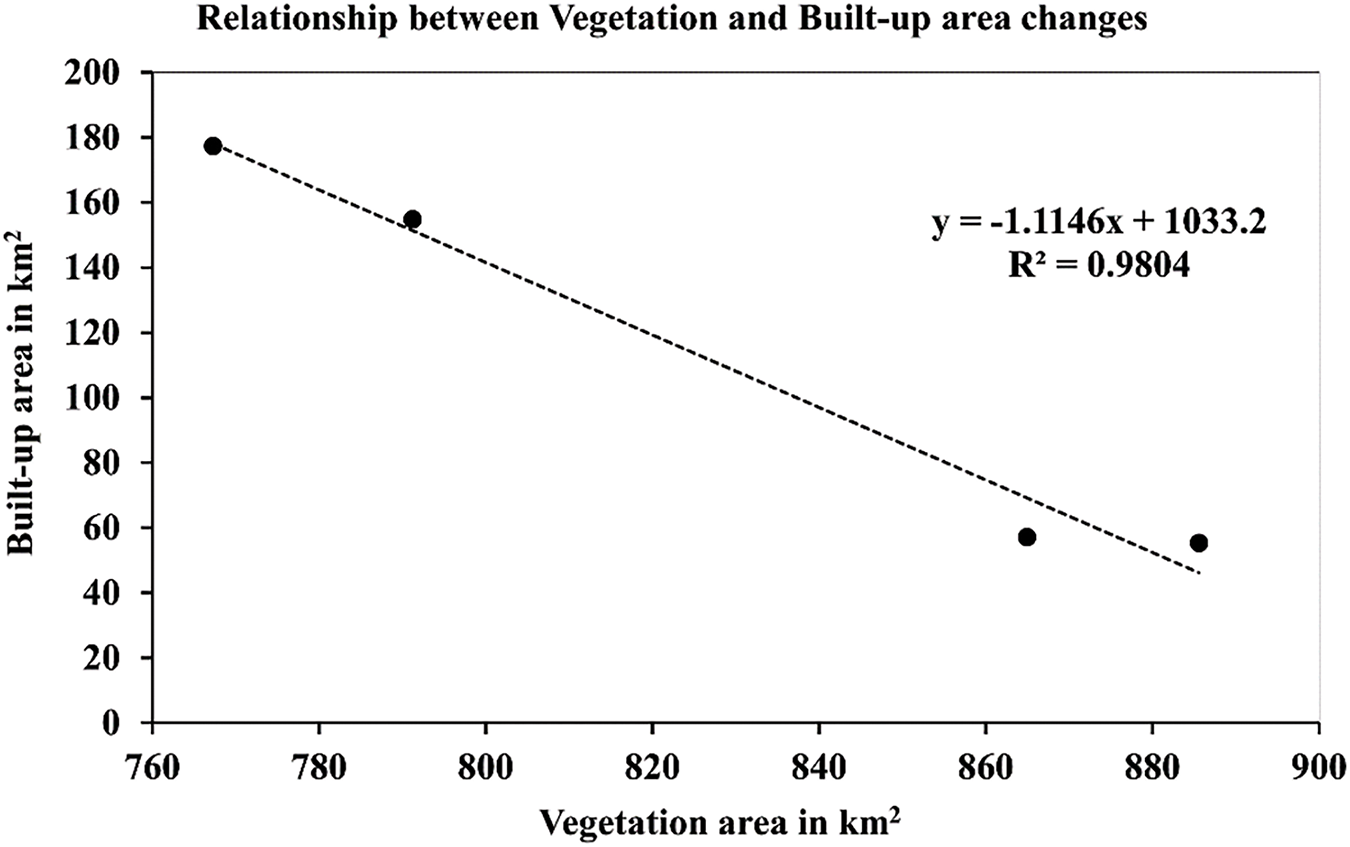
Figure 8: The trend of land use and land cover classes for 1988, 2000, 2010 and 2022 in the study area
3.4 Relationship between Vegetation Index and Decadal Vegetation Cover Changes
NDVI and SAVI are two widely used indices for vegetation detection and mapping. Maps showing the NDVI and SAVI indices in the study area from 1988 to 2022 are shown in Figs. 4 and 5, respectively. In this process, we extracted all the pixel values of NDVI and SAVI from the classified image in 2022 and assigned the vegetation class to pixels with NDVI values greater than 0.30 and SAVI values greater than 0.35. Using these NDVI and SAVI thresholds, we performed a similar binary reclassification of the images for the years 1988, 2000, and 2010 into vegetation and non-vegetation classes. Vegetation cover from 1988 to 2022 was classified based on these maps and using the vegetation index values presented in Table 5.
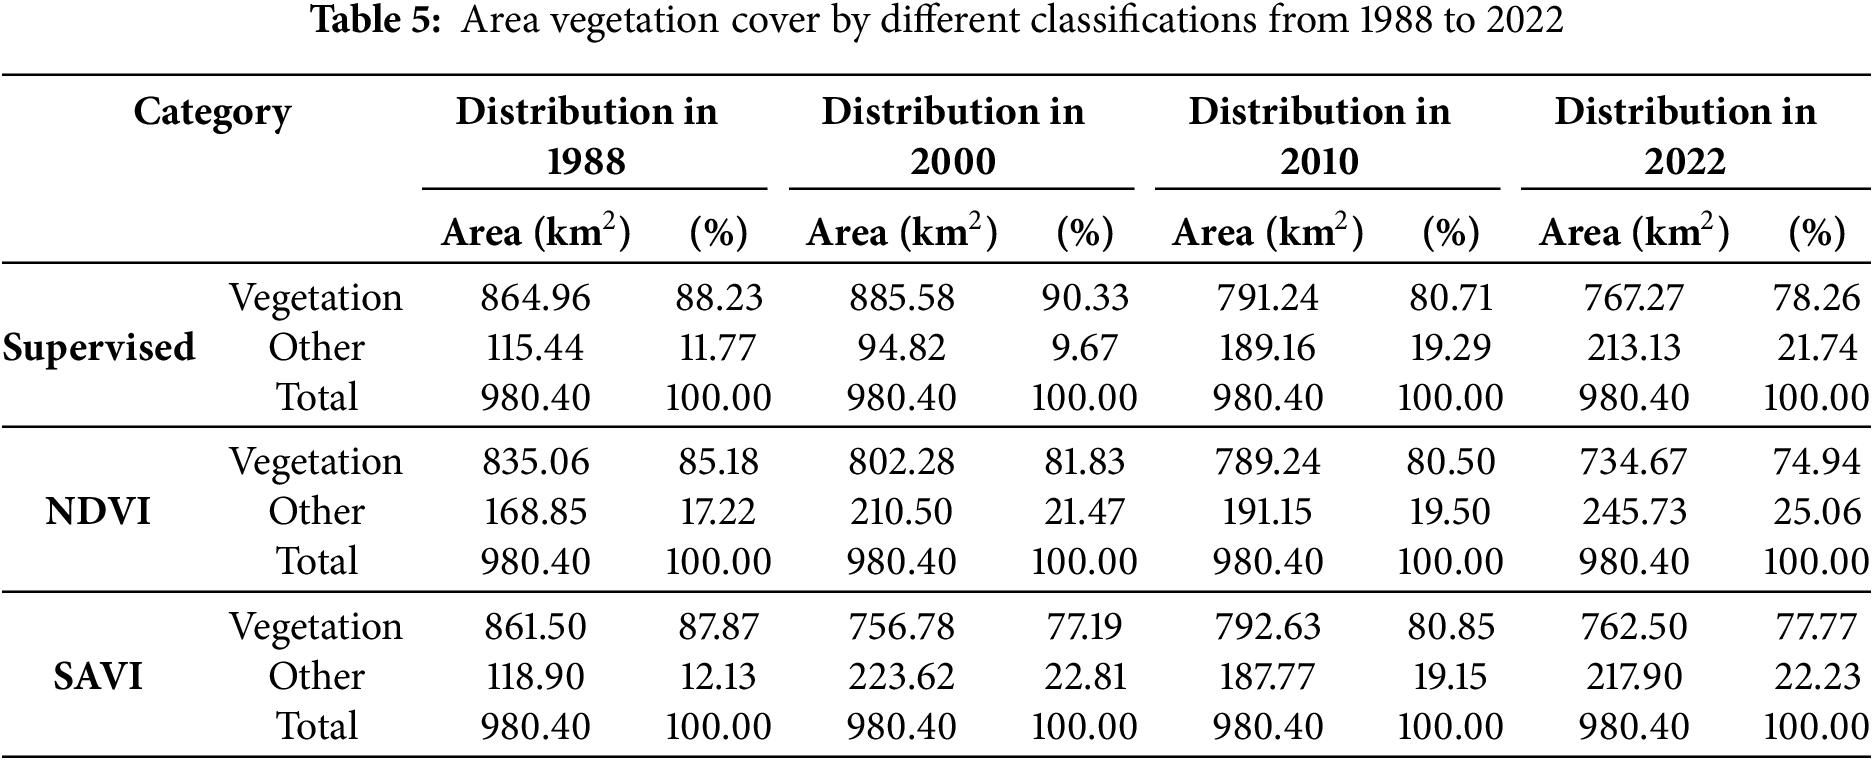
The vegetation area estimated using the NDVI shows a similar downward trend between 1988 and 2022 and a slightly lower estimate than the supervised classification. In contrast, the SAVI results yield an estimate nearly equal to that of the supervised classification and higher than that from the NDVI in 1988, 2010, and 2022 and much lower in the year 2000 than that of the NDVI index and supervised classification (Fig. 9). The classification results for the year 2000 may have had apparently less vegetation because SAVI ignored the soil reflectivity. Overall, we can conclude from this analysis that vegetation indices can be used to detect and monitor vegetation cover in the study area, especially for rapidly assessing vegetation cover changes [38–41].
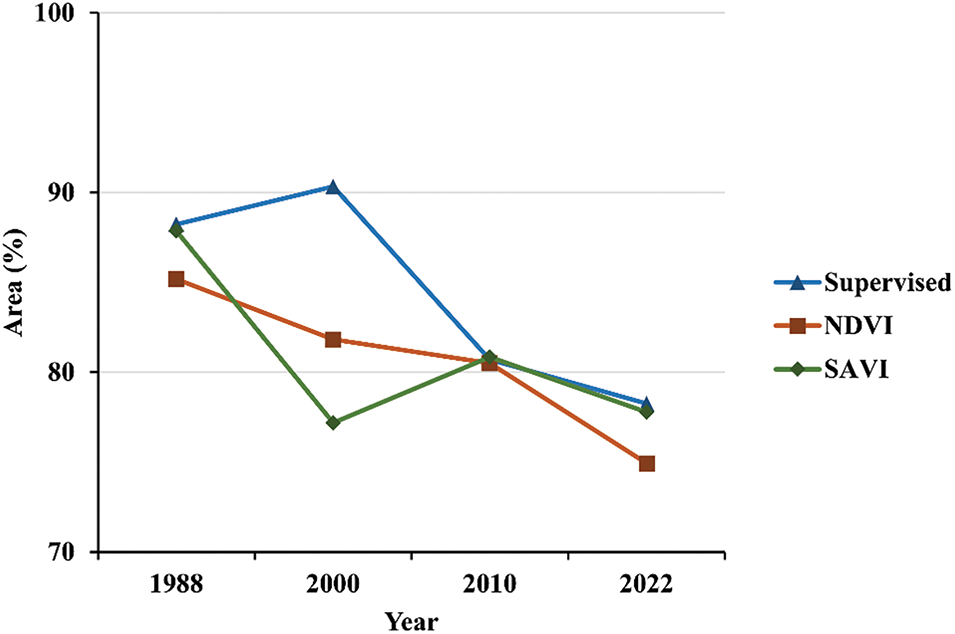
Figure 9: Comparison of vegatation cover from 1988 to 2022 through NDVI, SAVI and supervised classification
3.5 The Influencing Factors of Vegetation Change
Climate change is an important factor influencing vegetation changes in the study area. However, human activities also represent a key factor relating to spatial changes, quantity, and distribution of vegetation [42,43]. Human impacts on land use patterns and usage types are reflected in changes in surface vegetation cover over time. To allow Da Nang to become a modern, highly developed, industrialized, high-service city, the Vietnamese government has promoted the construction of works such as bridges, ports, roads, expressways, industrial parks, and public works areas. While such policies aim to modernize Da Nang, they have often prioritized infrastructure development over environmental conservation. Greening initiatives, such as urban afforestation programs, struggle to keep pace with the rapid conversion of vegetated areas into built-up spaces [4]. Furthermore, weak enforcement of zoning laws and land-use regulations has allowed unauthorized land conversions, particularly in peri-urban regions, intensifying vegetation loss [44]. Therefore, the processes of urbanization and socio-economic development have rapidly changed the urban space of Da Nang. Active human intervention in vegetation change is associated with urbanization, thus, changes in vegetation indicate both vegetation degradation in the urban area’s periphery and improvement in the city’s central area. Economic reforms, such as Vietnam’s Doi Moi policy, significantly accelerated industrialization and infrastructure expansion, leading to large-scale land conversion in peri-urban areas [37]. Moreover, population growth and increased urban migration heightened the demand for housing and industrial parks, exacerbating vegetation loss in the city’s outskirts. The rising economic value of timber has fueled illegal deforestation, particularly in areas with high ecological value, further reducing vegetation cover [44]. Additionally, due to the increased value of precious wood, illegal deforestation activities have increased, contributing to the observed reduction in the extent of vegetated areas.
3.6 Limitations and Potential Research
This study has several limitations that should be acknowledged. First, the use of Landsat imagery with a spatial resolution of 30 m imposes constraints on detecting fine-scale vegetation changes, particularly in heterogeneous landscapes or rapidly urbanizing areas. Higher-resolution imagery could offer more detailed insights. Second, while accuracy assessments were conducted, spectral similarities among certain land cover types, such as bare soil and built-up areas, may have introduced misclassifications. Advanced classification algorithms or the integration of ground-truth data could enhance accuracy. Third, the temporal gaps between the selected years (1988, 2000, 2010, and 2022) may overlook short-term vegetation dynamics; more frequent temporal data would provide a continuous understanding of these changes. Additionally, the study qualitatively highlights urbanization and socio-economic development as primary drivers of vegetation changes but does not quantitatively distinguish their impacts from those of natural factors like climate change. Lastly, while climate variability is acknowledged as an influencing factor, detailed integration of climate data, such as trends in temperature and precipitation, was not conducted. Future research could address these limitations by utilizing high-resolution satellite imagery, such as Sentinel-2 or UAV data, and employing advanced machine learning algorithms like Random Forest or Deep Learning for improved classification accuracy. Furthermore, incorporating detailed climate models, socio-economic data, and ecosystem service assessments would enhance the understanding of vegetation dynamics and their implications. Policy-oriented research evaluating the effectiveness of urban development strategies and afforestation initiatives could provide actionable recommendations for sustainable urban planning in Da Nang city.
This study utilized multispectral and multitemporal satellite imagery from Landsat 5-TM and Landsat 9-OLI/TIRS to monitor and assess the dynamics of LULC changes in Da Nang city between 1988 and 2022. Four primary LULC classes were identified: water, vegetation, built-up land, and bare soil/rock. The results reveal that the built-up area expanded by 120.12 km2 (12.25%) during the study period, driven by urbanization and economic growth, which led to a surge in construction activities. Conversely, vegetation cover declined by 97.69 km2 (9.96%) over the past three decades, highlighting the environmental impact of urban expansion. Regression analysis demonstrated a significant positive correlation between the decrease in vegetation area and the increase in built-up land. The study also underscores that Da Nang has undergone substantial LULC changes during the analysis period. The NDVI, SAVI, and NDWI indices proved to be effective tools for identifying and quantifying significant changes in land cover characteristics between 1988 and 2022. The findings emphasize the critical role of vegetation in ensuring ecosystem sustainability, calling for the implementation of afforestation policies to enhance vegetation cover. This study provides a valuable foundation for urban planning, policy formulation, and long-term development strategies aimed at promoting sustainable growth in Da Nang city while preserving its green vegetation resources.
Acknowledgement: The authors would like to thank the editor and anonymous reviewers for their thoughtful comments and efforts toward improving our manuscript.
Funding Statement: The authors received no specific funding for this study.
Author Contributions: The authors confirm contribution to the paper as follows: Conceptualization, Bui Bao Thien; methodology, Bui Bao Thien and Vu Thi Phuong; software, Bui Bao Thien; validation, Bui Bao Thien; formal analysis, Bui Bao Thien and Vu Thi Phuong; investigation, Vu Thi Phuong; resources, Bui Bao Thien and Vu Thi Phuong; data curation, Bui Bao Thien and Vu Thi Phuong; visualization, Bui Bao Thien and Vu Thi Phuong; writing—original draft preparation, Bui Bao Thien; writing—review and editing, Bui Bao Thien. All authors reviewed the results and approved the final version of the manuscript.
Availability of Data and Materials: The data that support the findings of this study are available from the corresponding author, Bui Bao Thien, upon reasonable request.
Ethics Approval: Not applicable.
Conflicts of Interest: The authors declare no conflicts of interest to report regarding the present study.
References
1. Youssef NAE, Tonbol K, Hassaan MA, Mandour A, El-Sikaily A, Elshazly A, et al. Blue carbon assessment in Avicennia marina sediments and vegetation along the Red Sea Coast of Egypt: improving methods and insights. Cont Shelf Res. 2024;280:105299. doi:10.1016/j.csr.2024.105299. [Google Scholar] [CrossRef]
2. Yu Y, Zhao W, Martinez-Murillo JF, Pereira P. Loess Plateau: from degradation to restoration. Sci Total Environ. 2020;738:140206. doi:10.1016/j.scitotenv.2020.140206. [Google Scholar] [PubMed] [CrossRef]
3. Shi S, Yu J, Wang F, Wang P, Zhang Y, Jin K. Quantitative contributions of climate change and human activities to vegetation changes over multiple time scales on the Loess Plateau. Sci Total Environ. 2021;755(2):142419. doi:10.1016/j.scitotenv.2020.142419. [Google Scholar] [PubMed] [CrossRef]
4. Ma B, Wang S, Mupenzi C, Li H, Ma J, Li Z. Quantitative contributions of climate change and human activities to vegetation changes in the Upper White Nile River. Remote Sens. 2021;13(18):3648. doi:10.3390/rs13183648. [Google Scholar] [CrossRef]
5. Sun YL, Shan M, Pei XR, Zhang XK, Yang YL. Assessment of the impacts of climate change and human activities on vegetation cover change in the Haihe River basin, China. Phys Chem Earth Parts A/B/C. 2020;115(7):102834. doi:10.1016/j.pce.2019.102834. [Google Scholar] [CrossRef]
6. Kumar S, Jain K. A multi-temporal Landsat data analysis for land-use/land-cover change in Haridwar Region using remote sensing techniques. Procedia Comput Sci. 2020;171(6):1184–93. doi:10.1016/j.procs.2020.04.127. [Google Scholar] [CrossRef]
7. Kafy AA, Naim MNH, Subramanyam G, Ahmed NU, Al Rakib A, Kona MA, et al. Cellular Automata approach in dynamic modelling of land cover changes using RapidEye images in Dhaka, Bangladesh. Environ Chall. 2021;4(2):100084. doi:10.1016/j.envc.2021.100084. [Google Scholar] [CrossRef]
8. Leta MK, Demissie TA, Tränckner J. Hydrological responses of watershed to historical and future land use land cover change dynamics of Nashe watershed, Ethiopia. Water. 2021;13(17):2372. doi:10.3390/w13172372. [Google Scholar] [CrossRef]
9. Ewane BE, Lee HH. Assessing land use/land cover change impacts on the hydrology of Nyong River Basin. Cameroon J Mt Sci. 2020;17(1):50–67. doi:10.1007/s11629-019-5611-8. [Google Scholar] [CrossRef]
10. Clerici N, Cote-Navarro F, Escobedo FJ, Rubiano K, Villegas JC. Spatio-temporal and cumulative effects of land use-land cover and climate change on two ecosystem services in the Colombian Andes. Sci Total Environ. 2019;685(2):1181–92. doi:10.1016/j.scitotenv.2019.06.275. [Google Scholar] [PubMed] [CrossRef]
11. Damaneh HE, Khosravi H, Habashi K, Eskandari Damaneh H, Tiefenbacher JP. The impact of land use and land cover changes on soil erosion in western Iran. Nat Hazards. 2022;110(3):21851–2205. doi:10.1007/s11069-021-05032-w. [Google Scholar] [CrossRef]
12. Furukawa F, Morimoto J, Yoshimura N, Kaneko M. Comparison of conventional change detection methodologies using high-resolution imagery to find forest damage caused by typhoons. Remote Sens. 2020;12(19):3242. doi:10.3390/rs12193242. [Google Scholar] [CrossRef]
13. Cao Z, Li Y, Liu Y, Chen Y, Wang Y. When and where did the Loess Plateau turn green? Analysis of the tendency and breakpoints of the normalized difference vegetation index. Land Degrad Dev. 2018;29(1):162–75. doi:10.1002/ldr.2852. [Google Scholar] [CrossRef]
14. Mensah AA, Sarfo DA, Partey ST. Assessment of vegetation dynamics using remote sensing and GIS: a case of Bosomtwe Range Forest Reserve, Ghana. Egypt J Remote Sens Space Sci. 2019;22(2):145–54. doi:10.1016/j.ejrs.2018.04.004. [Google Scholar] [CrossRef]
15. Frick A, Tervooren S. A framework for the long-term monitoring of urban green volume based on multi-temporal and multi-sensoral remote sensing data. J Geovisualization Spat Anal. 2019;3(1):6. doi:10.1007/s41651-019-0030-5. [Google Scholar] [CrossRef]
16. Trofymchuk O, Yakovliev Y, Klymenko V, Anpilova Y. Geomodeling and monitoring of pollution of waters and soils by the earth remote sensing. Int Multidiscipl Sci GeoConf: SGEM. 2019;19(1.4):197–204. doi:10.5593/sgem2019V/1.4/S02.025. [Google Scholar] [CrossRef]
17. Lechner AM, Foody GM, Boyd DS. Applications in remote sensing to forest ecology and management. One Earth. 2020;2(5):405–12. doi:10.1016/j.oneear.2020.05.001. [Google Scholar] [CrossRef]
18. Gao BC. NDWI—a normalized difference water index for remote sensing of vegetation liquid water from space. Remote Sens Environ. 1996;58(3):257–66. doi:10.1016/S0034-4257(96)00067-3. [Google Scholar] [CrossRef]
19. Karmaoui A, Moumane A, El Jaafari S, Menouni A, Al Karkouri J, Yacoubi M, et al. Thirty years of change in the land use and land cover of the Ziz Oases (Pre-Sahara of Morocco) combining remote sensing, GIS, and field observations. Land. 2023;12(12):2127. doi:10.3390/land12122127. [Google Scholar] [CrossRef]
20. Tucker CJ. Red and photographic infrared linear combinations for monitoring vegetation. Remote Sens Environ. 1979;8(2):127–50. doi:10.1016/0034-4257(79)90013-0. [Google Scholar] [CrossRef]
21. Jensen JR. Introductory digital image processing: a remote sensing perspective. 2nd ed. Hillsdale, NJ, USA: Prentice-Hall Inc.; 1996. [Google Scholar]
22. Anderson JR, Hardy EE, Roach JT, Witmer RE. A land use and land cover classification system for use with remote sensor data. Report. Professional Paper 964. Washington, DC, USA: U.S. Government Publishing Office; 1976. [Google Scholar]
23. Kumar V, Agrawal S. A multi-layer perceptron-Markov chain based LULC change analysis and prediction using remote sensing data in Prayagraj district, India. Environ Monit Assess. 2023;195(5):619. doi:10.1007/s10661-023-11205-w. [Google Scholar] [PubMed] [CrossRef]
24. Lillesand T, Kiefer R, Chipman J. Remote sensing and image interpretation. 5th ed. Hoboken, NJ, USA: Wiley & Sons Ltd.; 2004. [Google Scholar]
25. Pande CB, Moharir KN, Khadri SFR. Assessment of land-use and land-cover changes in Pangari watershed area (MSIndia, based on the remote sensing and GIS techniques. Appl Water Sci. 2021;11(6):96. doi:10.1007/s13201-021-01425-1. [Google Scholar] [CrossRef]
26. Rimal B, Rijal S, Kunwar R. Comparing support vector machines and maximum likelihood classifiers for mapping of urbanization. J Indian Soc Remote Sens. 2020;48(1):71–9. doi:10.1007/s12524-019-01056-9. [Google Scholar] [CrossRef]
27. Dash P, Sanders SL, Parajuli P, Ouyang Y. Improving the accuracy of land use and land cover classification of landsat data in an agricultural watershed. Remote Sens. 2023;15(16):4020. doi:10.3390/rs15164020. [Google Scholar] [CrossRef]
28. Dubertret F, Le Tourneau FM, Villarreal ML, Norman LM. Monitoring annual land use/land cover change in the Tucson Metropolitan area with Google Earth Engine (1986–2020). Remote Sens. 2022;14(9):2127. doi:10.3390/rs14092127. [Google Scholar] [CrossRef]
29. Thien BB, Phuong VT. Modeling and assessing spatial and temporal changes in recent agricultural land-use in Ben Tre province, Vietnam. Environ Earth Sci. 2024;83(12):371. doi:10.1007/s12665-024-11682-3. [Google Scholar] [CrossRef]
30. Huete AR. A soil-adjusted vegetation index (SAVI). Remote Sens Environ. 1988;25(3):295–309. doi:10.1016/0034-4257(88)90106-X. [Google Scholar] [CrossRef]
31. Huete AR. Vegetation indices, remote sensing and forest monitoring. Geogr Compass. 2012;6(9):513–32. doi:10.1111/j.1749-8198.2012.00507.x. [Google Scholar] [CrossRef]
32. Cao L, Liu T, Wei L. A comparison of multi-resource remote sensing data for vegetation indices. IOP Conf Series: Earth Environ Sci. 2014;17(1):012067. doi:10.1088/1755-1315/17/1/012067. [Google Scholar] [CrossRef]
33. Hu P, Sharifi A, Tahir MN, Tariq A, Zhang L, Mumtaz F, et al. Evaluation of vegetation indices and phenological metrics using time-series modis data for monitoring vegetation change in Punjab, Pakistan. Water. 2021;13(18):2550. doi:10.3390/w13182550. [Google Scholar] [CrossRef]
34. Thien BB, Phuong VT, Huong DTV. Investigating land cover changes and their impact on land surface temperature in Tay Ninh province, Vietnam. Environ Monit Assess. 2025;197(1):75. doi:10.1007/s10661-024-13519-9. [Google Scholar] [PubMed] [CrossRef]
35. Kumari N, Srivastava A, Kumar S. Hydrological analysis using observed and satellite-based estimates: case study of a Lake Catchment in Raipur, India. J Indian Soc Remote Sens. 2022;50(1):115–28. doi:10.1007/s12524-021-01463-x. [Google Scholar] [CrossRef]
36. Orimoloye IR, Kalumba AM, Mazinyo SP, Nel W. Geospatial analysis of wetland dynamics: Wetland depletion and biodiversity conservation of Isimangaliso Wetland, South Africa. J King Saud Univ-Sci. 2020;32(1):90–6. doi:10.1016/j.jksus.2018.03.004. [Google Scholar] [CrossRef]
37. Huong DTV, Thu BT, Giang NB, Linh NHK. Impacts of urban expansion on landscape pattern changes: a case study of Da Nang city, Vietnam. Vol. 2. In: Nguyen AT, Hens L, editors. Global changes and sustainable development in asian emerging market economies. Cham: Springer; 2022. p. 385–403. doi:10.1007/978-3-030-81443-4_23. [Google Scholar] [CrossRef]
38. Shi L, Fan H, Yang L, Jiang Y, Sun Z, Zhang Y. NDVI-based spatial and temporal vegetation trends and their response to precipitation and temperature changes in the Mu Us Desert from 2000 to 2019. Water Sci Technol. 2023;88(2):430–42. doi:10.2166/wst.2023.212. [Google Scholar] [PubMed] [CrossRef]
39. Islam MR, Khan MNI, Khan MZ, Roy B. A three decade assessment of forest cover changes in Nijhum dwip national park using remote sensing and GIS. Environ Chall. 2021;4:100162. doi:10.1016/j.envc.2021.100162. [Google Scholar] [CrossRef]
40. Fern RR, Foxley EA, Bruno A, Morrison ML. Suitability of NDVI and OSAVI as estimators of green biomass and coverage in a semi-arid rangeland. Ecol Indic. 2018;94(2):16–21. doi:10.1016/j.ecolind.2018.06.029. [Google Scholar] [CrossRef]
41. Thien BB, Phuong VT. Multi-temporal analysis of land use and land cover change detection in Binh Duong province, Vietnam using geospatial techniques. Adv Geod Geoinform. 2024;73(2):e54. doi:10.24425/agg.2024.150683. [Google Scholar] [CrossRef]
42. Kalisa W, Igbawua T, Henchiri M, Ali S, Zhang S, Bai Y, et al. Assessment of climate impact on vegetation dynamics over East Africa from 1982 to 2015. Sci Rep. 2019;9(1):16865. doi:10.1038/s41598-019-53150-0. [Google Scholar] [PubMed] [CrossRef]
43. Shi Y, Jin N, Ma X, Wu B, He Q, Yue C, et al. Attribution of climate and human activities to vegetation change in China using machine learning techniques. Agric For Meteorol. 2020;294(1):108146. doi:10.1016/j.agrformet.2020.108146. [Google Scholar] [CrossRef]
44. Thien BB, Yachongtou B, Phuong VT. Long-term monitoring of forest cover change resulting in forest loss in the capital of Luang Prabang province, Lao PDR. Environ Monit Assess. 2023;195(8):947. doi:10.1007/s10661-023-11548-4. [Google Scholar] [PubMed] [CrossRef]
Cite This Article
 Copyright © 2025 The Author(s). Published by Tech Science Press.
This work is licensed under a Creative Commons Attribution 4.0 International License , which permits unrestricted use, distribution, and reproduction in any medium, provided the original work is properly cited.
 Downloads
 Citation Tools