
 Submit a Paper
 Propose a Special lssue
 Open Access
ARTICLE
Forest Fire Severity Level Using dNBR Spectral Index
1 School of Geomatics Science and Natural Resources, College of Built Environment, Universiti Teknologi MARA, Shah Alam Campus, Shah Alam, 40450, Selangor, Malaysia
2 School of Geomatics Science and Natural Resources, College of Built Environment, Universiti Teknologi MARA, Arau Campus, Arau, 02600, Perlis, Malaysia
* Corresponding Authors: Noraain Mohamed Saraf. Email: ; Abdul Rauf Abdul Rasam. Email:
Revue Internationale de Géomatique 2025, 34, 89-101. https://doi.org/10.32604/rig.2025.057562
Received 21 August 2024; Accepted 24 January 2025; Issue published 24 February 2025
 View Full Text
 Download PDF
Abstract
Forest fires are contributing significantly to the acceleration of deforestation. Monitoring and mapping these fires are crucial, and remote sensing technology has proven effective for this purpose. This research employs remote sensing methods to evaluate the severity of a forest fire in Kampung Balai Besar, Dungun. The incident, covering a 23-hectare area, occurred on 15 June 2021. Initial data processing utilized Sentinel-2 satellite images from 14 June 2021 (pre-fire) and 19 June 2021 (post-fire). The extent and severity of the fire were assessed using the Normalized Burn Ratio (NBR) index derived from satellite images. Different levels of burn severity were classified based on the extracted NBR, and classes of the calculated index value were generated accordingly. The severity level and intensity of the burn were analyzed using the Difference Normalized Burn Ratio (dNBR) index. This spectral index aided in assessing the severity of the forest fire in Kampung Balai Besar. The findings revealed that 13.9% of the area experienced low severity burns, 47.2% had moderate to high severity burns, and 38.9% exhibited high severity burns. In summary, areas with moderate to high and high severity burns showed more significant damage, while unburned areas displayed higher vegetation productivity. The study successfully identified the burned area in Kampung Balai Besar, providing valuable information for early decision-making and effective forest management planning.Keywords
Forests are essential for maintaining environmental balance. Natural forest provides a habitat for wild animals and plants and is a crucial indicator of a region’s ecological health [1]. Forests should be preserved to maintain the natural ecosystem’s equilibrium. High temperatures and prolonged periods of drought, strong winds, soil configuration, and highly flammable plants are all elements that contribute to the greater danger of fire. Forest fires affect approximately 350 million hectares of land yearly because of human activity and natural phenomena [2]. On the other hand, an uncontrollable fire can quickly spread across a broad area and present a risk to society and the environment. The growing frequency and severity of forest fires in recent decades have prompted local governments and fire management authorities to advocate for reliable, rapid, and cost-effective fire mapping systems [3].
Furthermore, these fires have become one of the primary factors speeding up the deforestation process, which in turn devastates the natural habitat of the forest and amplifies the impact of environmental disasters, such as flooding. Forest fires also change the topography, degrade the soil, and affect the air quality in the surrounding area [4], further disrupting the delicate balance of ecosystems. As forests are the guardians of the earth’s natural ecological equilibrium, their destruction exacerbates environmental instability. Unfortunately, forest fires are often discovered after they have spread across a large area, making control and extinguishment difficult but not impossible at times [5]. Forest fires release carbon dioxide (CO2) into the atmosphere, leading to catastrophic losses and irreversible environmental and atmospheric damage. The problem with forest fires is that such incidents frequently occur in isolated, abandoned, unmanaged areas that are densely forested, with trees, dry or burned wood, leaves, and other fuel sources.
Additionally, these components contribute to a highly flammable environment, facilitating fire ignition and providing ample fuel for their spread. The situation is further worsened by environmental factors. Given these conditions, it is vital to preserve forests, not only for their resources but also to maintain the balance of the natural ecosystem. The rising frequency of fires in these vulnerable areas underscores the importance of proactive forest management and conservation efforts to reduce fire hazards and protect ecosystem stability. Therefore, to effectively manage these risks, accurate mapping and monitoring of forest fires are essential.
Since the development of imaging technology that uses infrared (IR) radiation [3] for mapping burned areas, several in-situ and aerial methods have been introduced to improve fire detection and monitoring. Nevertheless, the inconsistency in data acquisition and mapping methodologies across different agencies presents a challenge, making it difficult to examine performance in regional, continental, or global regions [3]. Satellite remote sensing, as opposed to ground-based, airborne approaches, may deliver large-scale and cost-effective satellite remote sensing in short revisit times, making it more ideal for establishing a systematic and worldwide fire mapping system [3]. In addition, remote sensing and geographic information system (GIS) research have sparked studies that produce forest fire risk maps in many regions in recent years, according to substantial developments in remote sensing and GIS research [1]. This is due to the fact that GIS provides a variety of tools for incorporating spatial data from a variety of factors that affect forest fires. In general, various factors influence the occurrence and spread of forest fires, including climate, vegetation, topographical features, and human activity [1].
Building on this, the study focuses on assessing the severity level of the forest fire in Kampung Balai Besar, Dungun, using remote sensing techniques. Specifically, the objectives of this study are to estimate the Normalized Burn Ratio (NBR) index for both the pre-fire and post-fire events, and to analyze the burn severity levels of the forest fire in Kampung Balai Besar, Dungun, Terengganu. This study utilized remote sensing data, with the results assisting in early decision-making and effective forest management planning. While this approach will significantly reduce costs, workforce requirements, and time needed for plantation monitoring, it will still have a significant impact on improving forest management.
Forests are a priceless natural resource, particularly for flora and fauna. Cengal, meranti, belian, and teak are all valuable timbers sourced from the forest. For the furniture sector, these woods are precious. Our lives would be incomplete without the presence of the forest. Rainwater catchment areas can be found in the forest. The forest also provides a habitat to various types of vegetation and wildlife. Because extinction of flora and fauna is linked to forests, the forest has the potential to save them. In this way, the ecology is kept in balance indirectly. On the other hand, forests play a part in reducing global warming. However, human activities are the leading cause of forest fires. Nevertheless, forest fires can also be dangerous regarding vegetation structures, topographical aspects, and climatic changes [6].
Many factors and influences can contribute to forest fires, with human activity being one of the primary sources. Typically, fires are intentionally ignited to prepare the soil for future cultivation by clearing and neutralizing it. Additionally, passing motorists and pedestrians could leave campfires or cigarettes burning in the bush as potential sources of ignition that can burn gasoline [7]. Fire emissions significantly impact atmospheric composition, which has a direct effect on global climate as well as human health and security [8]. Dry weather, or weather that is not accompanied by rain, is the most common cause of forest fires. Most forest fires started by humans are unintentional. The use of flames to clear the soil, which can occasionally be controlled, is one of the essential human actions that can trigger forest fires.
Moreover, fire severity has several consequences for the soil in a fire-prone ecosystem. There is a possibility that the low severity has little or no adverse effect on the ground. Still, high combustion levels cause significant loss of organic matter, development of hydrophobicity due to depth, deterioration of soil structure, and soil loss. Soil erosion is probably the most severe ecological threat in the first year after a fire in a heavily burned area, with severe damage in areas such as the Iberian Peninsula, where the risk of potential erosion is very high [9]. Therefore, an early assessment of fire severity is essential to address possible post-fire management strategies aimed at protecting vegetation communities and soil. In West African savannas, frequent fires significantly impact vegetation structure, biodiversity, and carbon balance [10].
In the early decades, forest fire detection monitoring was mainly from fire lookout towers where humans made observations and only required simple technologies. However, this method is less effective due to its vulnerability to human error and exhaustion [11]. Besides, time has become a restrictive issue in analyzing post-fire consequences on vegetation, as well as being more expensive and labor-intensive since the early 1970s [12]. Satellite remote sensing is an essential technological source for gathering post-fire data to overcome such issues and the limited accessibility to the damaged areas. Traditional methods of determining fire severity include costly and time-consuming field surveys, which can be supplemented by satellite remote sensing to overcome these shortcomings [13]. Furthermore, satellite remote sensing technology enables advanced performance and new operational applications for security and risk management. In particular, the Copernicus program and Sentinel mission have been specially developed to support risk monitoring and provide free advanced satellite data (such as Sentinel-2) that can adequately support forest fire monitoring from risk assessment to damage quantification [14].
The twin satellites Sentinel-2A and Sentinel-2B make up the Sentinel-2 constellation with a large swath and high resolution [15]. Sentinel-2A was launched on 23 June 2015, and the first images were obtained a few days later. On 07 March 2017, Sentinel-2B was found. The Sentinel-2 satellites have multispectral imaging instruments (MSI) onboard that can record 13 wide-swath bands [16]. These advanced imaging capabilities make the Sentinel-2 satellites particularly valuable in monitoring environmental disturbances such as fire, which significantly impacts. Fires are an essential ecological process in many forest areas, and changes in their size and severity have a substantial impact on forest structure and wildlife habitats [17]. Therefore, assessing the severity of a fire is very important for explaining and measuring the impact of a fire on vegetation, wildlife habitats, and soil. Estimating the severity of burns based on remote sensing is a powerful tool and needs to be validated in correlation with field data to be helpful.
Determining burned and unburned regions is one of the most crucial stages in forest fire monitoring. The Normalized Burn Ratio (NBR) is defined to highlight areas that have burned and provide a measure of burn severity using satellite imagery data [18]. The formula for NBR is similar to the Normalized Difference Vegetation Index (NDVI); however, it uses both near-infrared (NIR) and short-wave infrared (SWIR) wavelengths instead of just one [19]. The descriptions of vegetation characteristics in the red-edge spectral domain, along with the radiometric response in the SWIR spectral domain, which are widely recognized as effective for identifying burned areas, offer significant benefits to the current Burned Area Index for Sentinel-2 (BAIS2) system. This satellite’s spectrum properties make it a valuable tool for forest fire monitoring with a high potential for differentiating burn severity levels in a fire. Recent research [18,20–22] have shown that the Sentinel-2 spectral indices based on red-edge wavelengths near red, primarily related to variations in chlorophyll content, and red-edge wavelengths near NIR, mostly associated with variations in leaf structure, are the most appropriate for differentiating burn severity. Additionally, it has already been shown that using narrow band NIR rather than broadband NIR to calculate spectral indices for post-fire does not result in appreciable variations [23].
Besides, NBR is a useful indicator for determining the scope and severity of fires by using the Difference Normalized Burn Ratio (dNBR) formula. The dNBR is calculated from the difference between the pre-fire NBR and post-fire NBR obtained from the images, and it may then be used to determine the burn severity. A higher dNBR value indicates more severe damage, while negative dNBR values could indicate regrowth after a fire. Data imaging of pre-fire typically shows low mid-infrared and varying high NIR band values. However, data imaging after a fire reveals very low mid-infrared band values and very high NIR band values. Understanding the spatial pattern of fire severity through mapping can provide valuable insights into the ecological effects of fires.
Mapping of fire severity areas is essential to support fire management in terms of environmental damage, planning strategies and monitoring the restoration of plants [13]. The MSI sensor on Sentinel-2 satellites provides more spectral information, allowing for the development of new indices for forest fire mapping, such as Burned Area Index (BAI) and Normalized Burn Ratio (NBR). These indices have been used on several forest fire cases, for example, in Turkey [8], Italy [13], the Iberian Peninsula [23] and Indonesia [24], showing good performance of the index. The indices are often used with satellite data to analyze and monitor the effects of forest fires, focusing on areas affected by burns. Consequently, this study presents the NBR index, derived from Sentinel-2 spectral bands, to detect burned areas at a 20 m spatial resolution and conducts post-fire mapping for fire severity analysis.
The research methodology has been designed to align with the study’s objectives, starting with the data collection phase. The study utilized Sentinel-2 images as a crucial dataset. The next phase focuses on data processing, beginning with the pre-processing of satellite imagery data. This involves digital image processing by using software such as ERDAS and GIS. Key steps in digital image processing include geometric correction, radiometric correction, image subset creation, and noise reduction. This processing stage is essential for effectively accessing, interpreting, and analyzing the data. Subsequently, the images are used to estimate the Normalized Burn Ratio for analyzing fire severity levels (Fig. 1).
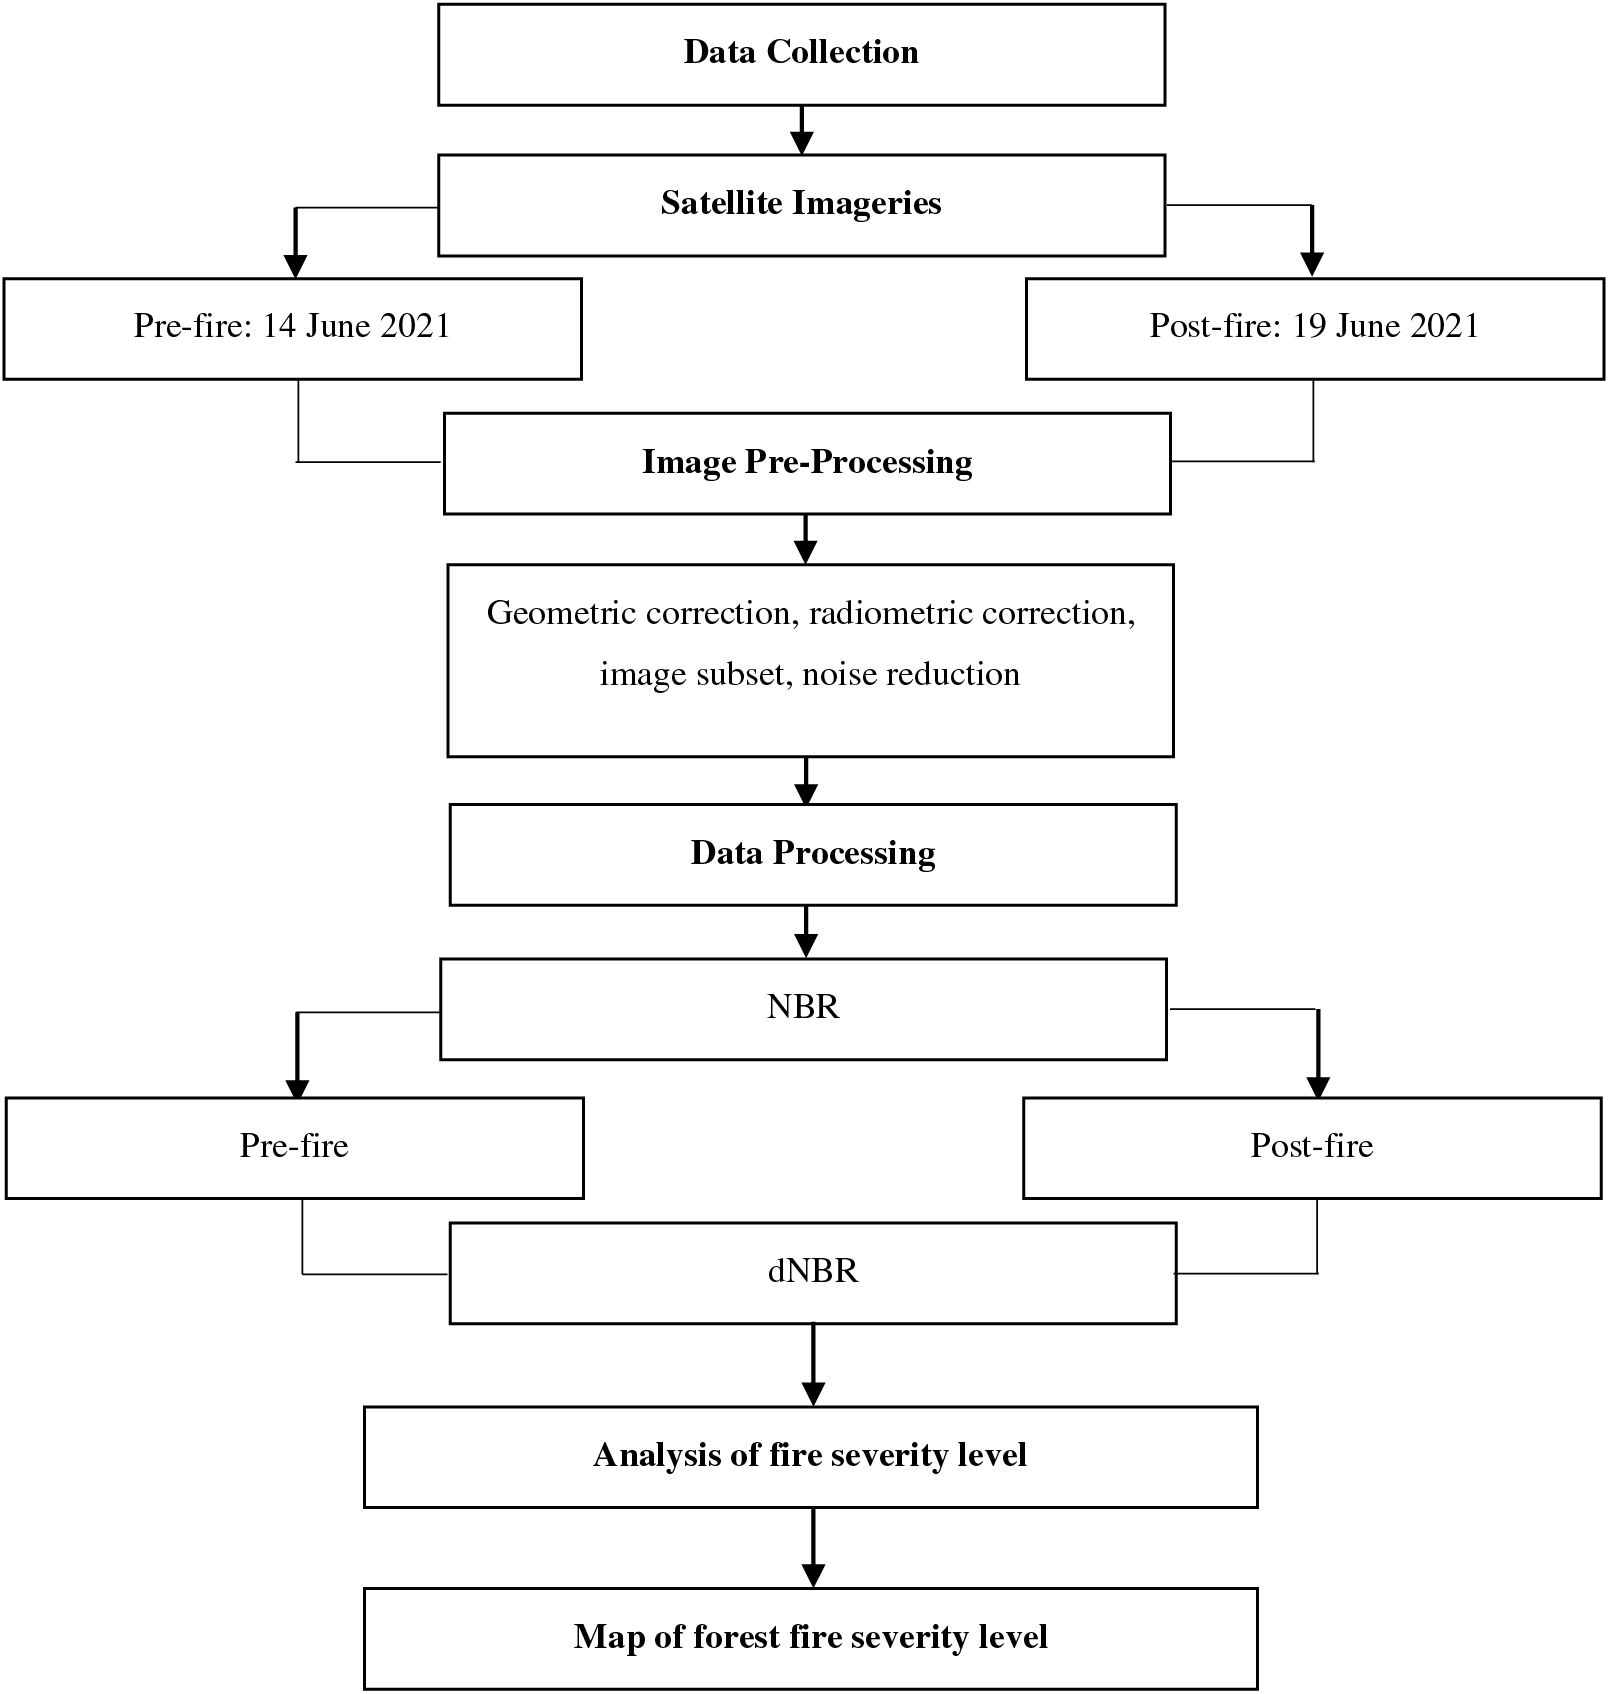
Figure 1: Flowchart of methodology
The study focuses on a forest fire event that occurred in Kampung Balai Besar Forest. This forested region lies within the district of Dungun, Terengganu, Malaysia. The study aims to assess the extent of damage of the fire incident on 15 June 2021, affecting a total area of 36 hectares. The use of remote sensing techniques, particularly the NBR index, aids in mapping and analyzing the extent of the burned area within the forest of Kampung Balai Besar. The study area is also classified as a peat swamp forest, a unique ecosystem with specific environmental conditions, often featuring waterlogged, acidic, and nutrient-poor soils. Due to these conditions, peat swamp forests are highly susceptible to fires, which were particularly prevalent during the study period. Accordingly, this study can assist the forestry department in planning and conserving the forest (Fig. 2).
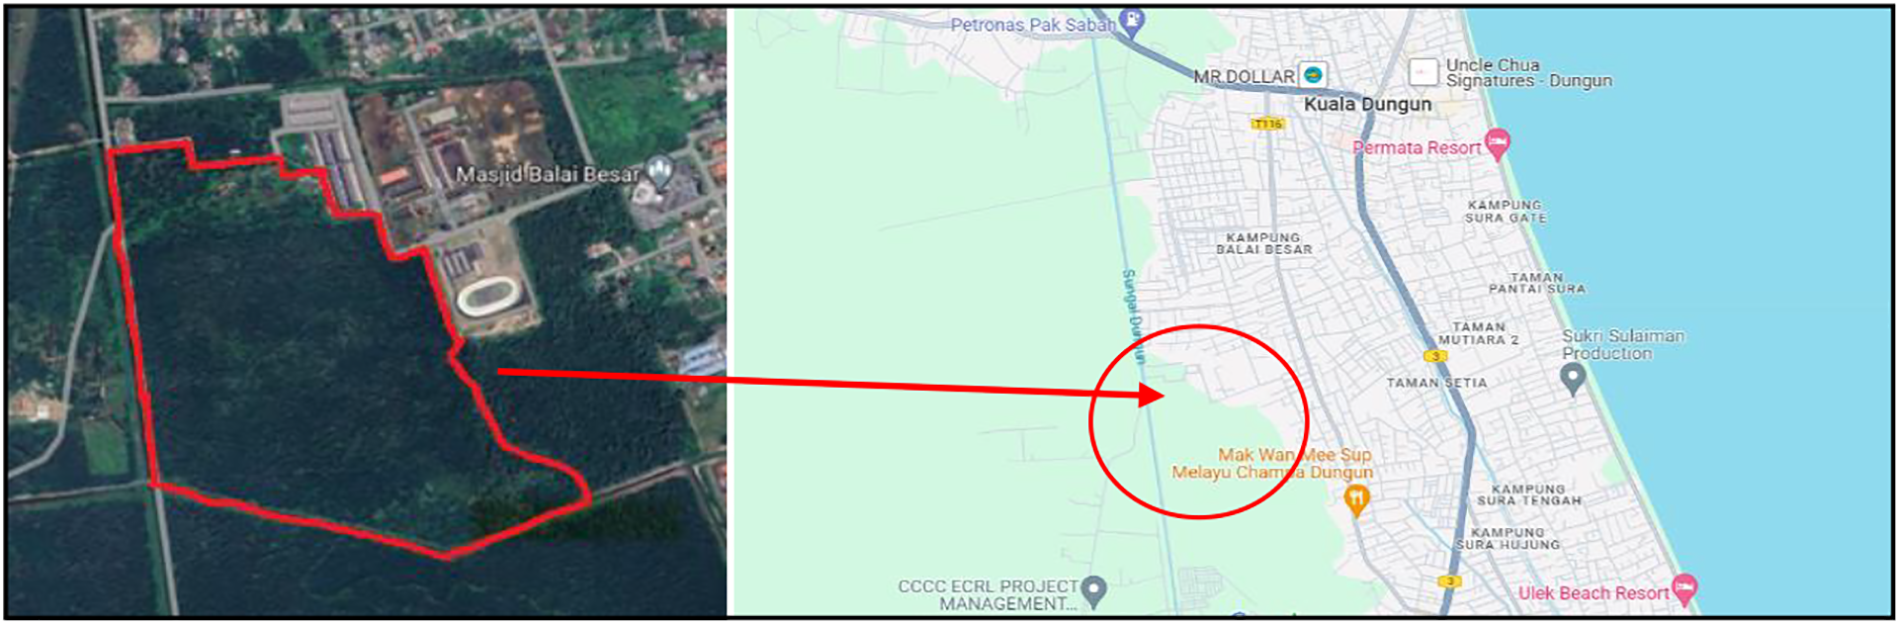
Figure 2: Study area of Kampung Balai Besar Forest, Dungun (Source: Google Earth Pro, 2022)
3.2 Normalized Burn Ratio Index
Two burn indices in respect to the remote sensing index were used in order to identify forest fire regions. The NBR index is used to determine the extent of the burning and to classify its severity within the forest region. The NBR is responsive to changes of forest after a fire, particularly in the NIR and SWIR bands. The NBR index is also used to identify the affected green spaces for this reason. The burn index formula utilized in this study is shown in the equations [25]. The specific formulas were covered in the band math section.
where NBR = Normalized Burn Ratio, B8 = Band NIR, B12 = Band SWIR, dNBR = Differential Normalized Burn Ratio.
3.3 Classification of Burn Severity
In order to determine the fire forest severity in Kampung Balai Besar, Dungun Terengganu, the initial analysis employs the NBR method. NBR is used to identify burned areas and provide a measure of burn severity using satellite imagery data. Sentinel-2 imagery was first converted to GeoTIFF format using the European Space Agency-Sentinel Application Platform (ESA-SNAP) to facilitate further analysis in a GIS software environment. Following this, the data were categorized according to the NBR classes outlined in Table 1.
Healthy vegetation is indicated by a high NBR value, whereas recently burned areas and bare land are indicated by low values. Values near to 0 are typically assigned to non-burnt. However, the United States Geological Survey (USGS) has proposed a classification table to interpret the burn severity [26].
The spatial analyst tool (reclassify) was employed to categorize the range of burn severity. By categorizing the index into their categories of fire degrees, NBR is used to assess the severity of the burns. However, a differential formula (dNBR) is then applied to compare which index performs better in detecting burned areas. The total burned area of each classification is determined. This study analyzes five categories of burn severity for dNBR: unburned, low severity, moderate-low severity, moderate-high severity and high severity. The burn index values were divided into those classes to identify the best division for the index’s value.
The assessment of burned areas is pivotal in understanding the impact of forest fires, and the NBR index serves as a crucial tool for this purpose within the remote sensing environment. As the most commonly employed index for fire-related observations, the NBR index provides valuable insights into the severity and extent of forest fires in Kampung Balai Besar, Dungun, Terengganu.
4.1 Burn Ratio Estimation Using NBR Index
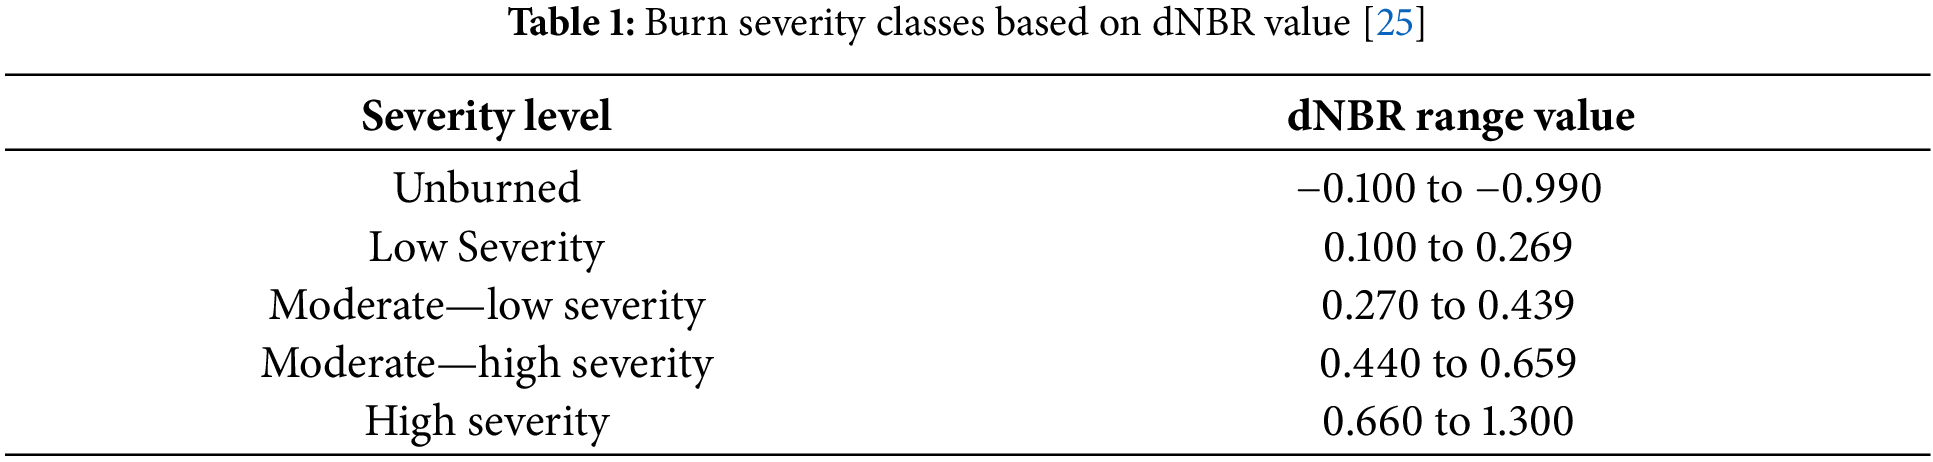
NBR is the most common index that is actively used for fire-related observation using a remote sensing approach. Based on Fig. 3, the image on the left side of the map is a Sentinel-2 image based on the before incident date using a false-colour composite RGB. Meanwhile, on the right side of the map, it shows the image after the incident date. Otherwise, Fig. 4 indicates the results of the NBR index for pre-fire (left) and post-fire images (right). The bright white colour indicates that the area was unburned, while the dark pixel colour on the post-fire image shows that the burned area has been detected.
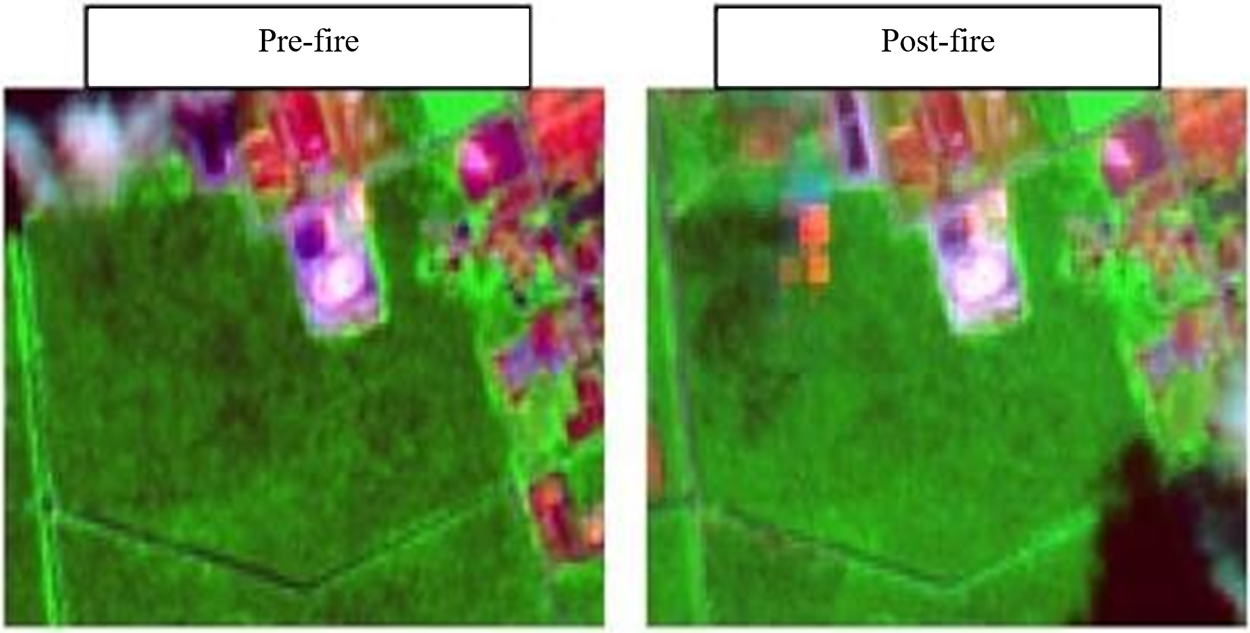
Figure 3: (left) Composite RGB of pre-fire (right) Composite RGB of post-fire
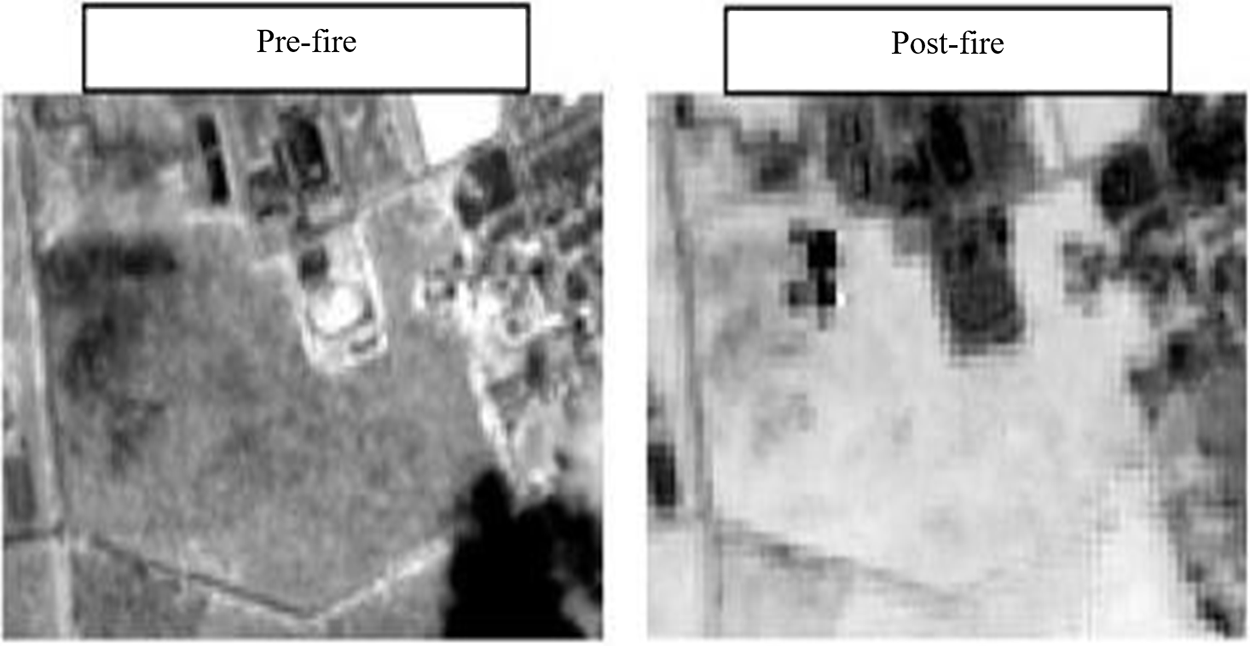
Figure 4: (left) Normalized burn ratio of pre-fire (right) Normalized burn ratio of post-fire
The NBR index utilizes values from the near-infrared (NIR) and short-wave infrared (SWIR) bands by calculating their difference and ratio. This index ranges from −1 to +1. Referring to Table 2, the NBR index classifies the extent of burn severity into five categories: unburned, low severity burn, moderate-low severity burn, moderate-high severity burn, and high-severity burn. It shows the area statistics of pre-NBR and post-NBR in Kampung Balai Besar, Dungun, Terengganu, on 14 June 2021 and 19 June 2021, respectively.
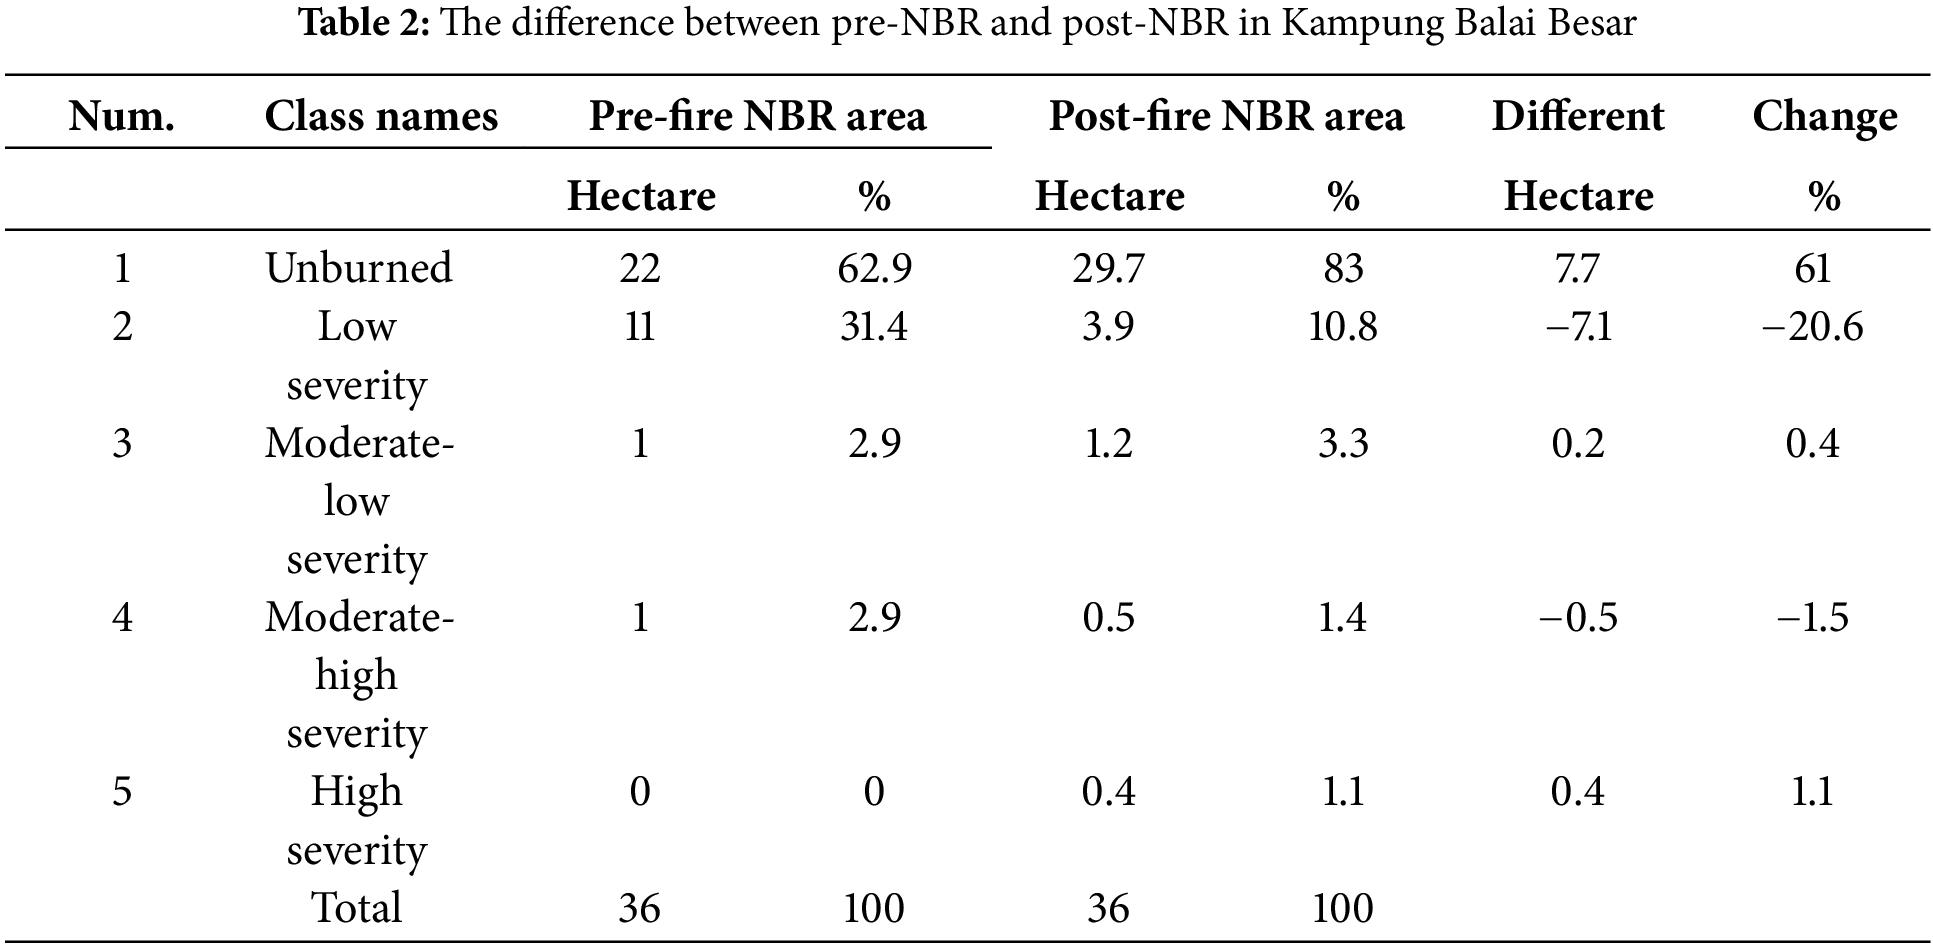
Based on the area statistics of pre-fire and post-fire, NBR values across different fire severity classes, the results are summarized in Table 2. The results of 14 June 2021, only four classes of NBR index for the pre-fire were classified from five categories. High severity areas were absent in the pre-fire image, indicating no prior severe fire impacts. However, it was found that the unburned areas recorded at 22 hectares with 62.9% of the total area, followed by low severity burn comprising 31.4% (11 hectares) of the study area. In comparison, moderate-low and moderate-high severity areas each covered 2.9% (1 hectare) of the total area.
Besides, the area statistic of post-fire NBR (19 June 2021) highlights the distribution of unburned areas that recorded 29.7 hectares with 83% of the total area. Nevertheless, it was found that the low severity burn areas affected 3.9 hectares with 10.8% of the study area, followed by moderate-low severity and moderate-high severity at 1.2 hectares with 3.3% and 0.5 hectares with 1.4%, respectively. Also, the high severity areas made up 0.4 hectares (1.1%) of the area, reflecting fire impacts from the previous.
The detection of burned area from pre-fire on 14 June 2021 and post-fire on 19 June 2021 revealed that the unburned areas experienced a substantial increase from 62.9% to 83% of the total area, indicating minimal fire impact in these areas. Meanwhile, low severity areas showed a significant decrease from 31.4% to 10.8%, reflecting a moderate level of vegetation damage and recovery potential. The moderate-low severity and moderate-high severity zones both showed a slight decrease in NBR from 2.9% to 3.3% and 2.90 % to 1.4%, respectively, which might indicate that the fires caused some vegetation loss, but the damage was not extensive. The high severity class, though minimal in area (having no pre-fire NBR), increased to 0.4 hectares (1.1%) post-fire. This is a net increase of 0.4 hectares (1.1%), which could indicate the establishment of burn scars.
This study assesses the map of burned areas and fire severity using the NBR index. Typically, satellite images taken both before (14 June 2021) and after (19 June 2021) a forest fire are used to calculate the NBR. Fig. 5 provides details on the forest conditions before and after the fire. The red colours represent the burning forest, the yellow colours represent the moderately burning forest and the green colours represent unburned forests. The higher NBR value shows burned areas, while the lower value indicates unburned areas. The results of the areas classified as moderate-low severity, moderate-high severity, and high severity category exhibit minimal damage on the pre-fire map. In contrast, the moderate-low, moderate-high, and high severity categories show varying degrees of damage on the post-fire map. The unburned and low severity categories, however, indicate high vegetation productivity in both the pre-fire and post-fire maps.
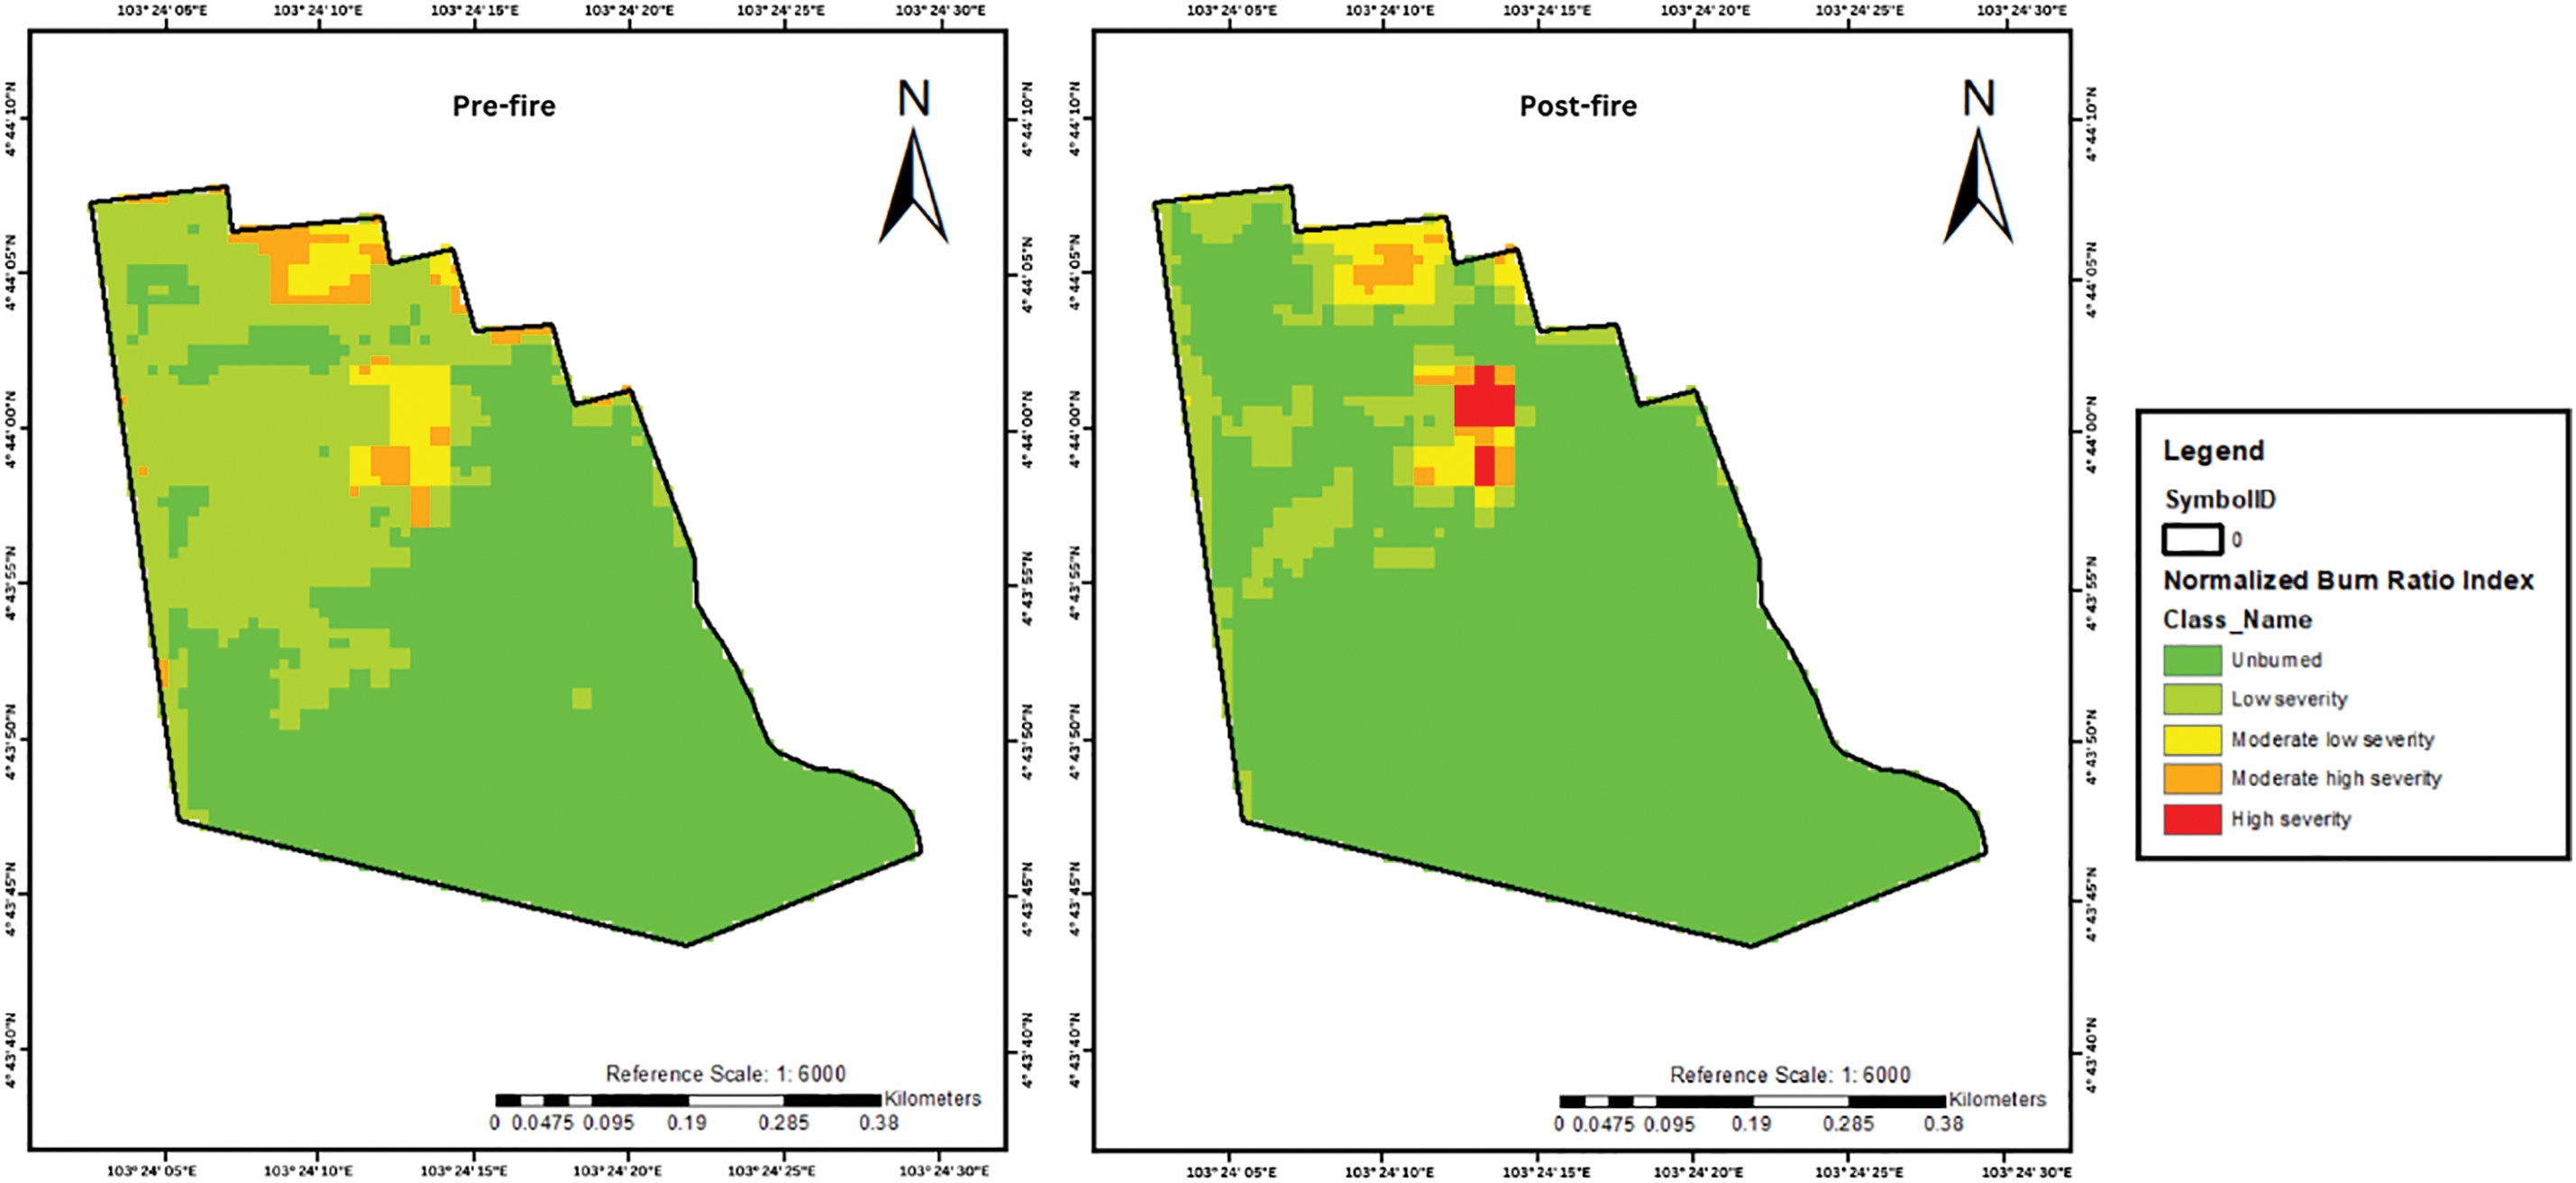
Figure 5: (left) Normalized Burn Ratio classification map of pre-fire; (right) Normalized Burn Ratio classification map of post-fire
4.2 Analysis of Burn Severity Level
The Difference Normalized Burn Ratio (dNBR) was used to assess the fire severity levels in Kampung Balai Besar, Dungun, Terengganu. Table 3 presents the area statistics of burn severity across five classes, detailing the area affected by each severity level and their respective percentage of the total area. The five classes are defined by dNBR value range: Unburned from −0.100 to 0.99, Low Severity from 0.100 to 0.269, Moderate-Low Severity from 0.270 to 0.439, Moderate-High Severity from 0.440 to 0.659, and High Severity from 0.660 to 1.300.
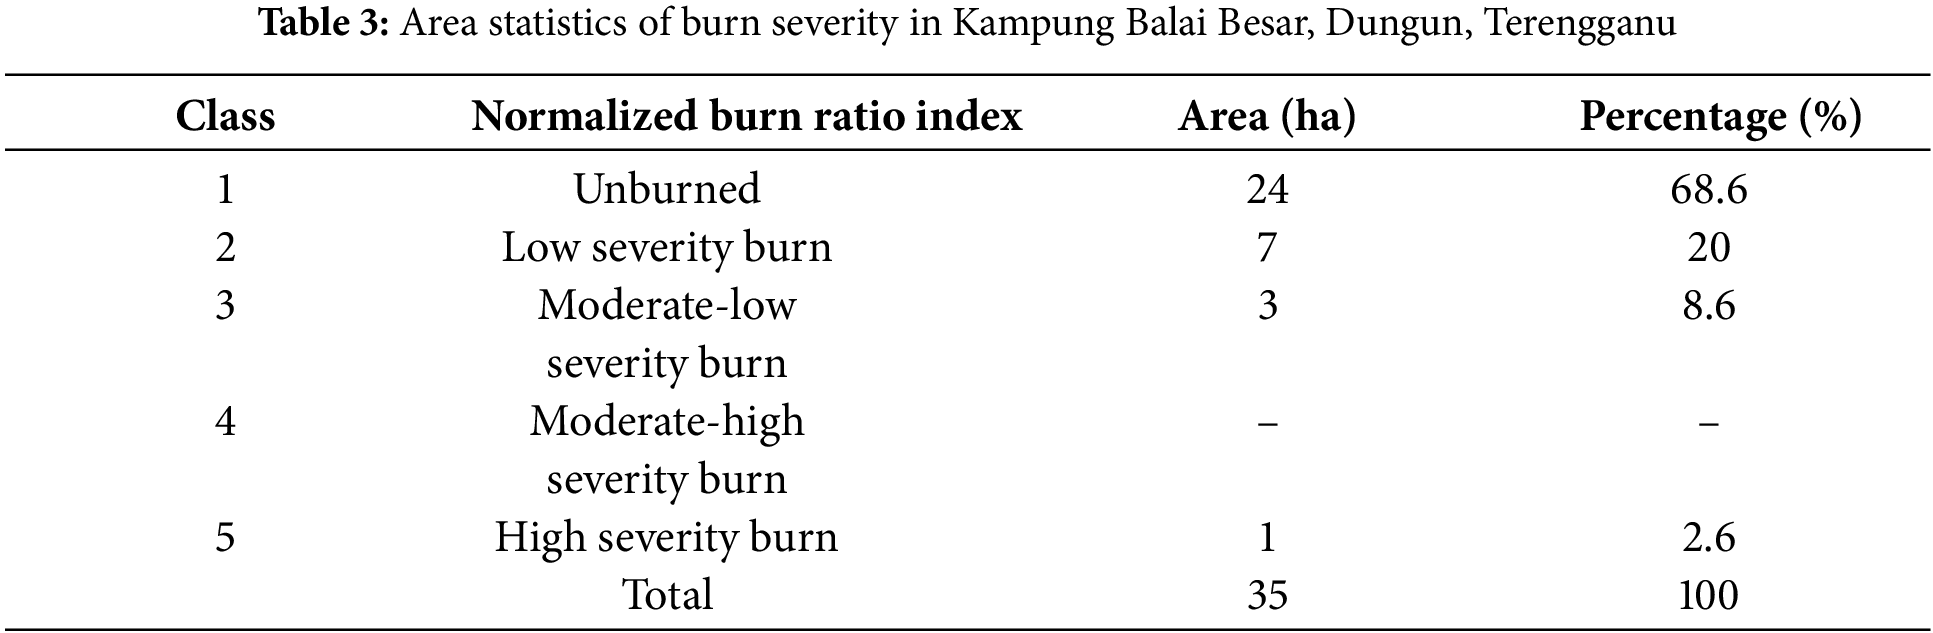
From the results, 68.6% (24 hectares) of the Kampung Balai Besar forest area is categorized as an unburned category. This indicates that a significant proportion of the region remains unaffected by the fire. Areas with low severity burn cover 7 hectares, representing 20% of the total area. These areas experienced a mild fire impact, with limited vegetation damage. Meanwhile, a total of 3 hectares (8.6%) of the area was classified under moderate-low severity burn. This category reflects areas where the fire caused moderate damage. However, there were no areas recorded as moderate-high severity burn category, but only 1 hectare (2.6%) of the total area falls under the high severity burn category. These areas experienced the most intense damage.
Based on the map illustrated in Fig. 6, the results provide a comprehensive overview of the spatial distribution of burn severity in the region. The unburned category indicates unaffected areas from fire; meanwhile, the area of the low severity burns, moderate-low severity, and high severity burn shows minor damage in this study. The green area represents unburned, while the light green area represents low severity burn, the yellow and the orange area represent moderate-low severity burn and moderate-high severity burn, respectively. Besides, the red area represents the high severity burn category. As a final point, the area of intense severity burns corresponds to the moderate-high severity category, while the increased severity burns category shows only minor damage. In contrast, the area of the unburned category reflects higher vegetation productivity.
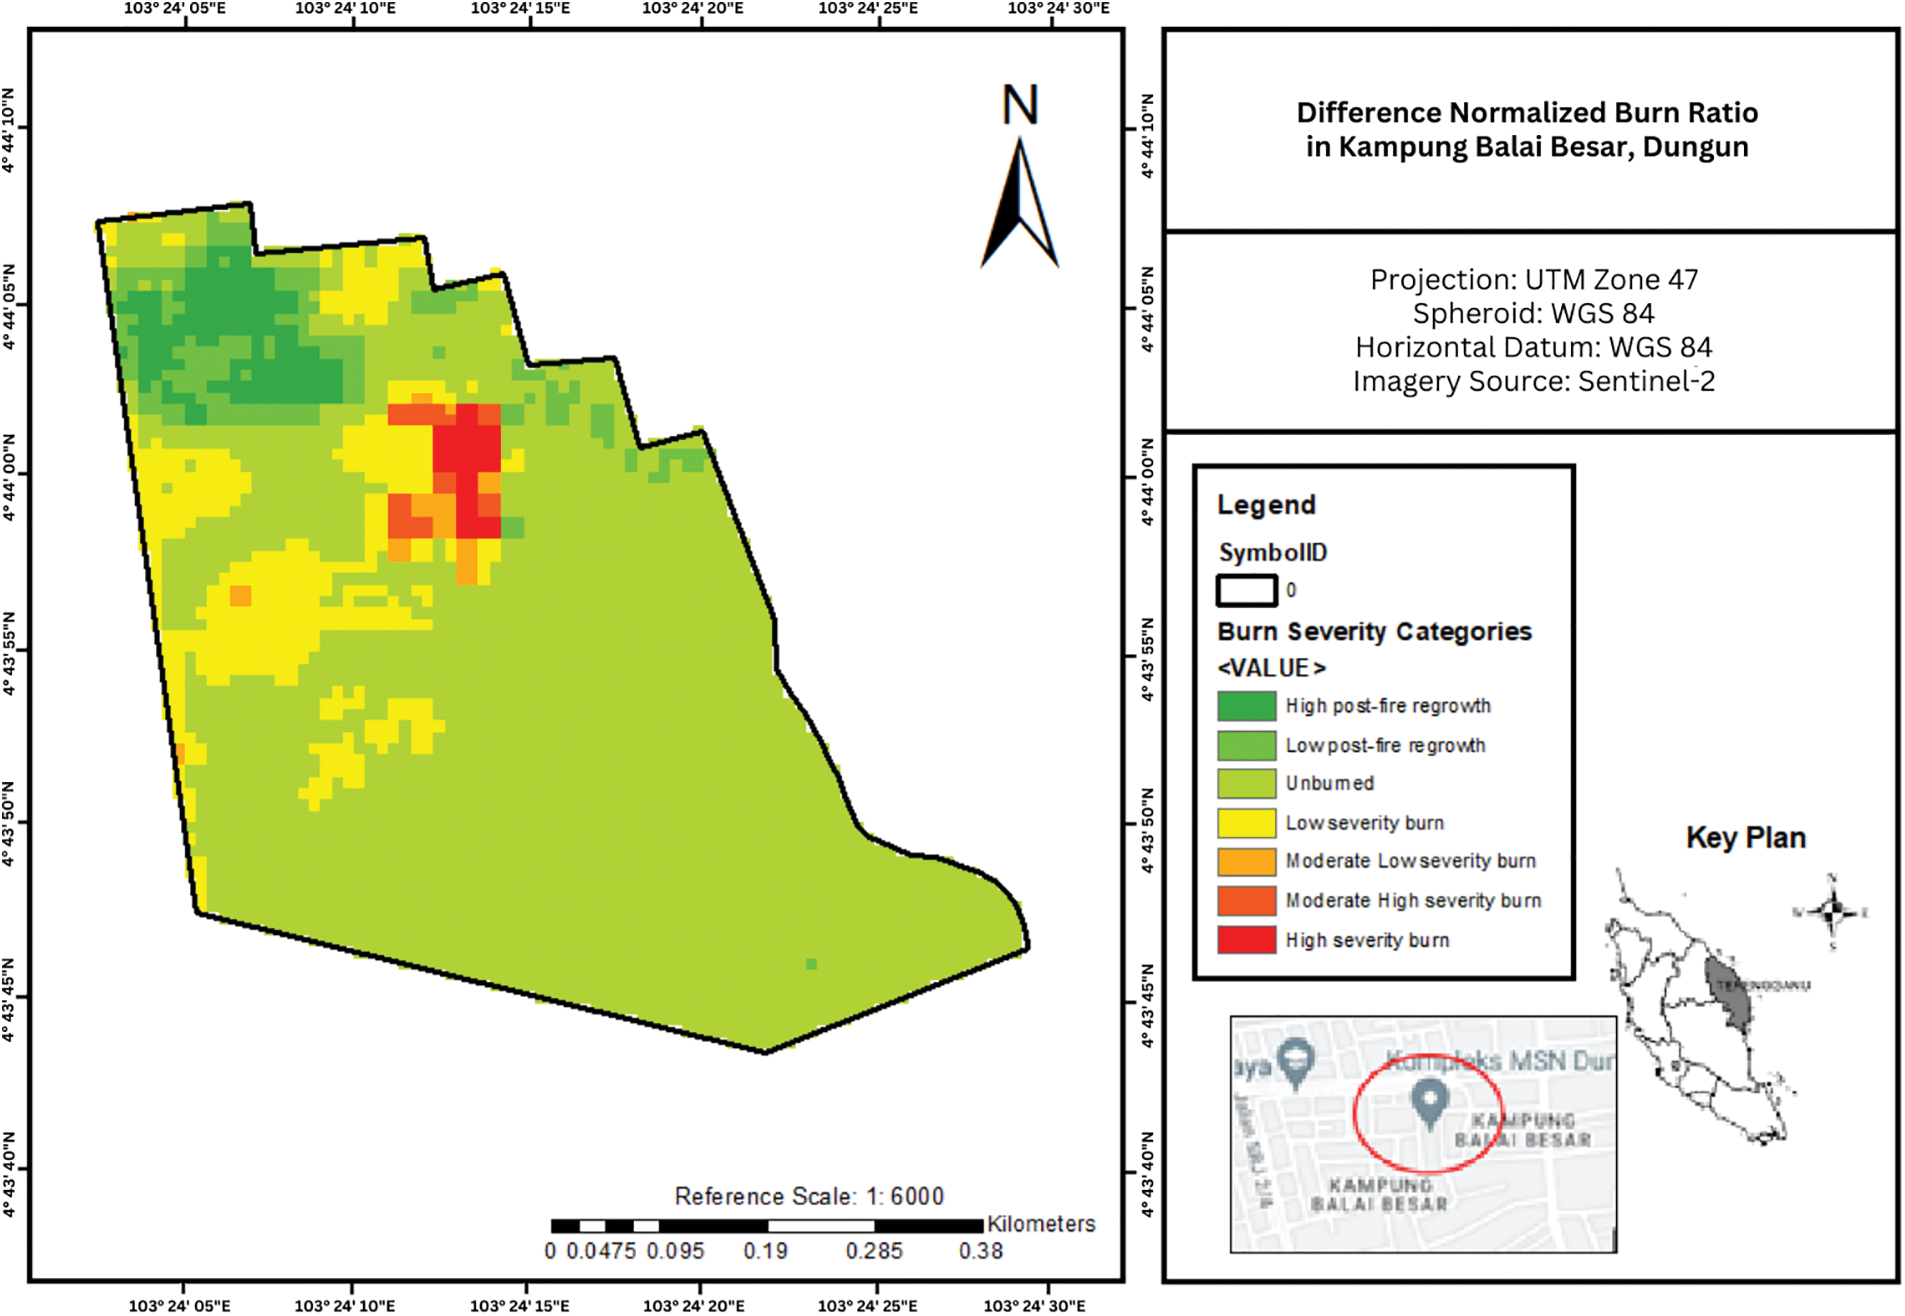
Figure 6: Map of burn severity in forest Kampung Balai Besar
The focus of this research is to assess the severity of forest fires in Kampung Balai Besar, Dungun, using remote sensing methods. Remote sensing is mainly used to assess burn severity due to its efficiency and simplicity. The detection of the burned area using the NBR index revealed that a small area was classified under high severity burns for 1 hectare across 36 hectares of the total area, while the majority of the region remained unburned, with 24 hectares.
In this study, the Sentinel-2 data was used, where the pre-fire satellite imagery was extracted on 14 June 2021 and the post-fire satellite imagery on 19 June 2021. Sentinel-2’s enhanced radiometric accuracy and geographical resolution allow a more accurate evaluation of fire intensity and stronger linkages between forest fires [27]. The NBR index, which utilized NIR and SWIR bands, proved to be an effective tool for identifying burned areas and assessing fire severity. SWIR identifies changes in the dryness of the land, while NIR highlights changes in canopy cover and the brightness of leaf burn. Following a fire, the NIR reflectance sharply declines due to the loss of vegetation, whereas the SWIR reflectance rises due to the elimination of the water-retaining plant [28]. The use of NBR for fire severity mapping allowed for a detailed analysis of the fire impact.
In conclusion, this study successfully assessed the burn severity of forest fires in Kampung Balai Besar, Dungun, through the application of remote sensing techniques. By estimating the Normalized Burn Ratio (NBR) index for both pre-fire and post-fire conditions, the study provides valuable insights into the burn severity levels in the affected area. The findings demonstrate that remote sensing is a powerful tool for monitoring forest fires, enabling more efficient and cost-effective decision-making processes. Furthermore, this approach contributes to improved forest management strategies by reducing the need for extensive fieldwork while still offering a comprehensive understanding of fire impacts. Ultimately, the study underscores the potential of remote sensing technology in enhancing the effectiveness of forest management and disaster response efforts, making it an essential tool for future forest monitoring and conservation initiatives.
Acknowledgement: The authors would like to express their sincere gratitude to Universiti Teknologi MARA (UiTM), Malaysia, for providing essential support, facilities, and resources that contributed to the successful completion of this research.
Funding Statement: The authors received no specific funding for this study.
Author Contributions: The authors confirm contribution to the paper as follows: study conception and design: Nur Nabihah Ghazali, Noraain Mohamed Saraf; data collection: Nur Nabihah Ghazali; analysis and interpretation of results: Nur Nabihah Ghazali, Noraain Mohamed Saraf, Ainon Nisa Othman, Abdul Rauf Abdul Rasam; draft manuscript preparation: Noraain Mohamed Saraf, Siti Aekbal Salleh, Nurhafiza Md Saad. All authors reviewed the results and approved the final version of the manuscript.
Availability of Data and Materials: The data used in this study can be accessed, which includes Sentinel-2 satellite imagery, through the European Space Agency’s Copernicus Open Access Hub. This platform provides free and open access to a wide range of Sentinel-2 datasets.
Ethics Approval: Not applicable.
Conflicts of Interest: The authors declare no conflicts of interest to report regarding the present study.
References
1. Tien Bui D, Shahabi H, Shirzadi A, Chapi K, Alizadeh M, Chen W, et al. Landslide detection and susceptibility mapping by AIRSAR data using support vector machine and index of entropy models in cameron highlands. Malaysia Remote Sens. 2018;10(10):1527. doi:10.3390/rs10101527. [Google Scholar] [CrossRef]
2. Bowman DMJS, Kolden CA, Abatzoglou JT, Johnston FH, van der Werf GR, Flannigan M. Vegetation fires in the Anthropocene. Nat Rev Earth Environ. 2020;1(10):500–15. doi:10.1038/s43017-020-0085-3. [Google Scholar] [CrossRef]
3. Zhang Q, Ge L, Zhang R, Metternicht GI, Du Z, Kuang J, et al. Deep-learning-based burned area mapping using the synergy of Sentinel-1&2 data. Remote Sens Environ. 2021;264:112575. doi:10.1016/j.rse.2021.112575. [Google Scholar] [CrossRef]
4. Fernández-Manso A, Fernández-Manso O, Quintano C. SENTINEL-2A red-edge spectral indices suitability for discriminating burn severity. Int J Appl Earth Obs Geoinf. 2016;50:170–5. doi:10.1016/j.jag.2016.03.005. [Google Scholar] [CrossRef]
5. Grari M, Idrissi I, Boukabous M, Moussaoui O, Azizi M, Moussaoui M. Early wildfire detection using machine learning model deployed in the fog/edge layers of IoT. Indones J Electr Eng Comput Sci. 2022;27(2):1062. doi:10.11591/ijeecs.v27.i2.pp1062-1073. [Google Scholar] [CrossRef]
6. Akay AE, Erdoğan A. GIS-based multi-criteria decision analysis for forest fire risk mapping. In: ISPRS Annals of the Photogrammetry, Remote Sensing and Spatial Information Sciences; 2017. p. 25–30. doi:10.5194/isprs-annals-IV-4-W4-25-2017. [Google Scholar] [CrossRef]
7. Jaffar M. Burn severity in Kuala Langat Forest using remote sensing technique [degree thesis]. Malaysia: Universiti Teknologi Mara Perlis; 2018. [Google Scholar]
8. Nasery S, Kalkan K. Burn area detection and burn severity assessment using Sentinel 2 MSI data: the case of Karabağlar district, İzmir/Turkey. Turkish J Geosci. 2020;1(2):72–7. [Google Scholar]
9. Chas-Amil ML, García-Martínez E, Touza J. Iberian Peninsula October 2017 wildfires: burned area and population exposure in Galicia (NW of Spain). Int J Disaster Risk Reduct. 2020;48(13):101623. doi:10.1016/j.ijdrr.2020.101623. [Google Scholar] [CrossRef]
10. Singh J, Boucher PB, Hockridge EG, Davies AB. Effects of long-term fixed fire regimes on African savanna vegetation biomass, vertical structure and tree stem density. J Appl Ecol. 2023;60(7):1223–38. doi:10.1111/1365-2664.14435. [Google Scholar] [CrossRef]
11. Barmpoutis P, Papaioannou P, Dimitropoulos K, Grammalidis N. A review on early forest fire detection systems using optical remote sensing. Sensors. 2020;20(22):6442. doi:10.3390/s20226442. [Google Scholar] [PubMed] [CrossRef]
12. Vilanova RS, Delgado RC, Frossard de Andrade C, Lopes dos Santos G, Magistrali IC, Moreira de Oliveira CM, et al. Vegetation degradation in ENSO events: drought assessment, soil use and vegetation evapotranspiration in the Western Brazilian Amazon. Remote Sens Appl Soc Environ. 2021;23(3):100531. doi:10.1016/j.rsase.2021.100531. [Google Scholar] [CrossRef]
13. Filipponi F. BAIS2: burned area index for Sentinel-2. In: Proceedings of the 2nd International Electronic Conference on Remote Sensing; 2018. doi:10.3390/ecrs-2-05177. [Google Scholar] [CrossRef]
14. Lasaponara R, Proto AM, Aromando A, Cardettini G, Varela V, Danese M. On the mapping of burned areas and burn severity using self organizing map and Sentinel-2 data. IEEE Geosci Remote Sens Lett. 2020;17(5):854–8. doi:10.1109/LGRS.2019.2934503. [Google Scholar] [CrossRef]
15. Phiri D, Simwanda M, Salekin S, Nyirenda VR, Murayama Y, Ranagalage M. Sentinel-2 data for land cover/use mapping: a review. Remote Sens. 2020;12(14):2291. doi:10.3390/rs12142291. [Google Scholar] [CrossRef]
16. Astola H, Häme T, Sirro L, Molinier M, Kilpi J. Comparison of Sentinel-2 and Landsat 8 imagery for forest variable prediction in boreal region. Remote Sens Environ. 2019;223(1):257–73. doi:10.1016/j.rse.2019.01.019. [Google Scholar] [CrossRef]
17. Cardil A, Mola-Yudego B, Blázquez-Casado Á, González-Olabarria JR. Fire and burn severity assessment: calibration of Relative Differenced Normalized Burn Ratio (RdNBR) with field data. J Environ Manage. 2019 2019;235(2):342–9. doi:10.1016/j.jenvman.2019.01.077. [Google Scholar] [PubMed] [CrossRef]
18. Mahmood MR, Jumaah HJ. NBR index-based fire detection using Sentinel-2 images and GIS: a case study in mosul park. Iraq Int J Geoinform. 2023;19(3):67–74. doi:10.52939/ijg.v19i3.2607. [Google Scholar] [CrossRef]
19. Climate Change Knowledge Portal. The world bank created the climate change knowledge portal to solve a need. [cite 2025 Jan 24]. Available from: https://climateknowledgeportal.worldbank.org/. [Google Scholar]
20. Liu P, Liu Y, Guo X, Zhao W, Wu H, Xu W. Burned area detection and mapping using time series Sentinel-2 multispectral images. Remote Sens Environ. 2023;296(4):113753. doi:10.1016/j.rse.2023.113753. [Google Scholar] [CrossRef]
21. Afira N, Wijayanto AW. Mono-temporal and multi-temporal approaches for burnt area detection using Sentinel-2 satellite imagery (a case study of Rokan Hilir Regency, Indonesia). Ecol Inform. 2022;69(2):101677. doi:10.1016/j.ecoinf.2022.101677. [Google Scholar] [CrossRef]
22. Govedarica M, Jakovljević G, Alvarez-Taboada F, Kokeza Z. Near real-time burned area mapping using Sentinel-2 data. In: FIG Working Week 2020 Smart Surveyors for Land and Water Management; 2020 May 10–14; Amsterdam, The Netherlands. [Google Scholar]
23. Javed A, Cheng Q, Peng H, Altan O, Li Y, Ara I, et al. Review of spectral indices for urban remote sensing. Photogramm Eng Remote Sens. 2021;87(7):513–24. doi:10.14358/PERS.87.7.513. [Google Scholar] [CrossRef]
24. Sukmono A, Hadi F, Widayanti E, Nugraha AL, Bashit N. Identifying burnt areas in forests and land fire using multitemporal normalized burn ratio (NBR) index on Sentinel-2 satellite imagery. Int J Saf Secur Eng. 2023 Jun;13(3):469–77. doi:10.18280/ijsse.130309. [Google Scholar] [CrossRef]
25. Llorens R, Sobrino JA, Fernández C, Fernández-Alonso JM, Vega JA. A methodology to estimate forest fires burned areas and burn severity degrees using Sentinel-2 data. Application to the October 2017 fires in the Iberian Peninsula. Int J Appl Earth Obs Geoinf. 2021;95:102243. doi:10.1016/j.jag.2020.102243. [Google Scholar] [CrossRef]
26. Rakholia S, Mehta A, Suthar B. Forest fire monitoring of Shoolpaneshwar wildlife sanctuary, Gujarat, India using geospatial techniques. Curr Sci. 2020;119(12):1974. doi:10.18520/cs/v119/i12/1974-1981. [Google Scholar] [CrossRef]
27. Keeley JE. Fire intensity, fire severity and burn severity: a brief review and suggested usage. Int J Wildland Fire. 2009;18(1):116–26. doi:10.1071/WF07049. [Google Scholar] [CrossRef]
28. Delcourt C, Combee A, Izbicki B, Mack M, Maximov T, Petrov R, et al. Evaluating the differenced normalized burn ratio for assessing fire severity using Sentinel-2 imagery in Northeast Siberian Larch forests. Remote Sens. 2021;13(12):2311. doi:10.3390/rs13122311. [Google Scholar] [CrossRef]
Cite This Article
 Copyright © 2025 The Author(s). Published by Tech Science Press.
This work is licensed under a Creative Commons Attribution 4.0 International License , which permits unrestricted use, distribution, and reproduction in any medium, provided the original work is properly cited.
 Downloads
 Citation Tools