 Open Access
ARTICLE
GIS-Based Identification of Flood Risk Zone in a Rural Municipality Using Fuzzy Analytical Hierarchy Process (FAHP)
1 Civil Engineering Department, Romblon State University, Odiongan, Romblon, 5505, Philippines
2 Research, Development, and Innovation Unit, Romblon State University, Odiongan, Romblon, 5505, Philippines
* Corresponding Author: Jerome Gacu. Email:
Revue Internationale de Géomatique 2024, 33, 295-320. https://doi.org/10.32604/rig.2024.055085
Received 16 June 2024; Accepted 09 August 2024; Issue published 03 September 2024
Abstract
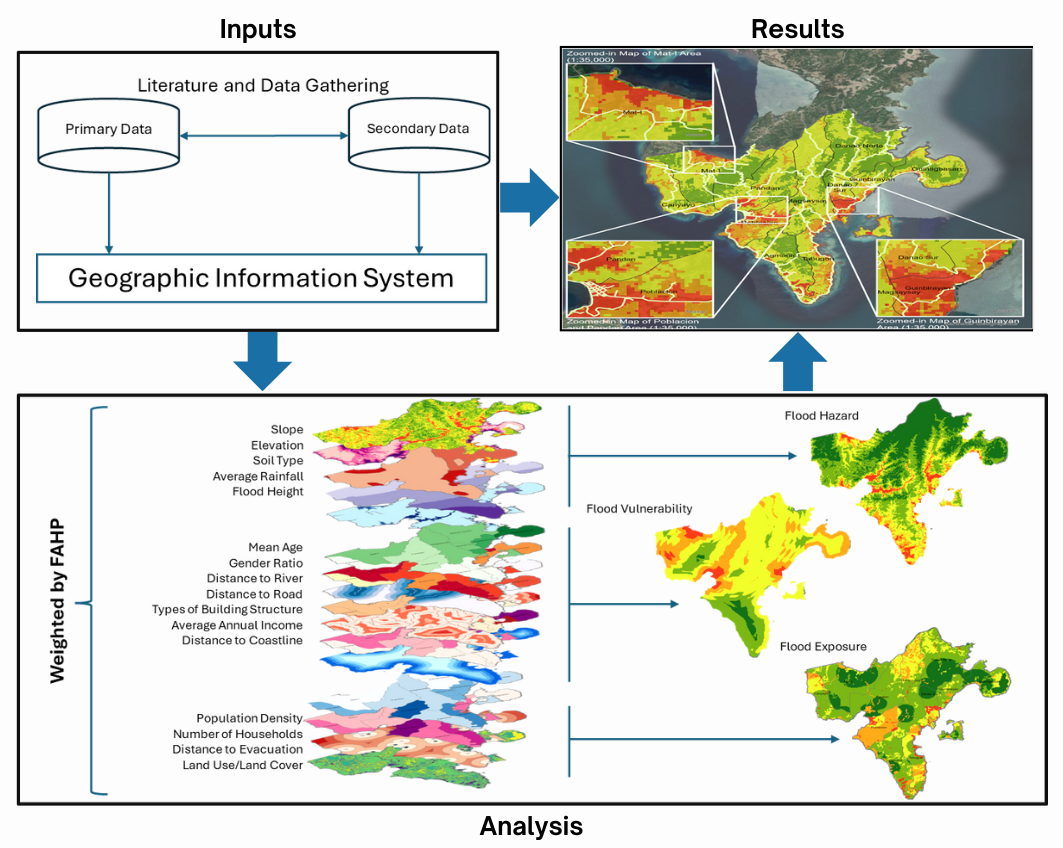
Risk assessment is vital for humanities, especially in assessing natural and manmade hazards. Romblon, an archipelagic province in the Philippines, faces frequent typhoons and heavy rainfall, resulting in floods, with the Municipality of Santa Fe being particularly vulnerable to its severe damage. Thus, this research study intends to evaluate the flood risk of Santa Fe spatially using the fuzzy analytical hierarchy process (FAHP), taking into account data sourced from various government agencies and online databases. GIS was utilized to map flood-prone areas in the municipality. Hazard assessment factors included average annual rainfall, elevation, slope, soil type, and flood height. Distance to river, distance to road, types of building structure, mean age, gender ratio, and average annual income were considered parameters of vulnerability assessment. Exposure assessment considered land use, distance to evacuation facility, household number, and population density. Weights for each parameter were determined through pairwise comparison performed by experts. These weights were then incorporated into risk assessment estimation. The developed risk map identifies five high-risk barangays (small local government units). The study’s findings will enable local government units to establish flood mitigation programs, implement targeted mitigation measures, and formulate strategic response plans to lower risk and safeguard the residents of Santa Fe effectively.Graphic Abstract
Keywords
Flooding is one of the most destructive natural disasters, triggering vast damage to the environment, structures, and property, often leading to loss of life [1]. Floods are a global concern, impacting almost every continent and causing severe economic and social consequences [2,3]. The risk of flooding in the Philippines is exceptionally high due to its geographical zone within the Pacific Typhoon Belt, where it is frequently hit by around 20 typhoons each year, significantly increasing the likelihood of floods [4,5]. This recurrent threat affects all regions of the country, including the province of Romblon and its municipalities.
Identifying flood risk zones is crucial in mitigating the adverse impacts of floods. Flood risk areas are likely to flood, and mapping these zones helps formulate strategies to minimize flood-related losses and damages [6]. Geographic Information System (GIS) is a formidable tool extensively used in various sectors for data management and spatial analysis [7]. In the Philippines, GIS addresses a wide range of land-related issues, including soil erosion, upland use, and property valuations, as well as monitoring natural resources like wetlands, forests, and bodies of water [8,9]. GIS techniques are particularly beneficial for water resource management, helping local governments identify flood-prone areas and implement effective flood-control strategies [10,11].
Digital elevation models (DEMs) are digital representations of the land surface elevation, crucial for hydrologic and hydraulic modeling. Accurate elevation data provided by DEMs are essential for modeling and quantifying processes related to Earth’s topography, influencing water flow dynamics [12–14]. DEMs have been widely used in flood hazard assessment, enabling precise flood simulation and mapping [15]. In the Philippines, high-resolution DEMs generated from technologies like LiDAR (Light Detection and Ranging) and IfSAR (Interferometric Synthetic Aperture Radar) have significantly advanced flood risk assessments [16,17].
The Fuzzy Analytic Hierarchy Process (FAHP) is an enhancement of the Analytic Hierarchy Process (AHP) [18,19] that integrates fuzzy set theory to address ambiguity and imprecision in decision-making. FAHP allows for integrating subjective judgments and expert opinions into evaluating various flood risk factors [20–22]. This method has been used worldwide in flood risk assessment research, providing a structured framework for prioritizing and ranking different factors contributing to flood hazards [23,24].
Legislative frameworks such as Republic Act No. 10121 in the Philippines mandate risk assessment and disaster risk reduction initiatives. This act emphasizes the importance of identifying flood risk zones and creating flood risk maps as part of a comprehensive disaster management strategy. The GeoRiskPH initiative by DOST-PHIVOLCS exemplifies the collaborative efforts to enhance the country’s disaster risk reduction capabilities through geospatial information and decision-making tools. Furthermore, partnerships like the Greater Metro Manila Area Risk Assessment Project (GMMA RAP) with Australian agencies have significantly advanced flood risk analysis and disaster management capacities, providing high-resolution digital elevation data and developing exposure databases for vulnerable areas.
Despite the advancements in flood risk assessment using GIS and FAHP, there remains a gap in the comprehensive evaluation of flood risk that integrates natural and socio-economic factors specific to rural municipalities in the Philippines. Most existing studies focus on urban areas or broader regional assessments, often neglecting the unique vulnerabilities and exposures of rural municipalities like Santa Fe, Romblon. This gap underscores the need for localized flood risk assessments considering specific geographic, demographic, and infrastructural characteristics.
This study contributes to these ongoing efforts by providing a GIS-based identification of flood risk zones using FAHP in the rural municipality of Santa Fe, Romblon. The methodology integrates various data sources and analytical techniques to create a comprehensive flood risk map. This approach involves capturing and analyzing geographic data pertinent to flood hazards and risks using GIS, obtaining elevation data through DEMs for modeling flood scenarios, and employing FAHP to prioritize and rank flood risk factors. Additionally, remote sensing technology is utilized to acquire high-resolution imagery of flood-prone areas, and open-source software is used for data processing and analysis. This study aims to support local government and community efforts in mitigating flood impacts by identifying flood risk zones in Santa Fe, Romblon. The findings will aid in developing targeted interventions, emergency preparedness measures, and long-term strategies for flood management. Ultimately, this research seeks to enhance the resilience of Santa Fe and similar rural municipalities against the devastating effects of flooding, contributing to safer and more sustainable communities.
The study assessed flood risk in Santa Fe, Romblon, through three main phases: data collection, parameter evaluation using the FAHP, and the development of flood risk maps. Initially, data on factors such as elevation, land cover, average annual rainfall, slope, soil type, flood height, demographic profile, and disaster risk were collected using available information online and in government and nongovernment databases. Experts then used a nine-point scale to weigh these factors, integrating the weights through FAHP for a comprehensive multicriteria decision-making process. GIS tools were employed for mapping and layering the primary and secondary data, while flood modeling utilized HEC-HMS and HEC-RAS. The developed flood risk maps offered a detailed perspective of potential flood risks at the location, providing local government and disaster management authorities with essential information to devise effective flood mitigation strategies. This comprehensive assessment will significantly aid in minimizing future flood damage to the lives of Santa Fe residents. The schematic diagram flow of the study is shown in Fig. 1.
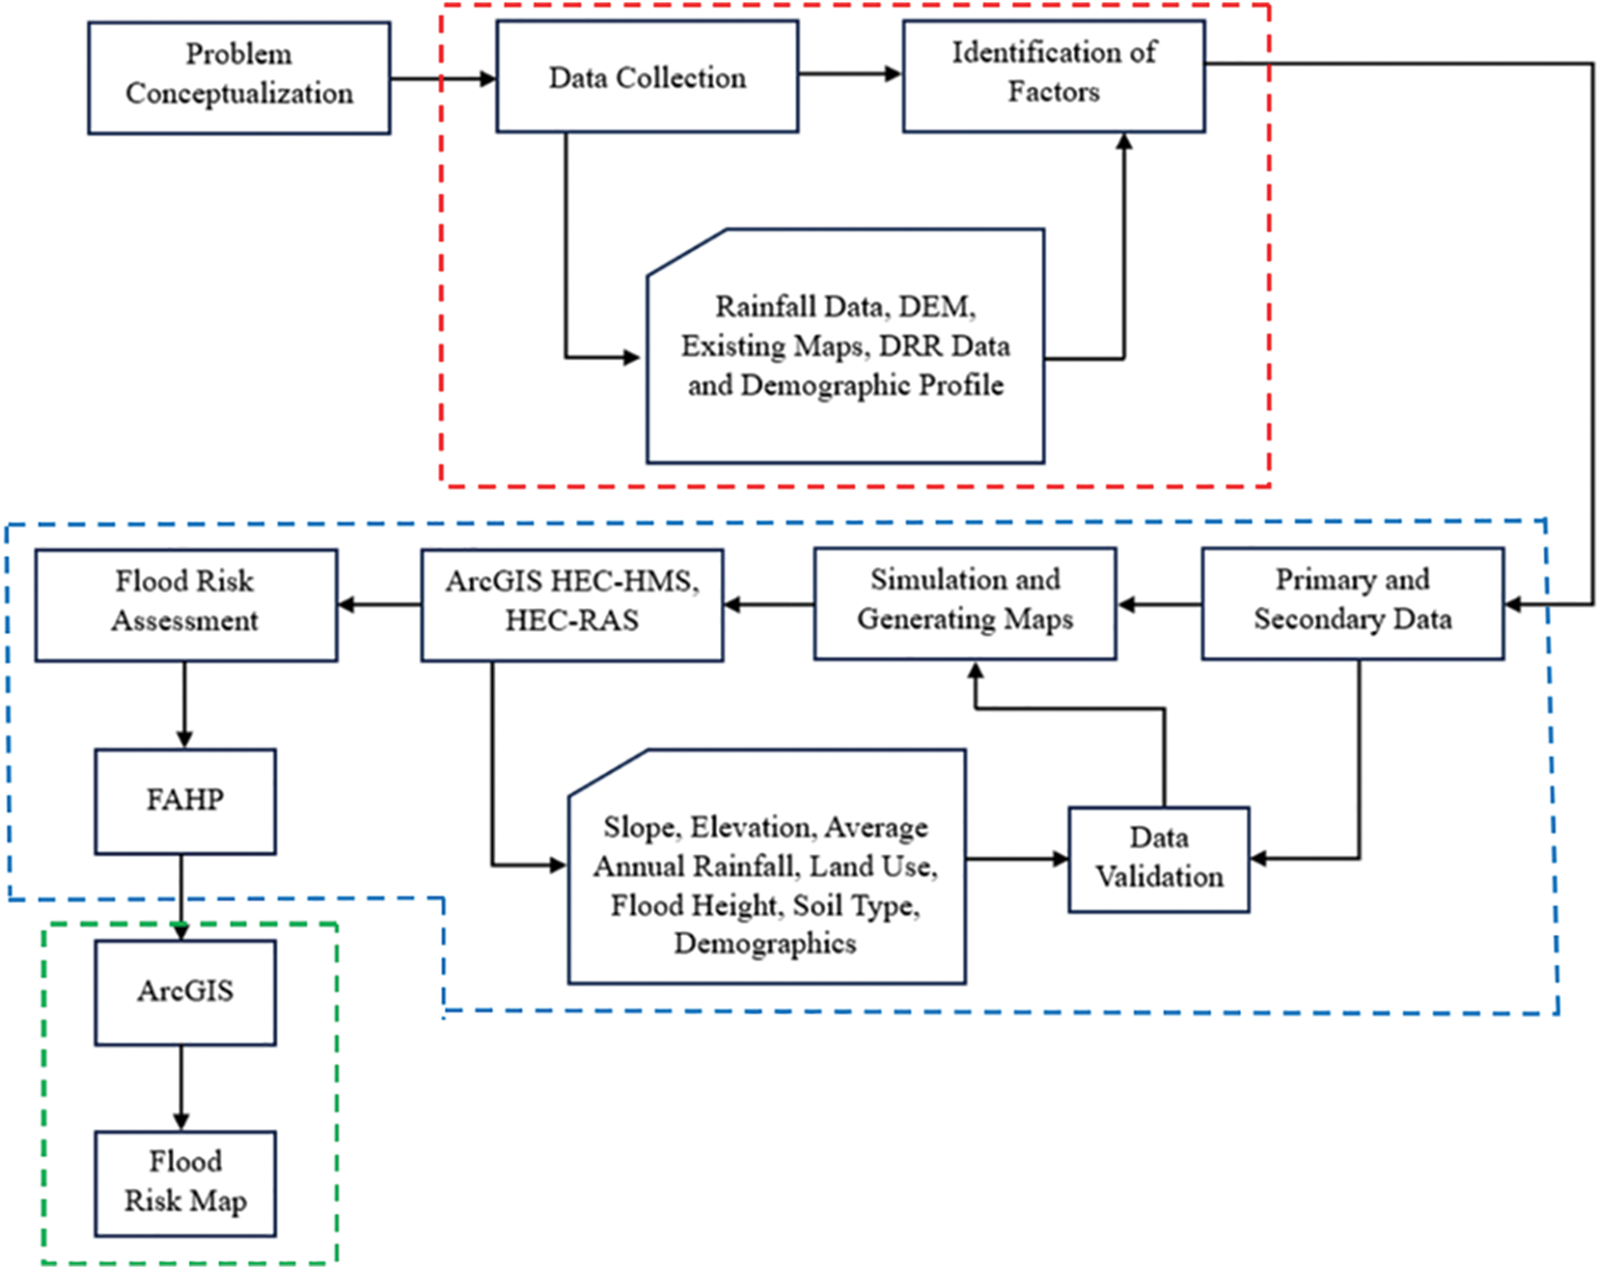
Figure 1: The proposed schematic diagram of the study
As shown in Fig. 2, Santa Fe is a municipality in the Romblon Province situated South of Tablas Island [25] and positioned at 121°60′ East Longitude and 12°9′ North Latitude of the Philippines. In recent years, the municipality has experienced severe flooding brought on by extreme rainfall and typhoons. Thus, it is essential to determine the flood risk zones and make a flood risk map to mitigate the economic loss caused by natural calamities so the local government can proactively measure the impact of future floods on the area’s residents.
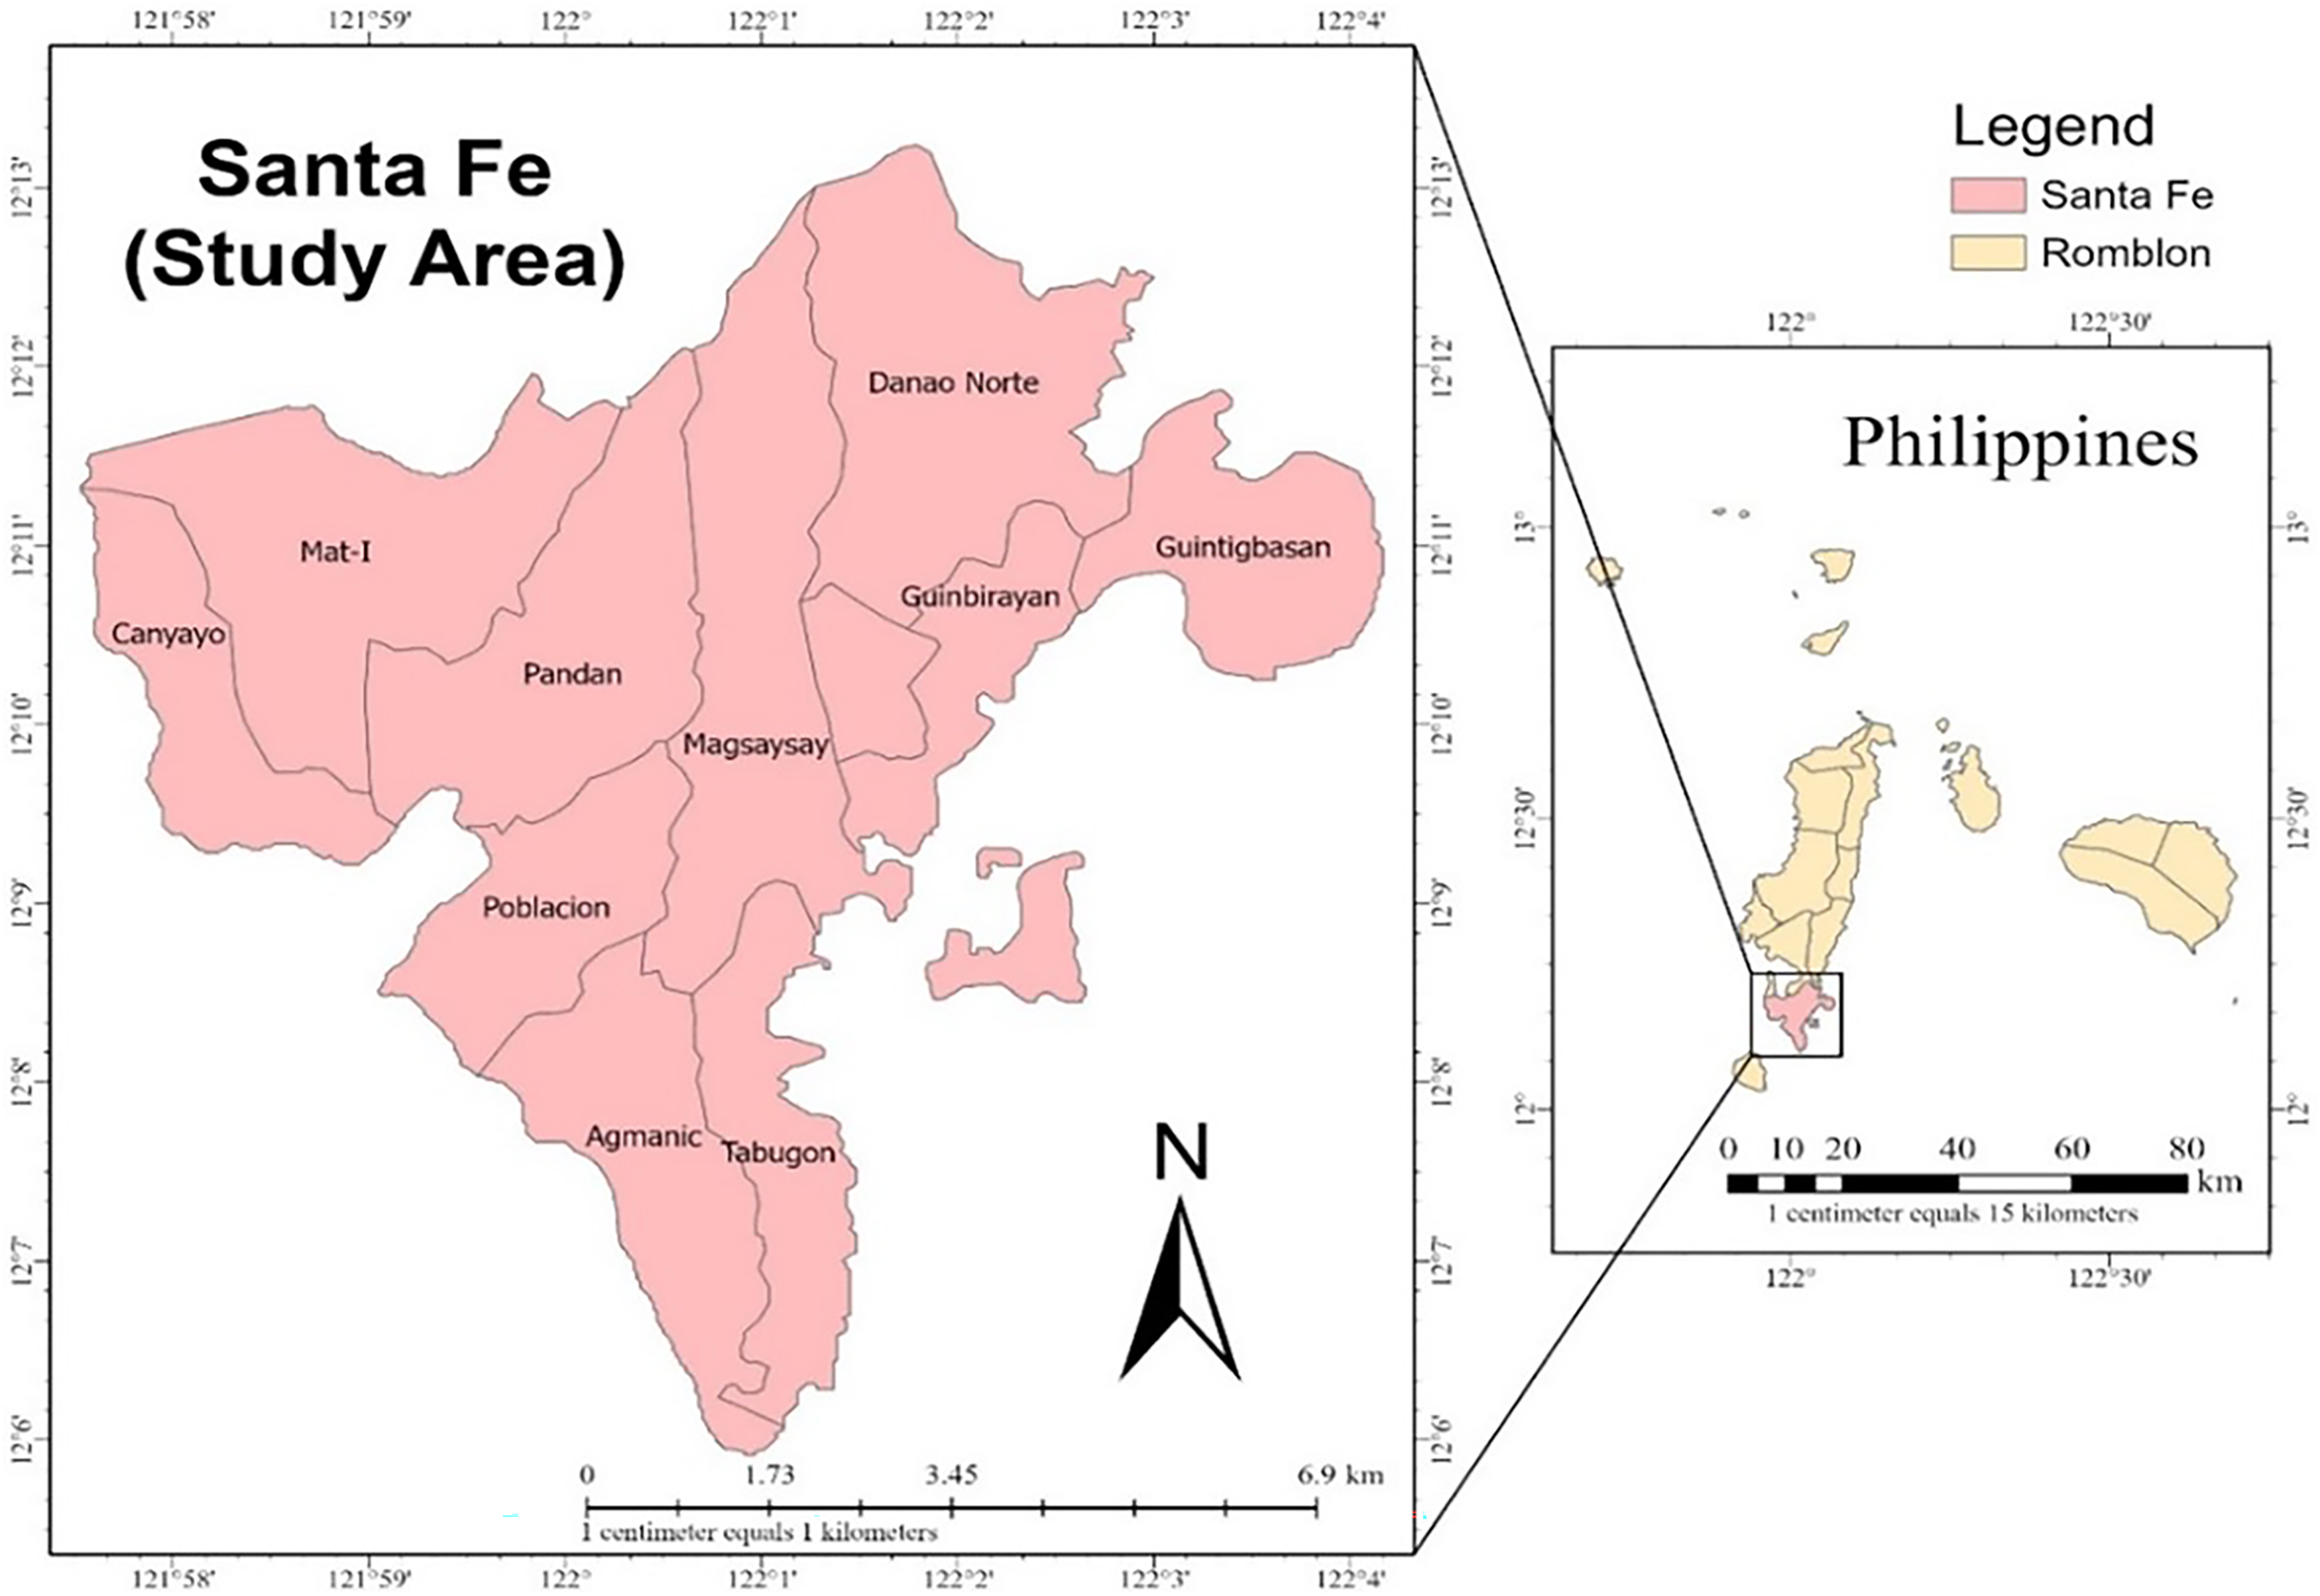
Figure 2: Barangay boundaries of the Municipality of Santa Fe located at Tablas Island, Romblon, Philippines
2.2 Data Collection and Identification of Factors
The study began with a comprehensive literature review to identify key factors contributing to flooding, establishing the research direction and scope. The team prioritized factors based on availability, using primary data (historical rainfall records, land cover information, and population demographics) and secondary data (DEMs and satellite imagery) to understand flood risks thoroughly. Primary data on demographics, disaster risk, and rainfall records were collected from local government sources, historical documents, and databases. Secondary data, including DEMs and satellite imagery, were sourced from online resources and relevant authorities for detailed topographic information essential for flood modeling and risk assessment.
The study mapped flood-prone areas using diverse topographic, hydrological, geomorphological, and climatological parameters, categorized into flood hazard, vulnerability, and exposure groups. GIS tools, HEC-HMS, and HEC-RAS were used to simulate potential flood scenarios, producing comprehensive flood risk maps for Santa Fe, Romblon.
These maps gave local government officials and disaster management authorities essential information to devise effective flood mitigation strategies. The structured approach and ten-step process outlined in the study ensured a clear guide for stakeholders, significantly aiding in disaster preparedness and response and minimizing future flood damage to the lives and properties of Santa Fe residents.
2.3 Evaluation and Assessment of Parameters Using FAHP
A diverse team of experts, including hydrologists, meteorologists, water resource engineers, disaster risk reduction specialists, and end-users from the local government unit (LGU) of Santa Fe, evaluated the factors contributing to flood risk. Experts from government agencies, academic institutions, and the LGU participated in the survey using online and printed questionnaires for pairwise comparisons. Similar steps were utilized in this study as those employed in the FAHP method conducted by Boonmee et al. [26].
Step 1: The decision process was deconstructed into a hierarchical diagram with three levels: goal, criteria, and indicators. The FAHP framework, with lower-level criteria and indicators, positioned the primary goal at the top. Feature weights were assigned using a pairwise comparison technique involving ten experts. The FAHP incorporated a fuzzy triangle scale [27] for prioritizing criteria. Experts assessed each comparison using a nine-point intensity matrix. The number of comparisons was computed using the formula in Eq. (1):
Step 2: The Triangular Fuzzy Number (TFN) Design [28] approach was used to establish the equivalent scale of a fuzzy number. This method replaces crisp numbers with triangular fuzzy numbers, suitable for decision-making in uncertain environments. Triangular fuzzy numbers represent fuzzy comparative judgments characterized by the smallest value (l), an almost certain value (m), and a maximum value (u). The representation of a triangular fuzzy number is denoted in Eq. (2):
The TFN approach was used in this study to manage uncertainties and subjectivities in expert judgments during the flood risk assessment. TFNs are defined by three values (l, m, u): ‘l’ is the minimum value, ‘m’ is the most likely value, and ‘u’ is the maximum value. This approach allows us to effectively model uncertainty by capturing a range of expert opinions. TFNs are simple and computationally efficient, making them ideal for the FAHP. This ensures accurate prioritization and ranking of flood risk factors.
Fig. 3 illustrates the membership function of a triangular fuzzy number [29]. In this representation, the parameter
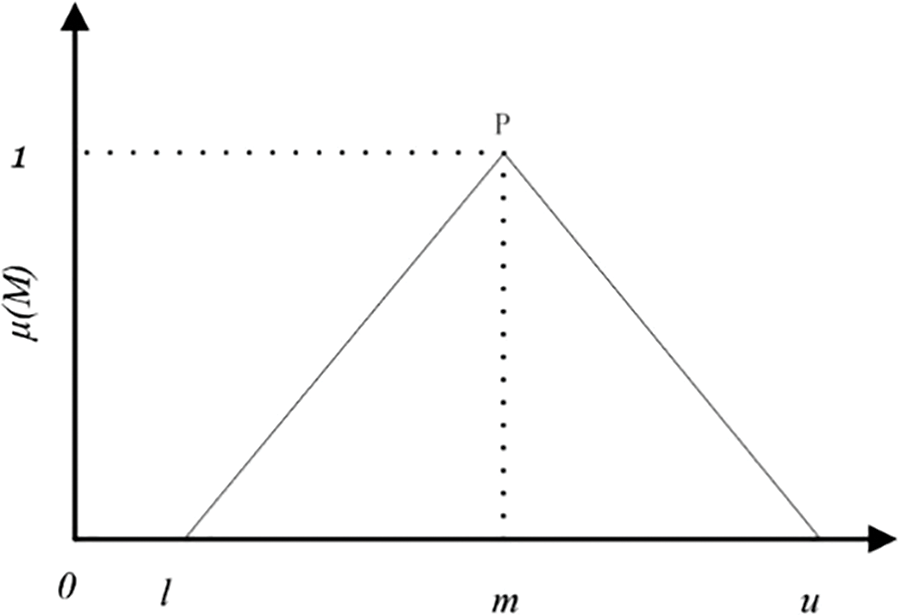
Figure 3: Triangular fuzzy number (P)
Step 3: The relative importance of each parameter was identified through a pairwise comparison matrix between criteria and alternatives, assigning equivalent fuzzy numbers based on the fuzzy triangle set (Fig. 4) [30]. The fuzzy geometric mean was calculated using Eqs. (4)–(6).

Figure 4: Graph of fuzzy triangle set. Adapted with permission from Reference [30], Copyright © 2018, Hindawi Limited
Step 4: Each fuzzy geometric mean was divided by the sum of
Step 5: The equivalent weights were determined by averaging.
2.4 Flood Risk Map Development
This study used the Sendai Framework [25,31] to integrate hazard, vulnerability, and exposure criteria for flood risk assessment. The results were visualized on maps created with GIS software. The methodology included using the raster calculator tool in GIS to overlay three (3) criteria maps, producing a composite map with equal weights. The output map is generated with different indices classified from low risk to high risk regarding floods.
The study used primary data (historical rainfall records, land cover data, and population statistics) and secondary data (digital elevation models and satellite images). For hazard assessment, the parameters were slope, elevation, average annual rainfall, flood height, and soil type. For vulnerability assessment, the parameters included distance to river, distance to road, mean age, gender ratio, average income, and types of structures. For exposure assessment, the parameters were distance to healthcare facilities, land use, population density, and number of households. These parameters were chosen for their relevance to flood risk and their impact on vulnerability and exposure in the study area. Table 1 shows the summary of factors considered for the assessment, including their respective data type, duration/year, source, and authors who used it as the basis for their studies.
This study identified five (5) parameters impacting flood occurrence, modeled using the FAHP: slope, elevation, soil type, average annual rainfall, and flood height, as shown in Fig. 5.
a) Slope affects water velocity, flood intensity, and infiltration [33]. As shown in Fig. 5a, slope values were measured in degrees and categorized into five groups: 0–3, 3–8, 8–18, 18–30, and >30. Lower slopes are more vulnerable to flooding, while steep slopes facilitate rapid water flow, hindering infiltration. DTM (Digital Terrain Model) data from NAMRIA and the slope tool generated a slope map for the study area.
b) Fig. 5b shows elevation significantly influences flood direction, movement, and depth [2]. Elevation data, measured in meters, was classified into five categories: 0–5, 6–20, 21–50, 51–150, and >150. Lower elevations are more exposed to flooding as water flows from higher elevations to flatter locations. IfSAR DTM data and GIS software were used for this analysis.
c) Soil type affects permeability and water storage capacity [50]. The study area had four soil types: unidentified, sandy loam, loam, and hydrosol. These classifications help understand water movement and storage capabilities within the region. As shown in Fig. 5c, a soil-type map from Geoportal Philippines was used to assess these characteristics.
d) Intense rainfall directly contributes to flooding by overwhelming drainage systems, leading to high river discharge downstream [51]. This study used 30-year average climatological records from PAGASA weather stations. Annual average rainfall, shown in Fig. 5d, was measured in millimeters and classified into five categories: <550, 550–565, 565–580, 580–595 mm, and >595 mm.
e) Flood height refers to the elevation water reaches when a river exceeds its normal boundaries [3]. This study used tools like HEC-HMS and HEC-RAS to delineate and simulate flood extents. The result of the simulation is shown in Fig. 5e.
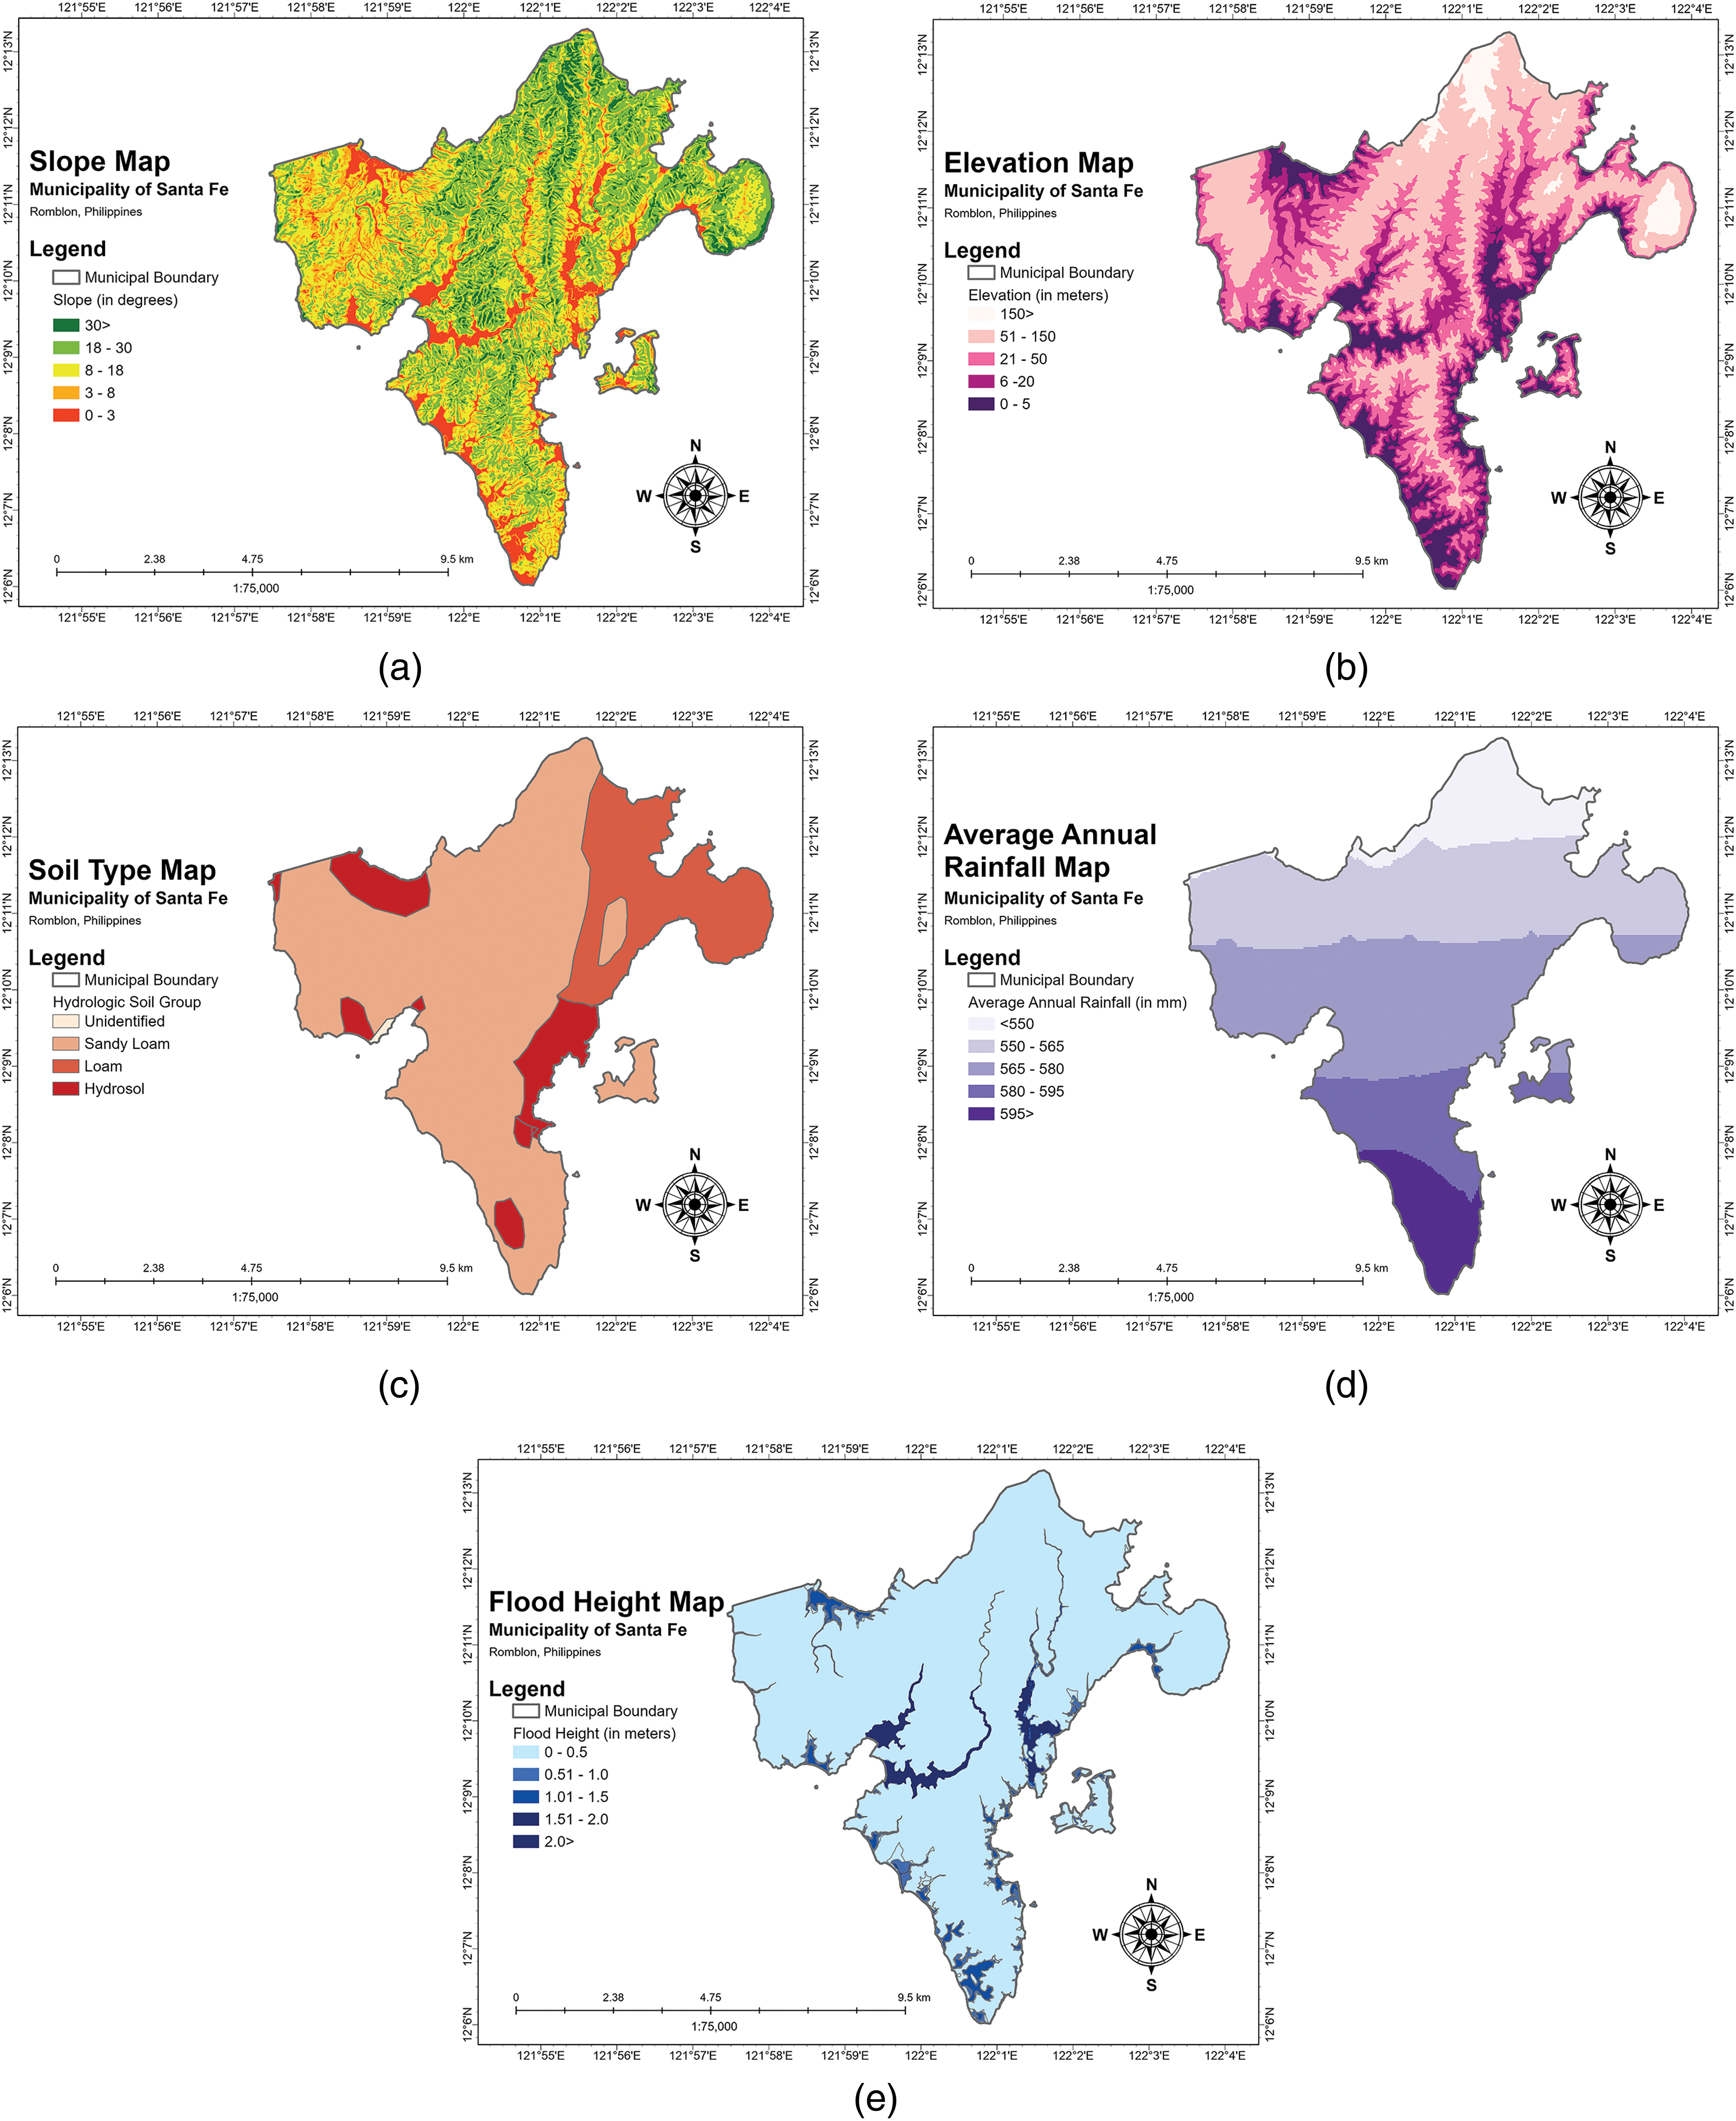
Figure 5: Generated map for flood hazard parameters including slope (a), elevation (b), soil type (c), average annual rainfall (d), and flood height (e)
3.1.1 Pre-Processing of Basin Model
Primary data from the Santa Fe River channels and a 5-m resolution IfSAR-DTM were used to develop the basin model. River channels were digitized using Google Earth, and IfSAR-DTM data were sourced from NAMRIA. The HEC-HMS 4.11 software processed this data to generate an HMS basin model, integrating soil and land cover data from NAMRIA to assign curve numbers (CN) reflecting soil type and land cover. Parameters like initial abstraction (IA), time of concentration (TC), storage coefficient (SC), river length, and sub-watershed areas were derived to enhance the model.
3.1.2 Calibration and RIDF Simulations
The HMS Basin Model (Fig. 6) was calibrated to simulate the watershed’s hydrologic response. Calibration involved adjusting parameter values iteratively until the simulated hydrograph matched the actual hydrograph. Simulations were conducted for rainfall scenarios with a return period of 100 years using rainfall data from PAGASA Romblon’s rain gauge station. The frequency storm precipitation method in the software HEC-HMS created a meteorological model file, resulting in precipitation and outflow data.
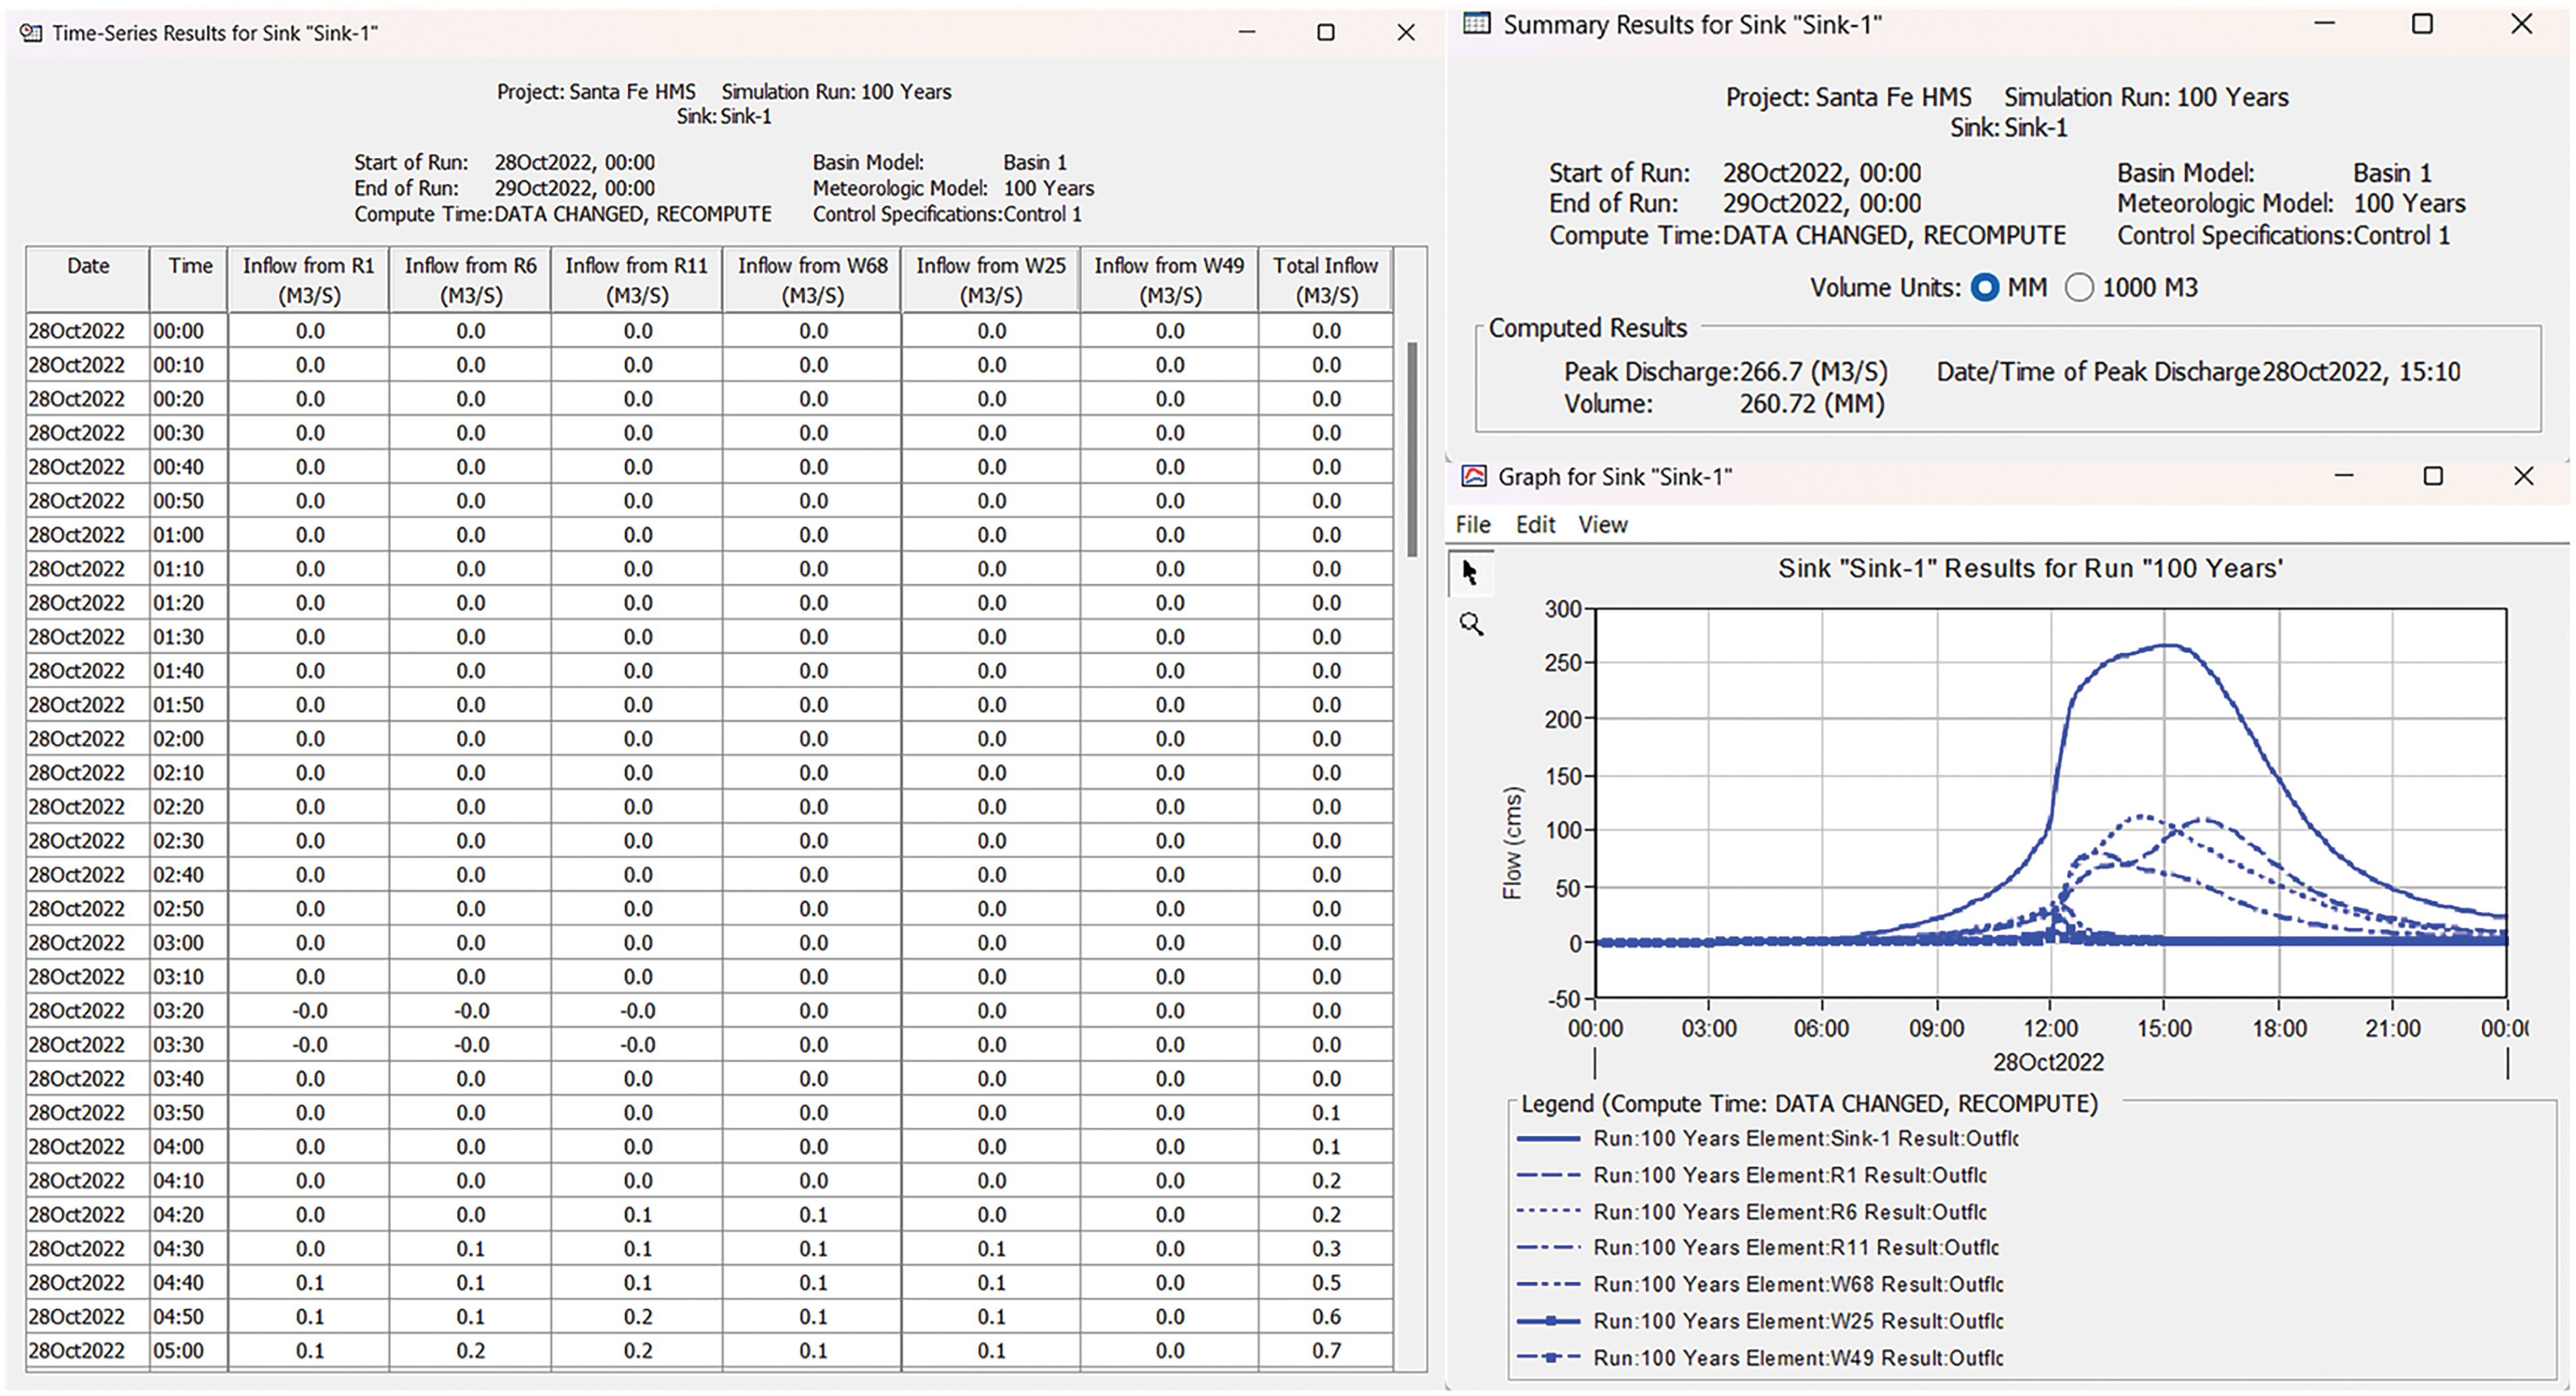
Figure 6: The simulation results show the total inflow from a 100-year return period modeled using the software HEC-HMS
3.1.3 Two-Dimensional (2D) River Analysis System Simulations
DEM data was utilized to construct a River Analysis System (RAS) model with HEC-RAS 6.4.1 software. This model simulated rainfall-runoff scenarios and predicted flood depth and recession. The model (Fig. 7) was calibrated by integrating outflow data from HEC-HMS and precipitation records for various return periods. A standard depth of 0.01 was assumed. The flood depth for the 100-year scenario was transferred as raster files and mapped to layers in GIS software.
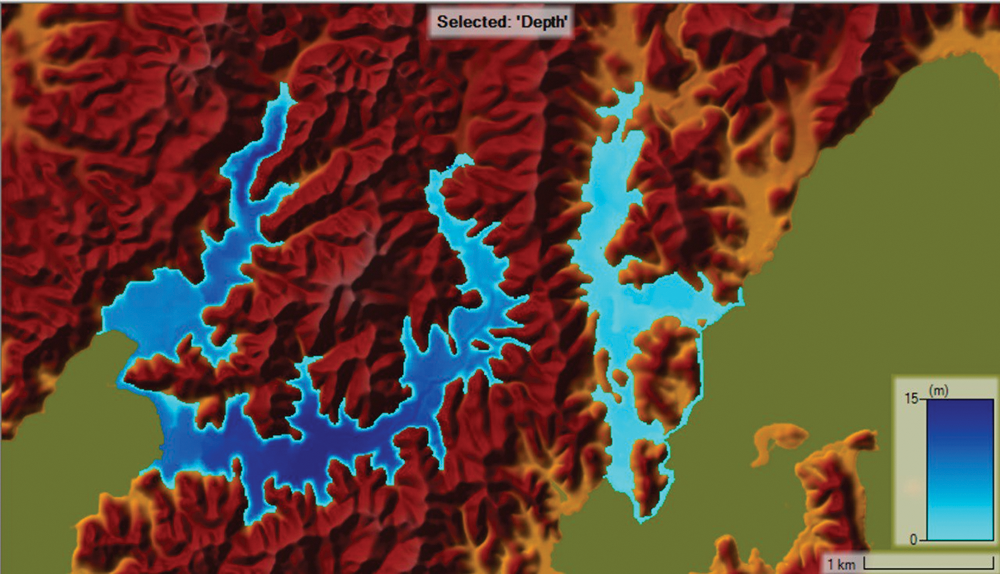
Figure 7: Simulation of maximum flood depth in Santa Fe, Romblon, using HEC-RAS for a 100-year return period
A probabilistic flood hazard map, shown in Fig. 5e, was developed based on river water volume, depth, and velocity. Flood heights were categorized into five classes: 0–0.5, 0.51–1.0, 1.01–1.5, 1.51–2.0 meters, and above 2.0 meters. Secondary data inputs like DEMs were sourced from NAMRIA’s IfSAR data. The study incorporated simulated maps and flood susceptibility maps from DENR-MGB.
3.2 Flood Vulnerability Assessment
Evaluating vulnerability was crucial for formulating effective non-structural flood policies. The study used demographics and disaster risk reduction information from the Local Government (LGU) of Santa Fe, as shown in Fig. 8. Demographic factors such as mean age, gender ratio, and average income were analyzed using the CBMS of Santa Fe data to assess social and economic vulnerability. Additionally, building types and distances to rivers, roads, and coastlines were analyzed to evaluate personal safety and vulnerability, with data gathered from the Municipal Planning and Development Office of Santa Fe, NAMRIA, and OpenStreetMap.
a) Fig. 8a shows the mean age data for each barangay. The majority of barangays, including Mat-i, Magsaysay, Danao Sur, and Danao Norte, have a mean age in the 30 s. Barangays Canyayo, Agmanic, and Tabugon have the lowest average age at 28, while Guintigbasan has the highest mean age at 32.
b) Fig. 8b shows that most barangays in the Municipality of Santa Fe have more men than women. However, Barangay Canyayo has a nearly equal gender ratio. Overall, the gender ratio in Santa Fe, Romblon, slightly favors men, with a ratio of 1.0305 men to women.
c) The distances between buildings and the river network, as depicted in Fig. 8c, in the study area, are classified into five levels: >1200, 900–1200, 600–900, 300–600 meters, and <300 meters. Buildings within 300 meters of the river require heightened attention due to increased flood risk. The proximity to rivers indicates household vulnerability to flash floods and river overflows. Generally, households closer to the river are more prone to flood-related events.
d) The proximity of roads influences the vulnerability of the most distant communities. As shown in Fig. 8d, the distance ranges from 300 to 1200 meters in most barangays. However, in Guintigbasan, Pandan, and part of Agmanic, the nearest road is over 1200 meters away, highlighting accessibility challenges.
e) Fig. 8e classifies building structures into permanent, semi-permanent, and temporary. Permanent structures are anchored to a foundation with an impermeable floor and are fully roofed and walled. Semi-permanent structures combine timber and concrete attributes, while impermanent structures use cheaper materials like sawali, bamboo, nipa, and cogon. The generated map indicates that most structures in Santa Fe are permanent or semi-permanent, suggesting greater resilience to flooding. However, in Barangay Guintigbasan, temporary structures are more common, making them vulnerable to destruction during severe weather conditions such as storms and floods.
f) The average annual income per barangay (Fig. 8f) was categorized into five classes: less than 120,000; 120,000 to 149,999; 150,000 to 179,999; 180,000 to 209,999; and 210,000 or more. The map reveals that Canyayo, Danao Norte, and Tabugon have an average annual income of less than 120,000. Barangays Mat-I, Pandan, Guintigbasan, and Agmanic have incomes ranging from 120,000 to 149,999. Barangay Magsaysay falls into the 150,000 to 179,999 range, while Danao Sur and Guinbirayan have incomes between 180,000 and 209,999. Notably, Barangay Poblacion has the highest average annual income, exceeding 210,000.
g) The varying distances from the coastline (Fig. 8g) were categorized into five levels: over 1000 meters, 700 to 1000 meters, 500 to 700 meters, 300 to 500 meters, and less than 300 meters. Proximity to the coastline is a crucial factor in evaluating flood vulnerability. Areas within 300 meters of the coastline are most impacted during floods and require focused efforts to enhance their resilience against potential flood events.

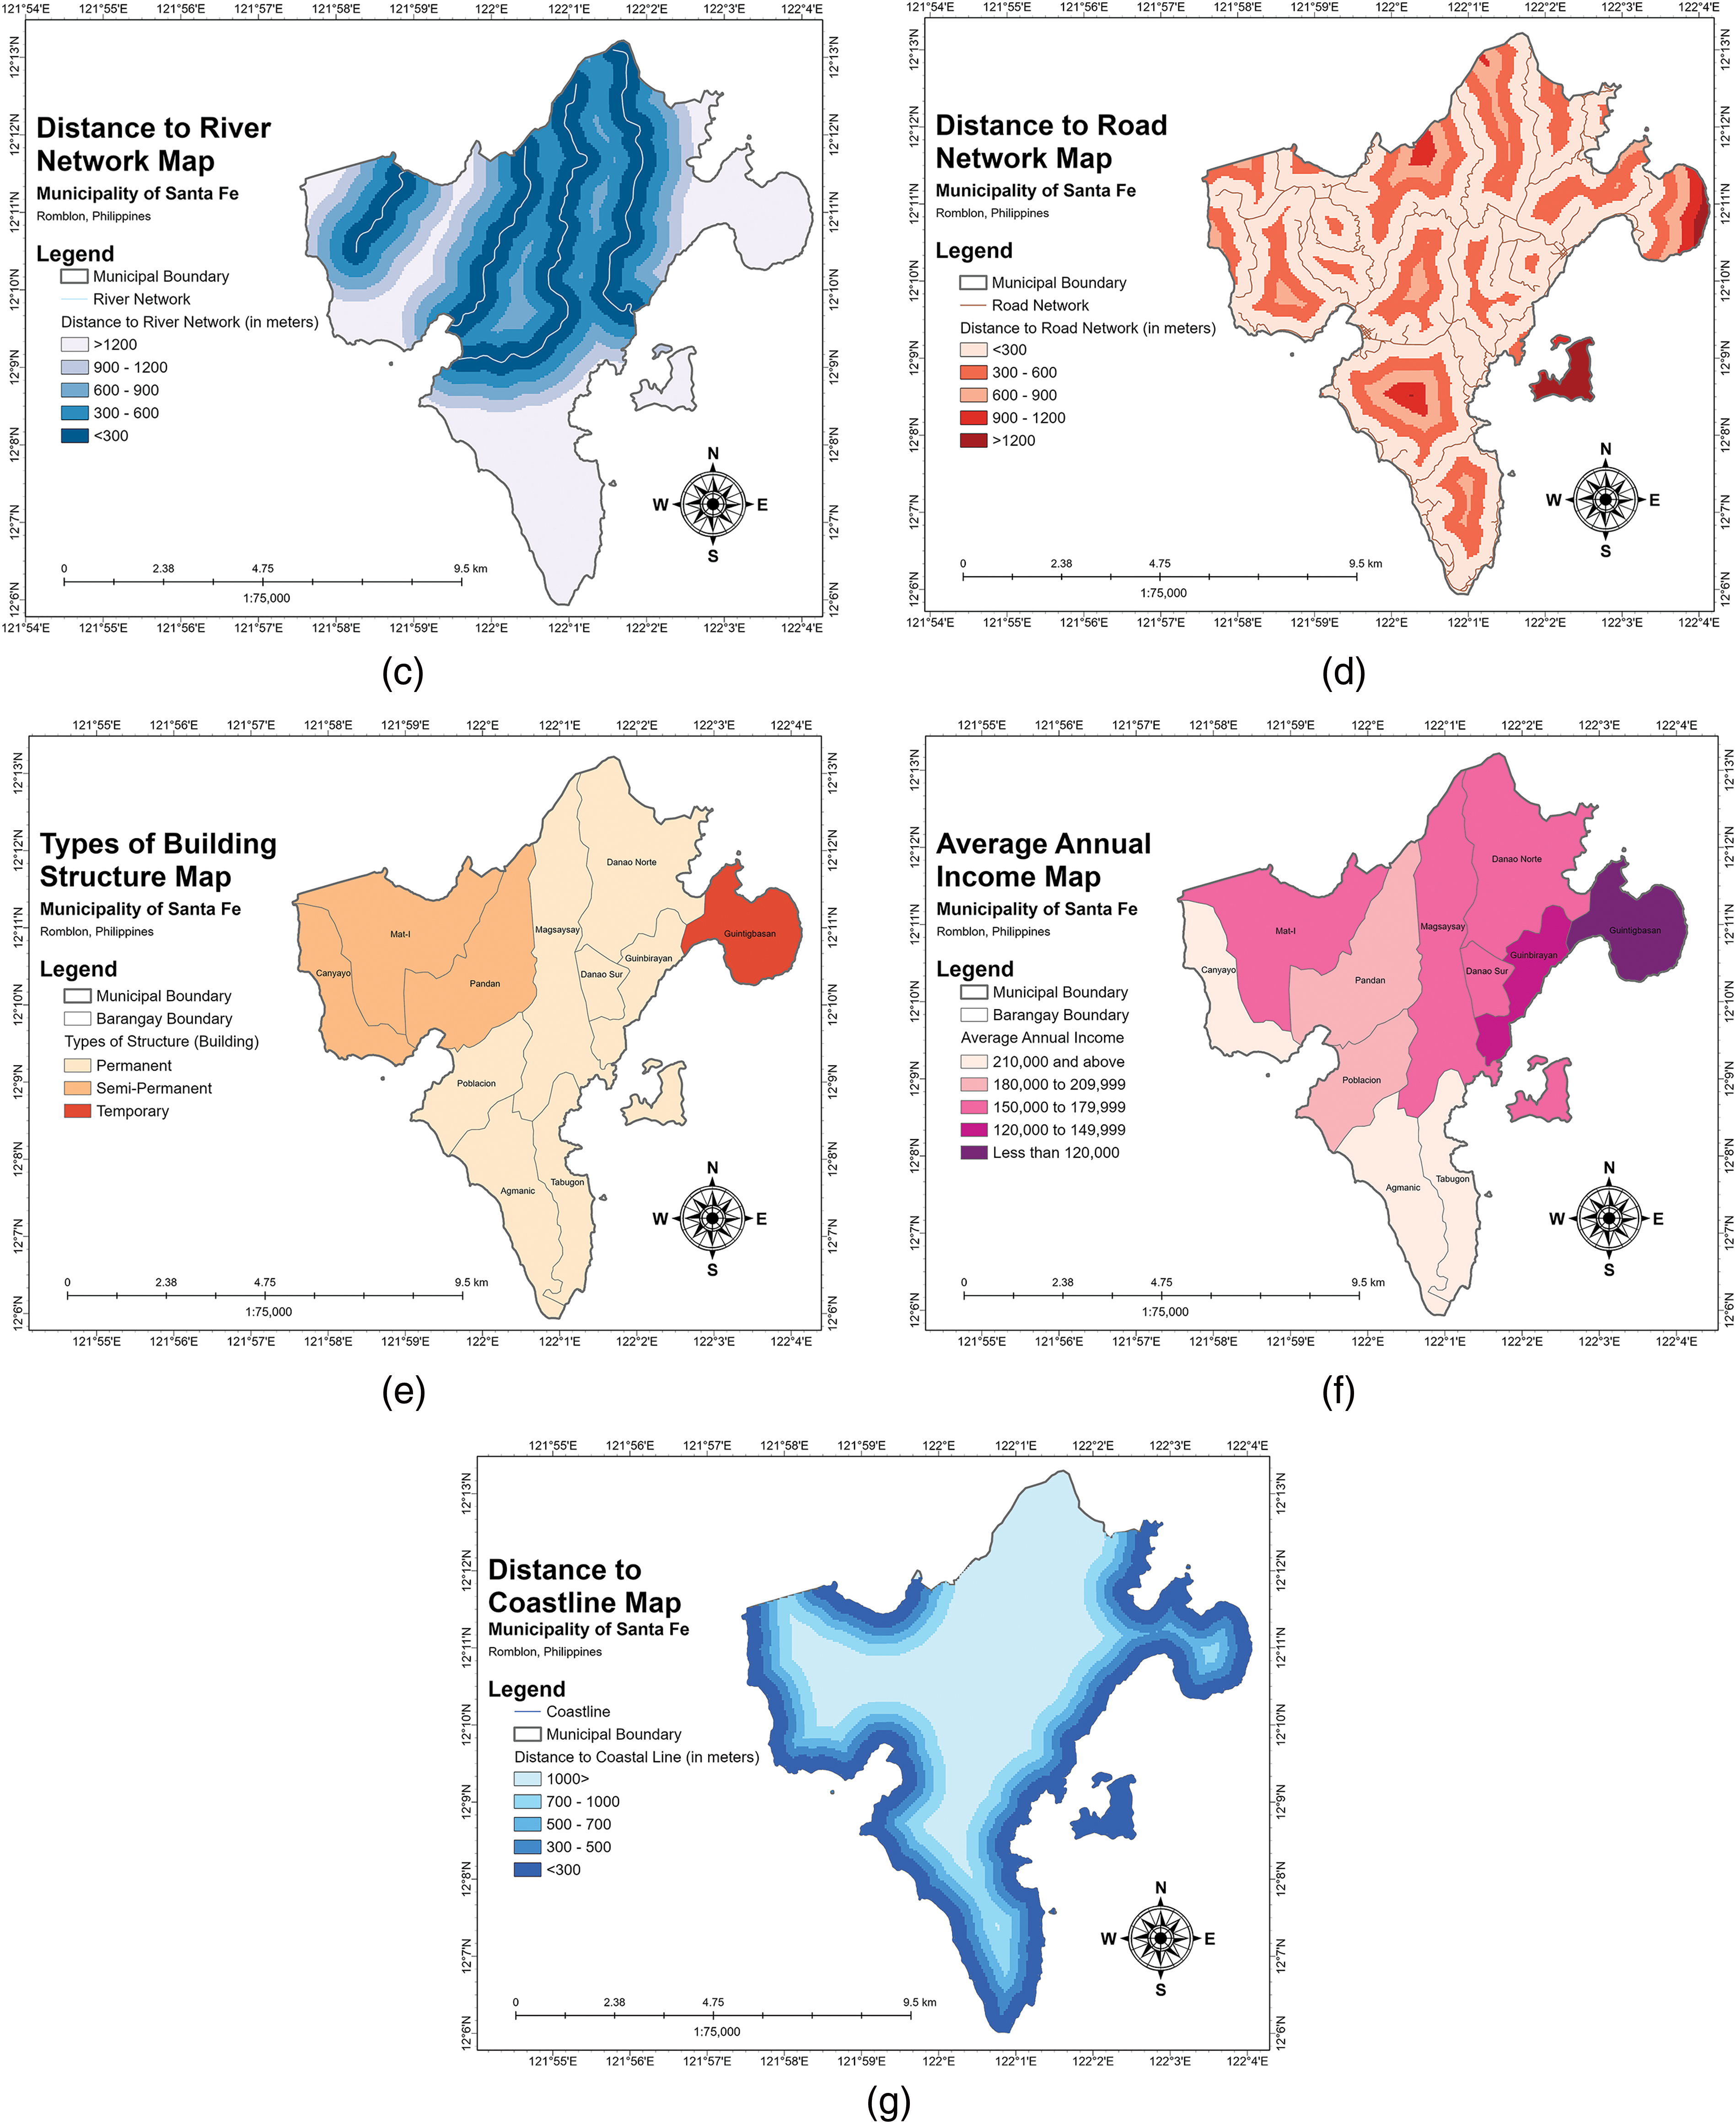
Figure 8: Parameters considered for flood vulnerability: (a) mean age, (b) men-to-women gender ratio, (c) distance to river, (d) road distance, (e) type of building structures, (f) average annual income, and (g) distance to the coastline
The flood exposure assessment identified elements (Fig. 9) vulnerable to flood impact, categorizing them into four groups: distance to evacuation facilities, population density, number of households, and land cover characteristics. Population and household data were sourced from the CBMS of Santa Fe, while healthcare facility coordinates were gathered using Google Earth Pro. Land cover data from NAMRIA, based on the Comprehensive Land Use Plan (CLUP) of Santa Fe, played a crucial role in flood risk mapping. Vegetation cover enhances soil water absorption, while built-up areas increase runoff and flood risk. Understanding these land use and cover patterns is essential for accurately identifying flood-prone areas.
a) The population density map of Santa Fe is shown in Fig. 9a. Barangays Mat-I, Danao Norte, and Guintigbasan have the lowest population density, followed by Pandan, Magsaysay, Agmanic, and Guinbirayan. Danao Sur and Canyayo also have relatively low densities. In contrast, Barangays Poblacion and Tabugon have high population densities.
b) Fig. 9b shows the number of households per barangay in Santa Fe. Barangay Poblacion has over 600 households, indicating high exposure, while Barangays Danao Sur and Guintigbasan have the fewest, with 200 to 300 households.
c) Fig. 9c shows the location and type of evacuation facilities in each barangay, with circles indicating coverage areas ranging from 500 to 2000 meters. This map helps determine how many people can reach these centers within an acceptable walking distance and the capacity needed during a disaster. Sphere standards recommend a minimum of 3.5 square meters per person for short-term shelter, expanding to 3.5 square meters for longer-term needs to ensure health and well-being.
d) Fig. 9d shows the study area’s reclassified land use/land cover map into nine general classes. The map reveals that the majority of the municipality’s land is cultivated. The open forest is in the eastern part, with scattered grassland areas and open/barren land. The built-up areas are concentrated in the town proper.
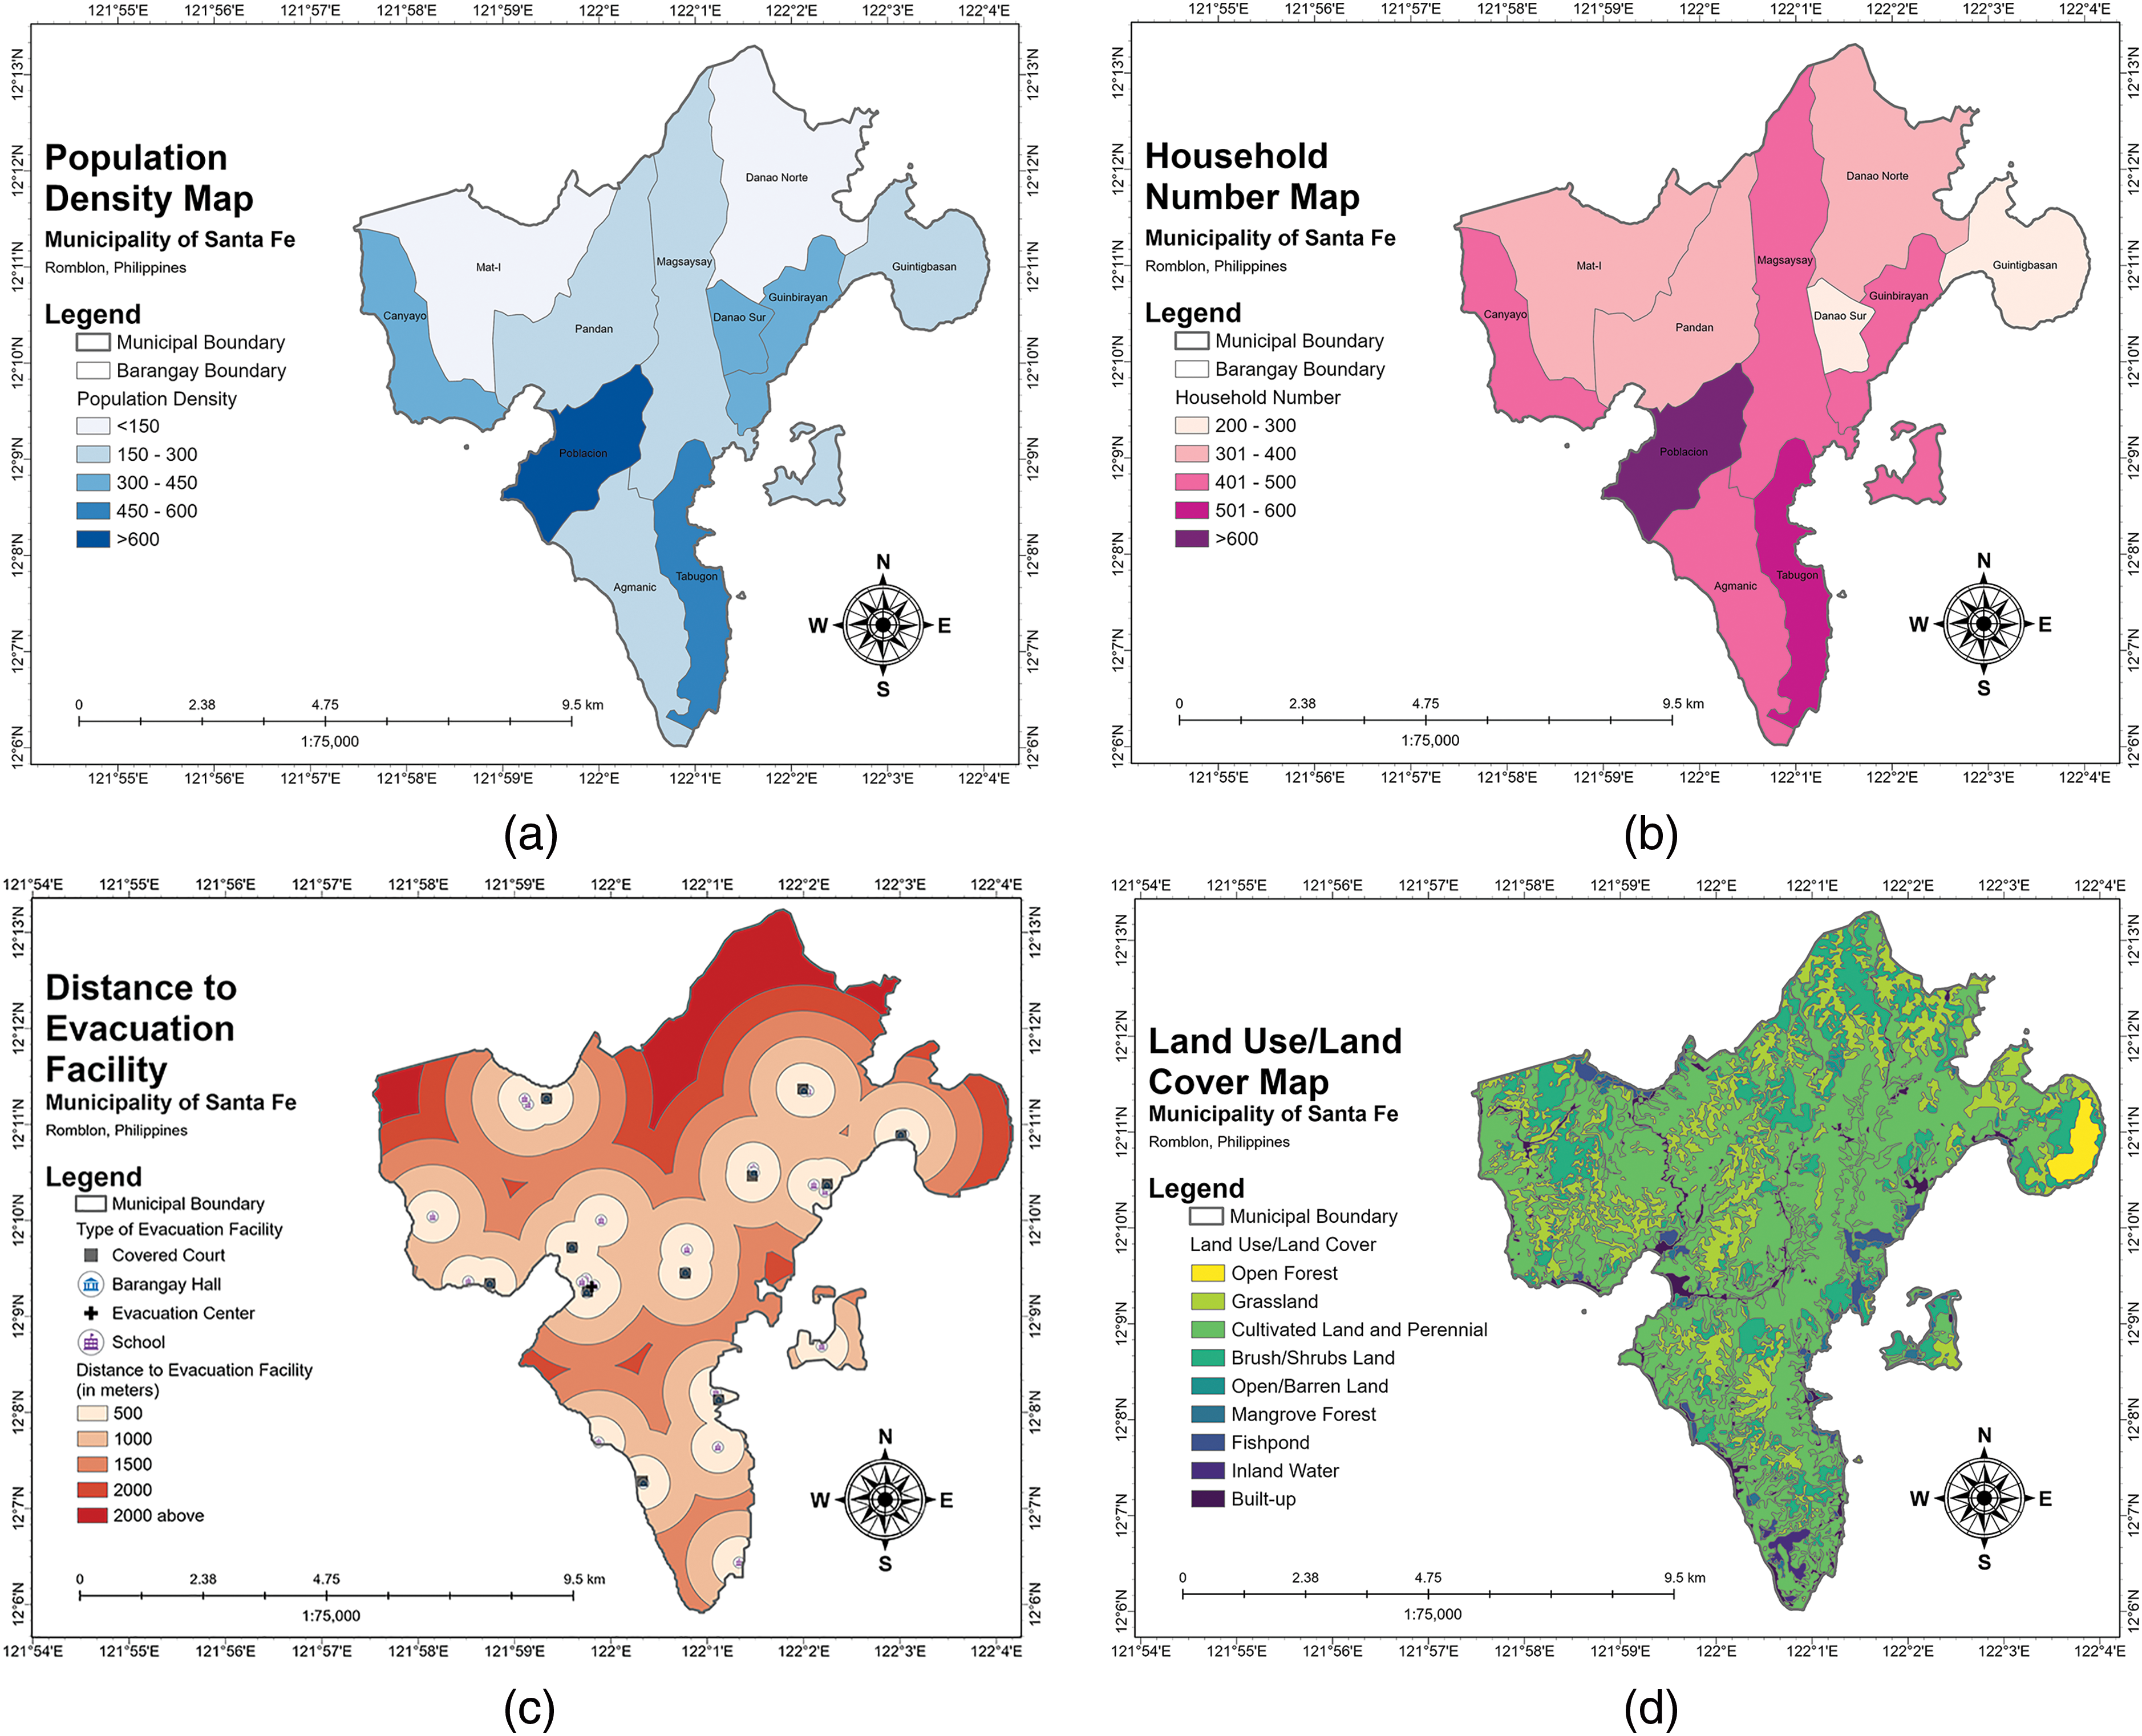
Figure 9: Identified factors for flood exposure: (a) population density, (b) number of households, (c) distance to evacuation facility, and (d) land use/land cover
The flood risk assessment utilized the FAHP to evaluate contributing factors. Ten experts, including hydrologists, engineers, and disaster risk reduction specialists, determined the weights for each parameter using pairwise comparisons. The decision process was organized into a hierarchy with three levels: goal, criteria, and indicators, encompassing flood hazard, vulnerability, and exposure maps. There are no strict guidelines on the minimum sample size for AHP analysis in management and engineering. Studies show varying sample sizes, typically four to nine participants, indicating the method’s flexibility. When selecting judges for decision-making, strategically choosing individuals with the necessary expertise is essential. One expert judge is usually sufficient unless political factors require representation from multiple constituencies. In such cases, selecting several judges may be appropriate, provided they possess the necessary expertise, ensure balanced decision-making, and promote credibility [52].
Feature weights were assigned and normalized on a scale from 1 to 5. Parameters were evaluated based on expert input. The pairwise comparison method involved ten experts assessing the importance of each criterion, resulting in normalized values and relative weights. The final weights were computed as a linear combination of criteria and alternatives. The relative weights for hazard, vulnerability, and exposure parameters are detailed in Table 2, with the highest weights assigned to flood height (45.41%) and land cover/use (44.26%).

These weights were applied in GIS software to create hazard, vulnerability, and exposure maps, aiding in flood risk assessment and management for the Municipality of Santa Fe.
The visual representations of hazard, vulnerability, and exposure are displayed in Fig. 10. These generated maps were created using FAHP criteria weights integrated into a GIS-based workflow involving raster calculations, conversion, extraction, reclassification, and layer clipping.
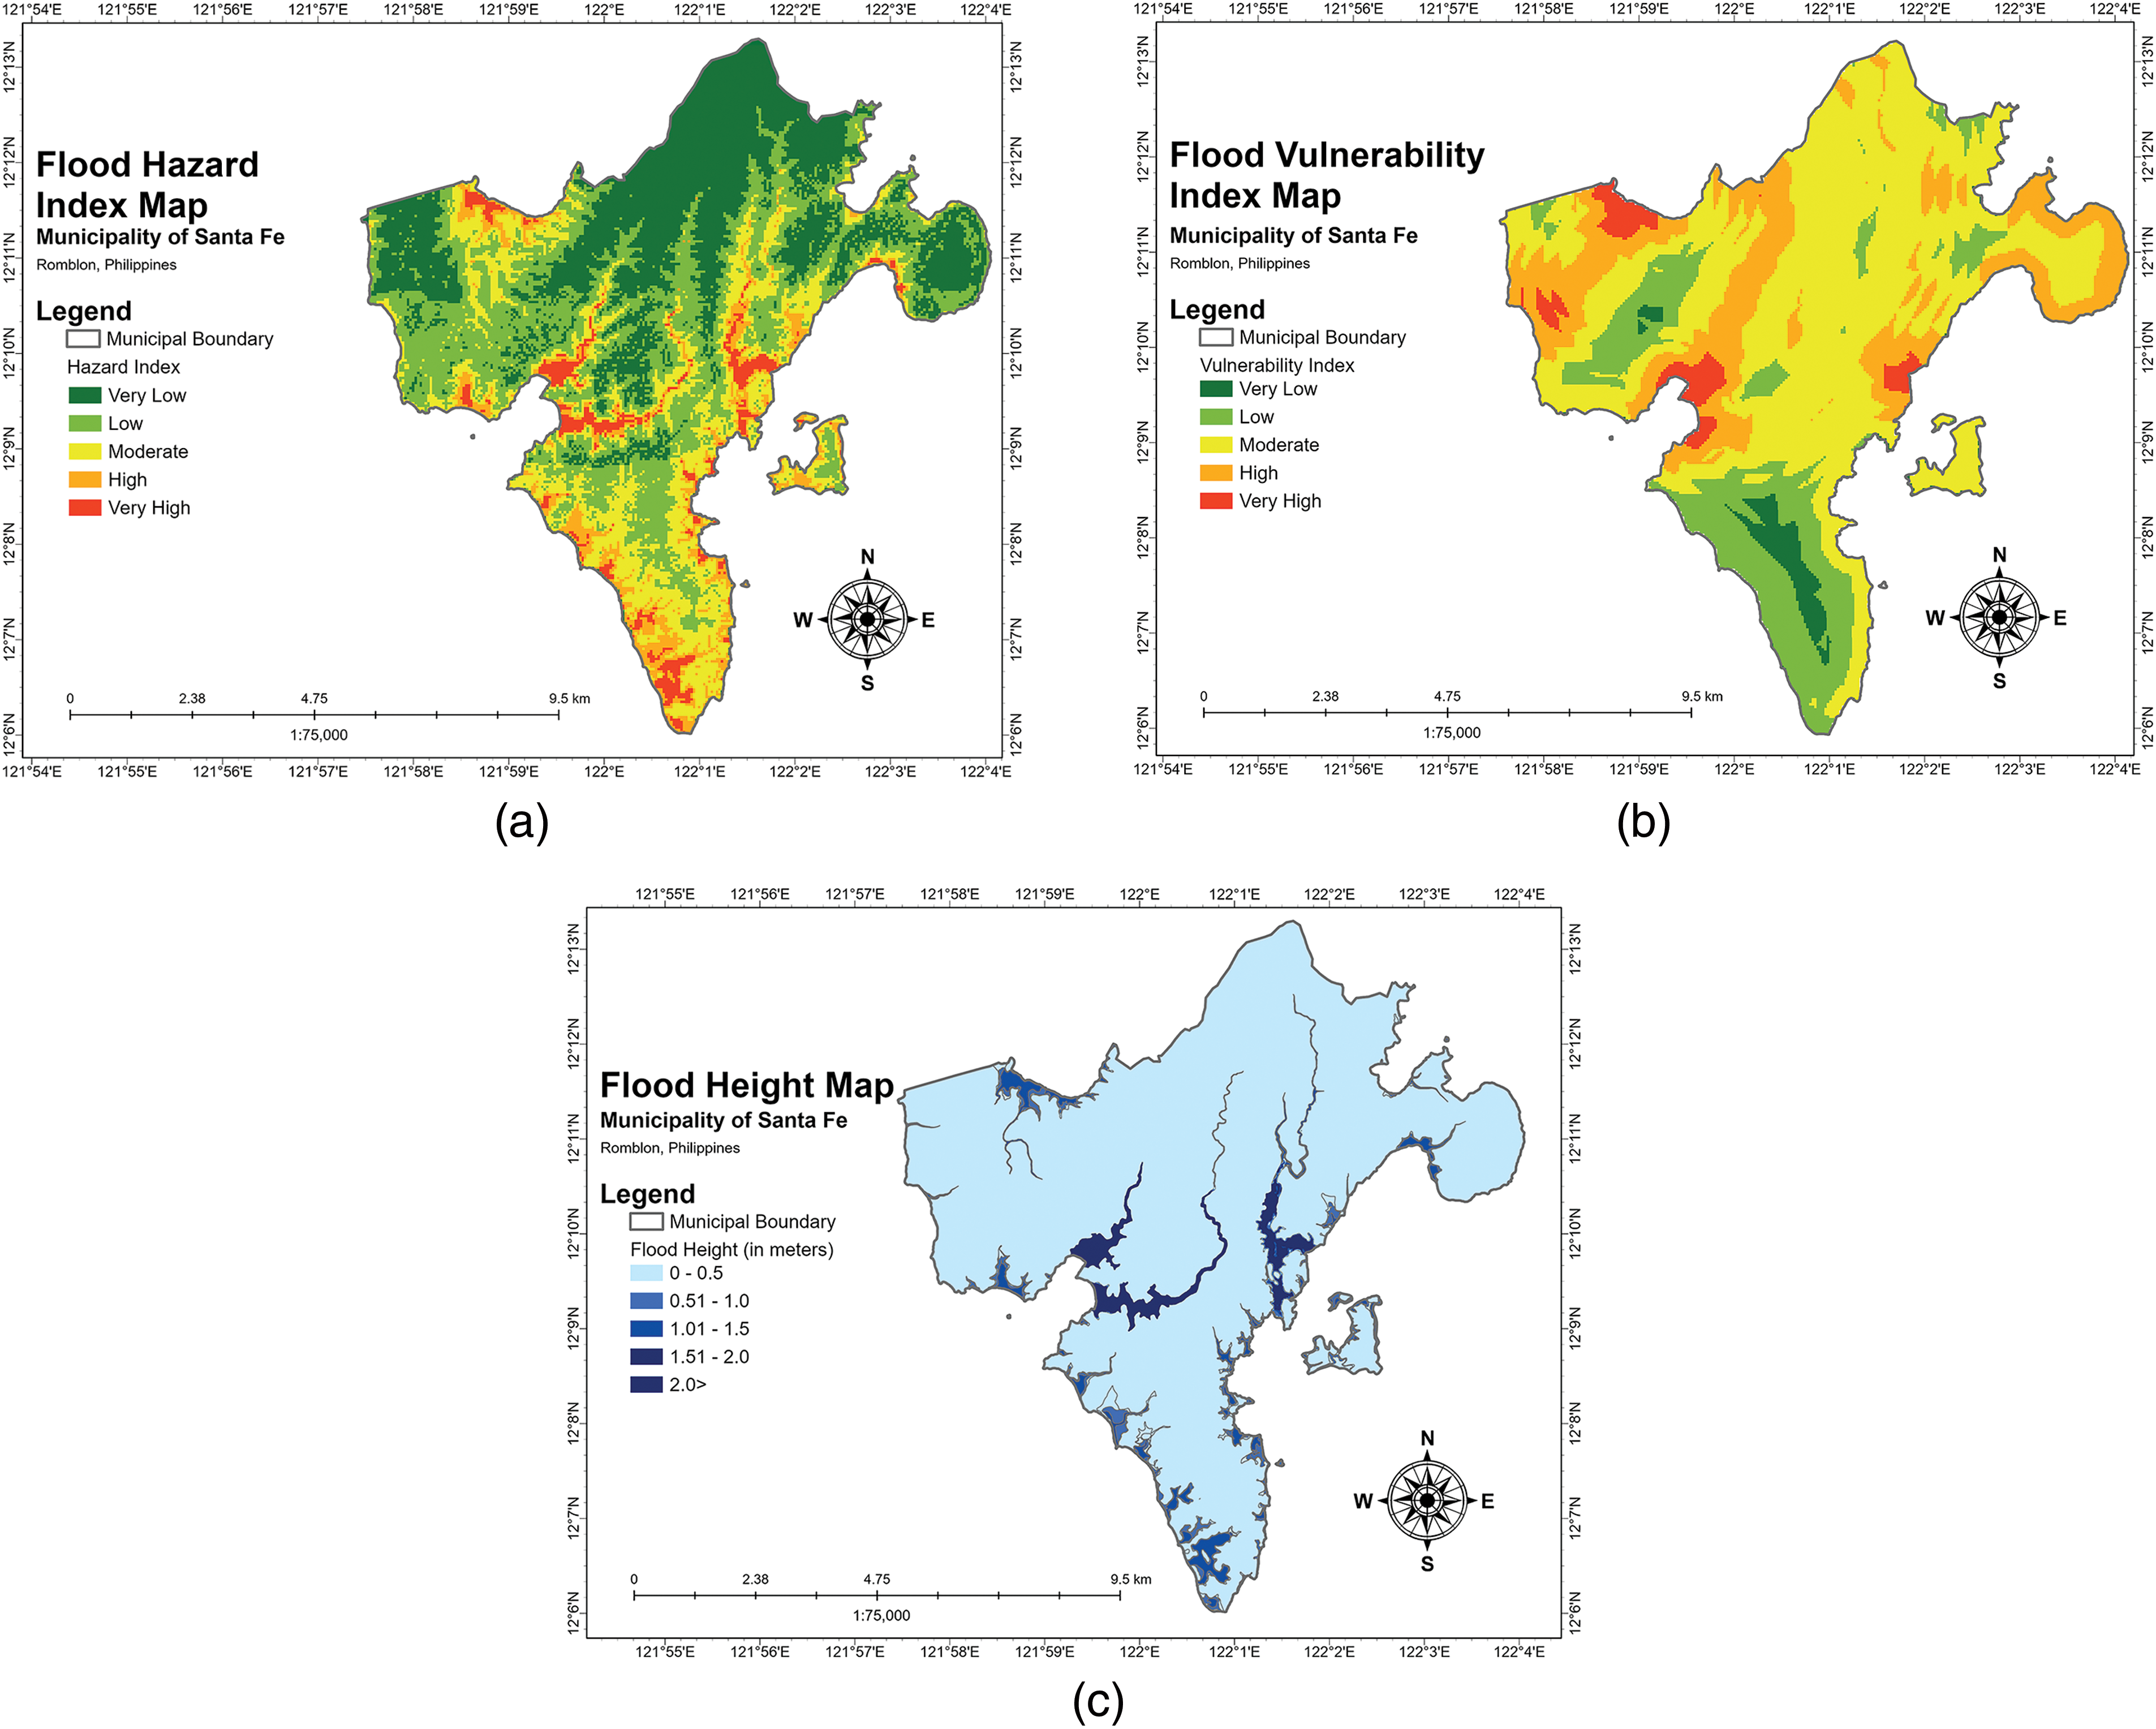
Figure 10: GIS-generated maps for hazard (a), vulnerability (b), and exposure (c) considering the results from FAHP analysis
Fig. 10a shows the Flood Hazard Index Map, classifying areas into five levels: very low (green), low (yellow-green), moderate (yellow), high (orange), and very high (red). The areas covered are 32.15, 34.25, 21.83, 7.57, and 4.19 square kilometers, respectively. Higher hazard levels correspond to regions near river bodies, particularly in Poblacion, Magsaysay, Pandan, Guinbirayan, and Danao Sur. Fig. 10b displays the Flood Vulnerability Index Map, with vulnerability levels classified as very low (green), low (yellow-green), moderate (yellow), high (orange), and very high (red). The distribution is very low (3.03%), low (18.23%), moderate (53.97%), high (21.24%), and very high (3.53%). Only Agmanic and Tabugon show low vulnerability, Guintigbasan has moderate vulnerability, and the rest areas show moderate to high vulnerability. Fig. 10c presents the Flood Exposure Index Map, categorizing exposure into very low (green), low (yellow-green), moderate (yellow), high (orange), and very high (red). The coverage is 21.23%, 46.10%, 17.49%, 12.42%, and 2.76% of Santa Fe, respectively. High exposure is noted in Mat-I, Magsaysay, and Danao Norte, while more than half of the map indicates moderate exposure levels.
The final assessment results were integrated into a comprehensive map (Fig. 11) that combines flood hazard, vulnerability, and exposure indices using GIS software with equal weights. The flood risk map is categorized into five levels: very low (green), low (yellow-green), moderate (yellow), high (orange), and very high (red).
1. Very low risk (green): 0.74 sq km (1.16% of the area).
2. Low risk (yellow-green): 18.77 sq km (29.43%), mainly in Barangay Guintigbasan and parts of Mat-I, Canyayo, Agmanic, Magsaysay, Danao Norte, and Guinbirayan.
3. Moderate risk (yellow): 31.28 sq km (49.05%), affecting all barangays with more than half of their boundaries at moderate risk.
4. High risk (orange): 9.02 sq km (14.14%) in portions of all barangays.
5. Very high risk (red): 3.97 sq km (6.22%), found in Poblacion, Pandan, Mat-I, Danao Sur, and Guinbirayan.
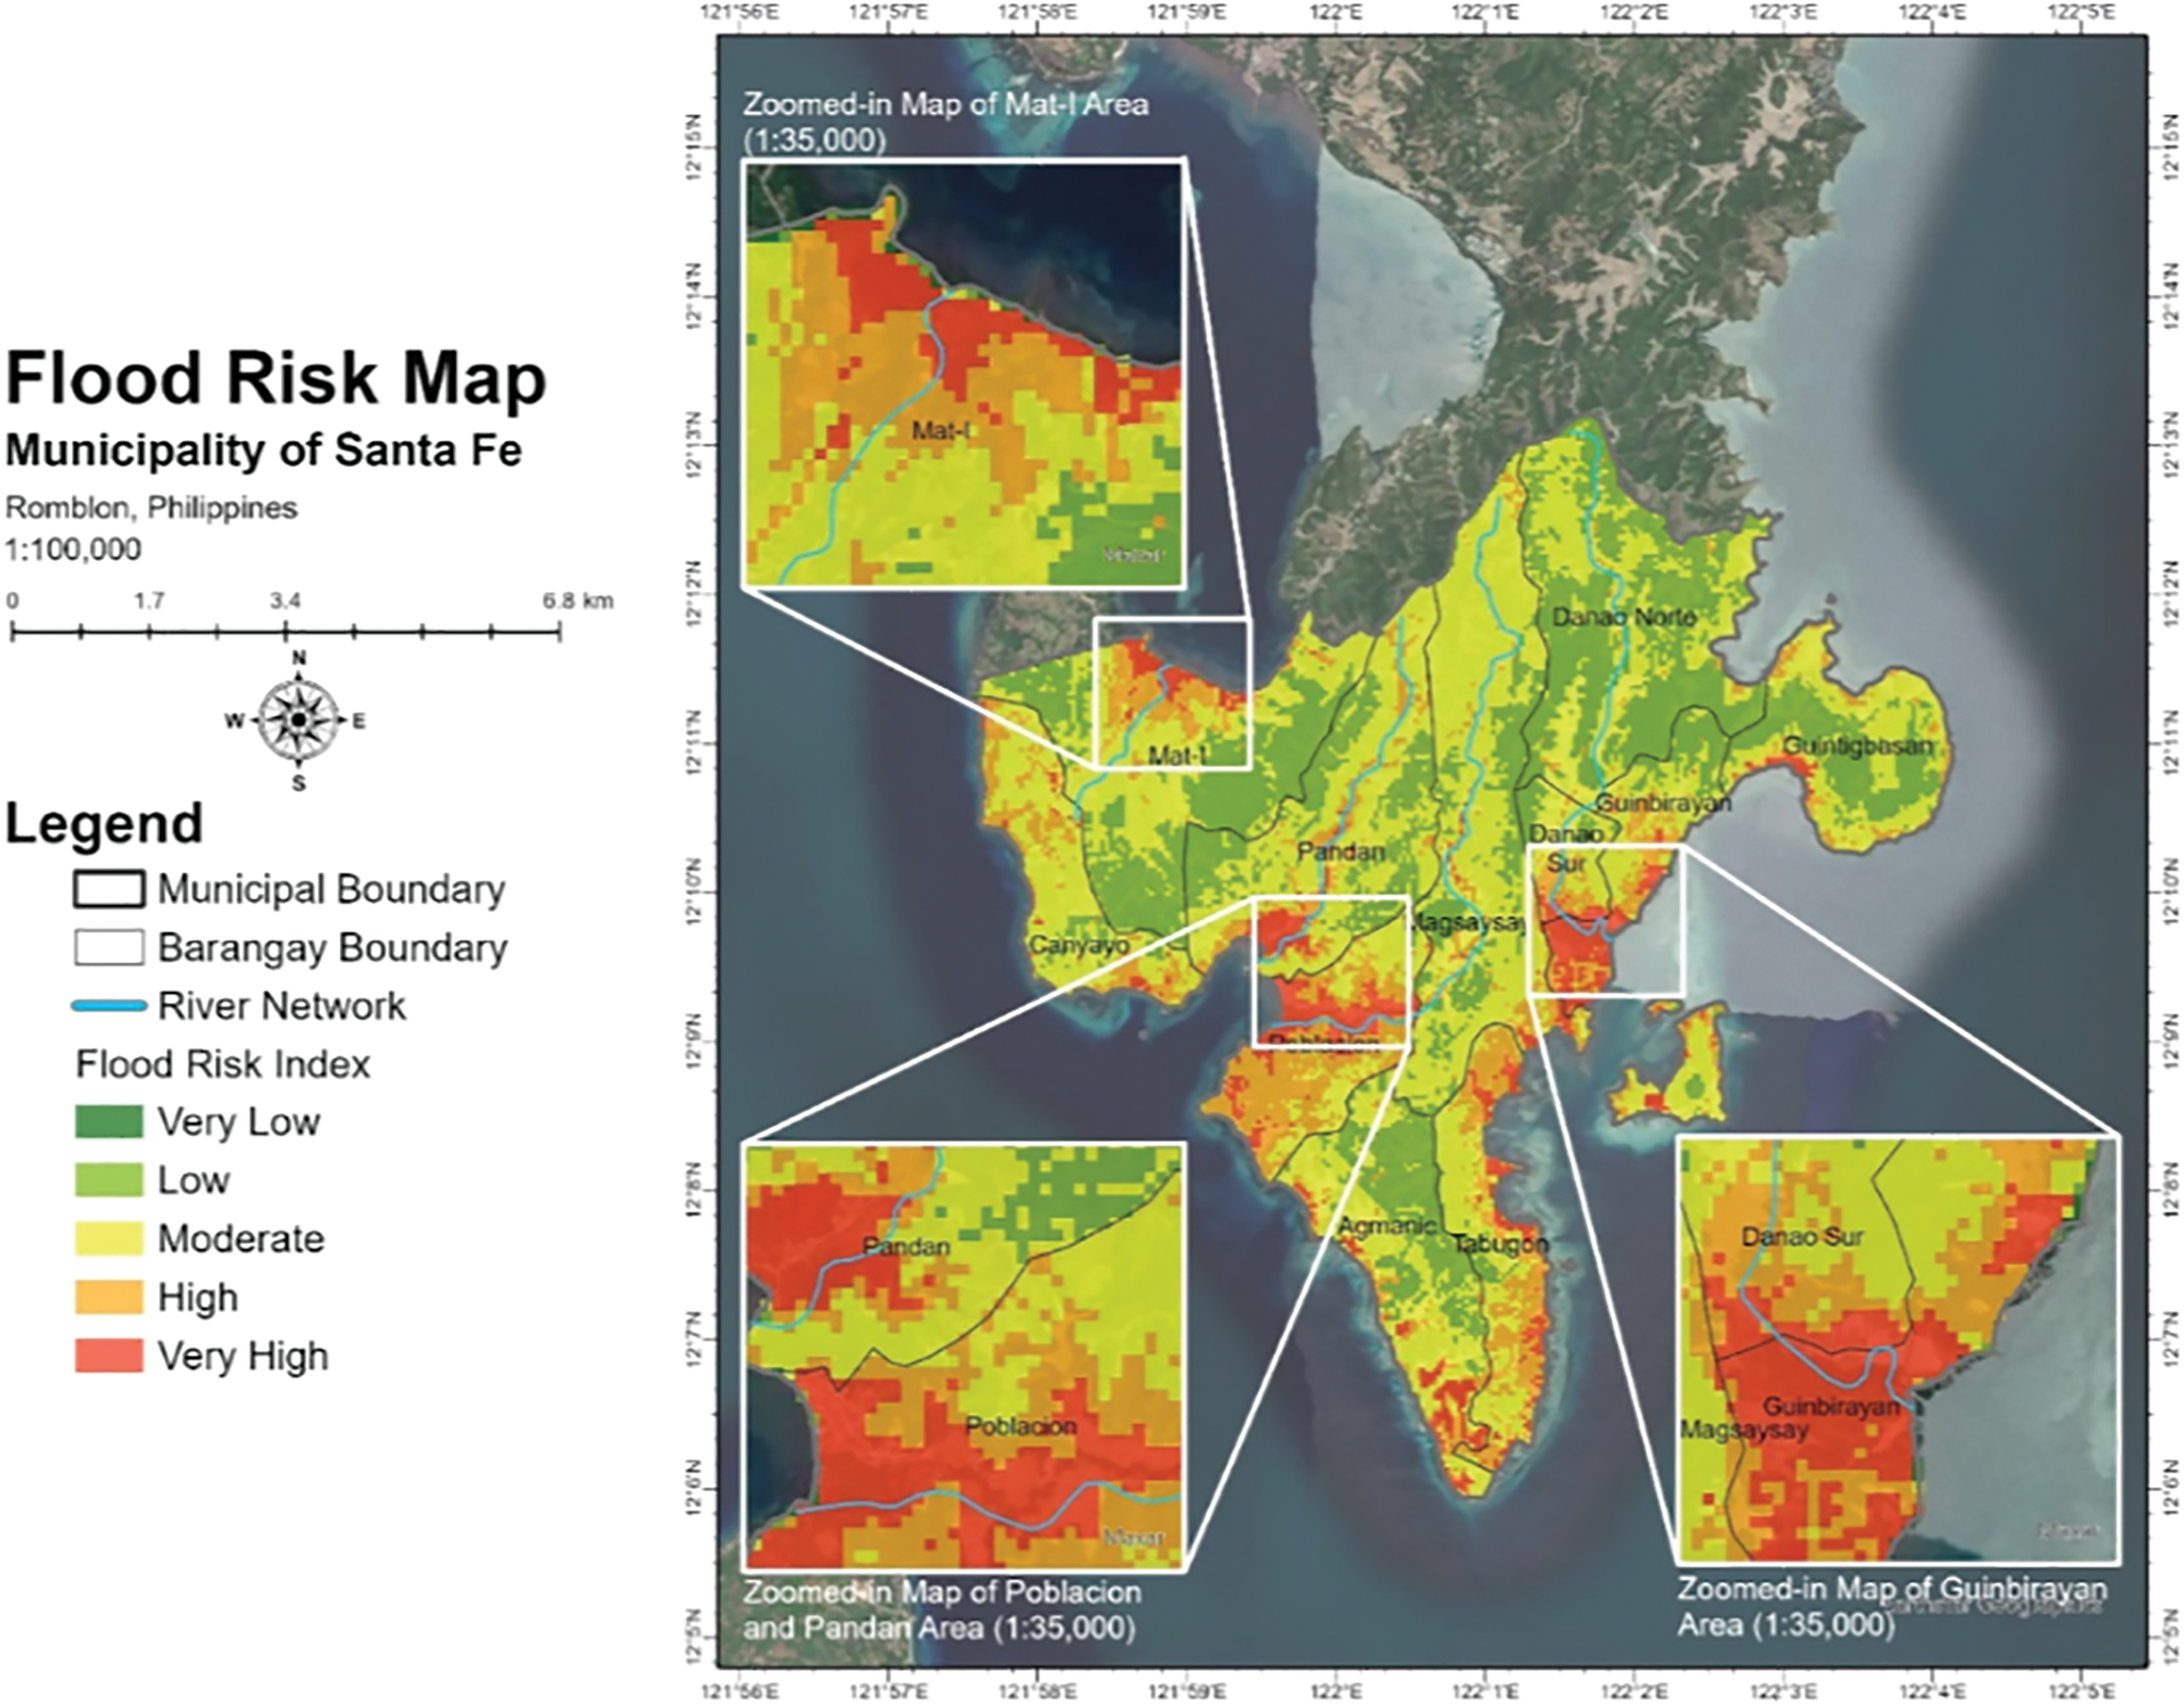
Figure 11: Developed flood risk map of the Municipality of Santa Fe
This map aids municipal policymakers, planning agencies and organizations, and stakeholders in developing flood management plans to mitigate life-threatening risks and guide future infrastructure development.
The impact of disasters in flood-prone areas has intensified due to significant land use changes and climate change effects. Developing a flood risk map that integrates elevation models, demographics, and disaster-related data using the FAHP within a GIS framework is valuable for assessing these risks. This approach utilizes various datasets, including archival, automated, and survey data, to establish risk evaluation criteria. The flood risk map reveals the following risk distribution: 1.16% of the total area is at very low risk, 29.43% at low risk, 49.05% at moderate risk, 14.14% at high risk, and 6.22% at very high risk of flooding. Specifically, the areas falling into each risk category are 0.74 square kilometers at very low risk, 18.77 square kilometers at low risk, 31.28 square kilometers at moderate risk, 9.02 square kilometers at high risk, and 3.97 square kilometers at very high risk.
The map indicates that Barangays Guintigbasan, Danao Norte, Mat-I, Pandan, Agmanic, Magsaysay, and Danao Sur are in low-risk zones. All barangays have areas in moderate-risk zones, mainly along their boundaries. High-risk zones, particularly near river networks and coastlines, are found in Mat-I, Pandan, Poblacion, Danao Sur, Guinbirayan, Canyayo, Agmanic, and Tabugon. Detailed examination of the flood risk map shows that the town proper in Poblacion and specific areas of Pandan, Guinbirayan, Agmanic, Tabugon, Mat-I, and parts of Guintigbasan, located near river networks and coastlines, are at significantly high risk. Urgent action is recommended to develop a comprehensive flood management plan or mitigation strategies for the municipality.
Flood risk assessment is crucial for developing effective flood management and mitigation strategies in cities and municipalities, both rural and urban. Essential parameters for assessing flood hazards include average annual rainfall, slope, elevation, flood height, and soil type. Among these, flood height is the most critical parameter, holding the highest weight at 45.41%, underscoring its importance in determining hazard levels.
Conversely, soil type has the lowest weight at 4.44%, implying its minor role in flood hazard assessment. For flood vulnerability, parameters such as distance to rivers, roads, mean age, gender ratio, average income, and building structure types are considered. Distance to the river is the most significant, weighing 40.34%. Exposure assessment includes land use, population density, household numbers, and distance to evacuation facilities. These parameters collectively help understand exposure levels in flood-prone areas. The methods used in this study can be adapted and modified for cities in the Philippines by adjusting the factors to suit city-specific characteristics.
The factors used in the study were identified through a comprehensive literature review and based on the availability of relevant information in the rural municipality of Santa Fe, Romblon. This ensured that the selected factors were scientifically grounded and contextually appropriate.
The FAHP is suitable for multicriteria decision-making in flood risk assessment [53]. This method improves the comprehensiveness and precision of flood risk assessments by integrating hazard, vulnerability, and exposure parameters into a single framework. FAHP’s capacity provides valuable insights for prioritizing mitigation measures and enhancing community resilience against floods [24,53]. Advanced decision-making methodologies like FAHP are essential for addressing complex challenges in flood risk assessment. The FAHP method, in this study, effectively handled uncertainties and subjectivities in expert judgments, resulting in a robust and reliable weighting scheme.
The FAHP was employed to assign weights to these factors. A panel of 10 experts from academia, government offices, engineering fields, and the LGU, all with experience in flood-related activities, conducted pairwise comparisons of the factors. Their judgments were aggregated to derive the relative weights.
The study employs the FAHP methodology, which uses expert judgments to assign weights to various factors influencing flood risk. These weights can vary based on the experts’ perspectives and experiences, potentially affecting the resulting hazard map. The FAHP methodology systematically and transparently captures expert opinions to minimize subjective biases. The study involves diverse experts from academia, government, engineering, and LGUs to ensure a balanced assessment. Additionally, the model’s sensitivity is analyzed to understand how changes in expert opinions may impact the final hazard map. While consulting different experts might alter the hazard map, the core FAHP methodology ensures that these changes are scientifically robust and based on expert knowledge.
The flood risk assessment included critical topographical and landform-related factors: elevation, soil type, and slope. These parameters are essential for understanding the terrain’s influence on flood dynamics and risk. Additionally, land use was incorporated as it significantly impacts water runoff and infiltration. This comprehensive approach ensured a thorough flood risk assessment in the rural municipality of Santa Fe, Romblon, accounting for the influence of topography and landform.
The quality of topographic data significantly influences the generation of flood hazard maps. High-resolution DEMs such as IfSAR DTM from NAMRIA ensure the accuracy and reliability of topographic factors affecting flood dynamics [17,54]. While LiDAR-derived DEMs are commonly used, IfSAR DTM provides consistent results, highlighting its utility in flood hazard mapping.
In the vulnerability assessment, the sex ratio and average income are critical parameters for understanding the socio-economic dynamics influencing flood risk. The sex ratio, representing the ratio of males to females, significantly impacts vulnerability. Gender roles and socio-cultural norms can affect individuals’ ability to respond to and recover from floods. Women often face different access to resources, social networks, decision-making processes, and caregiving responsibilities that limit their mobility and economic recovery after floods. By considering the sex ratio, gender-specific vulnerabilities can be identified, and inclusive flood risk management strategies can be designed. Average income directly influences a community’s capacity to prepare for, respond to, and recover from floods. Higher-income levels allow for better-quality housing, flood defenses, and insurance, reducing vulnerability. Conversely, lower-income communities often lack financial resources for effective flood mitigation measures and have limited access to emergency services, making them more susceptible and slower to recover. Including average income in the assessment helps identify economically disadvantaged areas needing additional support.
Effective disaster management strategies require a thorough assessment of flood risk areas. Various methodologies have been proposed, including hybrid intelligence models [55,56] and quantitative risk assessment methods [11,57,58]. FAHP is a practical and user-friendly tool for decision-makers and flood managers due to its flexibility and simplicity in multicriteria decision-making [23]. Integrating social, economic, environmental, technical, and ecological factors, FAHP offers a systematic approach compared to traditional flood mapping methods, which often focus on narrow criteria [1,59]. FAHP includes environmental factors like vegetation cover and land use, socio-economic indicators like income levels and population density [53], and technical aspects like infrastructure resilience and early warning systems [7]. This comprehensive approach provides a nuanced understanding of flood dynamics, informing more effective flood management strategies.
Mitigation measures are crucial for reducing the impacts of floods and enhancing community resilience. Various approaches, from economic evaluations to structural flood defense models, highlight the importance of an integrated approach to flood risk management [60,61]. Innovative strategies, such as converting floodwater into a valuable resource and implementing engineering solutions, demonstrate the potential for sustainable flood risk mitigation [62]. Comprehensive research efforts and utilizing output maps are vital for informing flood management strategies and promoting sustainable development in flood-prone zones. This research provides several key managerial insights crucial for enhancing flood risk management in rural municipalities:
1. The GIS-based flood risk map enables local governments to make informed and targeted decisions for effective flood mitigation and preparedness.
2. Identifying high-risk areas allows for prioritizing resources for regions that need immediate attention.
3. Involving local experts ensures the findings are grounded in local knowledge, enhancing community support for flood risk management.
4. The flood risk map is a foundational tool for long-term planning, guiding infrastructure development and land use planning.
5. Insights from the study inform the creation of policies and regulations aimed at reducing flood risk, such as zoning laws and building codes.
6. The methodology can be adapted and replicated, building local flood risk assessment and management capacities.
7. Integrating flood risk considerations into development practices helps create more resilient communities.
8. Future studies should integrate data-driven methods, such as statistical analyses and machine learning, to analyze flood risk parameters and enhance assessment accuracy. Combining FAHP with these techniques will leverage both expert judgments and empirical data.
The frequent flooding events in the Municipality of Santa Fe have caused significant property damage and posed severe risks to lives, underscoring the need for comprehensive flood risk assessments using GIS-based techniques and multicriteria decision analysis. This study evaluated flood risk by integrating relevant factors with the FAHP and aligning with the Sendai Framework. The research utilized GIS, HEC-RAS, and HEC-HMS to map and model primary and secondary data parameters. Critical parameters for hazard assessment included average annual rainfall, elevation, slope, soil type, and flood height. Vulnerability and exposure parameters included gender ratio, mean age, income, distances to rivers, roads, coastlines, building types, evacuation facilities, population density, land cover, and household numbers. The flood risk map specified that 1.16% of the area had very low risk, 29.43% had low risk, 49.05% had moderate risk, 14.14% had high risk, and 6.22% had very high risk, with specific high-risk areas in Mat-I, Pandan, Poblacion, Danao Sur, Guinbirayan, Agmanic, and Tabugon.
These results are crucial for enhancing flood management strategies by addressing hazard, vulnerability, and exposure factors. The findings can assist municipal councils, planning agencies, and stakeholders in integrating flood risks into comprehensive land use plans. Future research should expand assessments to cover the entire municipality for a deeper understanding of localized risks, utilize current and accurate data, incorporate advanced mapping tools like GIS software, and employ high-resolution DEM data from LiDAR for precise flood modeling. Additionally, including up-to-date demographic and disaster risk data will improve assessment accuracy. Developing potential flood mitigation projects, such as repurposing floodwater for water supply, can benefit the local water district and assist barangays lacking clean water access.
Acknowledgement: The authors express their gratitude to the editors and reviewers for their valuable feedback and recommendations.
Funding Statement: The authors did not receive any specific funding for this study.
Author Contributions: The authors confirm their contribution to the paper as follows: study conception and design: Jerome Gacu; data collection: Li-Anne Gacul, Dexter Ferrancullo, KC Jane Fadriquela, Romel Gallano, Kyla Jane Mendez, John Rommel Morada, John Kevin Morgado; analysis and interpretation of results: Li-Anne Gacul, Dexter Ferrancullo, Jerome Gacu; draft manuscript preparation: Jerome Gacu. All authors reviewed the results and approved the final version of the manuscript.
Availability of Data and Materials: The authors agreed to turn over the necessary data and study results in the Municipality of Santa Fe, Romblon, Philippines.
Ethics Approval: Not applicable.
Conflicts of Interest: The authors declare that there are no conflicts of interest to report regarding the present study.
References
1. Gacu JG, Monjardin CEF, de Jesus KLM, Senoro DB. GIS-based risk assessment of structure attributes in flood zones of Odiongan, Romblon, Philippines. Buildings. 2023;13:506. doi:10.3390/buildings13020506. [Google Scholar] [CrossRef]
2. Kia MB, Pirasteh S, Pradhan B, Mahmud AR, Sulaiman WNA, Moradi A. An artificial neural network model for flood simulation using GIS: Johor River Basin, Malaysia. Malaysia Environ Earth Sci. 2012;67:251–64. doi:10.1007/s12665-011-1504-z. [Google Scholar] [CrossRef]
3. Oladimeji OE, Ohwo O. Assessment of flood risk and mapping of flood risk zones in Yenagoa, Bayelsa State, Nigeria. J Appl Sci Environ Manage. 2022;26:219–26. doi:10.4314/jasem.v26i2.7. [Google Scholar] [CrossRef]
4. Kurata YB, Ong AKS, Ang RYB, Angeles JKF, Bornilla BDC, Fabia JLP. Factors affecting flood disaster preparedness and mitigation in flood-prone areas in the philippines: an integration of protection motivation theory and theory of planned behavior. Sustainability. 2023;15:6657. doi:10.3390/su15086657. [Google Scholar] [CrossRef]
5. Jha S, Martinez A, Quising P, Ardaniel Z, Wang L. Natural disasters, public spending, and creative destruction: a case study of the philippines; 2018. ADBI Working Paper No. 817. doi:10.2139/ssrn.3204166. [Google Scholar] [CrossRef]
6. Jia J, Wang X, Hersi NAM, Zhao W, Liu Y. Flood-risk zoning based on analytic hierarchy process and fuzzy variable set theory. Nat Hazards Rev. 2019;20:4019006. doi:10.1061/(ASCE)NH.1527-6996.0000329. [Google Scholar] [CrossRef]
7. Tehrany MS, Pradhan B, Jebur MN. Spatial prediction of flood susceptible areas using rule based decision tree (DT) and a novel ensemble bivariate and multivariate statistical models in GIS. J Hydrol. 2013;504:69–79. doi:10.1016/j.jhydrol.2013.09.034. [Google Scholar] [CrossRef]
8. Maling JP, Bonifacio F, Manila M. Application of Geographic Information System (GIS) and remote sensing to land assessment in the philippines. 1988;781–7. [Google Scholar]
9. Climate Change Commission. Geographic informatio system for climate and disaster risk assessment; 2017. [Google Scholar]
10. Cabrera JS, Lee HS. Impacts of climate change on flood-prone areas in Davao Oriental, Philippines. Water. 2018;10:893. doi:10.3390/w10070893. [Google Scholar] [CrossRef]
11. Cabrera JS, Lee HS. Flood risk assessment for Davao Oriental in the Philippines using geographic information system-based multi-criteria analysis and the maximum entropy model. J Flood Risk Manage. 2020;13:1–17. doi:10.1111/jfr3.12607. [Google Scholar] [CrossRef]
12. Croneborg L, Saito K, Matera M, Mckeown D, Aardt J. Digital Elevation Model: a guidance note on how Digital Elevation Models are created and used-includes key definitions. Sample terms of reference and how best to plan a DEM-mission. International Bank for Reconstruction and Development; 2015. [Google Scholar]
13. Vaze J, Teng J, Spencer G. Impact of DEM accuracy and resolution on topographic indices. Environ Model Softw. 2010;25:1086–98. doi:10.1016/j.envsoft.2010.03.014. [Google Scholar] [CrossRef]
14. Mercer B. Comparing LIDAR and IFSAR: what can you expect? In: Proceedings of Photogrammetric Week, 2001; Stuttgart. [Google Scholar]
15. Pedrozo-Acuña A, Rodríguez-Rincón JP, Arganis-Juárez M, Domínguez-Mora R, González Villareal FJ. Estimation of probabilistic flood inundation maps for an extreme event: pánuco River, México. J Flood Risk Manage. 2015;8:177–92. doi:10.1111/jfr3.12067. [Google Scholar] [CrossRef]
16. Monjardin CEF, Transfiguracion KM, Mangunay JPJ, Paguia KM, Uy FAA, Tan FJ. Determination of river water level triggering flood in Manghinao River in Bauan, Batangas, Philippines. J Mech Eng. 2021;18:181–92. [Google Scholar]
17. Ogania JL, Puno GR, Alivio MBT, Taylaran JMG. Effect of digital elevation model’s resolution in producing flood hazard maps. Glob J Environ Sci Manage. 2019;5:95–106. doi:10.22034/gjesm.2019.01.08. [Google Scholar] [CrossRef]
18. Al-harbi KMA. The analytic hierarchy process. Eur J Oper Res. 1990;45:378. doi:10.1016/0377-2217(90)90209-t. [Google Scholar] [CrossRef]
19. Kadri CB, Nasrallah Y. GIS-based AHP technique for assessment of desertification in western highlands of Algeria. J Geovisualization Spat Anal. 2023;7:18. doi:10.1007/s41651-023-00147-z. [Google Scholar] [CrossRef]
20. Mokhtari E, Abdelkebir B, Djenaoui A, Hamdani NEH. Integrated analytic hierarchy process and fuzzy analytic hierarchy process for Sahel watershed flood susceptibility assessment, Algeria. Water Pract Technol. 2024;19:453–75. doi:10.2166/wpt.2024.012. [Google Scholar] [CrossRef]
21. Sun N, Li C, Guo B, Sun X, Yao Y, Wang Y. Urban flooding risk assessment based on FAHP–EWM combination weighting: a case study of Beijing. Geomatics, Nat Hazards Risk. 2023;14:116. doi:10.1080/19475705.2023.2240943. [Google Scholar] [CrossRef]
22. Yang XL, Ding JH, Hou H. Application of a triangular fuzzy AHP approach for flood risk evaluation and response measures analysis. Nat Hazards. 2013;68:657–74. doi:10.1007/s11069-013-0642-x. [Google Scholar] [CrossRef]
23. Ouma YO, Tateishi R. Urban flood vulnerability and risk mapping using integrated multi-parametric AHP and GIS: methodological overview and case study assessment. Water. 2014;6:1515–45. doi:10.3390/w6061515. [Google Scholar] [CrossRef]
24. Boroushaki S, Malczewski J. Using the fuzzy majority approach for GIS-based multicriteria group decision-making. Comput Geosci. 2010;36:302–12. doi:10.1016/j.cageo.2009.05.011. [Google Scholar] [CrossRef]
25. Gacu JG, Monjardin CEF, Senoro DB, Tan FJ. Flood risk assessment using GIS-based analytical hierarchy process in the municipality of Odiongan, Romblon, Philippines. Appl Sci. 2022;12:1–33. doi:10.3390/app12199456. [Google Scholar] [CrossRef]
26. Boonmee C, Thoenburin P. Temporary safety zone site selection during haze Pollution: an integrated approach with FAHP and FTOPSIS. Expert Syst Appl. 2024;245:123002. doi:10.1016/j.eswa.2023.123002. [Google Scholar] [CrossRef]
27. Vahidnia MH, Alesheikh A, Alimohammadi A, Bassiri A. Fuzzy analytical hierarchy process in GIS application. Int Arch Photogramm Remote Sens Spat Inf Sci. 2008;37:593–6. [Google Scholar]
28. Cai S, Fan J, Yang W. Flooding risk assessment and analysis based on GIS and the TFN-AHP method: a case study of Chongqing, China. Atmosphere. 2021;12:623. doi:10.3390/atmos12050623. [Google Scholar] [CrossRef]
29. Peng G, Han L, Liu Z, Guo Y, Yan J, Jia X. An application of fuzzy analytic hierarchy process in risk evaluation model. Front Psychol. 2021;12:1–12. doi:10.3389/fpsyg.2021.715003. [Google Scholar] [PubMed] [CrossRef]
30. Putra MSD, Andryana S, Fauziah, Gunaryati A. Fuzzy analytical hierarchy process method to determine the quality of gemstones. Adv Fuzzy Syst. 2018;2018:1–6. doi:10.1155/2018/9094380. [Google Scholar] [CrossRef]
31. Economic and Social Commission for Asia and the Pacific. Disasters in Asia and the Pacific: 2015 Year in Review. United Nations ESCAP. 2015. [Google Scholar]
32. Mujib MA, Apriyanto B, Kurnianto FA, Ikhsan FA, Nurdin EA, Pangastuti EI, et al. Assessment of flood hazard mapping based on Analytical Hierarchy Process (AHP) and GIS: application in Kencong District, Jember Regency, Indonesia. Geosfera Indonesia. 2021;6:353–76. [Google Scholar]
33. Das S, Pardeshi SD. Integration of different influencing factors in GIS to delineate groundwater potential areas using IF and FR techniques: a study of Pravara basin, Maharashtra, India. Appl Water Sci. 2018;8:59. doi:10.1007/s13201-018-0848-x. [Google Scholar] [CrossRef]
34. Mckenzie R. Assessing the flood hazard and risk of Montego Bay using Geographic Information System-based multicriteria analysis. Chicago State University: USA; 2022. doi:10.13140/RG.2.2.22586.47048. [Google Scholar] [CrossRef]
35. Fatdillah E, Rehan BM, Rameshwaran P, Bell VA, Zulkafli Z, Yusuf B, et al. Spatial estimates of flood damage and risk are influenced by the underpinning DEM resolution: a case study in Kuala Lumpur, Malaysia. Water. 2022;14:2208. doi:10.3390/w14142208. [Google Scholar] [CrossRef]
36. Margatama L, Al-Hikmah SS, Riyanto I, Pebrianti D, Bayuaji L, Sudiana D, et al. Increasing disaster awareness of the community by flood potential mapping of densely-populated urban river watershed in south and west Jakarta with LIDAR data segmentation. In: Proceedings of IEEE International Conference on Applied System Invention; 2018. p. 370–3. doi:10.1109/ICASI.2018.8394611. [Google Scholar] [CrossRef]
37. Danumah JH, Odai SN, Saley BM, Szarzynski J, Thiel M, Kwaku A, et al. Flood risk assessment and mapping in Abidjan district using multi-criteria analysis (AHP) model and geoinformation techniques, (cote d’ivoire). Geoenviron Dis. 2016;3:45. doi:10.1186/s40677-016-0044-y. [Google Scholar] [CrossRef]
38. Nagireddy NR, Keesara VR, Sridhar V, Srinivasan R. Streamflow and sediment yield analysis of two medium-sized East-flowing River Basins of India. Water. 2022;14:1–21. doi:10.3390/w14192960. [Google Scholar] [CrossRef]
39. Prudencio-Rubio CJ, Yu IS, Kim HY, Jeong SM. Index-based flood risk assessment for Metro Manila. Water Sci Technol Water Supply. 2020;20:851–9. doi:10.2166/ws.2020.010. [Google Scholar] [CrossRef]
40. Lee S, Vink K. Assessing the vulnerability of different age groups regarding flood fatalities: case study in the Philippines. Water Policy. 2015;17:1045–61. doi:10.2166/wp.2015.089. [Google Scholar] [CrossRef]
41. Pakhtunkhwa NK, Nazeer M. Flood vulnerability assessment through different methodological approaches in the context of North-West Khyber Pakhtunkhwa. Pakistan Sustain. 2019;11:18. [Google Scholar]
42. Nahin KTK, Islam SB, Mahmud S, Hossain I. Flood vulnerability assessment in the Jamuna river floodplain using multi-criteria decision analysis: a case study in Jamalpur district, Bangladesh. Heliyon. 2023;9:e14520. doi:10.1016/j.heliyon.2023.e14520. [Google Scholar] [PubMed] [CrossRef]
43. Rendana M, Mohd Razi Idris W, Abdul Rahim S, Abdo HG, Almohamad H, Abdullah Al Dughairi A. Flood risk and shelter suitability mapping using geospatial technique for sustainable urban flood management: a case study in Palembang city, South Sumatera, Indonesia. Geol Ecol Landscapes. 2023;8:1–11. doi:10.1080/24749508.2023.2205717. [Google Scholar] [CrossRef]
44. Davis J, Garvey G, Wood M. Developing and managing community water supplies. UK: Practical Action Publishing; 1993. doi:10.3362/9780855986872. [Google Scholar] [CrossRef]
45. Rahadianto H, Fariza A, Hasim JAN. Risk-level assessment system on Bengawan Solo River basin flood prone areas using analytic hierarchy process and natural breaks: study case: East Java. In: Proceedings 2015 International Conference on Data and Software Engineering ICODSE 2015; 2016. p. 195–200. doi:10.1109/ICODSE.2015.7436997. [Google Scholar] [CrossRef]
46. Baccari N, Sebei A, Soussi D, Zouhri L, Saidi S. Flood risk assessment using GIS-MCDM-AHP model: case of the Wadi Chafrou watershed (Northern Tunisia). 2023. doi:10.21203/rs.3.rs-3178408/v1. [Google Scholar] [CrossRef]
47. Al-Hinai H, Abdalla R. Mapping coastal flood susceptible areas using shannon’s entropy model: the case of muscat governorate, Oman. ISPRS Int J Geo-Inform. 2021;10:252. doi:10.3390/ijgi10040252. [Google Scholar] [CrossRef]
48. Al-Hinai HY, Abdalla R. Spatial prediction of coastal flood-susceptible areas in muscat governorate using an entropy weighted method. WIT Trans Eng Sci. 2020;129:121–33. doi:10.2495/RISK200111. [Google Scholar] [CrossRef]
49. Mizumura T, Taguchi H, Nakamura H. Confirming the safety improvement and evacuation time reduction effects by the method for evacuating inundated areas via the shortest possible route. Int J Dis Risk Reduct. 2024;101:104252. doi:10.1016/j.ijdrr.2024.104252. [Google Scholar] [CrossRef]
50. Hammami S, Zouhri L, Souissi D, Souei A, Zghibi A, Marzougui A, et al. Application of the GIS based multi-criteria decision analysis and Analytical Hierarchy Process (AHP) in the flood susceptibility mapping (Tunisia). Arab J Geosci. 2019;12:303. doi:10.1007/s12517-019-4754-9. [Google Scholar] [CrossRef]
51. Youssef AM, Sefry SA, Pradhan B, Alfadail EA. Analysis on causes of flash flood in Jeddah city (Kingdom of Saudi Arabia) of 2009 and 2011 using multi-sensor remote sensing data and GIS. Geomatics, Nat Hazards Risk. 2016;7:1018–42. doi:10.1080/19475705.2015.1012750. [Google Scholar] [CrossRef]
52. Saaty TL, Özdemir MS. How many judges should there be in a group ? Ann Data Sci. 2014;1:359–68. doi:10.1007/s40745-014-0026-4. [Google Scholar] [CrossRef]
53. Cai T, Li X, Ding X, Wang J, Zhan J. Flood risk assessment based on hydrodynamic model and fuzzy comprehensive evaluation with GIS technique. Int J Dis Risk Reduct. 2019;35:101077. doi:10.1016/j.ijdrr.2019.101077. [Google Scholar] [CrossRef]
54. Pornasdoro KP, Silva LC, Munárriz MLT, Estepa BA, Capaque CA. Flood risk of Metro Manila barangays: a GIS based risk assessment using multi-criteria techniques. J Urban Reg Plan. 2014;51–72. [Google Scholar]
55. Costache R, Arabameri A, Elkhrachy I, Ghorbanzadeh O, Pham QB. Detection of areas prone to flood risk using state-of-the-art machine learning models. Geomatics, Nat Hazards Risk. 2021;12:1488–507. doi:10.1080/19475705.2021.1920480. [Google Scholar] [CrossRef]
56. Rafiei-Sardooi E, Azareh A, Choubin B, Mosavi AH, Clague JJ. Evaluating urban flood risk using hybrid method of TOPSIS and machine learning. Int J Dis Risk Reduct. 2021;66:102614. doi:10.1016/j.ijdrr.2021.102614. [Google Scholar] [CrossRef]
57. Feloni E, Mousadis I, Baltas E. Flood vulnerability assessment using a GIS-based multi-criteria approach—The case of Attica region. J Flood Risk Manage. 2020;13:1–15. doi:10.1111/jfr3.12563. [Google Scholar] [CrossRef]
58. Kokangül A, Polat U, Dağsuyu C. A new approximation for risk assessment using the AHP and fine Kinney methodologies. Saf Sci. 2017;91:24–32. doi:10.1016/j.ssci.2016.07.015. [Google Scholar] [CrossRef]
59. Monjardin CEF, Uy FAA, Tan FJ, Carpio RC, Javate KCP, Laquindanum JP. Application of artificial neuro-fuzzy interference system in rainfall-runoff modelling at Imus River, Cavite. In: 2020 IEEE Conference on Technology for Sustainability (SusTech); 2020. doi:10.1109/SusTech47890.2020.9150494. [Google Scholar] [CrossRef]
60. Heidari A. Structural master plan of flood mitigation measures. Nat Hazards Earth Syst Sci. 2009;9:61–75. doi:10.5194/nhess-9-61-2009. [Google Scholar] [CrossRef]
61. Kim K, Han D, Kim D, Wang W, Jung J, Kim J, et al. Combination of structural measures for flood prevention in Anyangcheon river basin, South Korea. Water. 2019;11:2268. doi:10.3390/w11112268. [Google Scholar] [CrossRef]
62. Li J, Zhao Y, Bates P, Neal J, Tooth S, Hawker L, et al. Digital elevation models for topographic characterisation and flood flow modelling along low-gradient, terminal dryland rivers: a comparison of spaceborne datasets for the Río Colorado, Bolivia. J Hydrol. 2020;591:125617. doi:10.1016/j.jhydrol.2020.125617. [Google Scholar] [CrossRef]
Cite This Article
 Copyright © 2024 The Author(s). Published by Tech Science Press.
This work is licensed under a Creative Commons Attribution 4.0 International License , which permits unrestricted use, distribution, and reproduction in any medium, provided the original work is properly cited.


 Submit a Paper
 Propose a Special lssue
 View Full Text
 Download PDF
 Downloads
 Citation Tools