 Open Access
ARTICLE
Pioneering Micro-Scale Mapping of Urban CO Emissions from Fossil Fuels with GIS
Department of Petroleum Engineering, Faculty of Engineering, Koya University, Koya, Kurdistan Region, KOY45, Iraq
* Corresponding Author: Loghman Khodakarami. Email:
Revue Internationale de Géomatique 2024, 33, 221-246. https://doi.org/10.32604/rig.2024.050908
Received 22 February 2024; Accepted 07 April 2024; Issue published 15 July 2024
Abstract
Urban areas globally are escalating contributors to carbon dioxide (CO) emissions, challenging sustainable development. This study proposes a novel micro-scale approach utilizing GIS to quantify CO emission spatial distribution, enhancing urban sustainability assessment. Employing a “bottom-up” methodology, emissions were calculated for various sources, revealing Isfahan’s urban area emits 13,855,525 tons of CO annually. Major contributors include stationary and mobile sources such as power plants (50.61%), road and rail transport (17.18%), and residential sectors (21.78%). Spatial distribution mapping showed that 81.68% of CO emissions originate from stationary sources, notably power plants. Furthermore, mobile sources, including road transport, contribute 17.16%, with emissions concentrated in main urban arteries. Agricultural machinery adds 1.14% of emissions, spatially distributed across Isfahan’s agricultural lands. Integration of emissions maps depicts the city’s total CO emissions, highlighting sectoral contributions. Despite limitations in data granularity, this study provides valuable insights into urban CO emissions dynamics, facilitating targeted mitigation strategies. Quantitative achievements include precise CO emission quantification and spatial distribution mapping, crucial for formulating effective urban sustainability policies.Keywords
Although cities cover only 2% of Earth’s surface, more than 55% of the world’s population currently lives in urban regions. This figure is projected to increase to 70% by 2050 [1,2]. Cities consume 75% of natural resources, accounting for over 70% of greenhouse gas emissions [3,4]. Excessive energy consumption in cities contributes to air, water, soil, and noise pollution [5,6]. This issue is particularly exacerbated in developing countries due to the accelerated demand caused by the growing urban population [2,7].
The increase in the use of fossil fuels in industrial, transportation, and other urban applications, due to the increase in population and the expansion of cities and industrial areas, leads to the emission of a huge amount of greenhouse gases into the atmosphere [8]. Among these gases, carbon dioxide has a significant share in global warming and is considered the most important greenhouse gas, as its increasing concentration in the Earth’s atmosphere causes an increase in global warming and consequently leads to climate change through the absorption of reflected wavelengths [9].
Carbon dioxide (CO2) emissions in urban areas have become a significant topic of scientific inquiry due to their implications for sustainability. because urban areas are hotspots of CO2 emissions, resulting from various human activities such as energy consumption, transportation, and industrial processes. Understanding the relationship between carbon dioxide emissions and sustainability in urban settings is essential for designing effective mitigation strategies and fostering environmentally and socially responsible urban development [10–12]. In the following, the relationship between carbon dioxide emissions in urban areas and urban sustainability is examined from three dimensions of environmental, social and economic.
Environmental Sustainability: Carbon dioxide emissions in urban areas play a critical role in environmental sustainability. The excessive release of CO2 contributes to climate change, leading to a range of environmental impacts such as rising temperatures, altered precipitation patterns, and sea-level rise. These changes pose risks to urban infrastructure, ecosystems, biodiversity, water resources, and natural habitats. To achieve environmental sustainability, urban areas need to reduce carbon dioxide emissions and transition to low-carbon energy sources, sustainable transportation systems, and energy-efficient buildings. This requires integrating renewable energy, promoting green infrastructure, and adopting circular economy principles to minimize resource consumption and waste generation [10–13].
Social Sustainability: The social dimension of sustainability in urban areas is closely linked to carbon dioxide emissions. High levels of CO2 emissions contribute to air pollution, negatively impacting public health and well-being. Exposure to air pollutants can lead to respiratory and cardiovascular diseases, particularly affecting vulnerable populations. Addressing carbon dioxide emissions in urban areas is crucial for ensuring social sustainability, including equitable access to clean air, health services, and environmental justice. Sustainable urban development involves promoting active and public transportation, enhancing green spaces, and fostering inclusive communities that prioritize the health and well-being of residents [14,15].
Economic Sustainability: The economic implications of carbon dioxide emissions in urban areas are twofold. Firstly, the consequences of climate change resulting from CO2 emissions pose significant economic risks. Urban areas, being centers of economic activity, face increased costs associated with climate adaptation and resilience measures, such as infrastructure upgrades, disaster management, and insurance expenses. Moreover, climate change impacts can disrupt supply chains, affect productivity, and impact economic growth. On the other hand, transitioning towards low-carbon and sustainable practices can create economic opportunities. Investments in renewable energy, energy efficiency, green technologies, and sustainable urban infrastructure can spur innovation, create jobs, enhance competitiveness, and lead to long-term economic benefits. By reducing carbon dioxide emissions and pursuing sustainable economic development, urban areas can foster a more resilient and prosperous future [10–13].
The dangers and consequences of increasing greenhouse gas concentrations, especially carbon dioxide, are emphasized and addressed by international organizations. Therefore, various countries around the world are seeking solutions to climate change and environmental problems in different environmental agreements and protocols, and most countries have agreed to reduce greenhouse gas emissions. In 1992, almost all countries in the world signed the Climate Change Convention with the aim of reducing and balancing greenhouse gas concentrations. As a result of this convention, the Kyoto Protocol was officially agreed upon by 55 countries in 1997 with the aim of long-term and limited emission reduction of these gases. Additionally, the Paris Climate Agreement, which aims to reduce greenhouse gas emissions, was adopted by representatives of 195 countries at the United Nations Climate Conference in Paris in 2015 [3,16].
As carbon dioxide gas has the highest impact on the phenomenon of global warming among greenhouse gases present in the atmosphere, monitoring the amount of carbon emitted from terrestrial ecosystems on a global, national, regional, and urban scale has become an important research topic. Therefore, in this study, estimating the spatial emission of carbon dioxide resulting from the combustion of fossil fuels on an urban scale has been considered as the main research objective. This is because it is necessary and essential to identify and quantify the emission of this gas from various sources in urban areas in order to reduce its emissions [17,18].
The micro-scale spatial distribution of CO2 emissions in urban areas is important to understand because it can help to identify the sources of emissions and to target mitigation strategies. For example, if CO2 emissions are found to be concentrated in certain areas, such as industrial zones or areas with a lot of traffic, then policies can be targeted to reduce emissions in those areas [17].
Geographic information systems (GIS) is a powerful tool that can be used to study the micro-scale spatial distribution of CO2 emissions in urban areas. GIS allows for the integration of different types of data, such as land use data, traffic data, and emissions data. This allows for a more comprehensive understanding of the factors that contribute to CO2 emissions in urban areas. A number of studies have used GIS to study the micro-scale spatial distribution of CO2 emissions in urban areas. For example, a study by Zhang et al. [19] used GIS to study the spatial distribution of CO2 emissions in Beijing, China. The study found that CO2 emissions were highest in the city center and in areas with high population densities. The study also found that CO2 emissions were higher in areas with a high concentration of industrial activity [19]. Another study, by Li et al. [20], used GIS to study the spatial distribution of CO2 emissions in Shanghai, China. The study found that CO2 emissions were highest in the city center and in areas with high population densities. The study also found that CO2 emissions were higher in areas with a high concentration of transportation activity. These studies have shown that GIS can be a valuable tool for studying the micro-scale spatial distribution of CO2 emissions in urban areas. By using GIS, it is possible to identify the sources of CO2 emissions in urban areas and to understand how they vary across the city. This information can be used to inform decision-making about how to reduce CO2 emissions and improve the sustainability of urban areas.
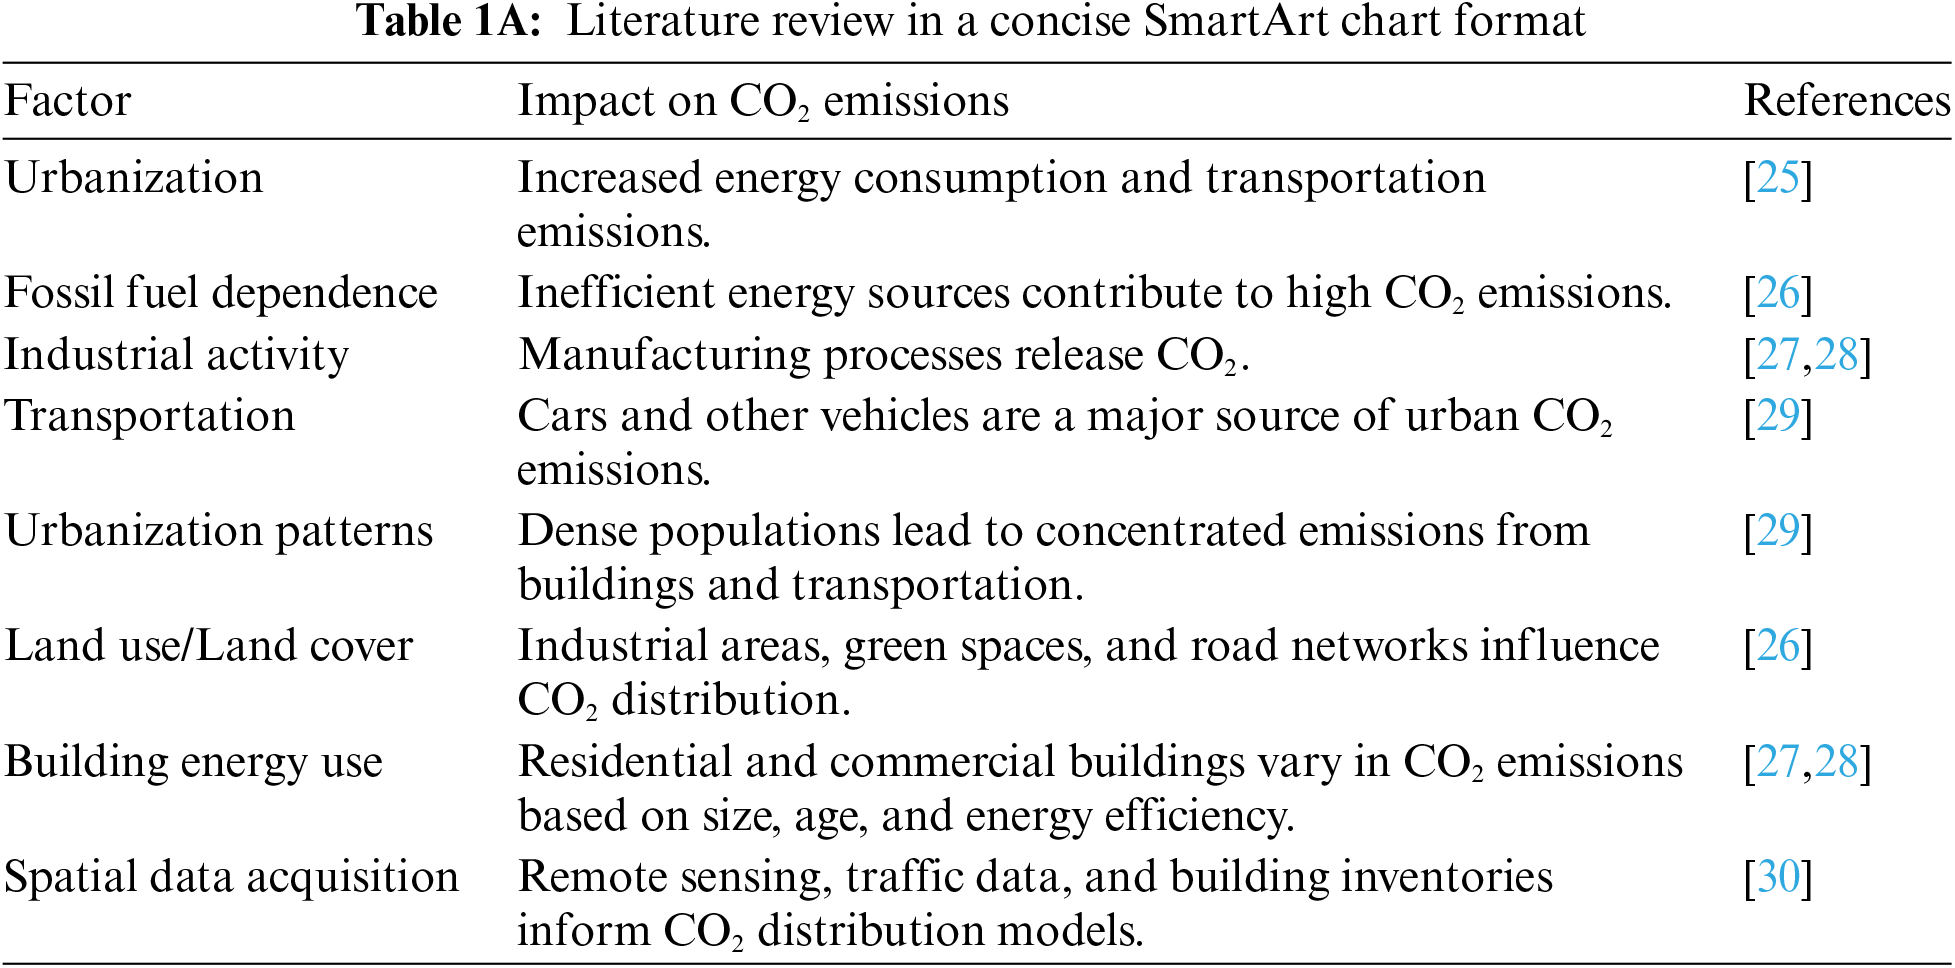
Based on previous studies, there are several methods for measuring carbon dioxide. Common measurement methods for greenhouse gases include ground stations, airplanes, ships, tall towers, balloons, and satellites [21,22]. Among these methods, the use of satellite imagery has been introduced as one of the most important methods of measuring greenhouse gases due to its continuous monitoring and global coverage [23,24]. Regarding satellite-based measurement of greenhouse gases, Golomolzin et al. referred to instruments such as OCO-2 (Orbiting Carbon Observatory), AIRS (Atmospheric Infrared Sounder), SCIAMACHY (Scanning Absorption Spectrometer for Atmospheric Cartography), and GOSAT (Greenhouse Gas Observatory Satellite) which measure carbon dioxide levels on a regional and global scale [24]. However, currently, none of the satellite sensors are able to measure carbon dioxide gas at an urban scale (i.e., a scale of 1/2000 to 1/5000). Apart from assessing the aforementioned references, a segment of the prior literature review is outlined here in the format of a concise SmartArt diagram in Table 1A.
Therefore, in recent years, the “bottom-up” method has been used to quantify the amount of this gas at the urban scale. In the “bottom-up” approach, which has become more common in the United States in recent decades, the amount of fossil fuel emissions from each industrial, residential, commercial, agricultural, transportation, and power generation equipment is collected at the city level. The bottom-up method is inventory-based and can estimate greenhouse gas emissions at the city scale based on their production sources. Based on previous studies, many researchers believe that the best way to estimate and understand the differences in carbon dioxide emissions at the city scale is to use the bottom-up approach, as it quantifies emissions by different source sectors [31,32].
Due to the lack of carbon dioxide gas measurement stations and large-scale satellite images suitable for city magnification, we utilized a bottom-up approach in this study to quantify CO2 emissions. For the first time in this research, we calculated annual carbon dioxide emissions from fossil fuels in various sectors, including power plants, residential, commercial, industrial, road and rail transportation, and non-road transportation (agricultural machinery) in the fifteen districts of Isfahan, which is the third most populous city in Iran. We then prepared a spatial distribution map for each sector and the entire area of Isfahan.
Given the importance of monitoring carbon dioxide gas emissions from urban areas, The purpose of this research is to quantify the spatial distribution of carbon dioxide emissions in urban areas at a micro-scale. The specific objectives of the research are to: (1) This scientific research aims to explore the relationship between carbon dioxide emissions in urban areas and unsustainability from a multidimensional perspective, highlighting the environmental, social, and economic implications of these emissions. (2) Identify the sources of CO2 emissions in the urban area. (3) Understand how CO2 emissions vary across the city. (4) Use the findings of the research to inform decision-making about how to reduce CO2 emissions in the urban area. According to the reasons mentioned above, the problem, purpose, objective, and novelty of the research are as follows:
The prevailing dearth of micro-scale CO2 measurement methodologies in urban areas underscores the novelty and significance of our research. By quantifying CO2 emissions across various sectors within Isfahan, we aim to address several key objectives. Firstly, we seek to elucidate the multifaceted relationship between urban CO2 emissions and unsustainability, emphasizing environmental, social, and economic dimensions. Secondly, we endeavor to pinpoint the primary sources of CO2 emissions within the urban fabric, facilitating targeted mitigation interventions. Thirdly, we aspire to delineate the spatial distribution of CO2 emissions across Isfahan, unraveling intra-city disparities and hotspots. Finally, we aim to harness our findings to inform evidence-based decision-making, guiding efforts to curb CO2 emissions and enhance urban sustainability. In summary, our study represents a pioneering endeavor to unravel the intricate dynamics of urban CO2 emissions at a micro-scale, shedding light on crucial pathways towards sustainable urban futures.
The research location is Isfahan Metropolitan, a city rich in history situated in the central region of Iran. It encompasses an area of 551 square kilometers and is located between 31° 29′ to 33° 1′ North latitude and 51° 31′ to 53° 12′ East longitude (as shown in Fig. 1). Isfahan is made up of 15 municipal districts and 220 neighborhoods, and it is the third most populous city in Iran, with a population of over 1,961,000 people. The area has an arid climate, as per De Martonne’s classification, and receives an average annual precipitation of less than 150 mm. In recent years, the area has faced severe water shortages. Due to the heavy traffic on its roads (with more than a million vehicles running on diesel, gasoline, and compressed natural gas) and the presence of large-scale industrial units such as refineries, petrochemicals, power plants, and steel industries near the city, coupled with its proximity to desert regions, Isfahan has become one of the most polluted regions in Iran [33].
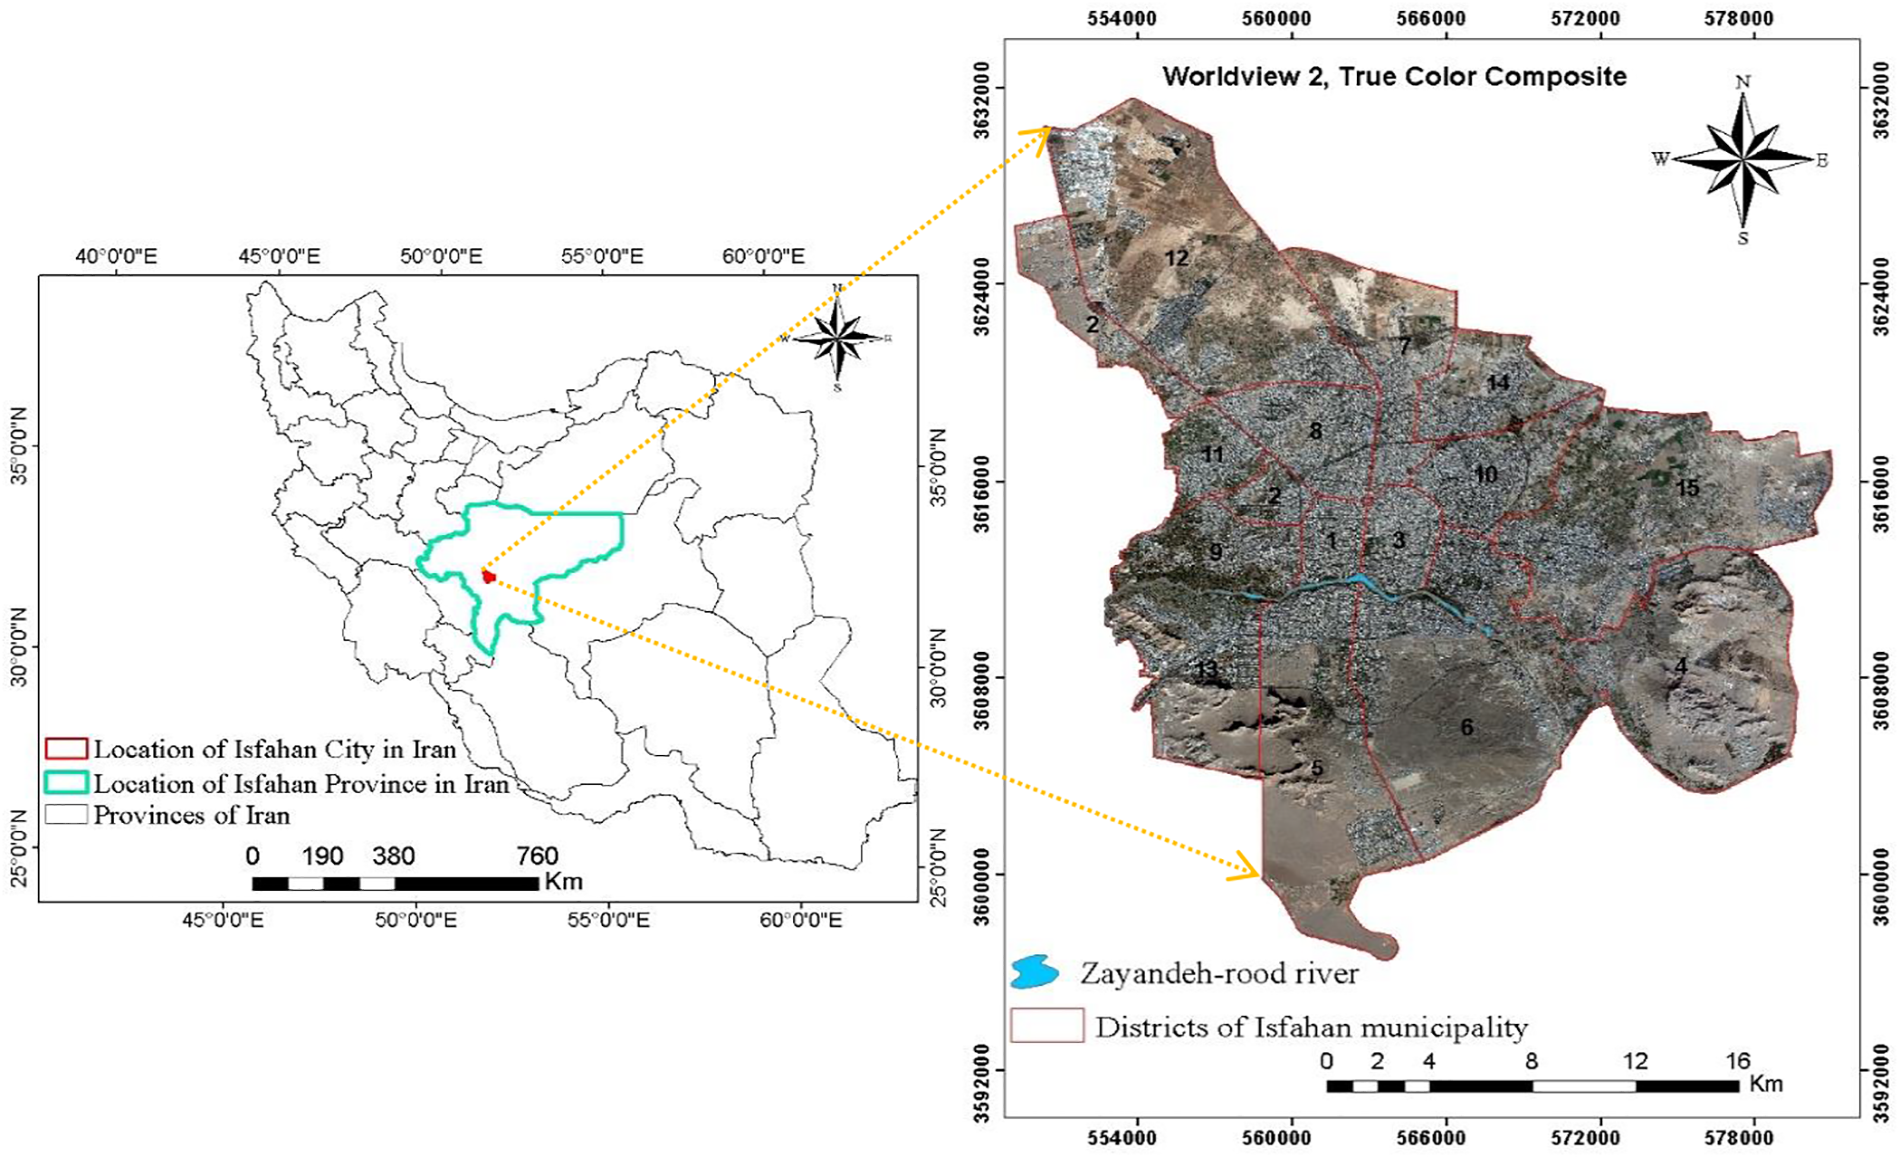
Figure 1: Location of study area, Isfahan city in Iran
The study utilized a variety of sources to gather information, including satellite images from Landsat 8 and WorldView-2, statistical reports from Isfahan province, and a 1:2000 land use map. In addition to the satellite images, various types of data, both spatial and non-spatial, were used and are listed in Table 1B, along with their sources.

In this study, the “bottom-up” approach was used to quantify the spatial variability of CO2 gas on an urban scale and to understand the difference in carbon dioxide emissions at the city level. As shown in Diagram 1, the general steps of the bottom-up approach are presented.
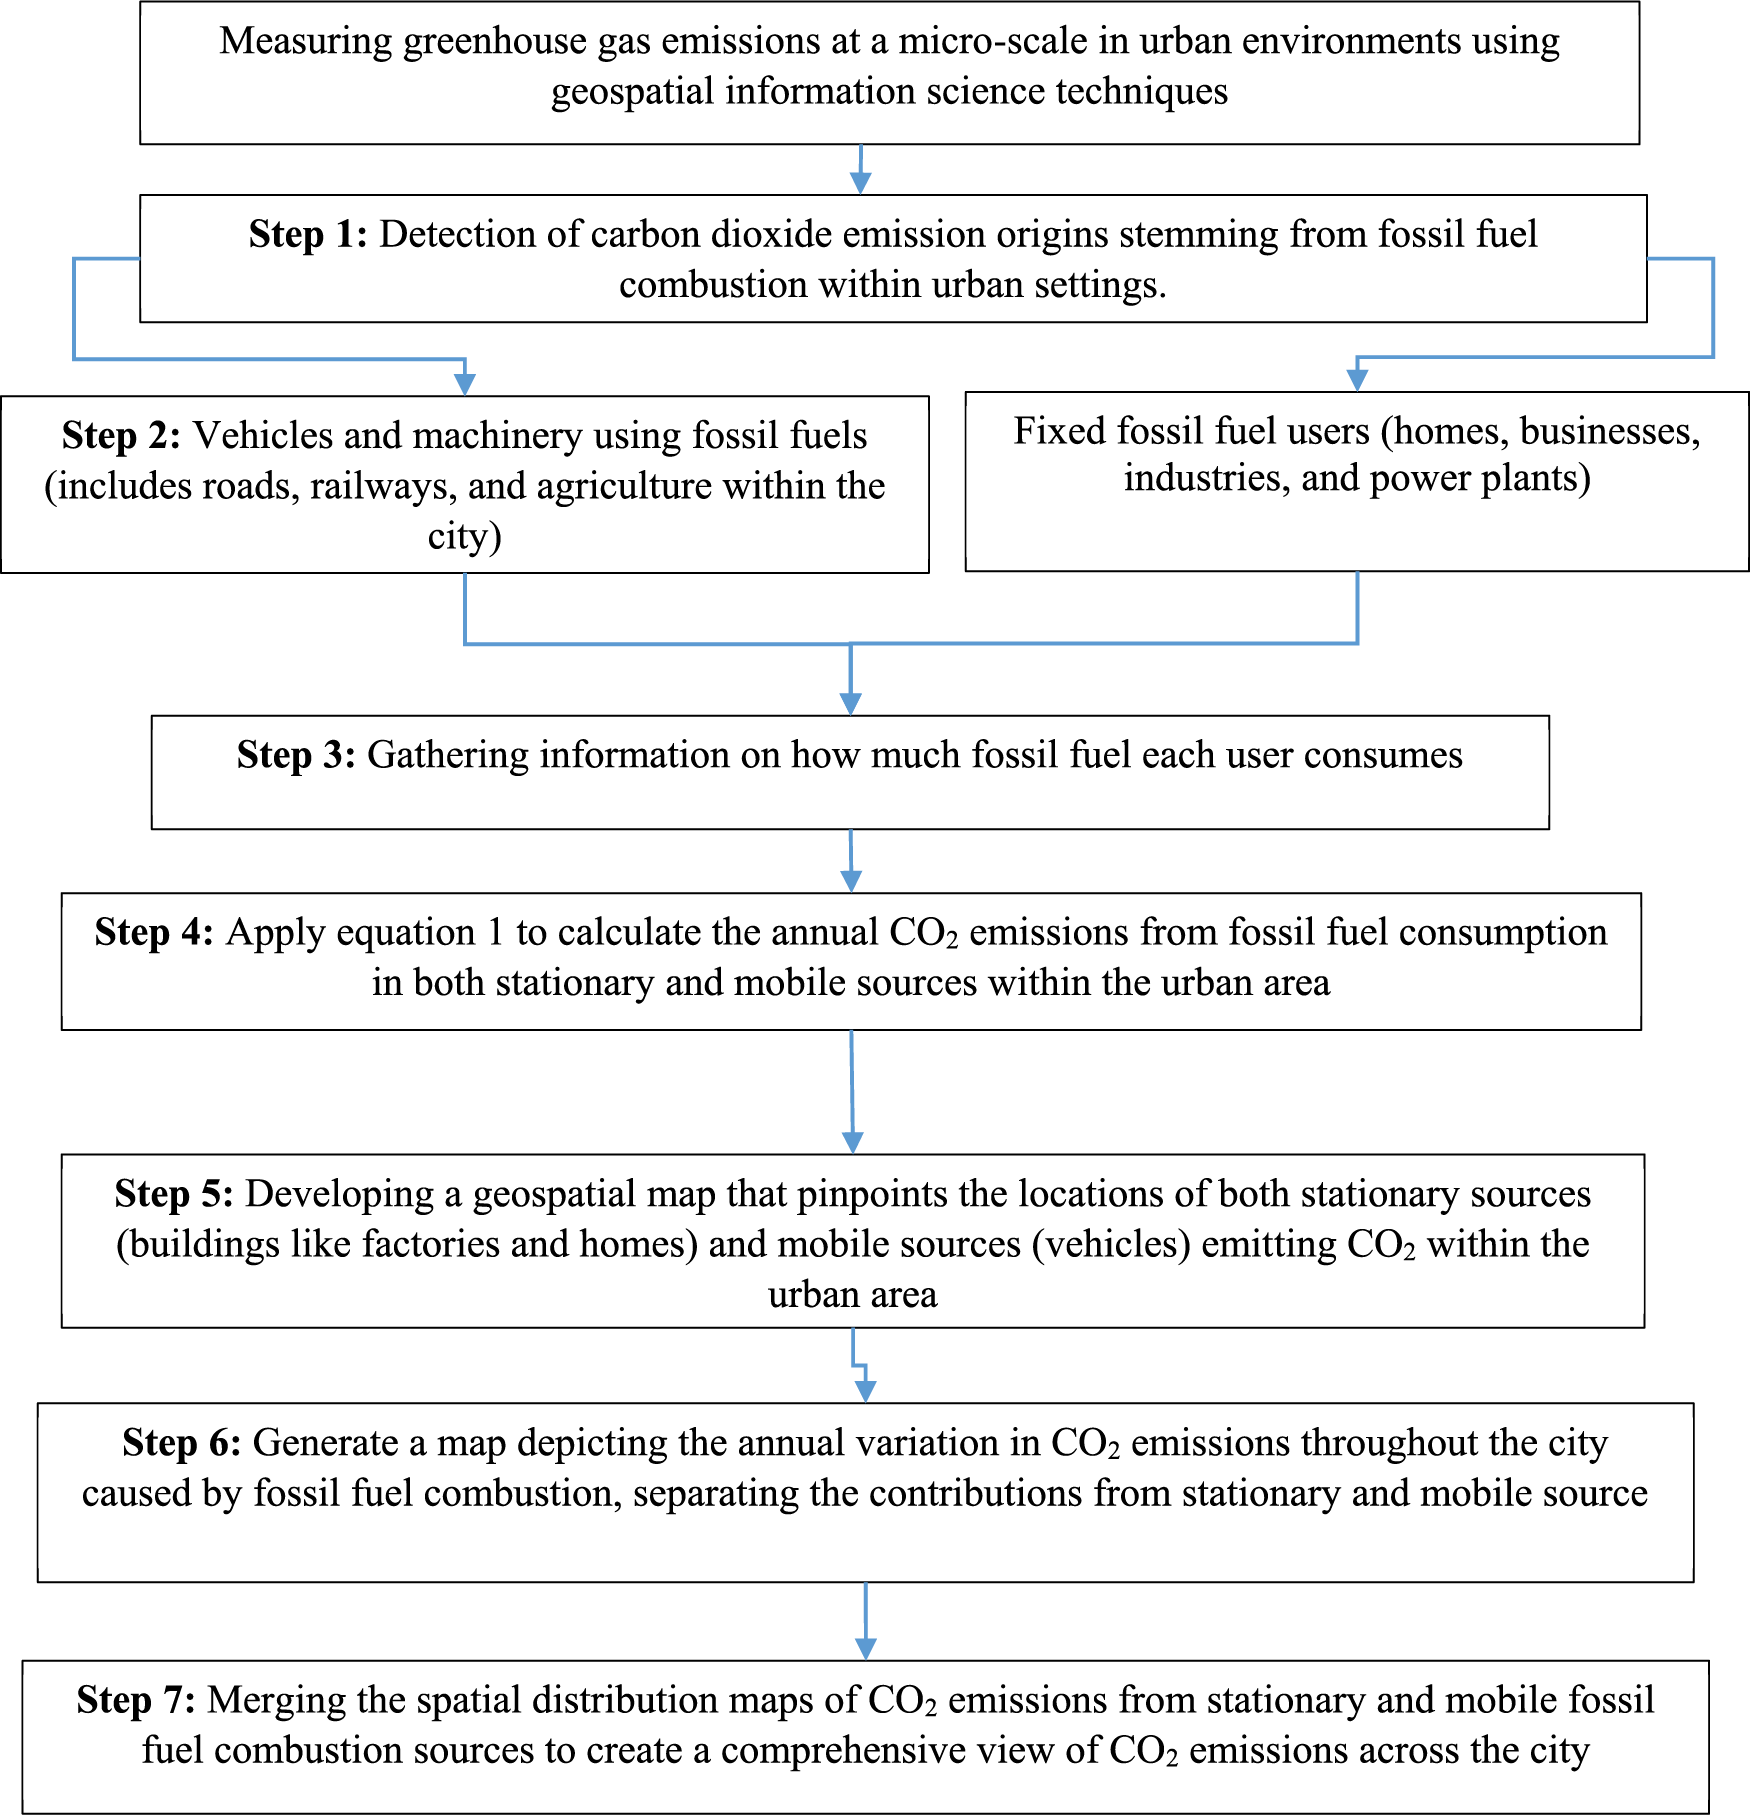
Diagram 1: Flowchart of research methodology
As Diagram 1 shows, the modeling steps of carbon dioxide greenhouse gas emissions in the city include seven stages. In the first stage, the sources of carbon dioxide emissions resulting from the combustion of fossil fuels in the city were identified. To identify these sources, the results of studies conducted by the World Resources Institute and the Intergovernmental Panel on Climate Change were used. Based on the statistics provided by these two organizations, greenhouse gas emissions from the combustion of fossil fuels in the city were classified into two categories of stationary and mobile sources. Stationary sources include residential, commercial, industrial, and power plant areas, while mobile sources include road and non-road transportation (rail, air, and mobile agricultural machinery operating in agricultural lands within the city boundaries) [34].
In the second stage, the map of the spatial location of carbon dioxide gas production resources in both stationary and mobile sources was extracted from WorldView-2 satellite images and a city map with a scale of 1:2000. Additionally, data related to the consumption of fossil fuels, broken down by each stationary and mobile source, was collected from the 2021 Statistical Yearbook of Isfahan city. In the third stage, the annual amount of carbon dioxide emissions resulting from the consumption of fossil fuels in 2021 was calculated within the city area. In this stage, the amount of CO2 greenhouse gas emissions caused by stationary and mobile combustion sources was calculated by multiplying the consumption of each fuel by its heat value and emission coefficient, according to Eq. (1) [35,36]. Eq. (1) calculates the carbon dioxide emissions from stationary and mobile combustion sources under the assumption of complete combustion. Here, Qi: represents the total annual consumption of each fossil fuel, LHVi: represents the Lower Heating Value of each fossil fuel, and EFij: represents the CO2 greenhouse gas emission coefficient.
In a fourth step, the map of the annual distribution of carbon dioxide greenhouse gas emissions resulting from the combustion of fossil fuels was prepared based on stationary sources. In this phase, using spatial information science, the area and location of each stationary source (residential, commercial-public, industrial and power plants) were prepared using the city map at a scale of 1:2000. Then, the map of the annual distribution of carbon dioxide greenhouse gas emissions resulting from the combustion of fossil fuels in each of the stationary source sections was created based on their area and location within the city. The phases of this stage are as follows (note that all the equations used in this section are presented in Table 2).

2.3.1 Calculating Carbon Dioxide Emissions from the Annual Use of Fossil Fuels in the Stationary Source Sector
Mapping the Distribution of Household CO2 Greenhouse Gas Emissions (Residential Source)
In order to map the distribution of CO2 greenhouse gas emissions in the household sector, the annual amount of carbon dioxide emissions was calculated based on the type of fuel consumed in the entire city’s household sector using statistical data for Isfahan city in 2020 and the CO2 emission calculation method Eq. (1). Then, the results of the annual emission rate of this gas were divided by the total area of all buildings in the city (note that in calculating the area of buildings in the domestic sector, the total area of floors was taken into account). The obtained value represents the amount of carbon dioxide emissions per square meter of fixed sources in the household sector. Finally, to calculate the amount of emissions for each of the buildings in the city, the obtained number (the amount of CO2 released per square meter) was multiplied by the total area of each building. In this way, the distribution map of carbon dioxide greenhouse gas emissions based on the household sector in the city was calculated (Eq. (2), Table 3).

Calculation of Distribution Map of Carbon Dioxide Greenhouse Gas Emissions in the Commercial and Public Sectors
At this stage, data on the amount of fossil fuel consumption in the commercial-public sector was collected for mapping the distribution of emissions in this sector. Then, based on Eq. (1), the annual amount of CO2 emissions were calculated. In the next step, the total annual emissions of this gas were divided by the total area of commercial-public areas. The resulting value indicates the amount of CO2 emissions per square meter in commercial-public areas. This value was multiplied by the area of each building in this sector, and the product shows the distribution map of this gas emission in the commercial-public sector (Eq. (3), Table 3).
Calculate the Map of Greenhouse Gas CO2 Distribution in the Industrial Sector
Due to the lack of statistical data on the amount of energy consumed by each industry, the mapping stages of CO2 gas distribution in the industrial sector were calculated similarly to the residential and commercial-public sectors (Eq. (4), Table 3).
Calculate the Map of Greenhouse Gas CO2 Emissions in Power Plants
Based on the annual consumption of fossil fuels, the amount of CO2 emissions were calculated for the two power plants located in the study area, and this value was considered for the spatial range of the power plants.
2.3.2 Calculating the Annual Carbon Dioxide Emissions from the Annual Consumption of Fossil Fuels in the Mobile Sources Sector
Then, in the fifth stage, the map of the annual distribution of CO2 greenhouse gas emissions from fossil fuel combustion was created based on mobile sources. In this step, using the spatial information system, the map of mobile sources such as road and non-road transportation (rail and agricultural machinery) was prepared using a city map at a scale of 1:2000. In addition at this stage, the amount of carbon dioxide emissions resulting from the annual consumption of each fossil fuel, gasoline, gas, and diesel, in the road and non-road transport sector (rail transportation and agricultural machinery) in the study city, using It has been calculated from the consumption data of this type of fossil fuels in 2021 using Eq. (1). Then, the map of the annual distribution of CO2 greenhouse gas emissions resulting from fossil fuel combustion in mobile sources was created based on their map and location at the city level. The steps of this stage are described below.
Computation of the Road Transport System’s CO2 Emissions Distribution Map
In this step, urban streets were classified into two tiers of main streets (level 1 and level 2 arteries, ramps, collectors, urban expressways, city freeways, suburban expressways, and suburban freeways) and sub-streets. Then, using high-resolution satellite images, the number of vehicles on each of the two tiers of roads (main and sub-streets) was calculated [37]. For this purpose, the time series of Google Earth images were used. Then, the number of vehicles on each class of the road per kilometre was calculated using Eq. (5) (Table 2) [38]. The calculated number of vehicles for each of the two road classes was taken as the weight of that tier of roads in carbon dioxide emissions. Next, to prepare a map of the spatial distribution of CO2 emissions in each of the two tiers of roads (i.e., main and sub-streets), the weight calculated was multiplied by the total amount of annual CO2 emissions from the use of fossil fuels in the road transport sector (excluding fuel consumption in the bus transport network). As a result of these steps, the amount of CO2 resulting from the use of fossil fuels in the road transport system was separated and calculated into two parts: the amount of CO2 emitted from main streets and sub-streets (the results of this step have been converted into mathematical Eqs. (6) and (7) and are presented in Table 2).
Then, considering that each of the first floor streets (i.e., main streets) differs in terms of transportation traffic, the amount of CO2 emitted on each of them is also different. Therefore, to calculate the amount of CO2 emissions per kilometer on each of the main streets (level 1 arterial roads, level 2 arterial roads, ramps, collectors, urban expressways, urban highways, suburban expressways, and suburban highways), the hourly traffic volume must be calculated. To this end, in this study, the results of comprehensive transportation studies in Isfahan in 2019, which had calculated the traffic volume on each of the roads, were used. Finally, the amount of emitted carbon dioxide in each section of the main road types was obtained using Eq. (8) (Table 2). On the other hand, since the amount of transportation traffic in secondary streets depends on the population density in the neighborhoods, the population ratio in the neighborhoods was used as a weight variable to calculate the distribution map of carbon dioxide emissions in the secondary streets in each of the neighborhoods. In this way, the map of CO2 distribution emitted in secondary streets in neighborhoods was calculated using Eq. (10) (Table 2). Also, in order to calculate the annual CO2 emissions resulting from the consumption of fossil fuels in Bus Routes, in the first stage, the bus routes map of Isfahan city was prepared. Then, the amount of annual carbon dioxide emissions from fossil fuels in this sector was calculated using Eq. (1). In the final stage, the spatial distribution map of CO2 emissions in bus lines was prepared using Eq. (12) (Table 2).
Calculation of Annual Carbon Dioxide Emissions from Fossil Fuel Consumption on Railway Lines
In this step, a map of the railway transport lines within the city of Isfahan was prepared. Then, the average fuel consumption per kilometer of the railway transport lines was collected using available data and using Eq. (1), the amount of annual CO2 emissions resulting from the consumption of fossil fuels in the railway transport lines of the study area was calculated. Finally, to prepare a map of the annual distribution of carbon dioxide emissions resulting from this section, the total annual CO2 emissions from the railway lines within Isfahan city were divided by the length of the railway lines in this area (Eq. (13), Table 2).
Calculation of Annual Carbon Dioxide Emissions from Fossil Fuel Consumption in the Non-Road Transport Sector (Agricultural Machinery)
In order to prepare a spatial distribution map of carbon dioxide emissions in the agricultural sector, agricultural lands within the city of Isfahan were extracted from a city map at a scale of 1:2000, and the number of agricultural machinery and annual consumption of fossil fuels within the city area were collected. Then, the annual CO2 emissions in this sector were calculated using Eq. (14) (Table 2). Finally, the total amount of CO2 emissions annually was divided by the area of cultivated agricultural lands within the city of Isfahan. Finally, in the sixth stage, after calculating the spatial distribution map of carbon dioxide emissions resulting from the consumption of fossil fuels for each stationary and mobile source, all the spatial distribution maps of CO2 emissions were overlaid on each other. The result of this integration shows the spatial distribution map of annual CO2 emissions at the city level.
The data related to the consumption of fossil fuels, categorized by each stationary and mobile combustion source, is presented in Tables 3 to 6. Table 3 indicates the consumption of regular gasoline, CNG, and premium gasoline by light-duty vehicles in the urban area of Isfahan in 2020, which were 83%, 3.14%, and 5.2%, respectively. In this table, the consumption of natural gas is normalized to gasoline (i.e., every cubic meter of natural gas is considered equivalent to 0. 91 liters of regular gasoline).


Table 4 presents the annual consumption of diesel fuel in public transportation, agricultural machinery, and freight and passenger trains. About 3450 agricultural machines operate in the urban area of Isfahan. Since each machine operates for an average of 1200 h per year and consumes 14 liters of fuel per hour, it can be estimated that each agricultural machine consumes around 16,800 liters of fuel per year on average. The total diesel fuel consumption in the agricultural sector is approximately 57.96 million liters per year.
On the other hand, the average fuel consumption for freight and passenger trains is 7.97 liters per kilometer (Forouzandeh, 2009). The number of daily inbound and outbound services at the Isfahan railway terminal was five in 2020. Therefore, considering that the length of the railway in the urban area of Isfahan is about 71.9 kilometers, the annual fuel consumption of these trains is approximately 1.046 million liters.
Also, Table 5 shows that the share of gas consumption in 2020 was 51% in the residential sector, 37% in the industrial sector, and 12% in the commercial-public sector. Table 6 presents the natural gas consumption in the power generation sector in two power plants in Isfahan. Due to the high pollution of furnace oil and diesel, its consumption was stopped in the power plants of the city in 2020. Therefore, in this study, only the consumption of natural gas in power plants has been investigated. According to the 2019 and 2020 statistical yearbooks of Isfahan, the natural gas consumption for generating one kilowatt-hour of electricity is 0.27 and 0.28 cubic meters, respectively. In general, the consumption of fossil fuels in the Isfahan urban area, divided by each stationary and mobile combustion source, is 22.12% for residential, 4.99% for commercial-public, 4.44% for industrial, 51.41% for power generation, 16.14% for road and rail transport, and 0.9% for non-road transport (agricultural machinery), respectively.
3.2 Analysis of Annual Carbon Dioxide Emissions from Fossil Fuel Consumption
Carbon dioxide emissions from stationary and mobile combustion sources for 2020 are shown in Tables 7–10. In general, 13,855,525.84 tonnes of carbon dioxide is emitted annually from the oxidation of hydrocarbons during the combustion process of fossil fuels. where each fixed and mobile combustion source contributes to air emissions as follows: Residential (21.78%), commercial (4.92%), industrial (4.37%), power plants (50.61%), road and rail transport (17.18%), non-road transport (agricultural machinery) (1.14%).


3.3 Mapping the Spatial Distribution of Carbon Dioxide Emissions
3.3.1 Mapping the Spatial Distribution of CO2 gas Emissions Resulting from the Consumption of Fossil Fuels in Stationary Sources
Figs. 2 and 3 illustrate the results of mapping the spatial distribution of CO2 emissions from stationary sources in the city of Isfahan, with a scale of 1:2000. The results of this section of the study indicate that the amount of carbon dioxide emissions resulting from hydrocarbon oxidation during the combustion process of fossil fuels in stationary sources is 11,317,193. 51 million tons per year, accounting for 81.68% of the total carbon dioxide emissions from fossil fuel combustion in the city of Isfahan. Each of the residential, commercial-public, industrial, and power plant sectors emit 26.67%, 6.01%, 5.35%, and 61.97%, respectively, of the carbon dioxide emissions resulting from fossil fuel combustion in stationary sources into the atmosphere.
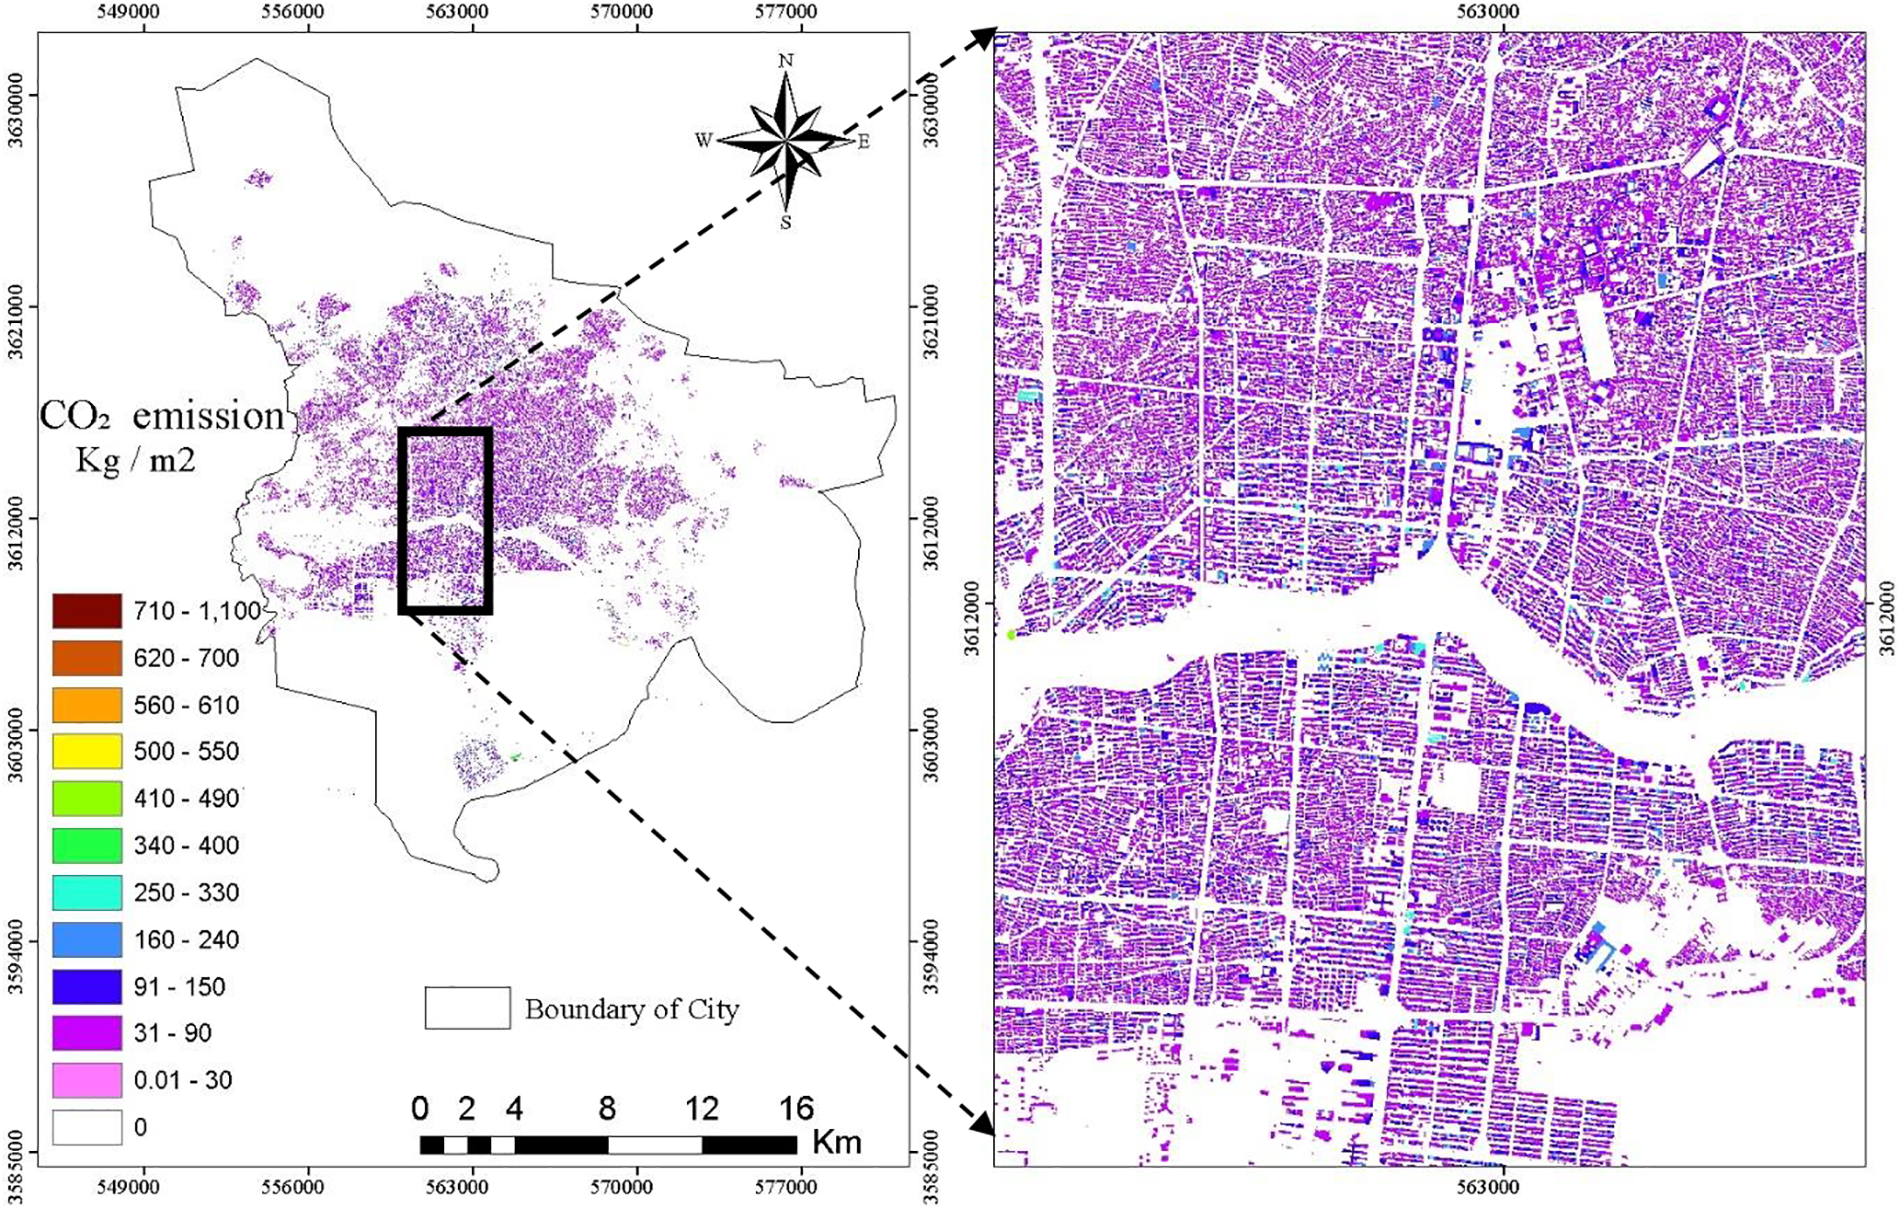
Figure 2: Spatial distribution map of annual CO2 emissions resulting from the combustion of fossil fuels in residential and commercial sectors
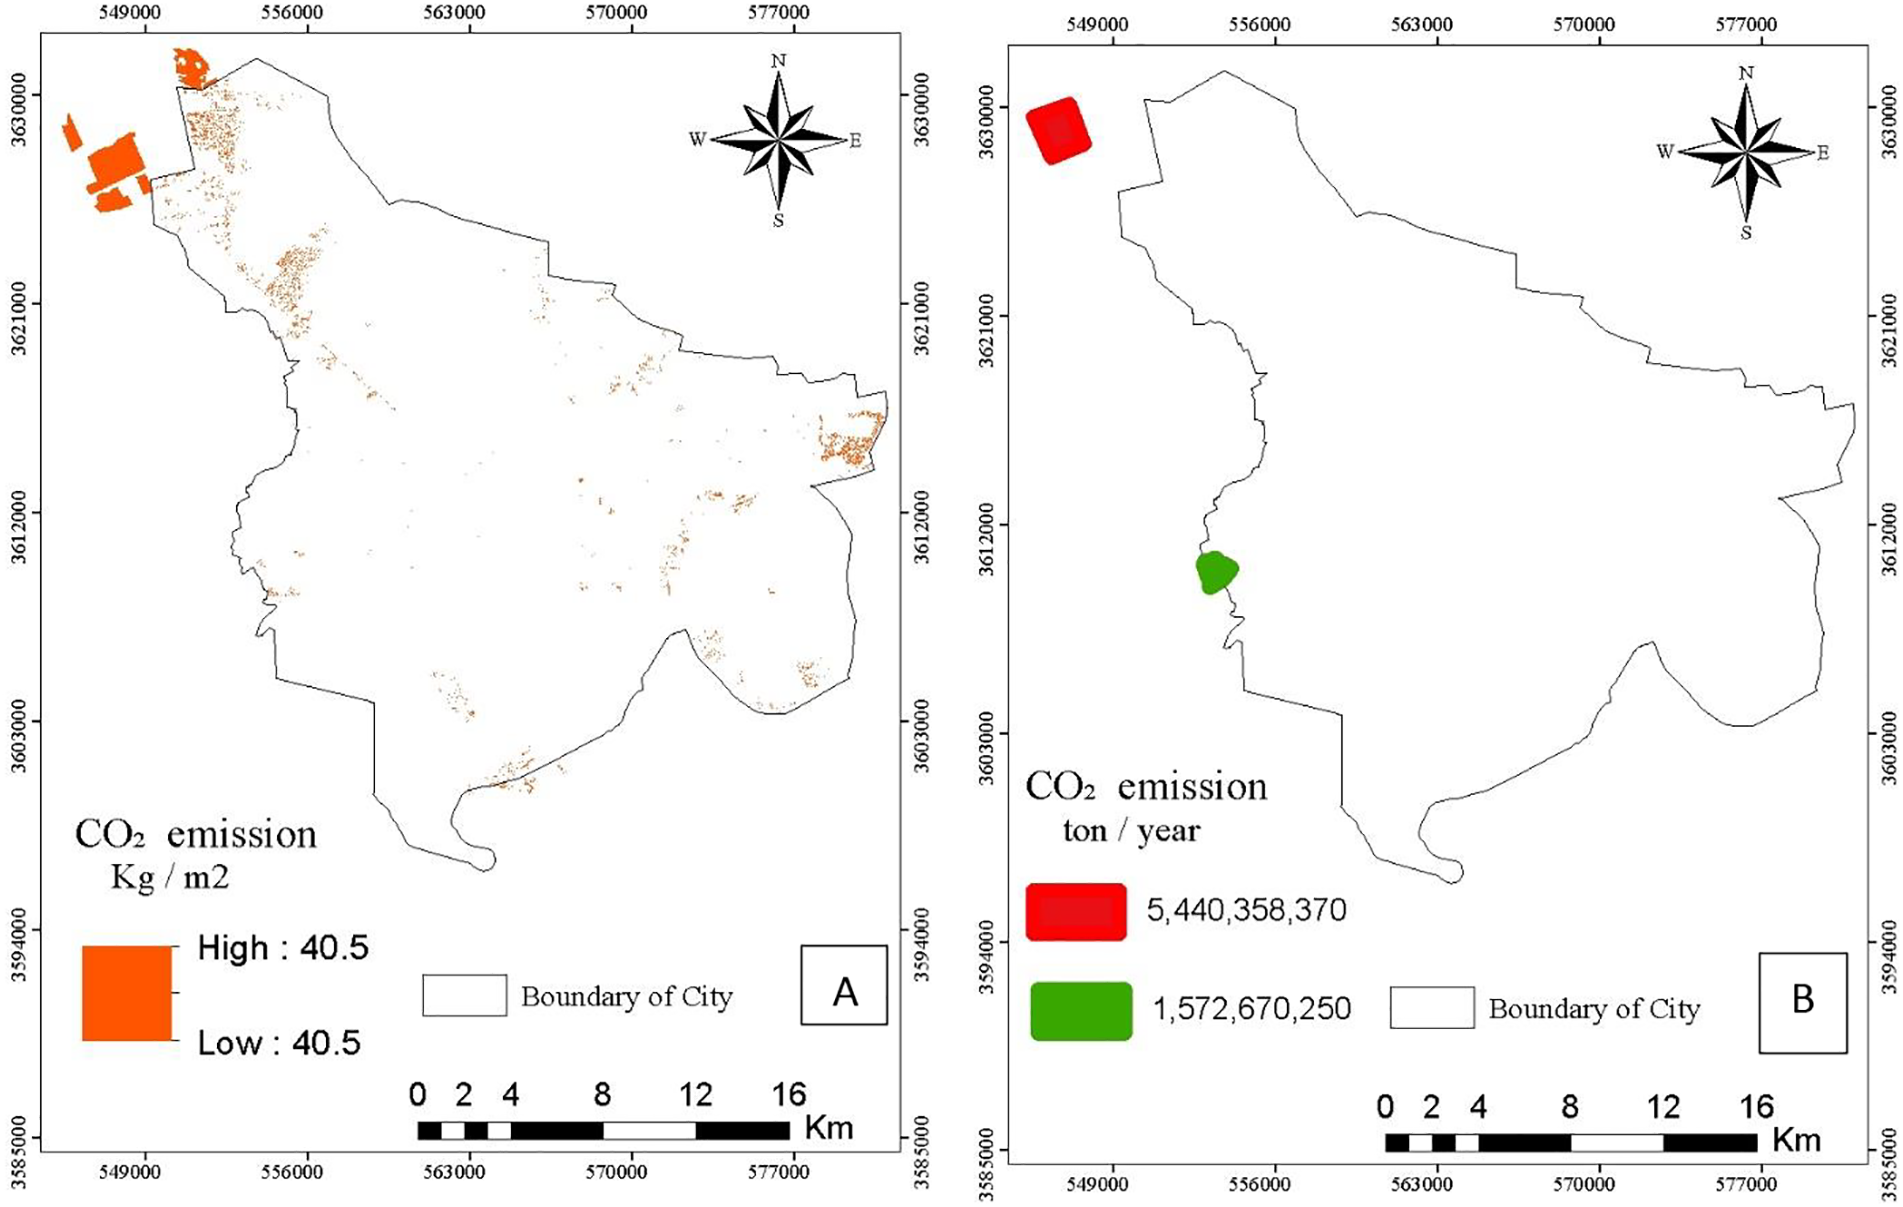
Figure 3: Spatial distribution map of annual CO2 emissions resulting from the combustion of fossil fuels in the industrial sector (A) and the power generation sector (B)
3.3.2 Mapping the Spatial Distribution of CO2 Emissions Associated with the Use of Fossil Fuels in the Mobile Sources Sector
The results of mapping the spatial distribution of CO2 emissions from the combustion of fossil fuels in the mobile sources sector have been classified into three categories: road transport, rail transport, and agricultural machinery.
Map of the Spatial Distribution of CO2 Emissions from the Road Transport System
Transportation density results in the main and secondary arteries of the two-tiered roads indicate that the volume of cars on the main streets is 78% while it is 22% on the secondary and alleyways. This density was considered as the weight of each road type in the carbon dioxide emissions. Next, the weight calculated in the total amount of annual carbon dioxide emissions from fuel consumption in the road transport sector (excluding fuel consumption in the bus transport network) was multiplied. In this way, the amount of CO2 was divided into two parts, the amount of CO2 emitted from the main streets and secondary streets, which was calculated using Eqs. (6) and (7). The results showed that the amount of carbon dioxide emissions from transportation on main roads is 1,784,368.29 tons per year and on secondary roads is 503,283.36 tons per year.
Finally, the amount of carbon dioxide emissions in each section of the main roads was calculated using Eq. (8), which is shown on the spatial distribution map in Fig. 4. Fig. 4 also shows that in the first and second-degree arteries, around city squares and generally on roads with high hourly traffic, the amount of carbon dioxide emissions from fossil fuel combustion is also high. In general, the maximum amount of emissions of this gas on main streets is 621 kilograms per square meter per year in 2020. On the other hand, the distribution map of CO2 emissions in secondary streets in neighbourhoods was calculated using Eq. (10), and its spatial distribution map is shown in Fig. 5. The results of the spatial distribution map of annual CO2 emissions caused by fossil fuel combustion from light vehicles on secondary streets (Fig. 5) show that the minimum amount of emissions of this gas is 2.79 and the maximum amount is 119.44 kilograms per square meter.
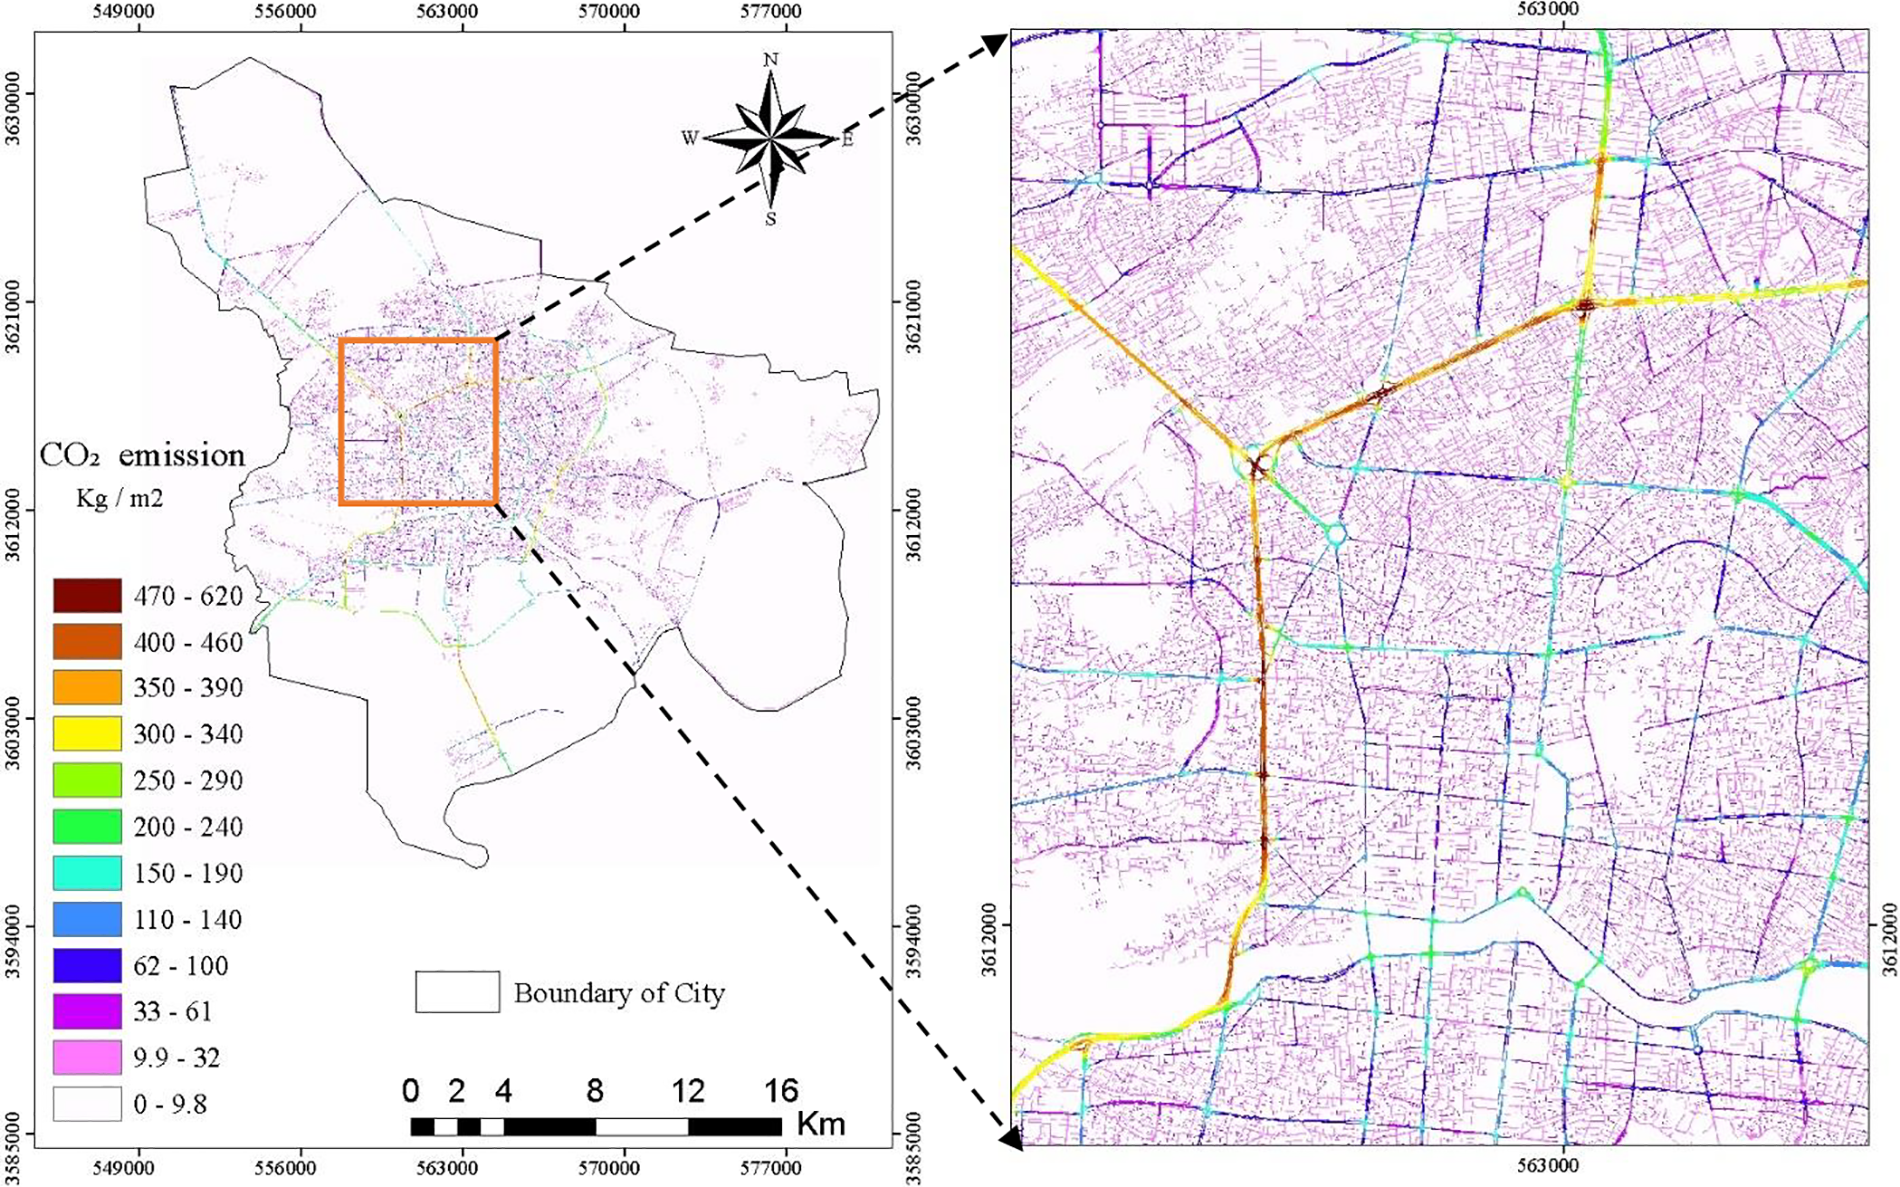
Figure 4: Spatial distribution map of annual CO2 emissions resulting from the combustion of fossil fuels from light vehicles on main streets
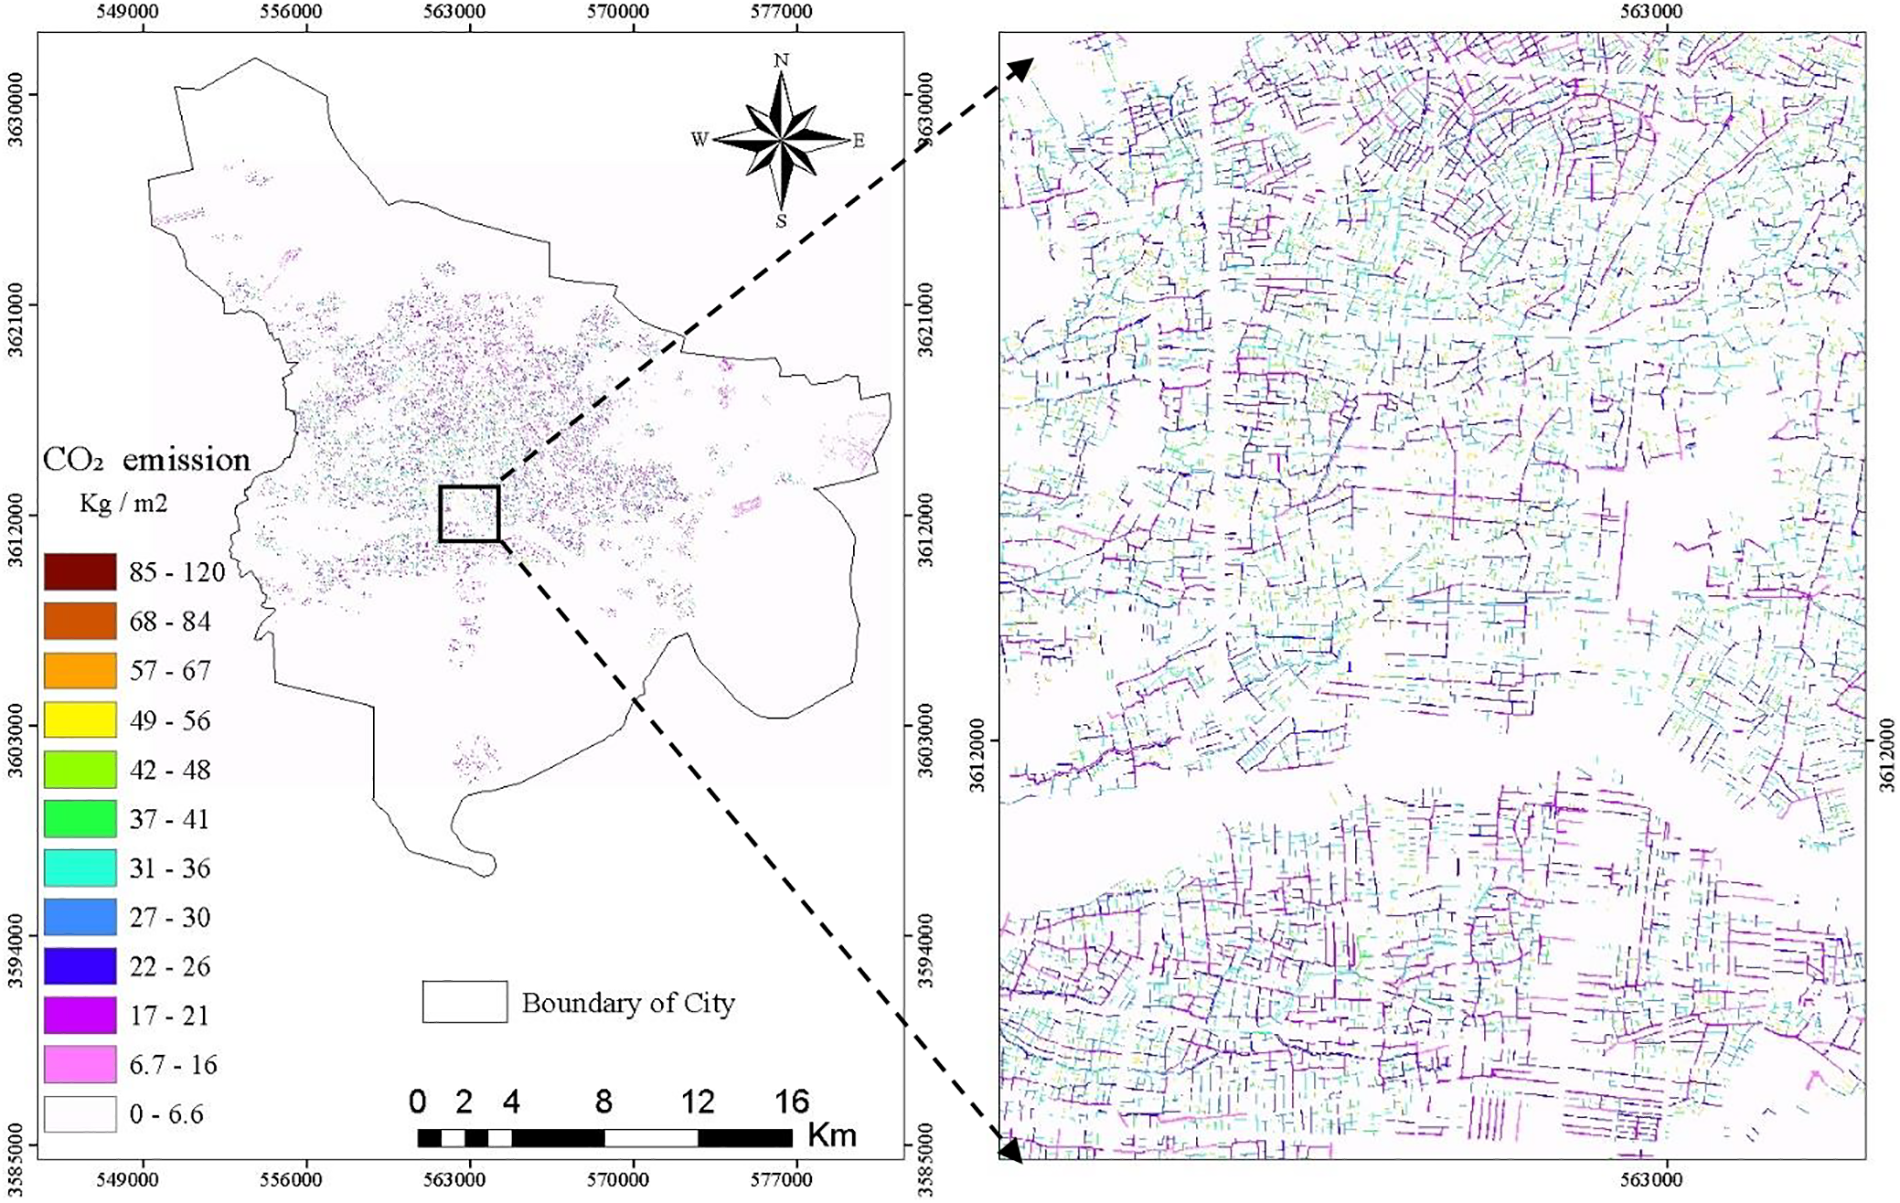
Figure 5: Spatial distribution map of annual CO2 emissions resulting from the combustion of fossil fuels from light vehicles on secondary streets
Map of the Annual Distribution of CO2 Emissions Resulting from the Consumption of Fossil Fuels in Bus Lines
The map of the distribution of carbon dioxide emissions in each section of public transportation lines was calculated using Eq. (12), and the result is presented in Fig. 6. The spatial distribution map of the annual emissions of CO2 resulting from the combustion of fossil fuels in public transportation lines (Fig. 6) shows that the minimum and maximum levels of CO2 emissions are 0.478 and 61.24 kilograms per square meter, respectively. The findings of this section of the study generally indicate that the amount of carbon dioxide emissions from the oxidation of hydrocarbons during the combustion process of fossil fuels on main and secondary streets in the urban area of Isfahan is 2,377,720.5 million tons per year, which accounts for 17.16% of the total carbon dioxide emissions from the combustion of fossil fuels in the city of Isfahan. Also, the total carbon dioxide emissions in the railway sector are 2844 tons in 2020. The annual distribution map of carbon dioxide emissions in this sector is shown in Fig. 7B.
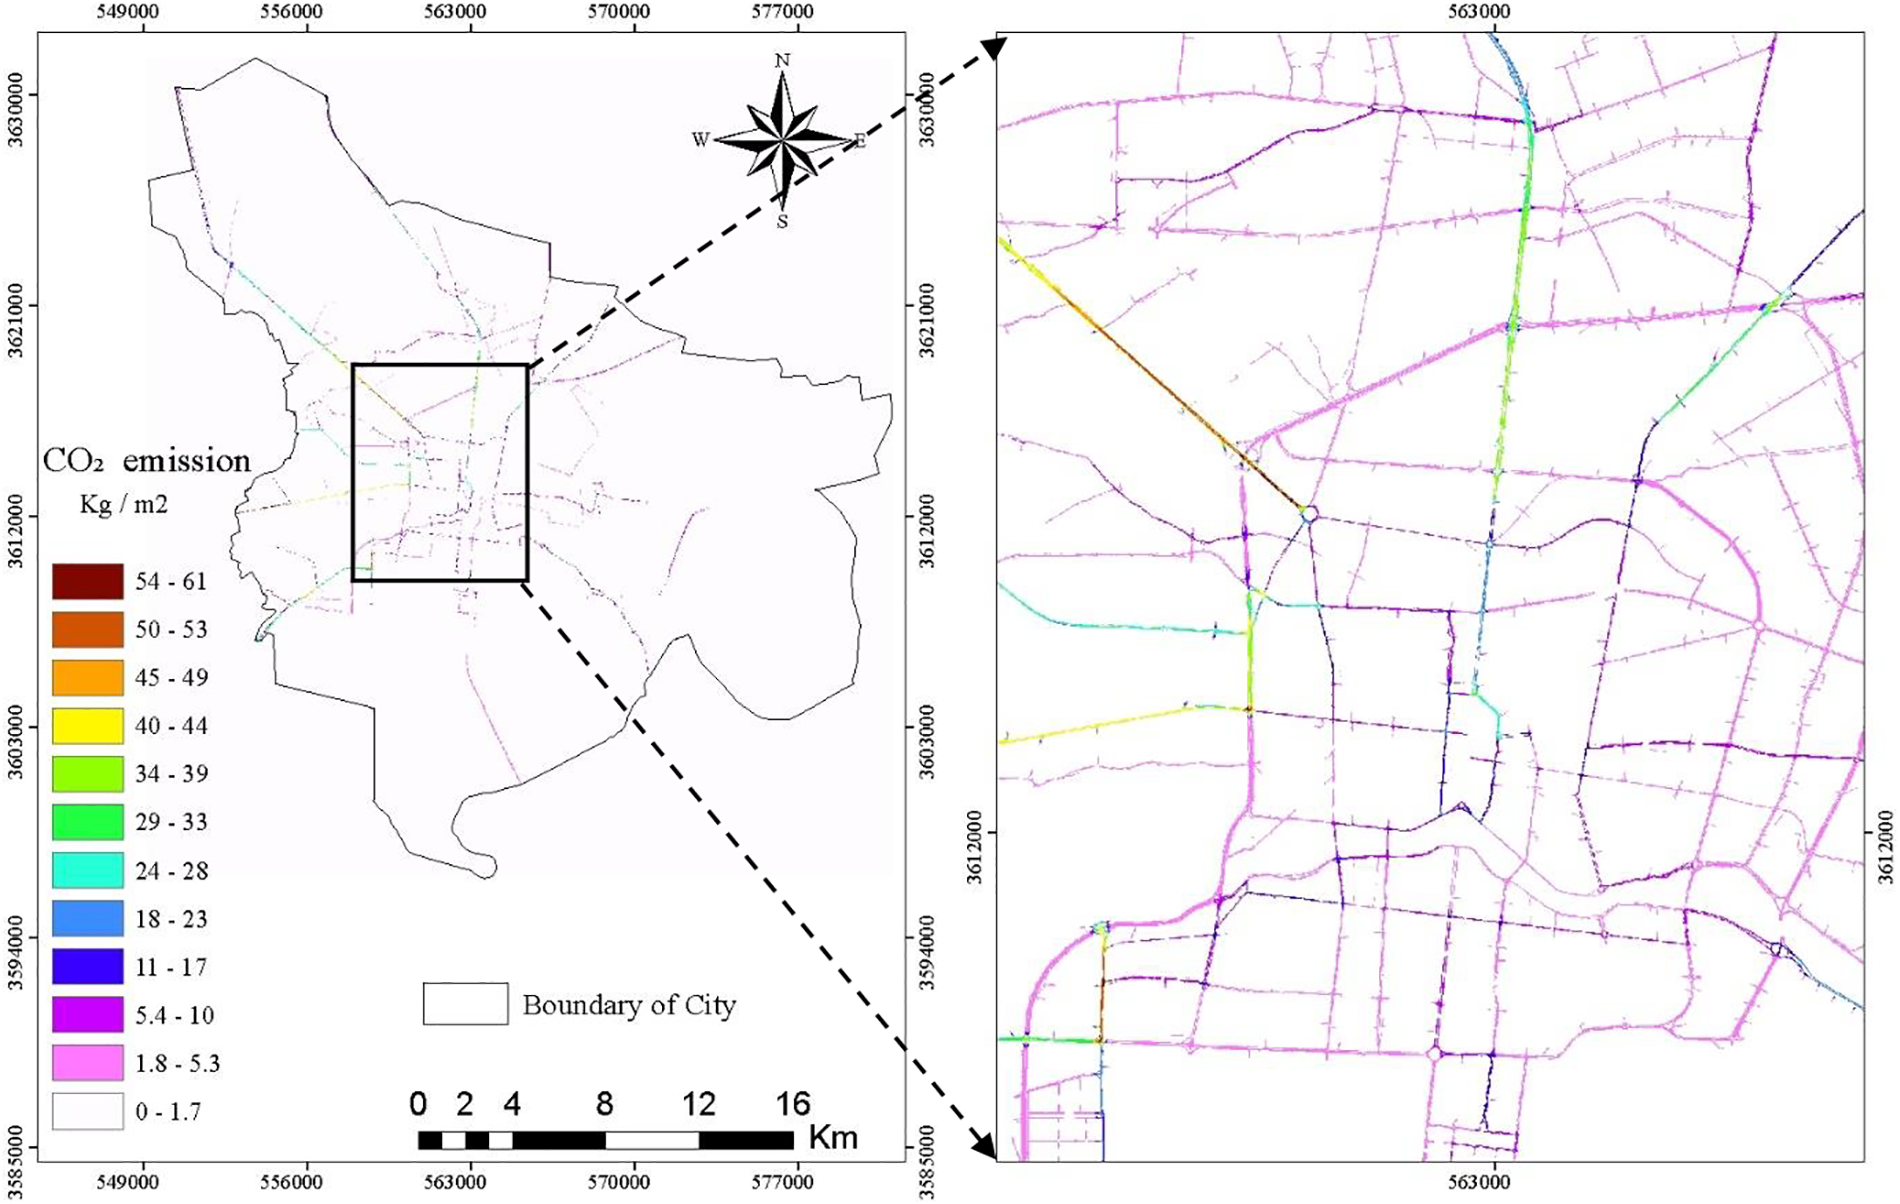
Figure 6: Spatial distribution map of annual CO2 emissions resulting from the combustion of fossil fuels from public transportation on public transportation lines
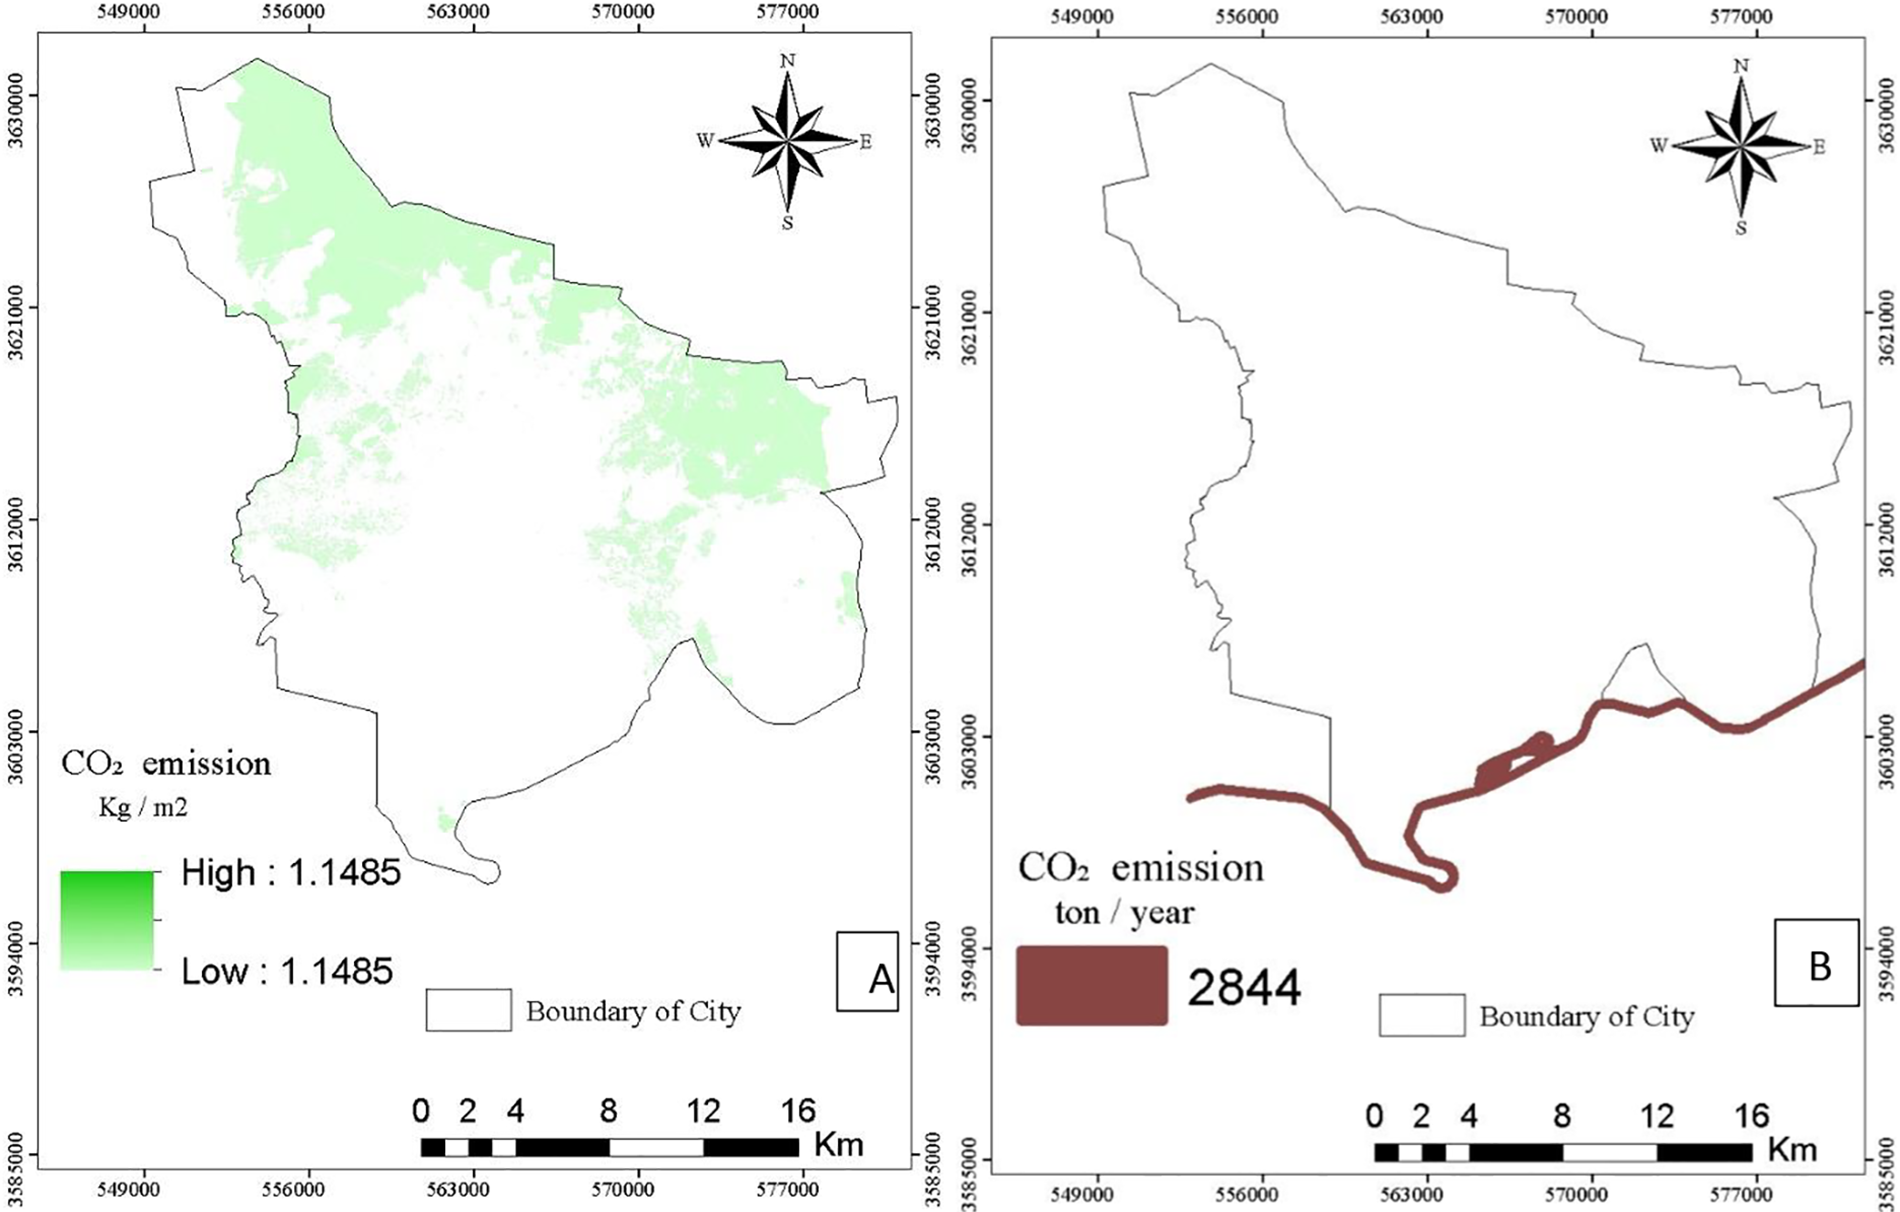
Figure 7: Spatial distribution map of annual CO2 emissions resulting from the combustion of fossil fuels in agricultural lands (A) and rail transportation within the limits of Isfahan city (B)
The Spatial Distribution Map of Annual Carbon Dioxide Emissions Resulting from the Consumption of Fossil Fuels in the Non-Road Transportation Sector (Agricultural Sector)
The agricultural land area in the 15 districts of Isfahan city is approximately 13,724 hectares. According to the Isfahan City Statistical Yearbook, around 3450 pieces of agricultural machinery are active in these lands. Since, on average, each machine operates 1200 h per year and consumes 14 litres of fuel per hour, it can be stated that each agricultural machine consumes about 16,800 litres of fuel per year. The total diesel fuel consumption in the agricultural sector is 57.96 million litres per year. The total amount of carbon dioxide emissions from the agricultural transportation sector was 157,620.48 tons in 2020. Finally, to prepare the spatial distribution map of CO2 emissions from agricultural lands, the total amount of annual CO2 emissions were divided by the total agricultural land area in Isfahan city, and the result is presented in Fig. 7A. The spatial distribution map of CO2 greenhouse gas emissions in the agricultural sector indicates that approximately 1.1485 kilograms of carbon dioxide are emitted into the atmosphere annually per square meter of agricultural lands in the 15 districts of Isfahan city.
Integrating Spatial Distribution Maps of CO2 Greenhouse Gas Emissions from Stationary and Mobile Combustion Sources
The distribution maps of CO2 emissions from each source were integrated by overlapping analysis. Fig. 8 illustrates the spatial distribution of annual carbon dioxide emissions in the city of Isfahan. Overall, this map shows that the amount of CO2 emissions resulting from the oxidation of hydrocarbons during the combustion of fossil fuels in the Isfahan metropolitan area is 13,855,525.84 tons per year, with residential, commercial, industrial, power plant, road-rail transportation, and non-road transportation (agricultural machinery) activities contributing 21.78%, 4.92%, 4.37%, 50.61%, 17.18%, and 1.14% of the emitted carbon dioxide, respectively.
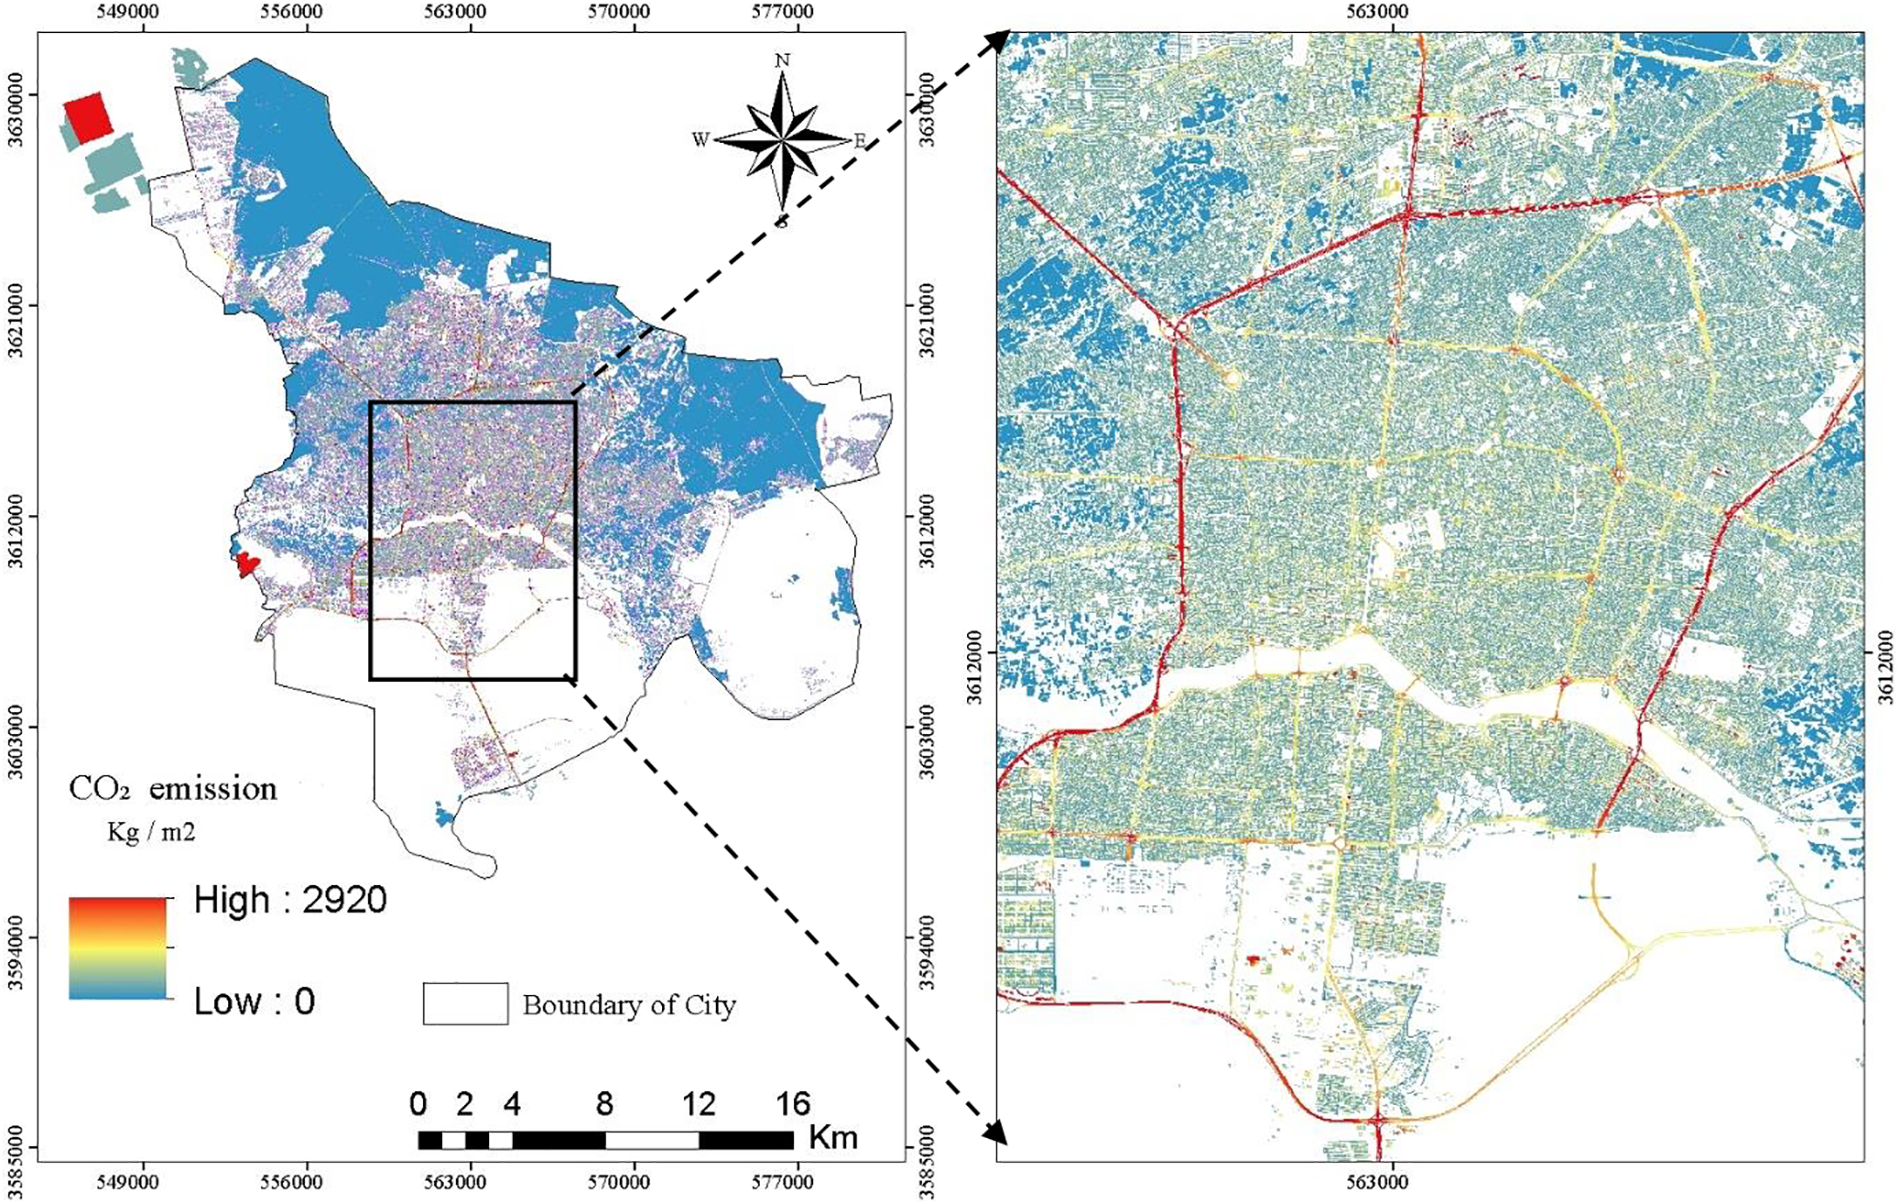
Figure 8: Spatial distribution map of carbon dioxide greenhouse gas emissions resulting from stationary and mobile combustion sources (residential, commercial, industrial, and road transportation sectors)
Summary of Study Results and Discussion
The study focuses on quantifying carbon dioxide (CO2) emissions from fossil fuel combustion in Isfahan’s urban areas using Geographic Information Systems (GIS). It aims to address the challenge of assessing urban sustainability by analyzing CO2 emissions from stationary and mobile sources. The research provides insights into emission patterns through data analysis and mapping techniques, aiding urban planners and policymakers in decision-making.
Urban CO2 Emissions and Sustainability: This section explores how Geographic Information Systems (GIS) can be used to assess urban sustainability through the lens of CO2 emissions from fossil fuel burning in Isfahan. Traditionally, such assessments lack precision. Our research offers a solution: a micro-scale analysis using GIS that pinpoints CO2 emissions from both stationary (buildings) and mobile (vehicles) sources.
Micro-scale Approach and Data Analysis: Our study tackles the challenge of limited, imprecise methods for measuring CO2 emissions in cities. We propose a novel approach using GIS to analyze data on fossil fuel consumption across various sectors (homes, businesses, factories, transportation). This allows us to quantify CO2 emissions from both stationary and mobile sources, providing a detailed picture of Isfahan’s carbon footprint.
Key Findings and Emission Patterns: The analysis revealed interesting patterns in Isfahan’s fuel consumption and related CO2 emissions. Homes were responsible for 21.78% of emissions, followed by industry (4.37%) and commerce (4.92%). Power plants, however, were the biggest contributor, responsible for a significant 50.61% of CO2 emissions. We further investigated transportation, finding that road and rail together contributed 17.18% of emissions, while non-road sources (mainly agricultural machinery) accounted for 1.14%.
Mapping CO2 Distribution: Using spatial distribution mapping, we visualized how CO2 emissions vary across Isfahan’s geography. This revealed distinct “hotspots” of emissions, particularly in densely populated areas and along major transportation corridors. For example, CO2 emissions from cars were higher on main roads compared to side streets. Similarly, emissions from public buses were concentrated on their designated routes.
A Comprehensive Picture: By combining findings from stationary and mobile sources, we created a comprehensive map that illustrates the total CO2 emissions across Isfahan. This integrated approach allowed us to pinpoint areas with the highest carbon footprints, enabling targeted mitigation strategies. Notably, the analysis highlighted the outsized contribution of certain sectors, emphasizing the need for focused interventions to promote sustainability.
Theoretical Significance: Our study advances the theory of urban sustainability by demonstrating the effectiveness of GIS in quantifying and visualizing CO2 emissions at a micro-scale level. By revealing the spatial distribution of emissions and their sectoral contributions, we offer valuable insights for urban planning and policy development. Furthermore, our methodology can be applied to other cities, facilitating comparisons and fostering a deeper understanding of how carbon dynamics work in urban environments.
Future Directions: In conclusion, this study provides a thorough analysis of CO2 emissions from fossil fuel combustion in Isfahan. It highlights the usefulness of GIS in assessing urban sustainability. Our innovative methods and detailed spatial mapping offer valuable insights for policymakers and urban planners working to combat climate change and promote environmentally friendly development. Future research can build on our findings by incorporating additional data sources and refining spatial modeling techniques to create even more accurate and useful CO2 emission assessments for cities.
Comparative Analysis of Carbon Dioxide Emission Mapping Methods:
Several methods exist for creating CO2 emission maps, each with distinct strengths and weaknesses. This study explores three main approaches: satellite imagery, the ODIAC method, and the bottom-up (inventory) method.
Satellite Image-Based Method: This method utilizes satellite data to detect CO2 emission sources based on factors like land use, vegetation changes, and thermal anomalies. The data is then processed to estimate emissions. However, its accuracy depends heavily on satellite resolution, atmospheric conditions, and the ability to distinguish natural from anthropogenic CO2 sources. Additionally, it may struggle with detecting smaller or dispersed emissions [39].
ODIAC Method: The Open-source Data Inventory for Anthropogenic CO2 (ODIAC) method combines various data sources like nightlights, population density, and industrial activity to estimate CO2 emissions. Statistical models are then employed to allocate emissions to spatial grids. While ODIAC provides high-resolution global CO2 emission maps, its accuracy can be limited by uncertainties in the input data and modeling assumptions. It may also struggle to represent emissions from rapidly changing industrial and urban areas [40].
Bottom-Up (Inventory) Method: This method involves collecting data on CO2 emissions from various local or regional sources like industrial facilities, transportation, and energy consumption. This data is then aggregated to create a comprehensive inventory of emissions. The accuracy of this method hinges on the availability and quality of data reported by industries and government agencies. It can underestimate emissions from unreported sources and requires significant resources for data collection and processing [41].
Comparison and Discussion:
Satellite image-based methods and ODIAC offer spatially explicit CO2 emission maps with global coverage, suitable for analyzing regional and global emission patterns. However, the inventory method provides more detailed and accurate emission estimates at local or sectoral levels, making it valuable for policy-making and mitigation strategies at those scales.
The inventory method stands out due to its direct data collection from various sources, leading to a more comprehensive and precise account of emissions at local or sectoral levels. This detailed breakdown empowers policymakers to target mitigation efforts effectively. Studies consistently demonstrate the inventory method’s superior accuracy and reliability, especially for smaller-scale mapping and emission reduction strategies. A recent study comparing CO2 mapping methods further reinforces this, highlighting the inventory method’s suitability for local and regional contexts. By ensuring comprehensive coverage and direct data collection, the inventory method offers invaluable insights that can inform targeted policies and interventions aimed at reducing CO2 emissions and combating climate change at local and regional levels.
Research Limitations:
This study confirms the limitations that can be considered in future research to further refine the spatial distribution of CO2 emissions in urban areas. Acknowledging the limitations of this research, in order to map the spatial distribution of carbon dioxide emissions in this research, the data related to the amount of energy consumption in each residential, commercial and industrial building was not available separately. Therefore, we had to collect data related to the total amount of fossil fuels consumed annually in each of the sectors (i.e., residential, commercial and industrial sectors), which reduced the accuracy of this research. However, in case of access to the data of the amount of fossil fuel consumption in each building separately, the results of mapping the spatial distribution of CO2 gas would be calculated much more accurately.
Here are some ways to promote such studies:
Collaboration with Utility Companies: Partnering with utility companies can provide access to individual building energy consumption data. This data can be anonymized to protect privacy while enabling researchers to map CO2 emissions based on the specific energy use patterns of different building types (e.g., single-family homes, apartment buildings, office buildings).
Smart Meter Integration: The increasing adoption of smart meters in buildings offers a promising avenue for collecting real-time energy consumption data. Integrating smart meter data with GIS platforms can enable dynamic updates to CO2 emission maps, reflecting actual energy use patterns and facilitating more responsive mitigation strategies.
Building Energy Modeling: Building energy modeling software can be employed to estimate energy consumption for individual buildings based on factors like building size, construction materials, and climate data. This approach can be particularly useful for buildings where actual consumption data is unavailable.
By incorporating these data sources, future research can create even more precise and actionable spatial distribution maps. These maps can then inform targeted interventions at the building level, such as retrofitting programs to improve energy efficiency or promoting the adoption of renewable energy sources like solar panels.
Achieved Objectives and Contribution to Urban Sustainability:
This study successfully achieved several key objectives that contribute to advancing urban sustainability in Isfahan and beyond. Firstly, it established a novel methodology for quantifying CO2 emissions from fossil fuel combustion at a micro-scale level in an urban environment. This bottom-up approach, which analyzes data from individual sectors, provides a valuable alternative to traditional methods focusing on regional or national emissions.
Secondly, the study generated the first-ever spatial distribution map of CO2 emissions for Isfahan, identifying hotspots associated with power plants, residential areas, and transportation corridors. This map serves as a crucial decision-making tool for urban planners and policymakers by pinpointing areas that require the most urgent attention for emission reduction strategies.
Thirdly, the study demonstrates the effectiveness of GIS technology in visualizing and analyzing CO2 emissions data within an urban context. This paves the way for utilizing GIS in other cities to create similar spatial distribution maps, facilitating comparative analyses and the development of best practices for urban sustainability across different regions. Overall, this study contributes significantly to the field of urban sustainability by providing a replicable methodology, valuable data on CO2 emissions in Isfahan, and a powerful visualization tool for informing future urban planning and policy decisions.
The study concludes by highlighting the significance of quantifying CO2 emissions resulting from fossil fuel combustion in urban areas, particularly focusing on Isfahan city. Utilizing a bottom-up approach, the study estimates that Isfahan emits approximately 13,855,526 tons of CO2 annually, with power plants, residential areas, and transportation sectors being the major contributors.
The use of a bottom-up approach for quantifying CO2 emissions is deemed suitable and accurate for mapping the spatial distribution of CO2 at urban, regional, and global scales. The study suggests that urban and environmental managers can utilize these results to develop strategies to reduce CO2 emissions in alignment with international agreements such as the UNFCCC, Kyoto Protocol, and Paris Agreement, as well as to promote sustainable development goals. The study outlines several conclusions based on its findings:
1. Importance of micro-scale spatial distribution maps: These maps are crucial for evaluating urban sustainability and implementing effective mitigation strategies. They provide insights into CO2 emission sources, patterns, and hotspots within a city, aiding in targeted interventions and policy formulation.
2. Identification of emission sources: Micro-scale maps help identify specific emission sources within urban areas, enabling policymakers to prioritize efforts and allocate resources accordingly.
3. Tailoring mitigation measures: Understanding emission variations allows policymakers to tailor mitigation measures to specific sources, such as promoting electric vehicles, improving public transportation, or enhancing energy efficiency in buildings.
4. Assessing intervention effectiveness: Spatial distribution maps facilitate monitoring and evaluating the impact of mitigation efforts over time, guiding future decision-making for sustainable urban development.
5. Supporting urban planning: These maps inform decisions about land use, zoning, and infrastructure development, aiding in designing sustainable neighborhoods and optimizing transportation networks.
6. Encouraging public engagement: Transparently sharing emission maps raises awareness and encourages community participation in sustainability initiatives, fostering behavioral changes and support for sustainable policies.
The study acknowledges that while spatial distribution maps alone cannot achieve urban sustainability, they serve as valuable tools for informed decision-making, targeted interventions, and progress monitoring. It emphasizes the importance of combining such maps with comprehensive urban planning, policy frameworks, and community engagement for effective CO2 emissions reduction and sustainable development.
Furthermore, the study suggests a future research direction to combine this investigation with a study on carbon emissions’ spatial distribution within the city, aiming to understand areas requiring planting strategies and balance between emissions and sequestration. This integrated approach would provide a more comprehensive understanding of urban carbon dynamics and aid in developing holistic strategies for carbon management within cities.
Acknowledgement: The author would like to thank the Isfahan Municipality for providing the data used in this study.
Funding Statement: The author declares that no funds, grants, or other support were received during the preparation of this manuscript.
Availability of Data and Materials: The WorldView-2 satellite image of the region purchased by Isfahan Municipality from the European Space Agency in 2018 (https://earth.esa.int/eogateway/missions/worldview-2, accessed on 20/03/2024). The topographic map of 1/2000 provided by Iran National Cartographic Center in 2020 (https://www.ncc.gov.ir/, accessed on 20/03/2024). The Statistical yearbook of Isfahan city 2020. Currently, all available data are with the author. In this research, a Free and Open Source Geographic Information System (QGIS) software has been used for modeling and preparing maps (https://qgis.org/en/site/, accessed on 20/03/2024).
Conflicts of Interest: The author declares that they have no conflicts of interest to report regarding the present study.
References
1. Sapienza M, Nurchis MC, Riccardi MT, Bouland C, Jevtić M, Damiani G. Theadoption of digital technologies and artificial intelligence in urban health: a scoping review. Sustainability. 2022;14(12):7480. [Google Scholar]
2. Li X, Zhou Y, Hejazi M, Wise M, Vernon C, Iyer G, et al. Global urban growth between 1870 and 2100 from integrated high resolution mapped data and urban dynamic modeling. Commun Earth Environ. 2021;2(1):201. [Google Scholar]
3. Ghaemi Z, Smith AD. A review on the quantification of life cycle greenhouse gas emissions at urban scale. J Clean Prod. 2020;252:119634. [Google Scholar]
4. Khodakarami L, Pourmanafi S, Soffianian AR, Lotfi A. Modeling spatial distribution of carbon sequestration, CO2 absorption, and O2 production in an Urban area: integrating ground-based data, remote sensing technique, and GWR model. Earth Space Sci. 2022;9(7):e2022EA002261. [Google Scholar]
5. Grace O, Iqbal K, Rabbi F. Creating sustainable urban environments: the vital link between development, health, and smart cities. Int J Sustain Infras Cities Soc. 2023;8(1):53–72. [Google Scholar]
6. Mir RA, Mantoo AG, Sofi ZA, Bhat DA, Bashir A, Bashir S. Types of environmental pollution and its effects on the environment and society. In: Geospatial analytics for environmental pollution modeling: analysis, control and management. Cham: Springer, Nature Switzerland; 2023. p. 1–31. [Google Scholar]
7. Zetter R, Watson GB. Designing sustainable cities. In: Designing sustainable cities in the developing world. London, UK: Routledge; 2016. p. 3–18. [Google Scholar]
8. Houghton JT, Ding YDJG, Griggs DJ. Climate change 2001: the scientific basis. Cambridge: Cambridge University Press; 2001. vol. 881, no. 9. [Google Scholar]
9. Robinson SA. Climate change adaptation in SIDS: a systematic review of the literature pre and post the IPCC Fifth Assessment Report. Wiley Interdiscip Rev: Clim Change. 2020;11(4):e653. [Google Scholar]
10. Chen X, Di Q, Jia W, Hou Z. Spatial correlation network of pollution and carbon emission reductions coupled with high-quality economic development in three Chinese urban agglomerations. Sustain Cities Soc. 2023;94:104552. [Google Scholar]
11. Khodakarami L, Pourmanafi S, Mokhtari Z, Reza Soffianian A, Lotfi A. Urban sustainability assessment at the neighborhood scale: integrating spatial modellings and multi-criteria decision making approaches. Sustain Cities Soc. 2023;97:104725. doi:10.1016/j.scs.2023.104725. [Google Scholar] [CrossRef]
12. Xu J, Deng Y, Shi Y, Huang Y. A bi-level optimization approach for sustainable development and carbon emissions reduction towards construction materials industry: a case study from China. Sustain Cities Soc. 2020;53:101828. [Google Scholar]
13. Lehmann S. Low carbon construction systems using prefabricated engineered solid wood panels for urban infill to significantly reduce greenhouse gas emissions. Sustain Cities Soc. 2013;6:57–67. [Google Scholar]
14. Dasgupta S, Lall S, Wheeler D. Cutting global carbon emissions: where do cities stand? Washington DC, USA: World Bank; 2022. [Google Scholar]
15. Liu G, Zhang F. How do trade-offs between urban expansion and ecological construction influence CO2 emissions? New evidence from China. Ecol Indic. 2022;141:109070. [Google Scholar]
16. Brandon PS, Lombardi P. Evaluating sustainable development in the built environment. Oxford: John Wiley & Sons; 2010. [Google Scholar]
17. Turnbull JC, Sweeney C, Karion A, Newberger T, Lehman SJ, Tans PP, et al. Toward quantification and source sector identification of fossil fuel CO2 emissions from an urban area: results from the INFLUX experiment. J Geophys Res: Atmos. 2015;120(1):292–312. [Google Scholar]
18. Yoro KO, Daramola MO. CO2 emission sources, greenhouse gases, and the global warming effect. In: Advances in carbon capture; 2020. p. 3–28. [Google Scholar]
19. Zhang L, Wang Y, Miao X, Gan M, Li X. Geochemistry in geologic CO2 utilization and storage: a brief review. Adv Geo-Energy Res. 2019;3(3):304–13. [Google Scholar]
20. Li H, Qiu P, Wu T. The regional disparity of per-capita CO2 emissions in China’s building sector: an analysis of macroeconomic drivers and policy implications. Energy Build. 2021;244:111011. [Google Scholar]
21. Inoue M, Morino I, Uchino O, Miyamoto Y, Yoshida Y. Validation of XCO2 derived from SWIR spectra of GOSAT TANSO-FTS with aircraft measurement data. Atmos Chem Phys. 2013;13(19):9771–88. [Google Scholar]
22. Palmer PI, O’Doherty S, Allen G, Bower K, Bösch H, Chipperfield MP, et al. A measurement-based verification framework for UK greenhouse gas emissions: an overview of the Greenhouse gAs Uk and Global Emissions (GAUGE) project. Atmo Chem Phys. 2018;18(16):11753–77. doi:10.5194/acp-18-11753-2018. [Google Scholar] [CrossRef]
23. Maksyutov S, Coauthors. Regional CO2 flux estimates for 2009–2010 based on GOSAT and ground-based CO2 observations. Atmos Chem Phys Discuss. 2012;12:29235–88. doi:10.5194/acpd-12-29235-2012. [Google Scholar] [CrossRef]
24. Golomolzin VV, Rublev AN, Kiseleva Yu V, Kozlov DA, Prokushkin AS, Panov AV. Retrieval of total column carbon dioxide over Russia from Meteor-M No. 2 satellite data. Russ Meteorol Hydrol. 2022;47(4):304–14. doi:10.1080/00343400802468007. [Google Scholar] [CrossRef]
25. Haughton G, Hunter C. Editorial: sustainable regions. Reg Stud. 2008;42:1219–22. [Google Scholar]
26. Bhatta B, Saraswati S, Bandyopadhyay D. Urban sprawl measurement from remote sensing data. Appl Geogr. 2010;30(4):731–40. [Google Scholar]
27. Liu Y, Chen H, Zhang L, Feng Z. Enhancing building energy efficiency using a random forest model: a hybrid prediction approach. Energy Rep. 2021;7:5003–12. [Google Scholar]
28. Wang F, Liu J, Qin G, Zhang J, Zhou J, Wu J, et al. Coastal blue carbon in China as a nature-based solution towards carbon neutrality. The Innovation. 2023;4(5):100481. [Google Scholar]
29. Sola A, Corchero C, Salom J, Sanmarti M. Simulation tools to build urban-scale energy models: a review. Energies. 2018;11(12):3269. [Google Scholar]
30. Hao H, Geng Y, Wang H, Ouyang M. Regional disparity of urban passenger transport associated GHG (greenhouse gas) emissions in China: a review. Energy. 2014;68:783–93. [Google Scholar]
31. Gurney KR, Liang J, O’keeffe D, Patarasuk R, Hutchins M, Huang J, et al. Comparison of global downscaled versus bottom-up fossil fuel CO2 emissions at the urban scale in four US urban areas. J Geophys Res: Atmos. 2019;124(5):2823–40. [Google Scholar]
32. Oda T, Maksyutov S, Andres RJ. The open-source data inventory for anthropogenic CO2, version 2016 (ODIAC2016a global monthly fossil fuel CO2 gridded emissions data product for tracer transport simulations and surface flux inversions. Earth Syst Sci Data. 2018;10(1):87–107. [Google Scholar] [PubMed]
33. Saghaei M, Moshrefjavadei S. Assessment and ranking of environmental pollution effects on the population centers (case study: Isfahan metropolis). J Nat Environ Hazards. 2018;7(18):235–50. [Google Scholar]
34. Herzog T. World greenhouse gas emissions in 2005. World Resourc Inst. 2009;7:1–5. [Google Scholar]
35. EPA Center for Corporate Climate Leadership. Center for corporate climate leadership GHG emission factors hub. 2022. Available from: https://www.epa.gov/climateleadership/ghg-emission-factors-hub. [Accessed 2020] [Google Scholar]
36. Shires TM, Loughran CJ, Jones S, Hopkins E. Compendium of greenhouse gas emissions methodologies for the oil and natural gas industry. Washington DC, USA: American Petroleum Institute API; 2009. [Google Scholar]
37. Eslami M, Faez K. Automatic traffic monitoring from satellite images using artificial immune system. In: Structural, Syntactic, and Statistical Pattern Recognition: Joint IAPR International Workshop; 2010 Aug 18–20; Cesme, Izmir, Turkey. [Google Scholar]
38. Uddin W, Ahmed A, Ali M. Satellite imagery applications of urban road inventory, traffic flow attributes, and road capacity assessment. Int J Recent Dev Eng Technol. 2013;1(3). [Google Scholar]
39. Zhang Q, Streets DG, Carmichael GR, He KB, Huo H, Kannari A, et al. Asian emissions in 2006 for the NASA INTEX-B mission. Atmos Chem Phys. 2009;9(14):5131–53. [Google Scholar]
40. Oda T, Maksyutov S. A very high-resolution (1 km × 1 km) global fossil fuel CO2 emission inventory derived using a point source database and satellite observations of nighttime lights. Atmos Chem Phys. 2011;11(2):543–56. doi:10.5194/acp-11-543-2011. [Google Scholar] [CrossRef]
41. IPCC. Climate change 2007: impacts, adaptation and vulnerability. In: Parry ML, Canziani OF, Palutikof JP, van der Linden PJ, Hanson CE, editors. Contribution of working group II to the fourth assessment report of the intergovernmental panel on climate change. Cambridge, UK: Cambridge University Press; 2007. p. 976. [Google Scholar]
Cite This Article
 Copyright © 2024 The Author(s). Published by Tech Science Press.
This work is licensed under a Creative Commons Attribution 4.0 International License , which permits unrestricted use, distribution, and reproduction in any medium, provided the original work is properly cited.


 Submit a Paper
 Propose a Special lssue
 View Full Text
 Download PDF
 Downloads
 Citation Tools