
 Submit a Paper
 Propose a Special lssue
 Open Access
ARTICLE

Support Vector Machine (SVM) and Object Based Classification in Earth Linear Features Extraction: A Comparison
1 School of Geomatics Science and Natural Resources, College of Built Environment, Universiti Teknologi MARA, Shah Alam, 40450, Malaysia
2 Institute for Biodiversity and Sustainable Development, Universiti Teknologi MARA, Shah Alam, 40450, Malaysia
3 School of Geomatics Science and Natural Resources, College of Built Environment, Universiti Teknologi MARA, Perlis, 02600, Malaysia
4 Department of Geomatic Engineering, Artvin Coruh University, Artvin, 08000, Türkiye
5 College of Agriculture and Natural Resources, Central Bicol State University of Agriculture, Pili, Camarines Sur, 4418, Philippines
6 GRAB Driver Center Kota Kinabalu (GDC KK), Riverson, Kota Kinabalu, 88100, Sabah
* Corresponding Author: Siti Aekbal Salleh. Email:
Revue Internationale de Géomatique 2024, 33, 183-199. https://doi.org/10.32604/rig.2024.050723
Received 15 February 2024; Accepted 14 May 2024; Issue published 27 June 2024
 View Full Text
 Download PDF
Abstract
Due to the spectral and spatial properties of pervious and impervious surfaces, image classification and information extraction in detailed, small-scale mapping of urban surface materials is quite difficult and complex. Emerging methods and innovations in image classification have centred on object-based classification techniques and various segmentation techniques, which are fundamental to this approach. Consequently, the purpose of this study is to determine which classification method is most suitable for extracting linear features in terms of techniques and performance by comparing two classification methods, pixel-based approach and object-based approach, using WorldView-2 satellite imagery to specifically highlight linear features such as roads, building edges, and road dividers. Two applied algorithms, including support vector machines (SVM) and ruled-based, were evaluated using two distinct software. A comparison of the results reveals that the object-based classification has a higher overall resolution than the pixel-based classification. The output of rule-based classification was satisfactory, with an overall accuracy of 88.6% (ENVI) and 92.2% (e-Cognition). The SVM classification result contained misclassified impervious surfaces and other urban features, as well as mixed objects. This classification achieved an overall accuracy of 75.1%. Nonetheless, this study provides an excellent overview for understanding the differences in their performances on the same data, as well as a comparison of the software employed.Graphic Abstract
Keywords
The remote sensing community has long been interested in image classification-focused remote sensing research because classification results are the foundation for numerous environmental and socioeconomic applications. However, classifying remotely sensed data into a thematic map remains difficult due to the influence of numerous variables, such as the complexity of the landscape, particularly in a mixed urban study area, selected remotely sensed data, image processing, and classification approaches [1]. Since the 1960s, remotely sensed data have been used for both global and local mapping and change detection. It affects the spatial, spectral, and temporal resolution of imagery, which are typically crucial when mapping. For instance, the higher the spatial resolution, the more objects that can be detected and, consequently, the smaller changes that can be interpreted. The spectral resolution determines the number of bands and the width of each, whereas the temporal resolution specifies the frequency with which the satellite revisits the same location on the Earth. However, this shift in technology raises the question of how to manage these incredibly detailed images.
A commonly employed use of remotely sensed images is for generating thematic land cover and land cover change maps. These maps are produced by utilizing spatially referenced training areas that represent different types of land cover, such as forests, water bodies, or urban areas, and employing pattern recognition techniques. During the recognition process, an algorithm assigns each pixel in an image to a specific land cover type based on various constraints. However, the advancement in technology has led to satellite images with higher spatial resolutions, necessitating adjustments in the processing of high-resolution remotely sensed data. For instance, the SPOT-5 sensor now offers a spatial resolution of 2.5 meters, rendering the applicability of certain classification methods based on assumptions of parametric statistics, such as the normal distribution of reflectance, inadequate.
One such widely used classifier is the maximum likelihood classifier (MLC), which assigns each pixel to a class based on the probability of it belonging to that class [2]. Nonetheless, the assumption of a normal distribution can be limiting and may not produce satisfactory results in specific scenarios [3]. In contrast, non-parametric classifiers, such as the support vector machine (SVM), take an alternative approach by making no assumptions about the probability distribution. Instead, they aim to identify the optimal boundaries between pixels and classes. Previous studies that the utilization of different classifiers can yield disparate classification outcomes. Machine learning presents a mathematical algorithmic approach to bridge the gap between intricate image patterns and their corresponding semantic labels. Consequently, numerous investigations have been undertaken to assess the effectiveness and efficiency of various classifiers. However, these studies have predominantly focused on pixel-based methodologies. In light of the growing popularity of object-based approaches, there is a rising interest in comparing different machine learning classifiers within the object-based framework. When employing these machine learning classifiers, it is essential to consider four key factors that significantly impact classification accuracy and efficiency. These factors include image segmentation, training sample selection, feature selection, and tuning parameter configuration [4]. To provide a clearer understanding of their respective merits and drawbacks, an outline of these factors is presented, aiding in the determination of the optimal approach for saving computational time and resources. Thus, the goal of this study is to explore the extraction of linear feature approaches to improve classification accuracy.
An approach to machine learning known as support vector machines (SVM) has proven to be highly effective in pattern recognition, particularly for supervised classification tasks that involve high-dimensional datasets [5]. When compared to other leading machine learning algorithms, it has been acknowledged as a competitive approach. In the past, however, support vector machines (SVMs) were evaluated primarily as pixel-based image classifiers only. In recent years, developments in the field of Remote Sensing have resulted in the emergence of techniques known as Object-Based Image Analysis (OBIA). These techniques integrate low-level and high-level computer vision methods. In remote sensing imagery, the transition from pixel-based techniques to object-based representation has led to a sizeable increase in the feature space dimensions. This is one of the consequences of this shift. As a direct result of this increased complexity in the classification process, traditional classification schemes have been presented with a number of challenges.
A single type of land use or land cover is typically assigned to each pixel in pixel-wise classification methods, which are the traditional methods for classifying remote sensing images. With this approach, pixel-based techniques categorize every pixel in the image independently of its surrounding pixels. Numerous studies have examined pixel-based methods, such as greatest likelihood, minimum distance, parallelepiped, ISODATA, and Kmean, by employing a pixel-based approach. However, Pixel-based categorization has several disadvantages, nevertheless, especially when handling rich information content of high-resolution data and very high resolution (VHR) satellite images. Furthermore, whilst more advanced pixel-based methods such an artificial neural network (ANN) and support vector machine (SVM) have considered texture, tone, and many other aspects, these conventional pixel-based methods only consider grey values [6,7]. Unsupervised classification and supervised classification are the two main categories into which pixel-based classification algorithms fall. In the end, researchers discovered that when pixel-based techniques were used on high-resolution images, a “salt and pepper” effect was created that aided in the classification’s imprecision [8–10]. Therefore, classifications based on spectral or pixel-based schemes are frequently applied to remotely sensed data, both supervised and unsupervised [11].
A study by [12] that used the SVM and MLC methods to classify the land use achieved good classification accuracy. The overall classification accuracy derived using feature extraction with SVM classification was 95% with Kappa index 0.94 while they achieved overall accuracy of 92% with Kappa index 0.90 by using the MLC method. In addition, reference [13] analyzed the classification result based on chi-square (CHI) algorithm and achieved an overall accuracy of 83.19% outperformed SVM and RF techniques. According to [14], performed the analysis with different scale factors at 5, 25, 50, 75, 100, 125, 150, 175, 200 and 225. Their findings show that the scale parameters of 25, 50, 75, 100 and 125 results in relevant and acceptable segmentation against other under-segmented objects for the seven selected classes. They conclude that the optimal parameter setting for SVM varied with the data sample size. As technology is constantly evolving and changing, deep learning and AI-powered technology are currently in demand in accurately extracting linear features. The study from [15] used different convolutional neural networks (CNN) architectures in order to get optimal results of dense residential such as UC Merced and WHU-RS. They achieved an accuracy of 88% under the training ratio of 50% on the UC-Merced dataset as compared to the fusion of GCFs and LOFs with an accuracy of 74% and the Inception-v3-CapsNet with accuracy of 80%. Despite the potential of deriving good accuracy in linear feature extractions, deep learning architectures also have some drawbacks. According to [16], “You Only Look Once” (YOLO) and faster region-based CNN (faster R-CCN) deep learning architectures are time-consuming and more difficult training phases as compared to conventional methods.
The advancement of sensing technology has led to a growing interest in extracting linear features from satellite images playing a role in diverse applications like urban planning and environmental monitoring [17]. However, accurately classifying landscapes in mixed urban areas presents significant challenges. The continuous evolution of sensing technology with satellites capable of capturing imagery at remarkably high resolutions adds to these challenges.
At times the shift from pixel-based methods to object-based image analysis (OBIA) has transformed the classification process by integrating level and high-level computer vision techniques [18]. This shift has expanded the feature space dimensions, leading to a reexamination of classification approaches. While pixel-based methods have been fundamental in image classification for a time their limitations in handling the wealth of information present in high-resolution data have become evident. This is particularly true for resolution (VHR) satellite images, where conventional pixel-based strategies often result in inaccurate classifications known as the “salt and pepper” effect.
In the face of these difficulties, the rise of machine learning algorithms, especially support vector machines (SVM), has shown potential for enhancing classification accuracy [19]. Traditionally SVMs have mainly been assessed as classifiers based on pixels. Yet the introduction of methods has opened up opportunities to investigate how effective SVMs can be, within an object-focused framework adapting to the growing intricacy of satellite images. In view of these developments, it is important to thoroughly investigate and compare different classification methods for linear feature extraction. This comparative analysis is important not only to improve the implementation of methods but also to identify practical applications in areas such as transportation planning, infrastructure development, disaster management, etc. In that regard, in this study, we make a detailed comparison between SVM and object-based classification methods that should be clarified. Through this effort, we are trying to provide valuable insights that can guide researchers and practitioners toward effective classification methods and effective in remote sensing applications will provide.
The work procedures that are involved in this study can be divided into four phases (see Fig. 1). The first phase was the preliminary study, which is the rationale of this case study.
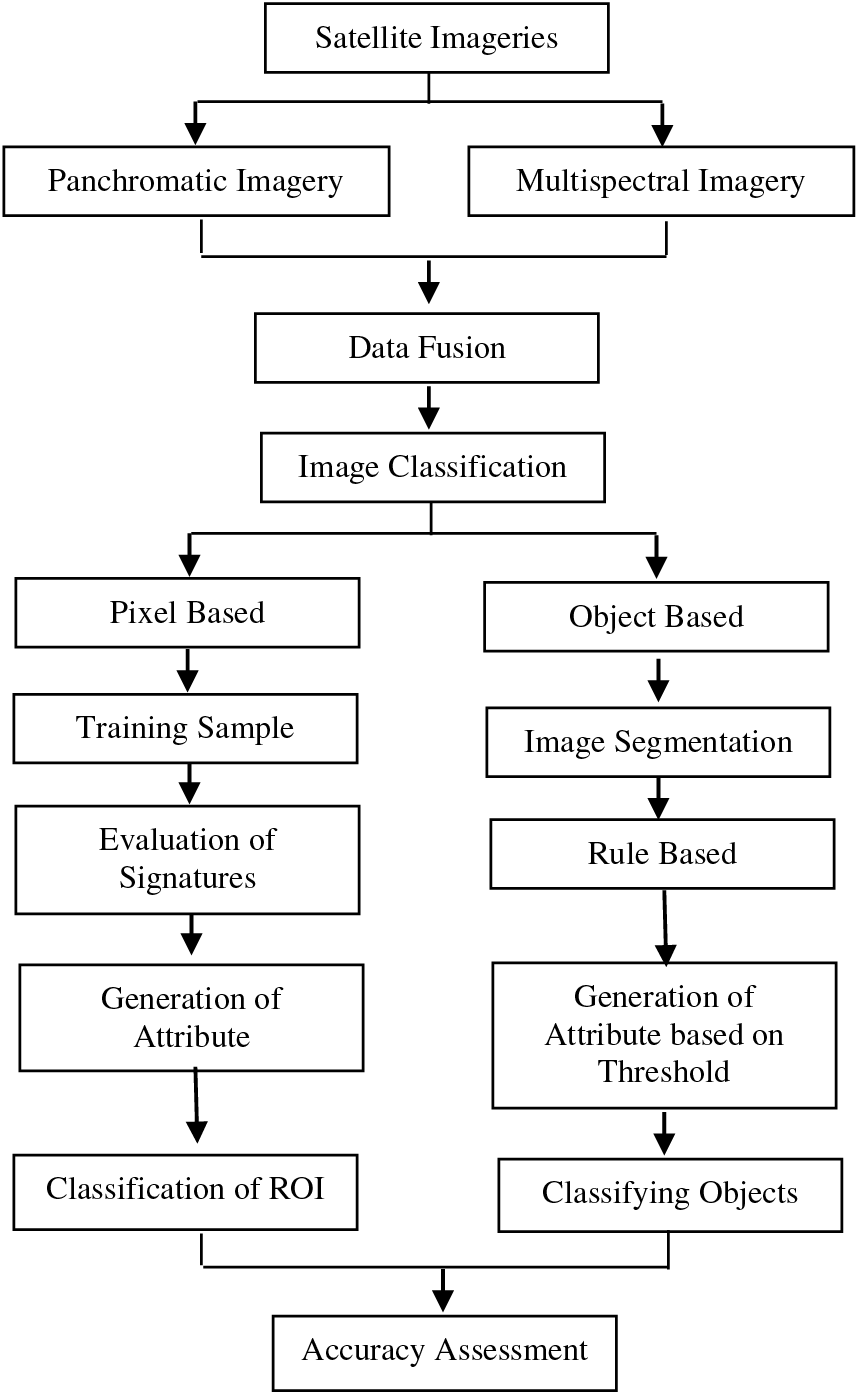
Figure 1: The methodological framework
The study area for this research was in Shah Alam, Selangor (see Fig. 2). While the second phase was about data acquisition of the data used to perform the processing and analysis. The data related were aerial imagery to be used for data processing as well as analysis. The next phase was data processing which would undergo a classification process using the techniques that had been proposed. The final stage was data analysis which would analyze the techniques of the classification and make the comparison between the techniques to conclude the best classifiers.
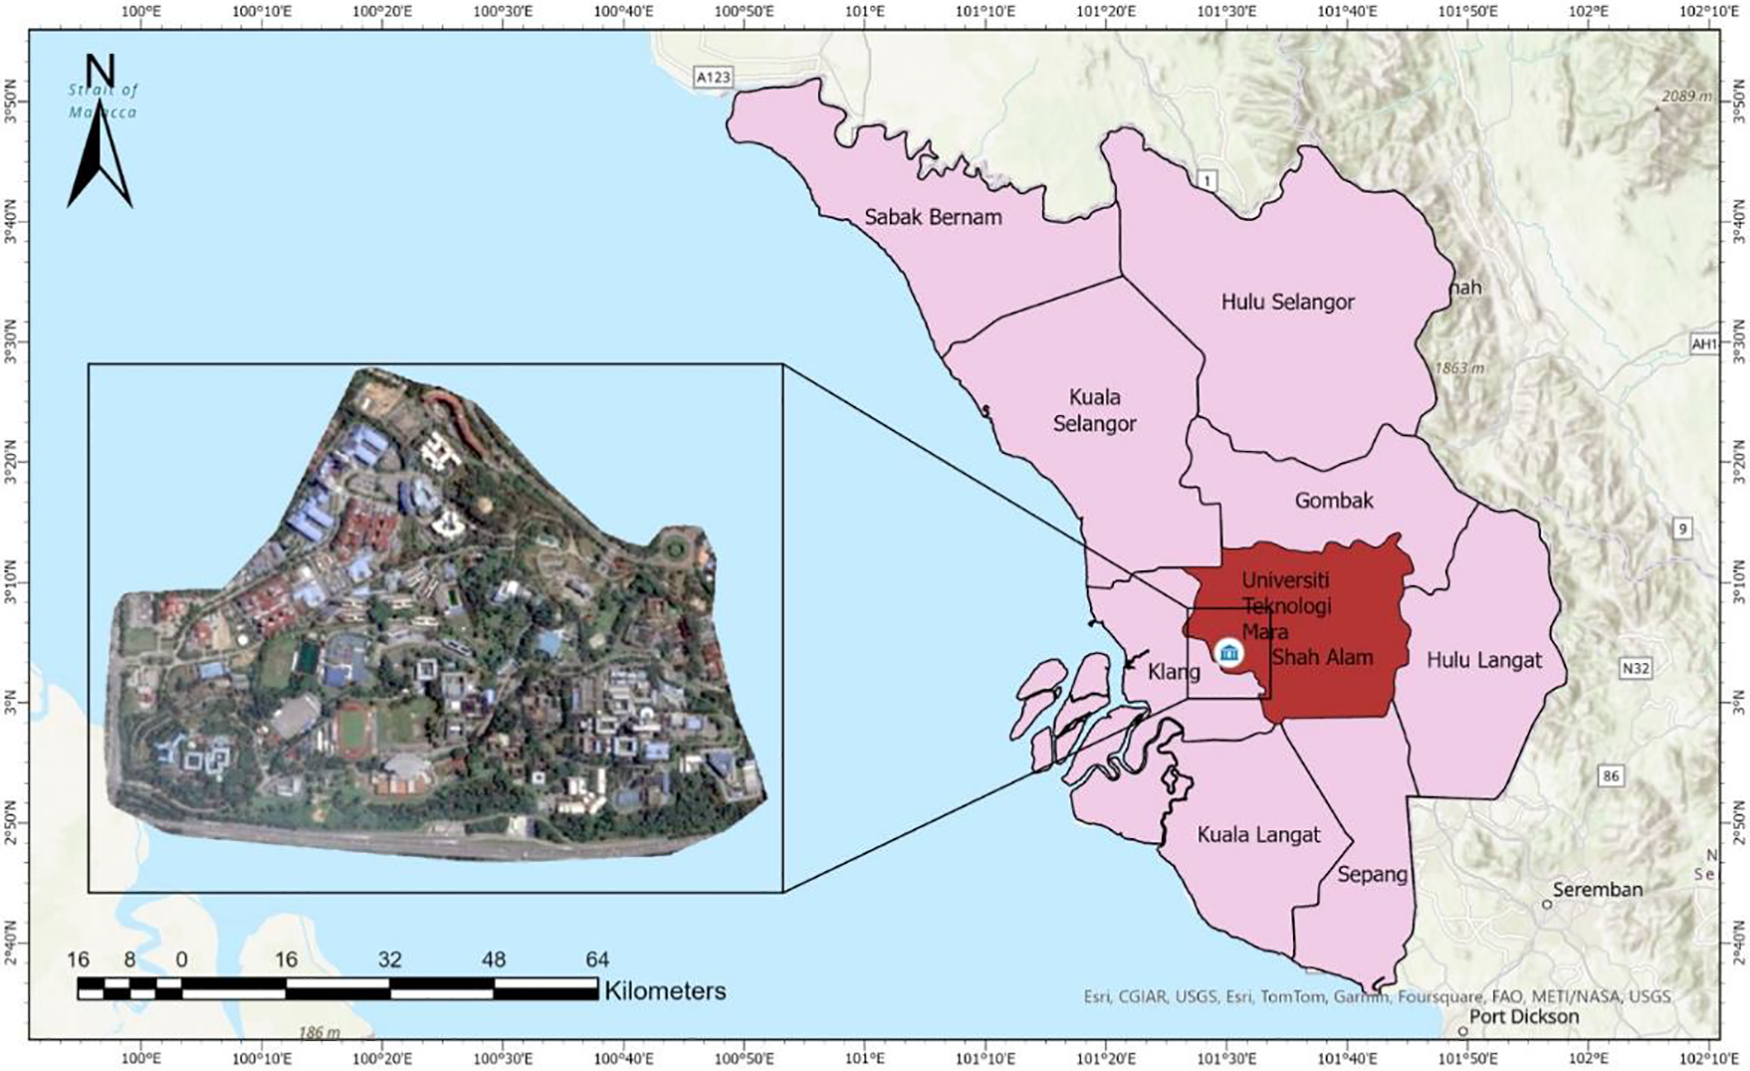
Figure 2: The study area
2.1 Support Vector Machine (SVM)
The Support Vector Machine (SVM) algorithm is widely utilized in remote sensing data analysis, primarily due to its capability to handle small training datasets effectively. In the domain of machine learning, SVM is a supervised, non-parametric classifier grounded in statistical learning theory [20]. Within the remote sensing community, SVM is well-regarded for its ability to deliver favorable results even with limited training samples. In this study, an SVM-based pixel-based classification utilizing the radial basis function (RBF) was conducted using ENVI software. Compared to other pixel-based classification approaches, SVM is theoretically considered a superior machine learning technique for highly dimensional datasets and has shown competitiveness with top-performing algorithms [21]. Moreover, SVM has been evaluated as a modern computationally intelligent method for image classification [22]. SVM offers distinct advantages that differentiate it from other classifiers, including lower computational intensity, robust performance in higher dimensional spaces, and the ability to handle limited training data effectively [23].
2.2 Object-Based and Rule-Based Classification Using ENVI and e-Cognition
Fig. 3 shows the process of linear feature extraction in ENVI. The workflow consists of two steps that start with the segmentation process of the image and then the classification of the segmented objects for the classified, which is linear features and nonlinear feature objects. The segmentation process or feature extraction is divided into two parts which are segments and merge. Then, start the classification by using a rule-based algorithm and exporting classification results to shapefiles.
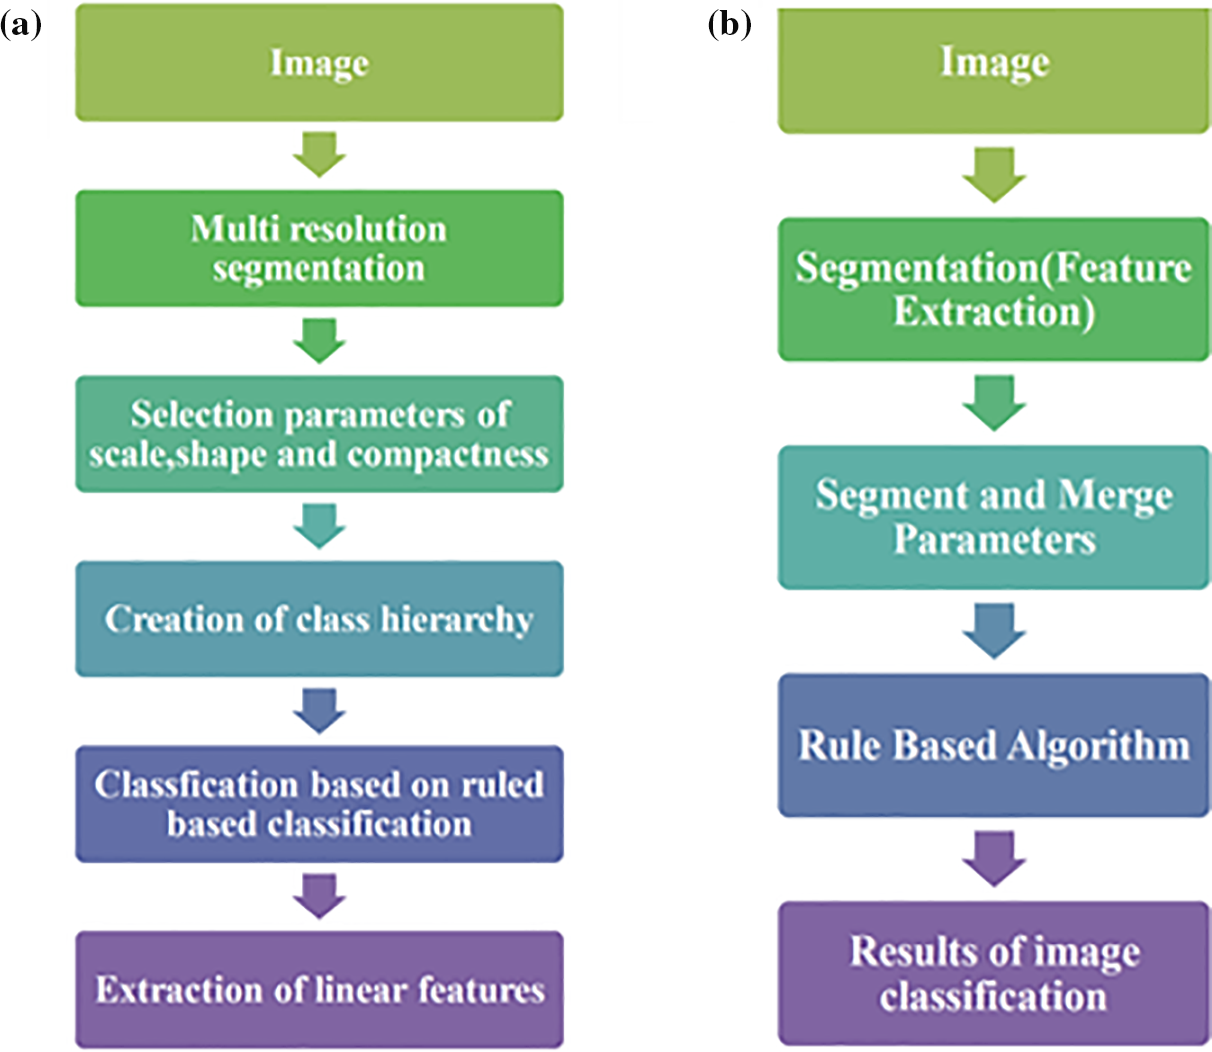
Figure 3: The workflow; (a) e-Cognition, (b) ENVI
Fig. 3 shows the procedure for extracting linear features in ENVI through object-based classification. Accurate categorization results depend on a variety of separate processes that make up this workflow. First, in the process, image segmentation is splitting the incoming image into relevant, homogeneous sections. This segmentation procedure aims to identify regions with similar characteristics and to define limits between different items. Later classification and analysis are based on the segments that are produced. Region expanding, edge-based segmentation, and clustering algorithms are a few techniques for segmenting the images. Combining spectral, spatial, and contextual data, these methods split pixels into coherent parts. Carefully calibrating the segmentation parameters, including scale or threshold values, may be required to obtain the required degree of precision and detail.
The image is segmented and then the process proceeds to the classification stage. This step involved grouping the split items into discrete categories with a focus on finding linear traits. One might classify linear characteristics as roads, rivers, power lines, and other lengthy, elongated constructions. It is the usual procedure to classify the segmented objects using a rule-based algorithm. Rule-based techniques use preset sets of standards or decision rules to classify items into certain classes. These rules could have as their foundation shape, texture, spectral properties, or spatial correlations. One rule can say, for example, that linear features are defined as objects having a specific length, orientation, and connection. It is important to keep in mind that the properties of the linear features to be extracted and the specific requirements of the study field can influence the modification and enhancement of the rule-based approach. This versatility allows researchers to adjust the categorization procedure to different scenarios, therefore improving the accuracy of the results.
The classification results were then typically exported to shapefiles, a popular geospatial data format, along with the identified linear features. The classified objects can be easily stored, shared, and used for additional analysis, visualization, or integration with other geospatial data sources thanks to shapefiles. Overall, image segmentation, classification using a rule-based algorithm, and exporting the outcomes to shapefiles are all steps in the workflow for linear feature extraction in ENVI through object-based classification. To ensure accurate and meaningful classification of linear features, each step requires careful consideration of the parameters, algorithm selection, and customization. Classification Based on User-Defined Rules in ENVI: Classification based on user-defined rules. Creating rule sets that precisely correspond with relevant features is the most difficult aspect of rule-based approaches. Rules are developed in part by an analyst’s grasp of the spatial, spectral, textural, or elevation properties of each feature. In rule-based feature extraction, these characteristics must be considered and examined to determine which attributes to employ. For instance, buildings have a different elevation pattern than roads, roads are longer than other features, trees have a coarser texture than grass, and the texture and spectral characteristics of various roof materials vary. This type of human knowledge and reasoning is used to distinguish desired objects from undesirable ones. Rule-based classification is the classification of object features into group classes using a digital number (DN) or cursor value. Using Table 1, the value was modified based on the image band’s cursor value to extract the road features. Each class has its own threshold value and may contain one or more rules. Each rule contains attributes, and the attribute setting dialogue displays a histogram indicating the frequency of all image objects.

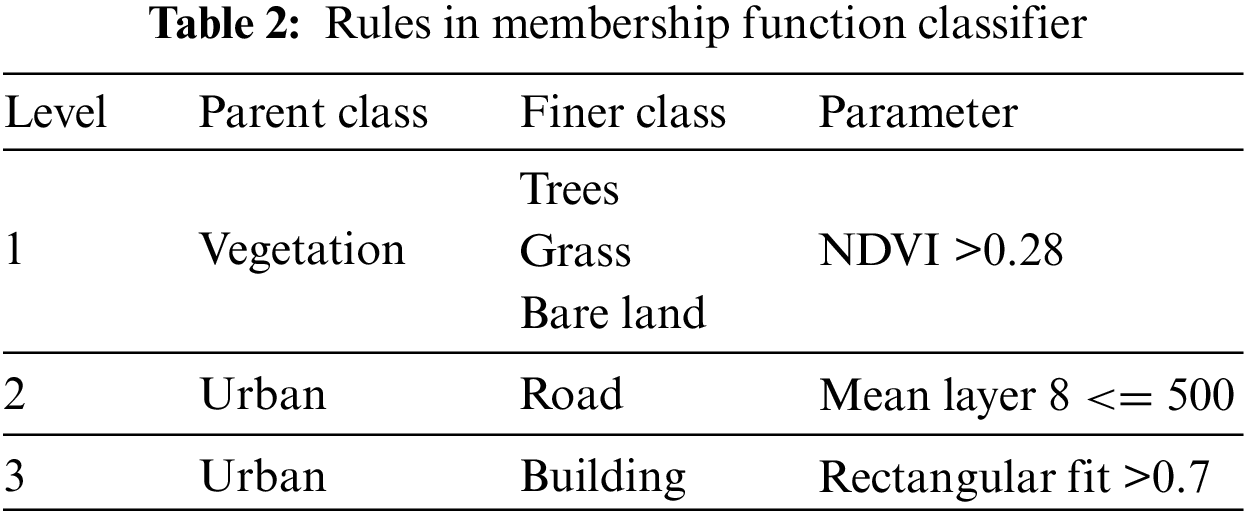
Object-Based Classification Using e-Cognition Software: Segmentation is performed to adjust scale parameters, shape factor, and compactness in the context of linear extraction. These parameters are adjusted so that the process produces a homogeneous region with well-defined boundaries around the object of study. Once these parameter ratios are adjusted into a homogeneous pattern, fuzzy rule bases for feature extraction are used to implement various rules. This work aimed to establish a set of guidelines for identifying desirable qualities from unwanted ones by associating desirable things with the category of desired features. The class description of every object is set by one or more software rules. The number of misclassifications may be decreased and the categorization process regulated with the aid of defining the guidelines and restrictions. Three stages were taken in calculating the threshold, each depending on the class description. The proposed rules and class descriptions for each feature are listed in Table 2. The classification process was then performed using the extracted segments and their statistical properties.
i) An essential first step in applying image classification is selecting suitable variables. Image classification can use several possible factors, including spectral signatures, vegetation indices, altered images, textural or contextual information, multitemporal images, multisensory images, and auxiliary data [24]. Because land-cover separability varies, using too many variables in a classification process may lower classification accuracy. To enhance the quality of the images before image processing such feature extraction, cell phase identification, and image segmentation, was done. Three often utilized methods are contrast enhancement, image restoration, and noise removal [25]. Significant spectral confusion is generated during image classification, which is based on remotely detected spectral responses, by the non-uniform spatial distribution of linear and nonlinear characteristics and the existence of many distinct materials covering the ground.
ii) The geographical resolution of the remotely sensed data, various data sources, a classification strategy, and the availability of classification software are just a few of the many aspects to consider when selecting an appropriate classification method. Every classification technique has certain drawbacks of its own [26].
iii) In classification maps, “salt and pepper” effects can result from conventional per-pixel classifiers. Post-classification processing is the procedure of reducing noise and raising the reliability of the classed output. Many times, a majority filter is employed to lower noise. While certain classes were utilized throughout the contextual analysis to further define areas of interest, others were employed to filter off areas not in consideration, hence lowering the quantity of information left [27].
iv) The evaluation of classification performance Evaluation of classification performance is a crucial phase in the classification process. A quantitative accuracy assessment based on sampling methodologies to a qualitative assessment based on subject-matter expertise are among the several approaches that may be applied [28]. Six criteria were put up to assess the efficacy of a classification method: uniform application, objectiveness, accuracy, reproducibility, robustness, and capacity to fully utilize the information content of the data [29]. In the accuracy evaluation procedure, it is often considered that classification error is the cause of the discrepancy between an image classification result and the reference data. On the flip side, if reference data is not gathered from a field survey, non-image classification mistakes should be looked at to produce a trustworthy report on classification accuracy. The error matrix method is the most often used one in accuracy assessment and may be used to calculate other crucial accuracy assessment components including commission error, omission error, overall accuracy, and kappa coefficient [30,31].
3.1 The Evaluation of Using Machine Learning and Object-Based Techniques Using WV-2: Image Fusion
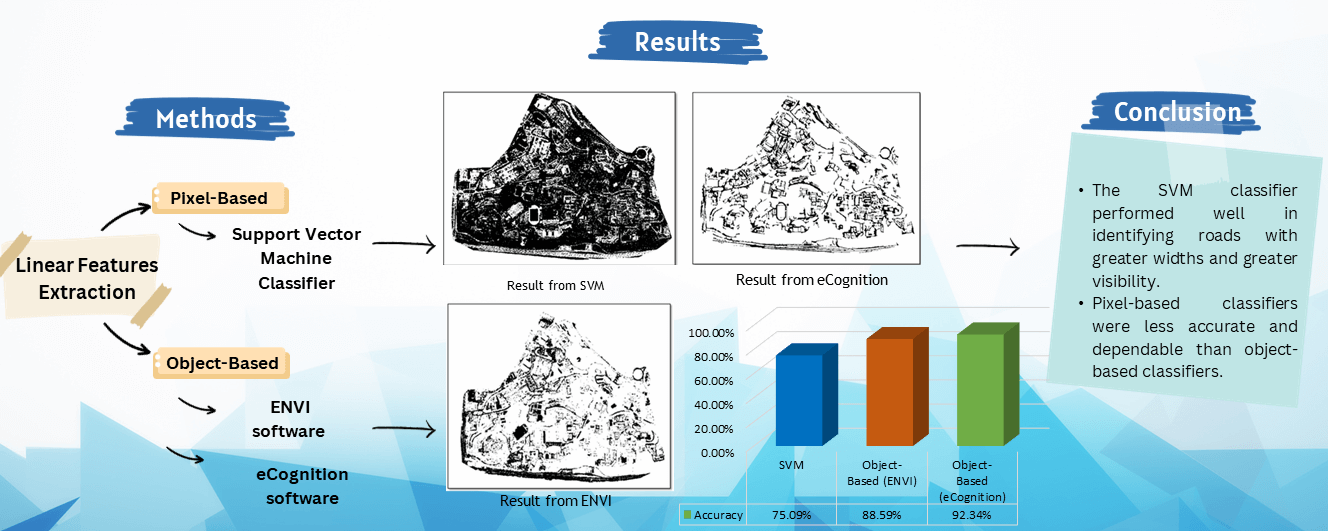
Using WV-2 imagery for linear extraction, pixel-based object-based image classifications were performed in two different software programmes. Before performing an accuracy assessment, visual interpretation and a close examination of the maps are required to qualitatively evaluate the techniques of the applied methods. The outcome demonstrated that distinct classifiers yield distinct outcomes (refer to Fig. 4). It was difficult to extract fine-scale features using either a pixel-based approach or object-based classification. Despite the availability of VHR imagery as a sufficient source of data for urban areas, the similar spectral information of urban materials makes it difficult to extract information and produce land use/land cover maps. For instance, the spectral information of roads and buildings is similar. The result of fusing images using the Gram-Schmidt (GS) technique to evaluate spatial and spectral resolutions visually. In comparison to the original images, the spatial and spectral resolutions of the following images are enhanced. The fused images contain both the structural details of the panchromatic image’s higher spatial resolution and the rich spectral information of the multispectral image. Due to the low resolution of the original multispectral image of Worldview-2, it is extremely difficult to identify and classify features. The GS method is the most effective in terms of colour preservation. GS fusion has the closest spectral characteristics to the original multispectral image as well as the highest spatial resolution for enhancing linear features.
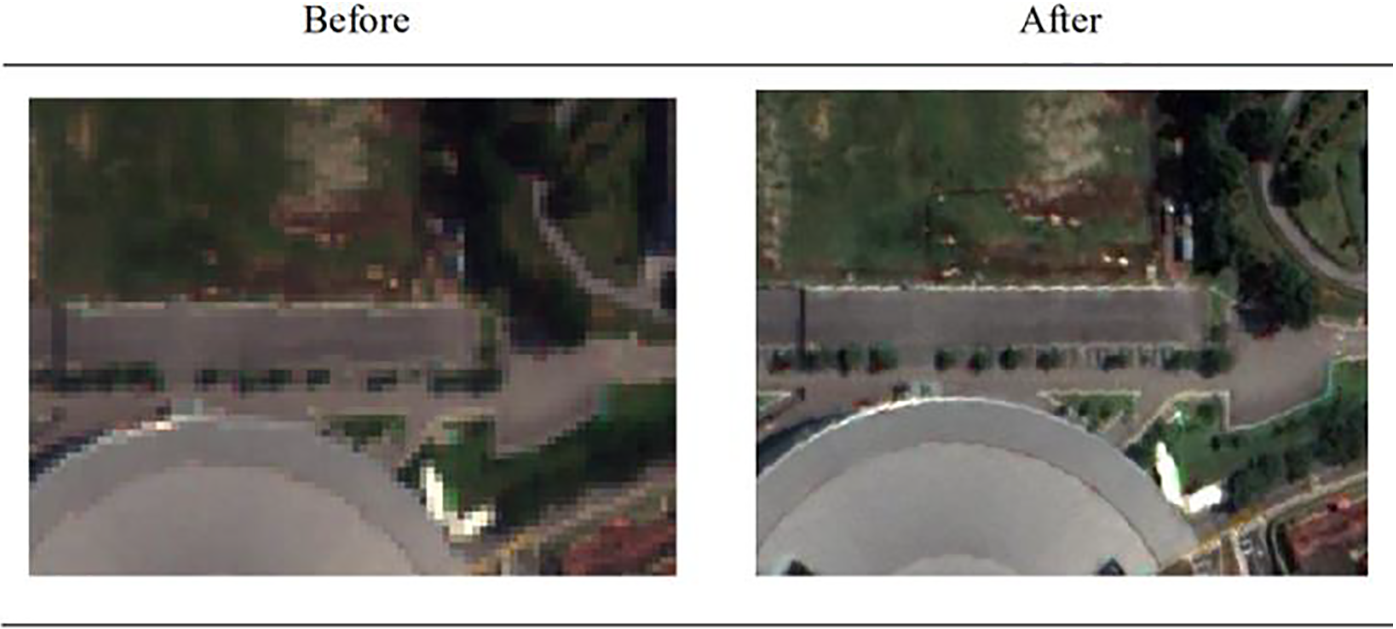
Figure 4: Image fusion
3.2 The Evaluation of Using Machine Learning and Object-Based Techniques Using WV-2: Pixel-Based Classification (SVM)
Classification based on pixels can classify images faster than classification based on objects. Attempts were made to choose a sufficient number of training objects for this classification. It is essential to note that supervised pixel-based classification will perform poorly with a large number of training samples. The results demonstrate that the final classification is highly fragmented, particularly for high spatial-resolution images. As depicted in Fig. 5 below, many pixels are misclassified linear features as non-linear due to the ignorance of fine spatial and textural features, resulting in an image with an unacceptable classification.
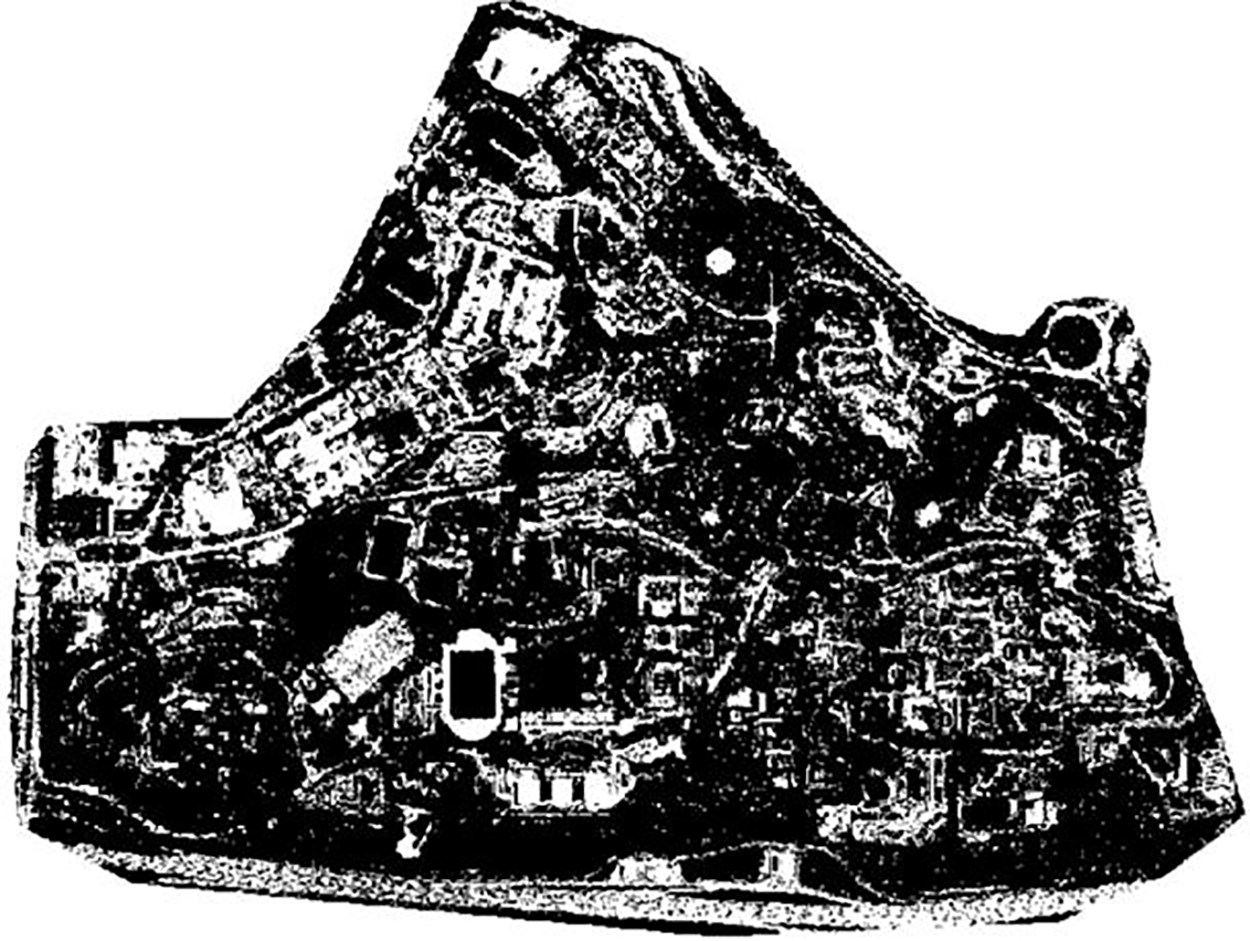
Figure 5: SVM results
3.3 The Evaluation of Using Machine Learning and Object-Based Techniques Using WV-2: Object-Based Classification (OBC) ENVI
ENVI segmentation was adaptable enough to accommodate the range of object values and could potentially distinguish between road and building features. Some of the linear features were nicely delineated, as depicted in Fig. 5, but the shadows affect the segmentation in cases where their intensities are similar. There were also some unwanted objects, such as grass and shadows, whose spectral values resembled those of manmade objects. To determine the behavior of the scale parameter, values between 20, 40, and 60 were varied, while the merge level 90 compactness was held constant at 0.5 for all parameter combinations (refer to Fig. 6). It was observed that as segment size increases, distinguishing the textural properties of land use/cover features becomes easier, whereas it is quite challenging for linear features. To extract linear features. It is evident that segments in subfigures for scale level 40 are more distinct. In order to prevent over-segmentation, merging objects was employed to improve the delineation of feature boundaries. Fig. 7 illustrates the influence of scale parameters, segmentation outcomes, and OBC.
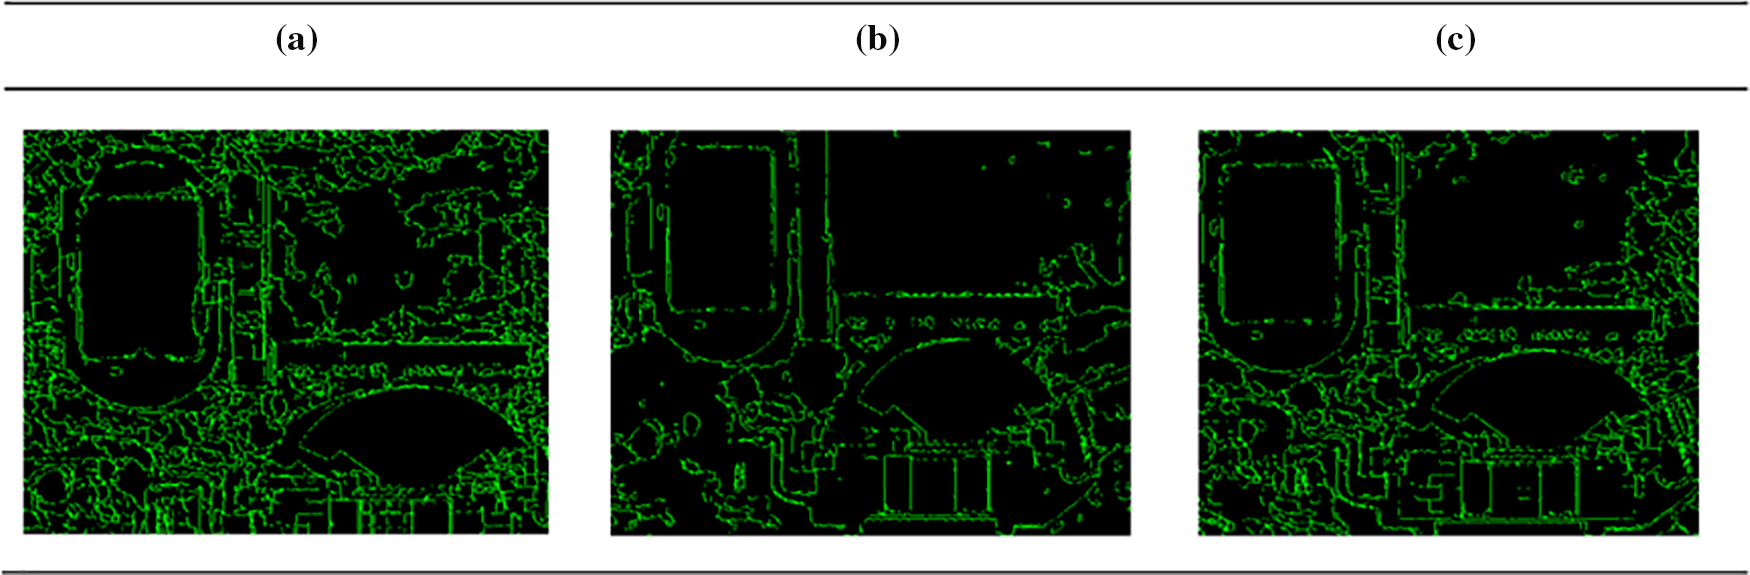
Figure 6: Effect of scale parameter on image objects (a) 20, (b) 40 and (c) 60
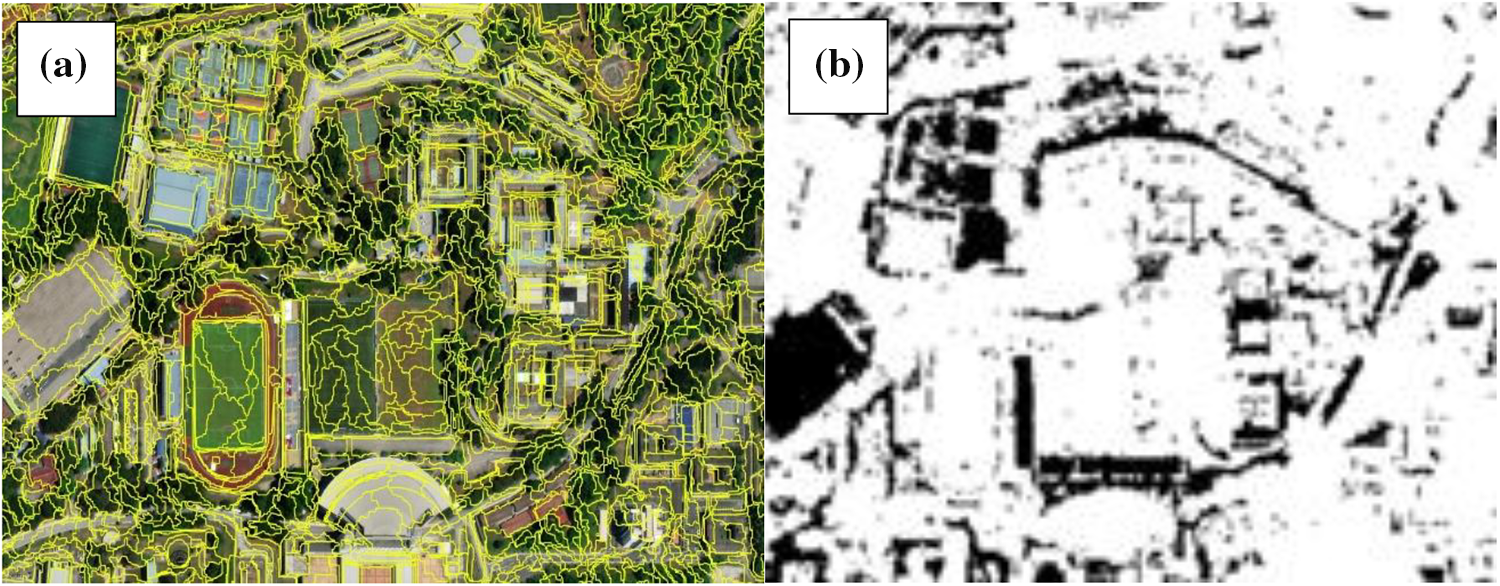
Figure 7: (a) Image segmentation ENVI, (b) Object based classification ENVI
In this work, the rule-sets of object based classification were generated by using spatial, spectral, and textural properties. As mentioned in the method section, the classification was carried out by using threshold as a rule to extract linear features and the properties like spectral, textural and geometrical information obtained from the segments and merge setting. The image shows the result of classification in Fig. 7. Two categories of classification were represented in black colour (linear features) and white color (Non Linear Features). There are some objects that are misclassified because of their similarities of spectral values to other objects. Hence, the detection of linear features, such as small roads, road dividers, sidewalks and the edge of the building were challenging and difficult due to spectral similarities of other man-made features and confusion among their surface materials.
3.4 The Evaluation of Using Machine Learning and Object-Based Techniques Using WV-2: Object-Based Classification in e-Cognition
Urban surface material characterization is a challenging task, mainly due to spectral and spatial diversities of urban surface materials. The classification result (Fig. 8) using e-Cognition software object-based classification of WV-2 imagery effectively extracts the linear features with a minimum range of buildings. Fig. 8 shows the better discrimination of impervious surfaces compared to ENVI and pixel-based SVM. It also shows that the classification have a minimum visual of misclassified objects as well as salt and pepper effects. Moreover, NDVI was employed to exclude vegetation in order to accurately extract features, resulting in a highly representative output map. While the boundaries of the linear features may not be highly defined, the buildings and plants are distinctly divided.

Figure 8: (a) Segmentation with scale of 70, (b) Object based classification of e-Cognition
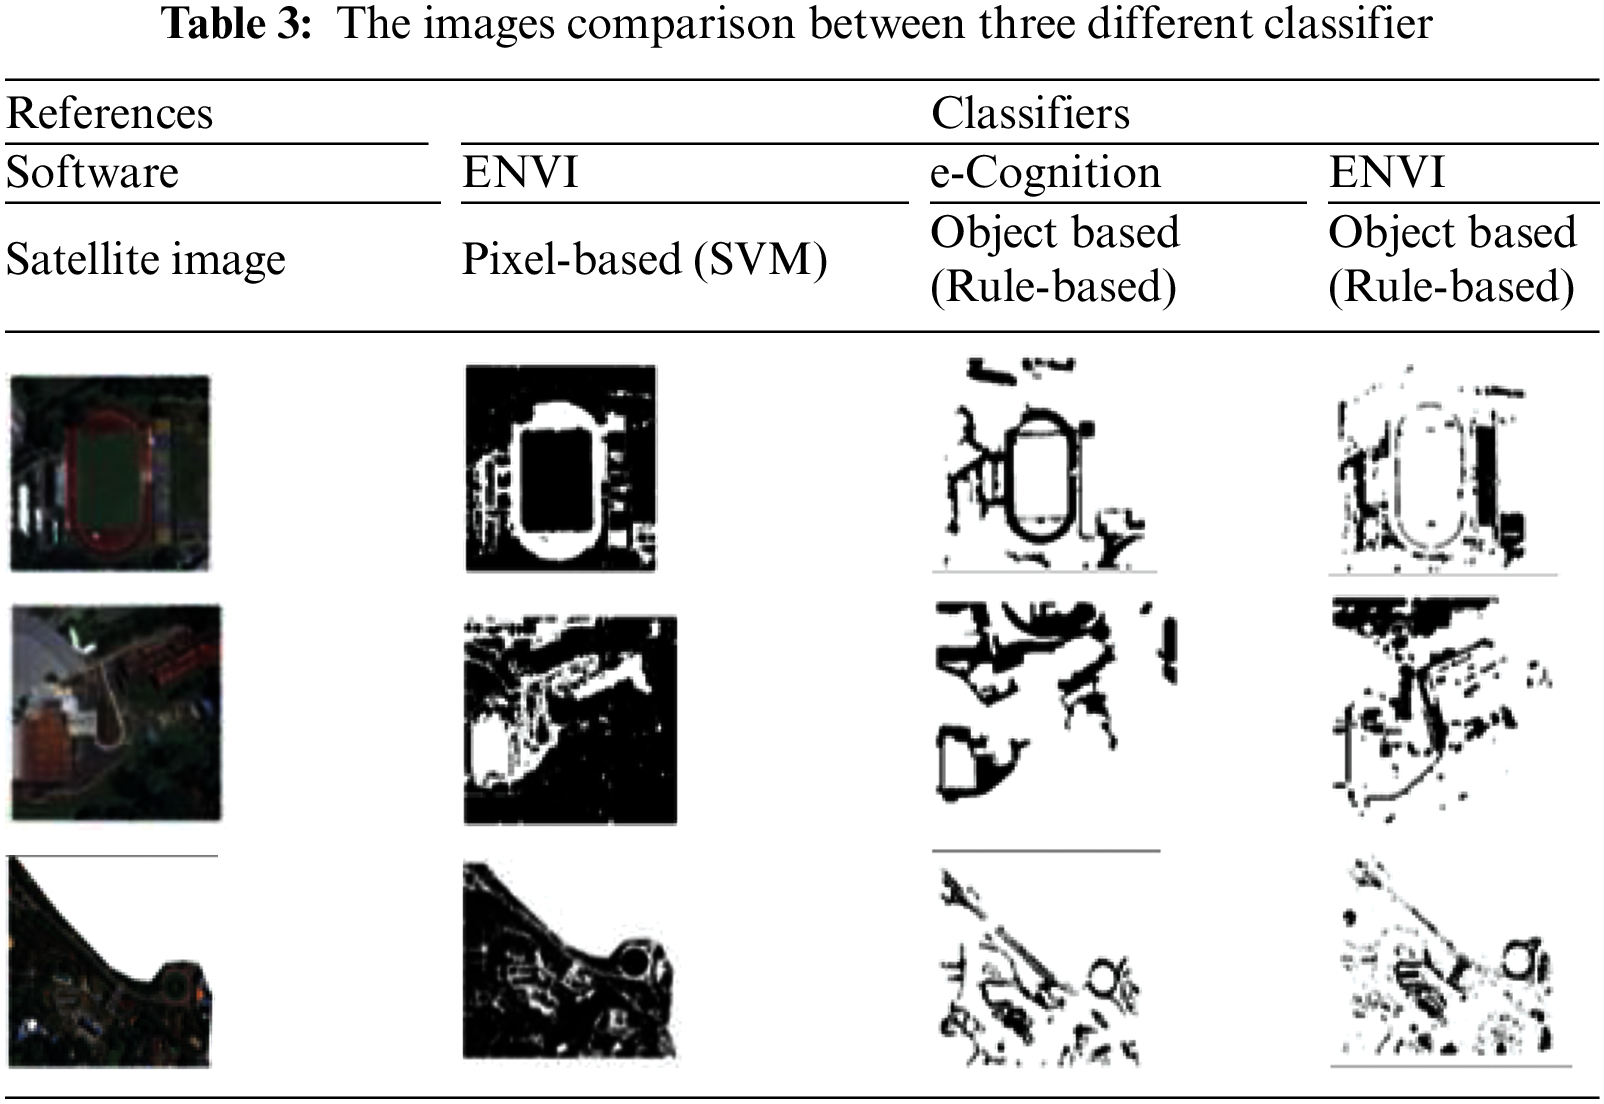
4.1 The Visual Comparison of the Best Performance Classification Method Based on Analyses
Based on the findings presented in Table 3, it is evident that the object-based classification approach yields more informative candidate features, including shape characteristics and mean differences to neighboring objects. These features play a crucial role in effectively differentiating linear features. In contrast, pixel-based methods face challenges in distinguishing between buildings and roads due to their spectral similarity, as observed from the aforementioned results. The object-based method, however, overcomes this limitation by segmenting the images based on specific parameters that influence the spectral similarity among pixels. Subsequently, the images are classified based on the extracted features obtained from the segmented objects. Upon comparing the classification outputs of the three methods, it becomes apparent that the ruled-based classification in ENVI produces smoother segments for linear features such as lines, dividers, and building edges. Conversely, the object classifier in e-Cognition exhibits superior performance in extracting road and sidewalk features. The classification results generated by these methods exhibit enhanced smoothness and are nearly ready for linear feature extraction.
For accuracy assessment purposes, the selection of ground truth pixels was done by random sampling method by using ground truth from lidar data of UiTM Shah Alam. Accuracy analysis was carried out by comparing the classified pixels with ground truth pixels using a confusion matrix. The evaluation of several classifiers’ performance and consistency, as well as the disparities between user and producer accurateness of classes in each approach as shown in Table 4.

This information that is represented in Table 4 was from the evaluation of the maps generated by the classification process. The overall accuracy of pixel based (SVM) was 75.01% which it shows the misclassification for the roads and buildings hence gave the salt and pepper effects confirm the incapability of SVM to use for extracting linear information. Overall accuracy and Kappa coefficient acquired using rule-based in ENVI and e-Cognition software were 88% and 92%, which were acceptable in terms of classification standards. More balanced user and producer accuracy showed the consistency of the rule-based classifier. The roads and buildings as well as vegetation and shadow could be correctly detected by the algorithms. However, some small roads and shadows show some misclassifications where it was mostly due to the distribution of the trees that blocks most of the small roads as well as the shadows and trees around buildings. Object-based in e-Cognition classifier identifies all the training pixels more accurately than others with satisfactory performance indices, hence the overall accuracy had achieved a good result.
In conclusion, this study employed e-Cognition and ENVI software to conduct a comprehensive visual and statistical evaluation of various classification approaches, building on previous research in the field. The findings demonstrate that the pixel-based approach outperformed the object-based approach in terms of stability and robustness when classifying homogeneous areas, particularly manmade features. The object-based approach, on the other hand, proved to be more effective for classifying linear features characterized by mixed pixels, such as buildings and shadows. The study demonstrated the efficacy of Support Vector Machine (SVM) approaches as a simple supervised classification method for remote sensing data. It was discovered that SVM was more accurate than popular techniques such as neural network classifiers [32,33]. SVM was found to be suitable for both pixel-based and object-based classification, providing the ability to make soft classifications that result in more accurate outputs, particularly when mixed pixels are present. Among the tested classifiers, the object-based approach utilizing the e-Cognition software demonstrated superior performance in identifying training pixels and classifying linear features consistently. The SVM classifier performed well in identifying roads with greater widths and greater visibility. Nonetheless, the results demonstrated that pixel-based classifiers were less accurate and dependable than object-based classifiers. The results demonstrated the effectiveness and visual precision of object-based classification using e-Cognition software. This method exhibited a number of benefits, such as less subjective parameter optimization, relatively less computational time, more cohesive classes within the image, and a decreased need for post-classification filtering. On the basis of this dataset, the object-based classification implemented in e-Cognition emerges as the most appropriate classification method. It provides greater object continuity by means of enhanced merging capabilities, less subjective parameter optimization, enhanced computational efficiency, cohesive class representation, and decreased reliance on post-classification filtering.
Acknowledgement: The authors would like to gratefully acknowledge financial support from the Universiti Teknologi MARA (UiTM) under the 600-TNCPI 5/3/DDN (10) (003/2023) Internal Grant, and to Central Bicol State University of Agriculture of Philippines and Artvin Coruh University of Turkey for enabling this research to be carried out. The WorldView 2 data are available from the U.S. Geological Survey (USGS).
Funding Statement: The authors would like to gratefully acknowledge financial support from the Universiti Teknologi MARA (UiTM) under the 600-TNCPI 5/3/DDN (10) (003/2023) Internal Grant.
Author Contributions: Siti Aekbal Salleh is responsible for the general design and conceptualization of the study, as well as overseeing the research student and paper development. Nafisah Khalid oversees developing the methodology and technical approach for the study. Natasha Danny assists in the data processing and experimenting of the project, specifically in generating maps and producing outcomes. Nurul Ain Mohd. Zaki is responsible for providing guidance on data processing, interpreting outcomes, and doing analysis. Mustafa Ustuner is a highly skilled professional with expertise in the methodological framework, data exploration, and machine learning. Zulkiflee Abd Latif is a distinguished professor who provides guidance on the organization and coherence of manuscripts, as well as the assessment of their technical relevance and accuracy. Vladimir Foronda is a senior professor responsible for supervising the discussion, prospective application, and future suggestion of the study.
Availability of Data and Materials: The data that support the findings of this study are available from the corresponding author, Siti Aekbal Salleh, upon reasonable request.
Conflicts of Interest: The authors declare that they have no conflicts of interest to report regarding the present study.
References
1. Sishodia RP, Ray RL, Singh SK. Applications of remote sensing in precision agriculture: a review. Remote Sens. 2020 Sep;12(19):3136. doi:10.3390/rs12193136. [Google Scholar] [CrossRef]
2. Mather P, Tso B. Classification methods for remotely sensed data. 2nd ed. UK: CRC Press; 2019. doi:10.1201/9781420090741. [Google Scholar] [CrossRef]
3. Huang C, Davis LS, Townshend JRG. An assessment of support vector machines for land cover classification. Int J Remote Sens. 2002;23(4):725–49. doi:10.1080/01431160110040323. [Google Scholar] [CrossRef]
4. Xu T, Feng Z H, Wu X J, Kittler J. Learning adaptive discriminative correlation filters via temporal consistency preserving spatial feature selection for robust visual object tracking. IEEE Trans Image Process. 2019 Nov;28(11):5596–609. doi:10.1109/TIP.2019.2919201. [Google Scholar] [PubMed] [CrossRef]
5. Wang Q. Support vector machine algorithm in machine learning. In: 2022 IEEE International Conference on Artificial Intelligence and Computer Applications (ICAICA); 2022; Dalian, China. p. 750–6. doi:10.1109/ICAICA54878.2022.9844516. [Google Scholar] [CrossRef]
6. Pakhale GK, Gupta PK. Comparison of advanced pixel based (ANN and SVM) and object-oriented classification approaches using landsat-7 Etm+ data. Int J Eng Technol. 2010;2(4):245–51. [Google Scholar]
7. Moosavi V, Talebi A, Shirmohammadi B. Producing a landslide inventory map using pixel-based and object-oriented approaches optimized by Taguchi method. Geomorphology. 2013;204:646–56. doi:10.1016/j.geomorph.2013.09.012. [Google Scholar] [CrossRef]
8. Duro DC, Franklin SE, Dubé MG. Remote sensing of environment a comparison of pixel-based and object-based image analysis with selected machine learning algorithms for the classification of agricultural landscapes using SPOT-5 HRG imagery. Remote Sens Environ. 2012;118(3–4):259–72. doi:10.1016/j.rse.2011.11.020. [Google Scholar] [CrossRef]
9. Jonsson L. Evaluation of pixel based and object based classification methods for land cover mapping with high spatial resolution satellite imagery, in the Amazonas, Brazil (Master Thesis). Lund University: Sweden; 2015. [Google Scholar]
10. Qian Y, Zhou W, Yan J, Li W, Han L. Comparing machine learning classifiers for object-based land cover classification using very high resolution imagery. Remote Sens. 2015;7(1):153–68. doi:10.3390/rs70100153. [Google Scholar] [CrossRef]
11. Repaka SR, Truax DD, State M, Kolstad E, Manager C. Comparing spectral and object-based approaches for classification and transportation feature extraction from high resolution multispectral imagery. Eng Environ Sci. 2002. [Google Scholar]
12. Musleh AA, Jaber HS. Comparative analysis of feature extraction and pixel-based classification of high-resolution satellite images using geospatial techniques. E3S Web Conf. 2021;318(1):04007. doi:10.1051/e3sconf/202131804007. [Google Scholar] [CrossRef]
13. Shahi. K, Shafri. HZM, Hamedianfar A. Road condition assessment by OBIA and feature selection techniques using very high-resolution WorldView-2 imagery. Geocarto Int. 2017;32(12):1389–406. doi:10.1080/10106049.2016.1213888. [Google Scholar] [CrossRef]
14. Sibaruddin HI, Shafri HZM, Pradhan B, Haron NA. UAV-based approach to extract topographic and as-built information by utilising the OBIA Technique. J Geosci Geomatics. 2018;6(3):103–23. doi:10.12691/jgg-6-3-2. [Google Scholar] [CrossRef]
15. Amraee S, Chinipardaz M, Charoosaei M. Analytical study of two feature extraction methods in comparison with deep learning methods for classification of small metal objects. Vis Comput Indust Biomed Art. 2022;5(13):34. doi:10.1186/s42492-022-00111-6. [Google Scholar] [PubMed] [CrossRef]
16. Petrovska B, Zdravevski E, Lameski P, Corizzo R, Štajduhar I, Lerga J. Deep learning for feature extraction in remote sensing: a case-study of aerial scene classification. Sensors. 2020;20(14):3906. doi:10.3390/s20143906. [Google Scholar] [PubMed] [CrossRef]
17. Awad M, Khanna R. Support vector machines for classification. In: Efficient learning machines. Berkeley, CA: Apress; 2015. doi:10.1007/978-1-4302-5990-9_3. [Google Scholar] [CrossRef]
18. Sun X, Wang P, Lu W, Zhu Z, Lu X, He Q, et al. RingMo: a remote sensing foundation model with masked image modeling. IEEE Trans Geosci Remote Sens. 2023;61:1–22. [Google Scholar]
19. Gebre AM, Belete MD, Belayneh M. Object-based image analysis (OBIA)-based gully erosion dynamics, sediment loading rate and sediment yield study in Lake Hawassa Sub-basin, Ethiopia. Nat Resour Model. 2023;36(3):e12368. [Google Scholar]
20. Guyon I, Weston J, Barnhill S, Vapnik V. Gene selection for cancer classification using support vector machines. Mach Learn. 2002;46:389–422. doi:10.1023/A:1012487302797. [Google Scholar] [CrossRef]
21. Vi C, Vi WG. Combining pixel-based and object-oriented support vector machines using bayesian probability theory. 2014;II-7:67–74. doi:10.5194/isprsannals-II-7-67-2014. [Google Scholar] [CrossRef]
22. Li X, Zhao S, Rui Y, Tang W. An object-based classification approach for high-spatial resolution imagery. In: Geoinformatics 2007: Remotely sensed data and information; 2007. vol. 6752. p. 1–9. doi:10.1117/12.761260. [Google Scholar] [CrossRef]
23. Ustuner M, Sanli FB, Dixon B. Application of support vector machines for landuse classification using high-resolution rapideye images: a sensitivity analysis. Eur J Remote Sens. 2015;48(1):403–22. doi:10.5721/EuJRS20154823. [Google Scholar] [CrossRef]
24. Lu D, Weng Q. A survey of image classification methods and techniques for improving classification performance. Int J Remote Sens. 2007;28(5):823–70. doi:10.1080/01431160600746456. [Google Scholar] [CrossRef]
25. Liu X, Pedersen M, and Wang R. Survey of natural image enhancement techniques: Classification, evaluation, challenges, and perspectives. Digit Signal Process. 2022;127:103547. doi:10.1016/j.dsp.2022.103547. [Google Scholar] [CrossRef]
26. Yan Y, Huaye H. A classification technique for english teaching resources and merging using swarm intelligence algorithm. Mobile Inf Sys. 2022;2022(2):2735412. doi:10.1155/2022/2735412. [Google Scholar] [CrossRef]
27. Ramezan CA, Warner TA, Maxwell AE. Evaluation of sampling and cross-validation tuning strategies for regional-scale machine learning classification. Remote Sens. 2019 Jan;11(2):185. doi:10.3390/rs11020185. [Google Scholar] [CrossRef]
28. Nobrega RAA, O’Hara CG, Quintanilha JA. An object-based approach to detect road features for informal settlements near Sao Paulo, Brazil. Object-Based Image Analysis. 2008;589–607. doi:10.1007/978-3-540-77058-9_32. [Google Scholar] [CrossRef]
29. Cihlar J, Xiao Q, Chen J, Beaubien J, Fung K, Latifovic R. Classification by progressive generalization: a new automated methodology for remote sensing multispectral data. Int J Remote Sens. 1998;19:2685–2704. [Google Scholar]
30. Gu J, Congalton RG, Pan Y. The impact of positional errors on soft classification accuracy assessment: a simulation analysis. Remote Sens. 2015;7(1):579–99. doi:10.3390/rs70100579. [Google Scholar] [CrossRef]
31. Maxwell E, Warner TA. Thematic classification accuracy assessment with inherently uncertain boundaries: an argument for center-weighted accuracy assessment metrics. Remote Sens. 2020 Jun;12(12):1905. doi:10.3390/rs12121905. [Google Scholar] [CrossRef]
32. Tehrany MS, Pradhan B, Jebur MN. Spatial prediction of flood susceptible areas using rule-based decision tree (DT) and a novel ensemble bivariate and multivariate statistical models in GIS. J Hydrol. 2013;504:69–79. [Google Scholar]
33. Nik Effendi NAF, Mohd Zaki NA, Abd Latif Z, Suratman MN, Bohari SN, Zainal MZ, et al. Unlocking the potential of hyperspectral and LiDAR for above-ground biomass (AGB) and tree species classification in tropical forests. Geocarto Int. 2021;42:1–26. [Google Scholar]
Cite This Article
 Copyright © 2024 The Author(s). Published by Tech Science Press.
This work is licensed under a Creative Commons Attribution 4.0 International License , which permits unrestricted use, distribution, and reproduction in any medium, provided the original work is properly cited.
 Downloads
 Citation Tools