
 Submit a Paper
 Propose a Special lssue
 Open Access
ARTICLE

Lineament Mapping in Batie Area (West-Cameroon) Using Landsat-9 Operational Land Imager/Thermal Infrared Sensor and Shuttle Radar Topography Mission Data: Hydrogeological Implication
1 Department of Basic Training, Higher Technical Teachers’ Training College (ENSET), University of Douala, Douala, Cameroon
2 Department of Textile and Clothing Industries, Higher Technical Teachers’ Training College (ENSET), University of Douala, Douala, Cameroon
3 Department of Physics, Advanced Teacher’s Training College (ENS), University of Maroua, Maroua, Cameroon
4 Department of Land Surveying, National Advanced School of Public Works (NASPW), Yaoundé, Cameroon
5 Environmental Engineering Department, National Advanced School of Public Works (NASPW), Yaoundé, Cameroon
6 Department of Physics, Faculty of Sciences, University of Yaoundé I, Yaoundé, Cameroon
7 Department of Physics, Advanced Teacher’s Training College (ENS), University of Yaoundé I, Yaoundé, Cameroon
* Corresponding Author: Jean Aime Mono. Email:
Revue Internationale de Géomatique 2024, 33, 135-154. https://doi.org/10.32604/rig.2024.049966
Received 23 January 2024; Accepted 07 April 2024; Issue published 15 May 2024
 View Full Text
 Download PDF
Abstract
This study focuses on the mapping of lineaments using remote sensing techniques and Geographic Information Systems. The aim is to carry out a statistical analysis of the lineaments in order to better understand the organization of fracturing in the Batie district, and to identify areas of high fracturing density and their relationship with the hydrographic network. The methodology implemented to achieve these objectives is based on the processing and analysis of Landsat 9 Operational Land Imager/Thermal Infrared Sensor (OLI/TIRS) satellite imagery and Shuttle Radar Topography Mission (SRTM) data covering the study area. After essential pre-processing of data, the following processing techniques were applied: Principal Component Analysis, Sobel Directional Filter with a 3 × 3 matrix and shaded relief of SRTM data with a sun azimuth of 345°, altitude of 45 m and an elevation factor of 3, followed by manual lineament extraction. The results reveal a total of 176 lineaments, ranging in size from 0.002 to 2.461 km, with an average length of 840.66 km. The projection of these lineaments on a Rose diagram shows a predominance of the North East–South-West (NE-SW) direction, which is the direction of the major tectonic fractures that affect the basement of Central Africa. These lineaments are organized into networks and corridors that define large fracture zones or corridors that control the drainage of the study area. The zones with networks show medium and high densities. This fracturing density gives good aquifer and reservoir potential to the study area.Keywords
A significant proportion of economic activity relies on the exploitation of underground resources. It is therefore essential to be able to identify and locate these resources. To do this, geologists must rely on visible clues on the earth’s surface. It is an indirect result of deep geological events, often affecting the surface. These effects appear in the form of lineaments. These are described by [1,2] as linear or curved features identifiable at the surface of the crust, reflecting the presence of deeper phenomena such as faults, fractures, and geological contacts. Lineament mapping is of particular importance in mining and petroleum exploration [3,4], tectonic structures [5], and groundwater exploration [6,7]. In the current research, remote sensing techniques were investigated to provide further hydrogeological insights from West Cameroon, namely the groundwater exploration in the study area will benefit from the current research results.
The identification of lineaments from fieldwork is often limited by the difficulty of accessing several sectors of the study area. The main obstacles are usually natural, such as rivers, mountains, and dense forests, not to mention the sheer size of the study area, making this kind of approach costly and time-consuming. Aerial photography proved to be a very useful aid in this difficult task. The wider field of view it offers, combined with stereoscopy and shadow effects, has led to the development of several direct fracture study methods that are described by numerous authors [8,9]. Despite the great advantages offered by aerial photography, the drawback is that it is particularly sensitive to atmospheric conditions and the difficulty of obtaining a synoptic view of the area observed.
The advances in observation satellites have greatly facilitated the cartographer’s work, providing a much more global view of the Earth’s surface. Remote sensing, with its various pre-processing and processing methods, is now recommended as a tool for improving fault network mapping. Its holistic vision makes it possible to study vast geographical areas. This explains why the use of remote sensing data for geological applications has increased in recent years. In lineament mapping, the linear features can be extracted via manual [10–12], automated [11,13,14], or semi-automated procedures [11,15]. Several optical, Radar, and elevation datasets could be applied for extraction lineament, where the high resolution of the used remote sensing product strongly enhances the accuracy of the extracted linear features [16]. The overall signal-to-noise ratio is increased when data is captured using Landsat 8 (Operational Land Imager) OLI, which offers enhanced radiometric precision over a 12-bit dynamic range, which has made Landsat 8 OLI a preferred product for lineament extraction (e.g., [17,18]). The newly launched Landsat 9 data presents enhanced Landsat 8 data with more improved radiometric (14-bit) as well as geometric quality [18].
The cartography of the lineaments in Cameroon is in progress with several projects conducted around mineral wealth potential areas [19]. It is in this context that this study was carried out in Batie, an area located in the West Cameroon region. The rugged terrain and vegetation of western Cameroon make it difficult to carry out field geological and structural studies. Consequently, it is essential to use indirect investigative methods such as remote sensing for lithostructural mapping. For this reason, the present study relies on the use of Geographic Information Systems (GIS) and satellite image processing. Firstly, we will map the lineaments of the Batie zone in western Cameroon using Landsat 9 OLI/Thermal Infrared Sensor (TIRS) and Shuttle Radar Topography Mission (SRTM) images, in order to complete and update the geological map established by conventional techniques. Secondly, we will quantify the directional influence of these lineaments on the hydrographic network.
Batie is a district of the Hauts Plateaux Division in the West region of Cameroon. It lies between latitudes 5°15′ and 5°20′ North and longitudes 10°15′ and 10°20′ East (Fig. 1).
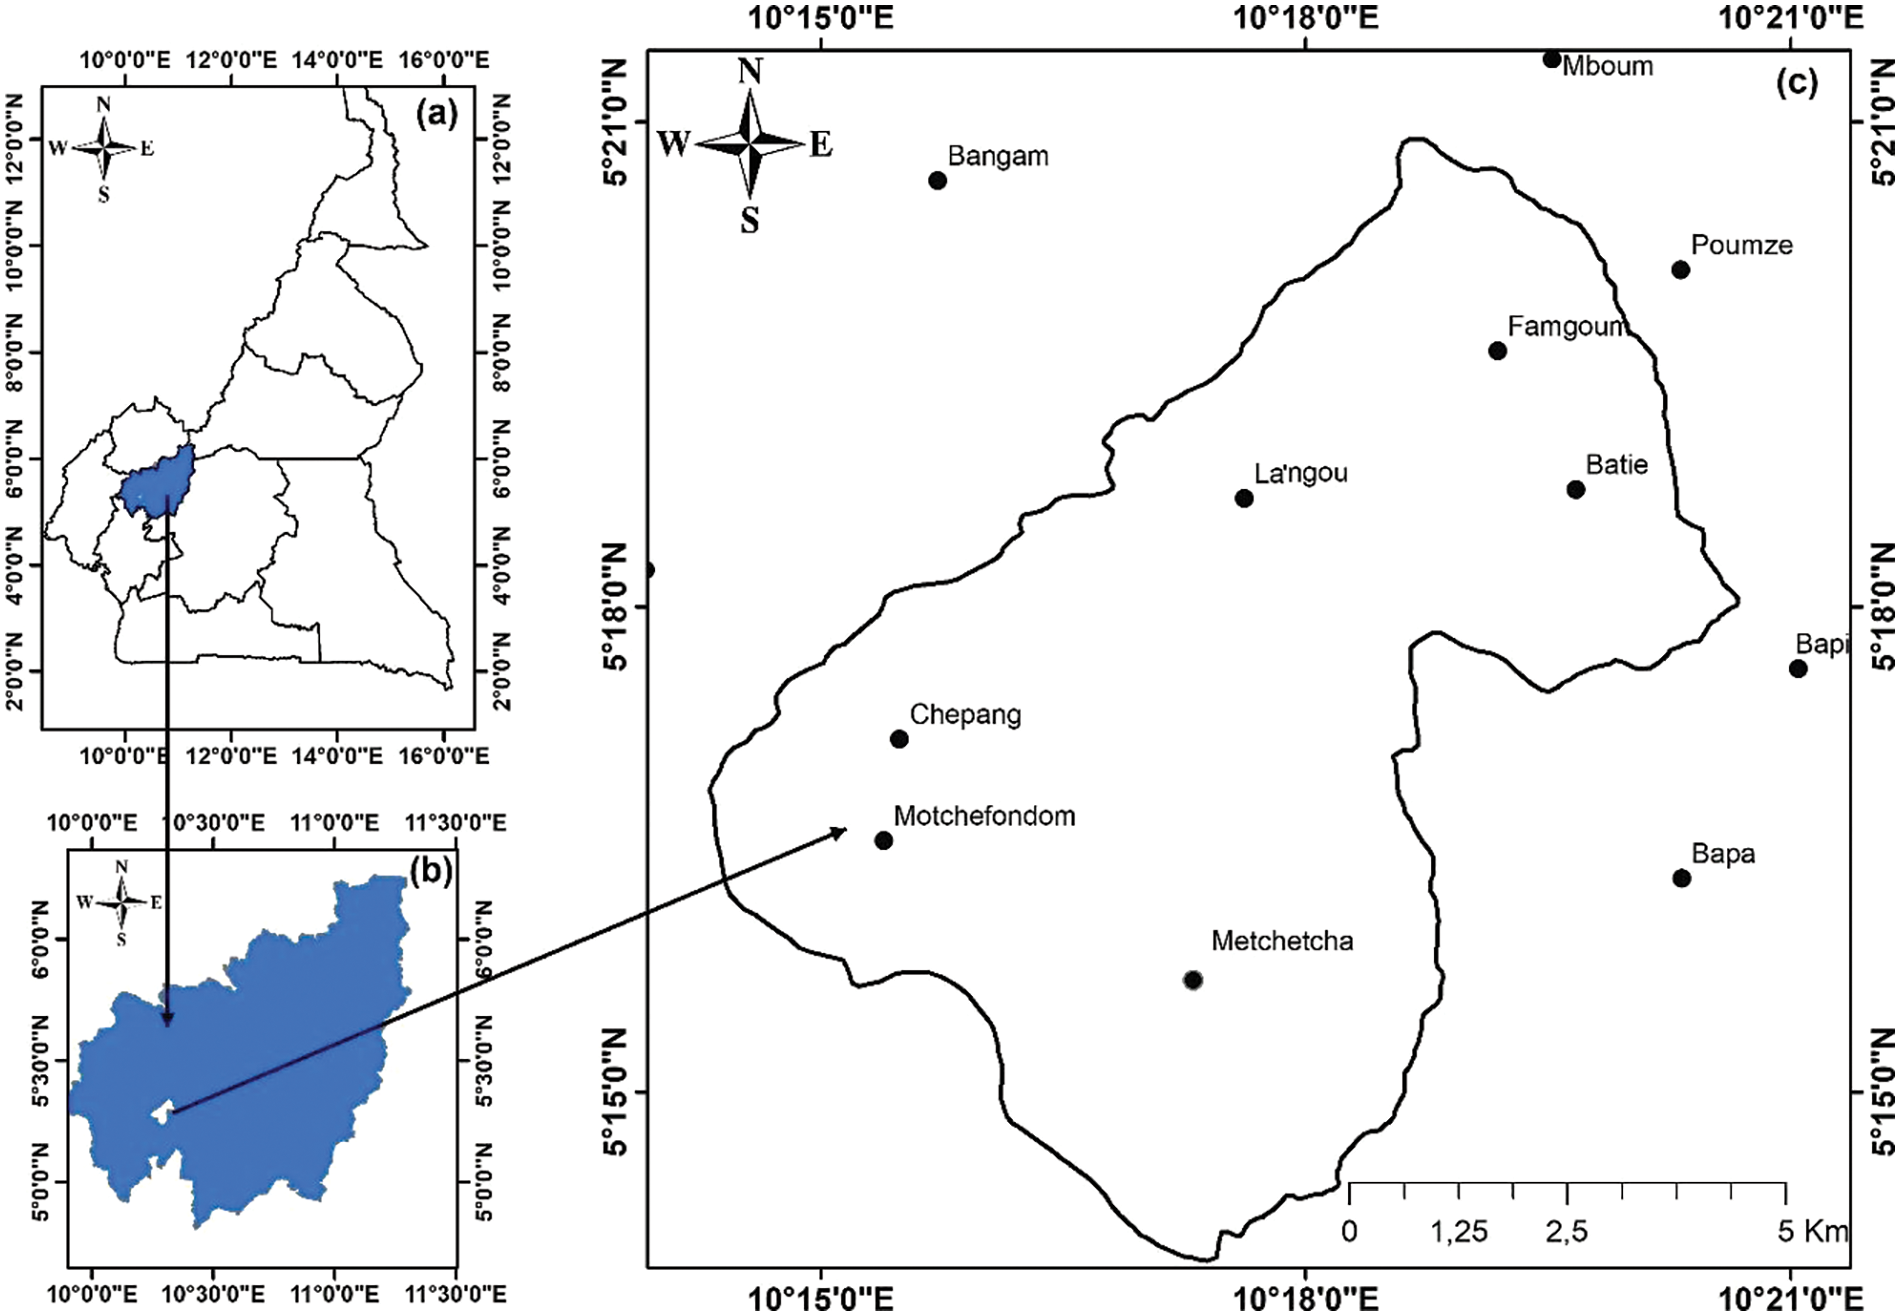
Figure 1: Location of the study area: (a) Cameroon, (b) West region of cameroon, (c) Study area
The morphology of Batie (Fig. 2) is essentially mountainous, dominated by poly-convex hills (half-orange relief) that are more or less contiguous. The average altitude is 1,600 m, with slopes reaching 60%–80%. Batie is composed of three morphological units, depending on altitude [20]. The first is a low-lying valley with an altitude ranging from 1,191 to 1,250 m. The second is a curved band oriented South-East-North-West (SE-NW) then South-West-North-East (SW-NE) with a steep western slope and an altitude ranging from 1,250 to 1,550 m. The third is a series of plateaus extending over the localities of Famgoum, La’agou, Hiala, and Moutchetcha. These plateaus reveal few residual reliefs at altitudes of between 1,600 and 1,784 m.
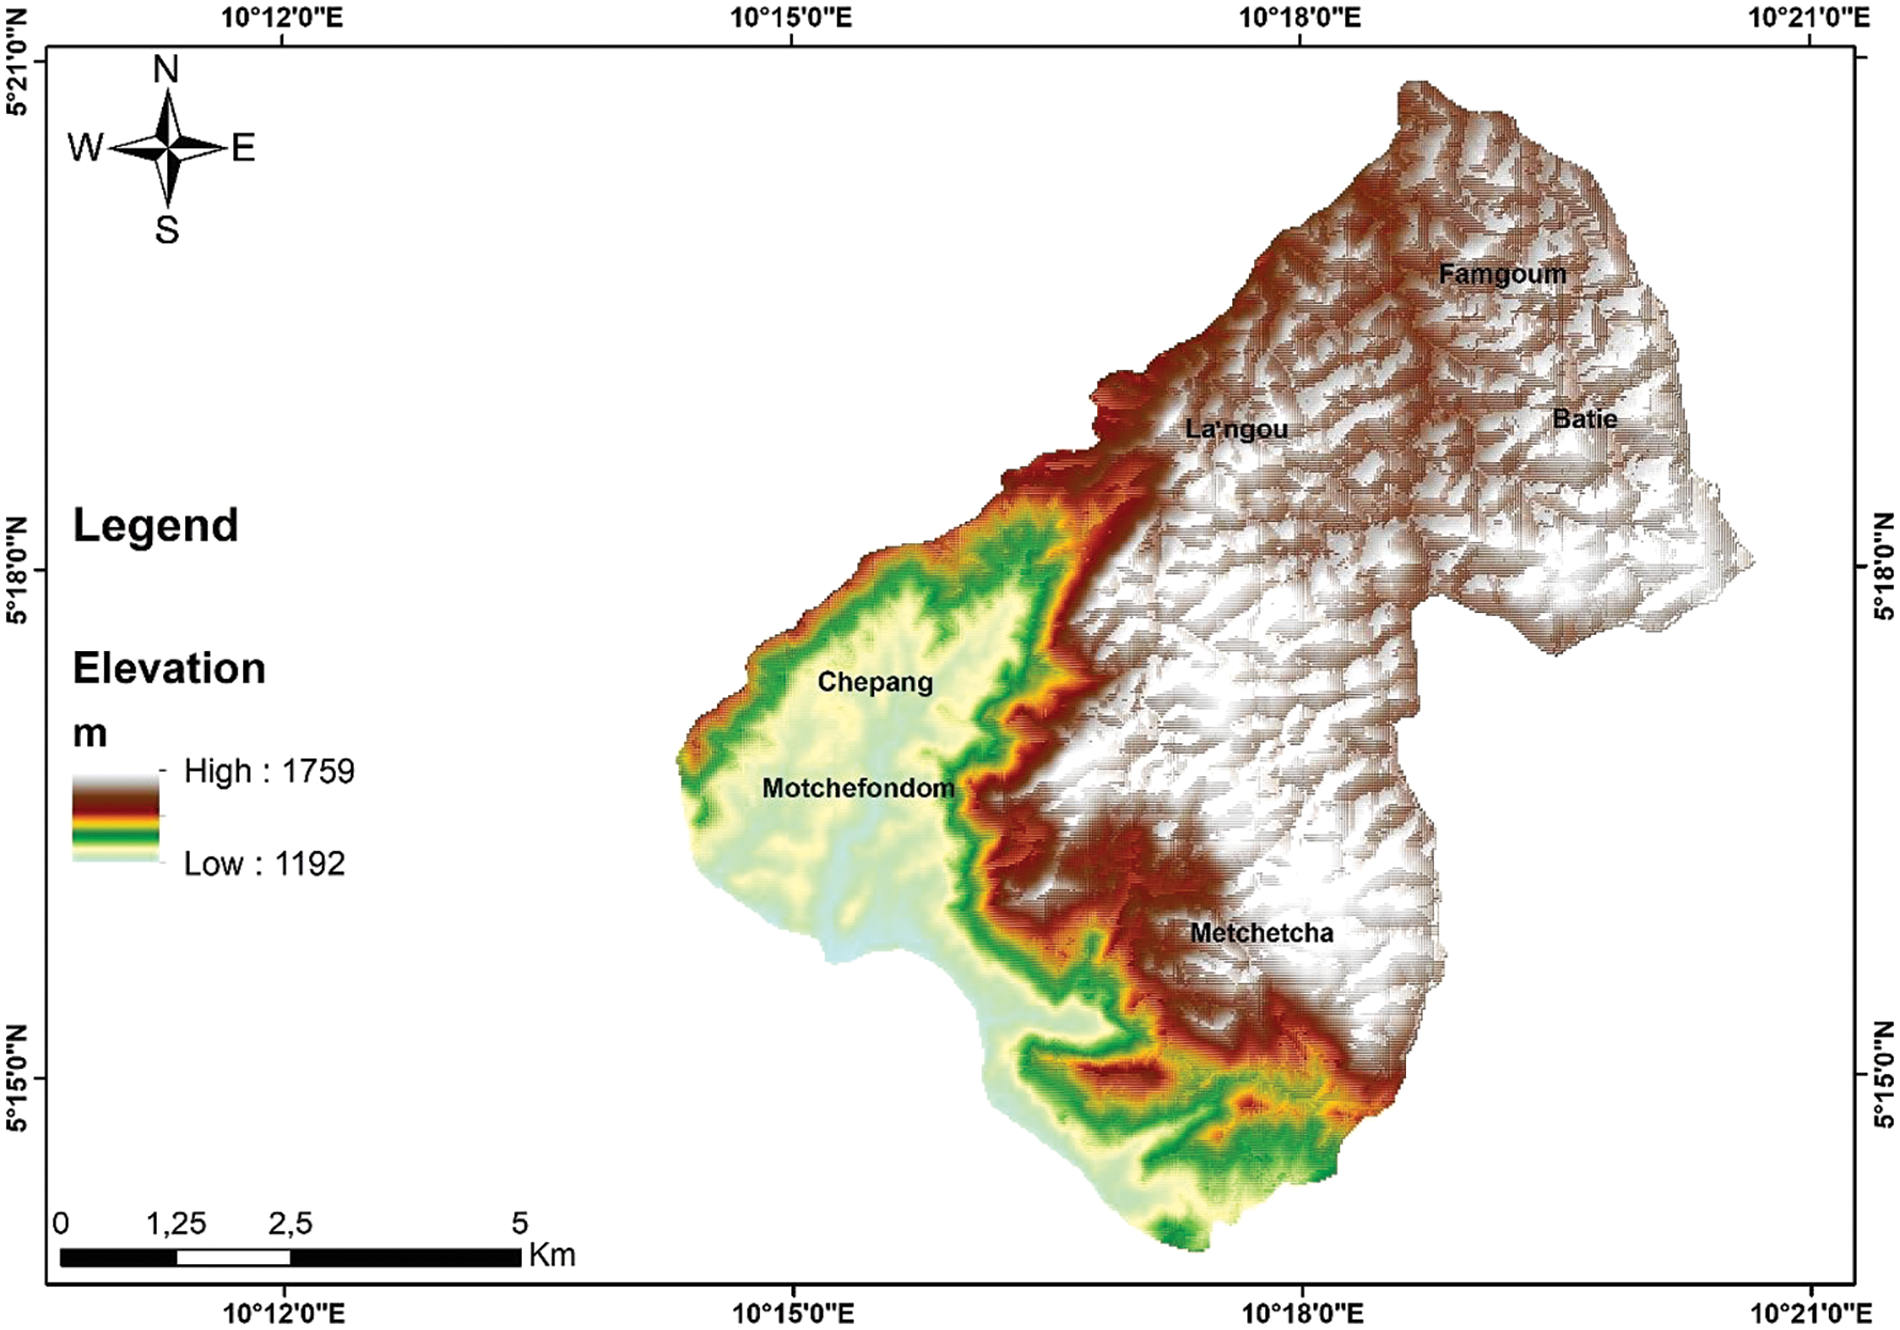
Figure 2: Geomorphology map of the study area
Batie soils are developed on granite-gneissic bedrock. They define the soils found on granite in Africa as leached or slightly evolved tropical ferruginous soils, depending on whether pedogenesis takes place at a more or less accentuated degree of granite alteration. Batie’s vegetation consists of shrub, trees, and grass savannahs. In the valleys, raffia swamp vegetation dominates. On the plateaus and hillsides, the entire area has been subjected to anthropogenic action, mainly agricultural.
Batie is drained by a single main river, the Ngoum, whose tributaries flow in the direction of major regional SW-NE fractures [21]. This hydrographic network is closely linked to lithology and structure; it is dendritic to the west and south, where the crystalline basement outcrops, parallel in the North East (NE) and extreme North West (NW) volcanic covers, and latticed in the mylonitized zone of the Chepang River [21].
Geologically, the West Cameroon region is dominated by a wide variety of petrographic formations (Fig. 3). Batie is located in the southwestern part of Cameroon’s North Equatorial Pan-African chain. This chain is considered as a collision chain comprising a multitude of granitoids, some of which are orthogneissified [22]. The geological formations observed at Batie include granites, more or less deformed granodiorites (mylonites), and basalts (Fig. 4). Talla’s petrostructural and geochemical studies of the Batie granite massif [21] reveal the following:
• Petrographically, the study area is located on a leucocratic granite with a gritty porphyroid texture which is marked by non-contiguous, oriented potassic megafeldspars. It is interspersed with granodiorite enclaves and cut by monzodiorite veins. Minerals such as chlorite and sericite are thought to be alteration products.
• Structurally, the various primary structures are materialized by minerals, veins and enclaves. The main directions of the planar structures are N45°E to the east, N160°E to the west, N50°E and N155°E in the center and NS of the massif. Linear structures converging towards the center of the massif suggest a domed shape, flattened in the center and stretched to the south.
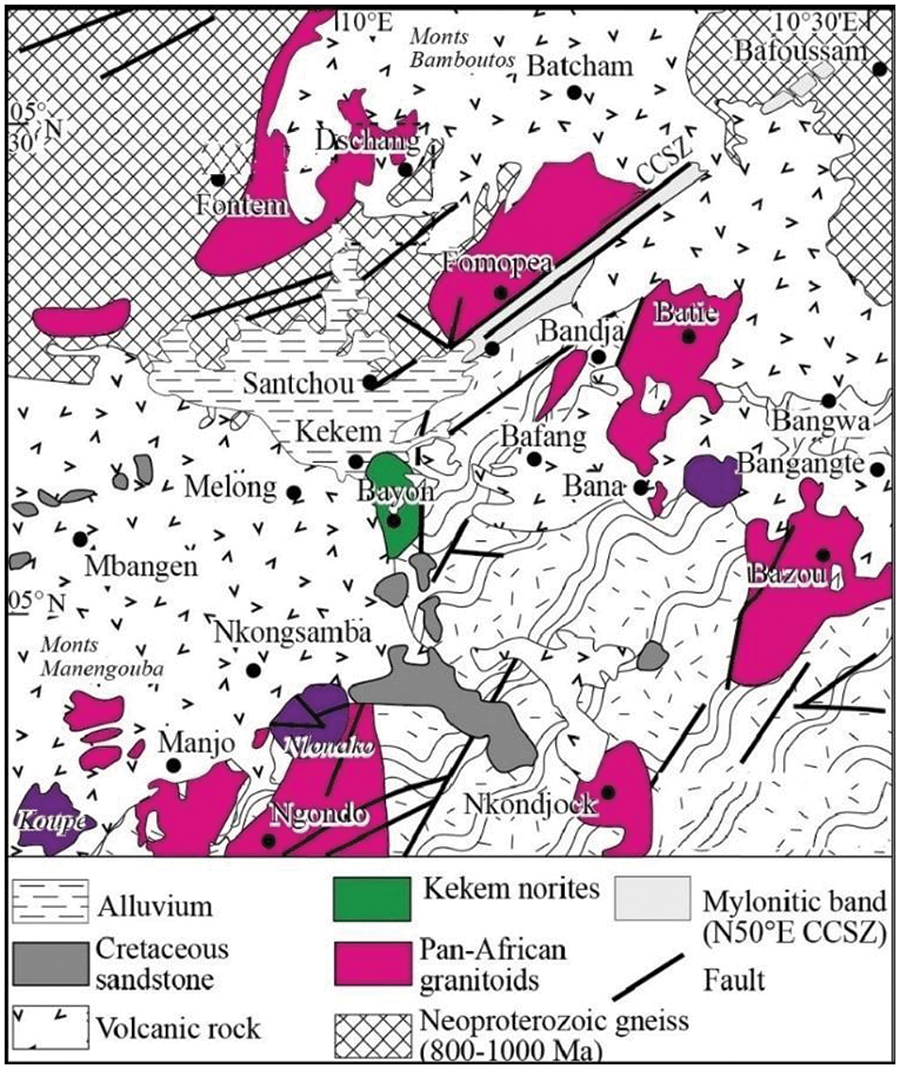
Figure 3: Geological sketch map of the West-Cameroon, showing the locality of the Batie and its neighbouring plutons. Adapted with permission from [23]. Copyright ©2020, FES Publishing
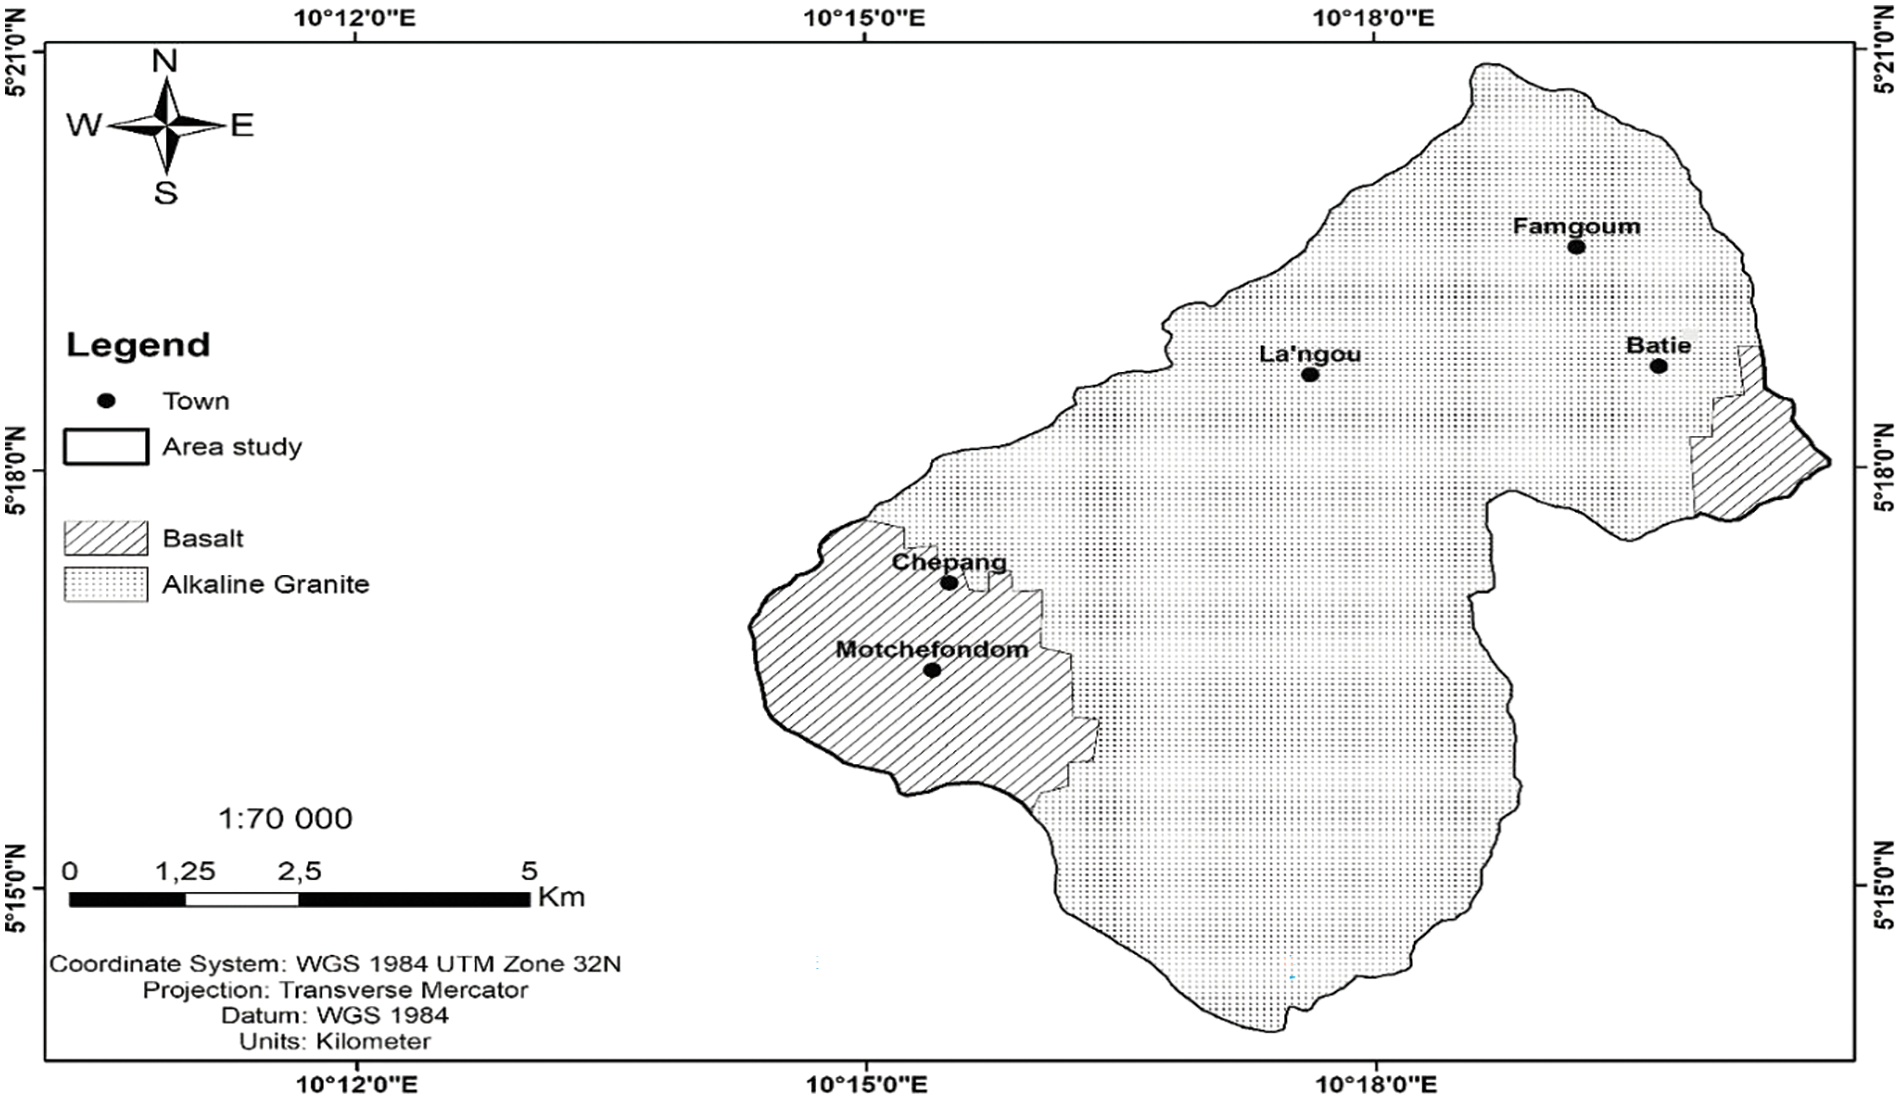
Figure 4: Simplified geological map of the study area. Adapted with permission from [24]. Copyright ©1986, DMGC Publishing
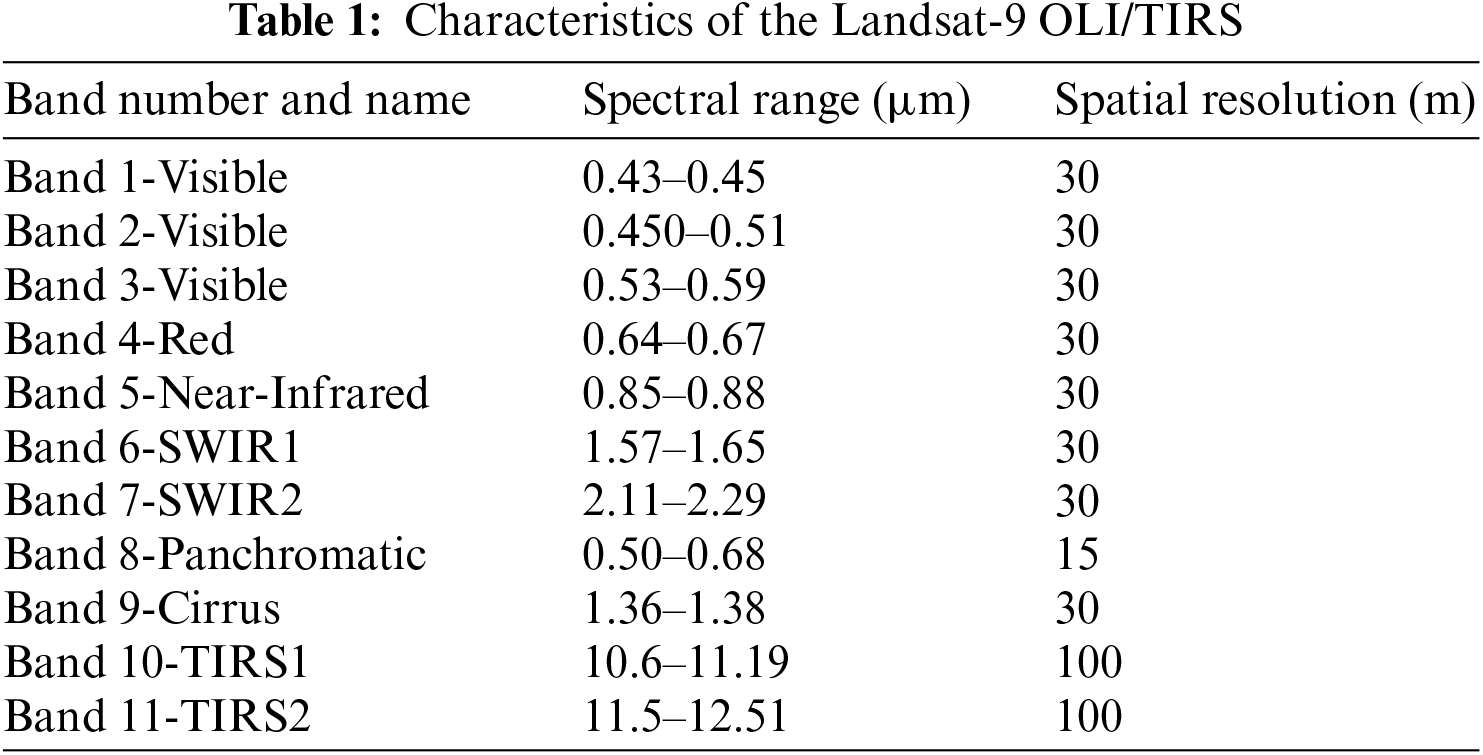
The cartographic database used in this study includes geological maps at 1:500,000 scale [23]. Landsat 9 was successfully launched on 27 September 2021, equipped with OLI-2 and TIRS-2 [25,26]. The OLI and OLI-2 sensors are almost similar and will provide consistent images of the earth’s surface with similar spatial, spectral, geometric, and radiometric qualities. The only difference is the ability of OLI-2 to detect more objects and more precisely because of the higher number of color shades due to better radiometric resolution [18]. An image of the LC09_L2SP_186056_20211213_20220120_02_T1 scene acquired by the OLI-2_TIRS sensor aboard LANDSAT_9 from Path 186 and Row 056. This satellite image was recorded on 13 January, 2021, during the dry season on the NASA website https://earthexplorer.usgs.gov. This period is characterized by an almost complete absence of clouds, which favors good sensor visibility. This satellite image was chosen for its spectral and spatial characteristics, enabling good small-scale structural mapping. The main characteristics of the satellite image used are shown in Table 1. Among the Shuttle Radar Topography Mission (SRTM) images available for free download, we used the SRTM-3 version 2 slab supplied by the USGS in 2004. They are characterized by an absolute altimetric accuracy of 16 m, a spatial resolution of 90 m and a relative accuracy of ±10 m in high relief and ±5 m in low topographic variation. SRTM satellite data were used to generate a digital elevation model (DEM) to facilitate the extraction of lineaments for the study.
These data were processed using ArcGIS 10.3 and Envi 5.1 software. Once the lineaments have been extracted, the various fracture families (in numbers and cumulative lengths) were processed using Rock works 16 software.
The methodological approach adopted for lineament mapping was structured in three successive stages: pre-processing, processing and extraction of lineaments (morphological analysis, etc.).
Image pre-processing is based on the correction of radiometric and geometric alterations received during recording. The satellite image was recorded during the dry season of January 2021. As atmospheric conditions were acceptable (clear skies), no radiometric correction was applied. In order to make the various existing maps superimposable and eliminate distortions, a geometric correction of the image was carried out using the calibration points extracted from the topographic maps.
As far as the Digital Terrain Model (DTM) is concerned, several faults can distort the calculations of products derived from a digital terrain model. This is the case with the presence of depression generally due to measurement aberrations or calculation artefacts (USGS, 2014). So, before extracting morphometric terrain parameters from downloaded raw SRTM images, pre-processing involved correcting identified depressions.
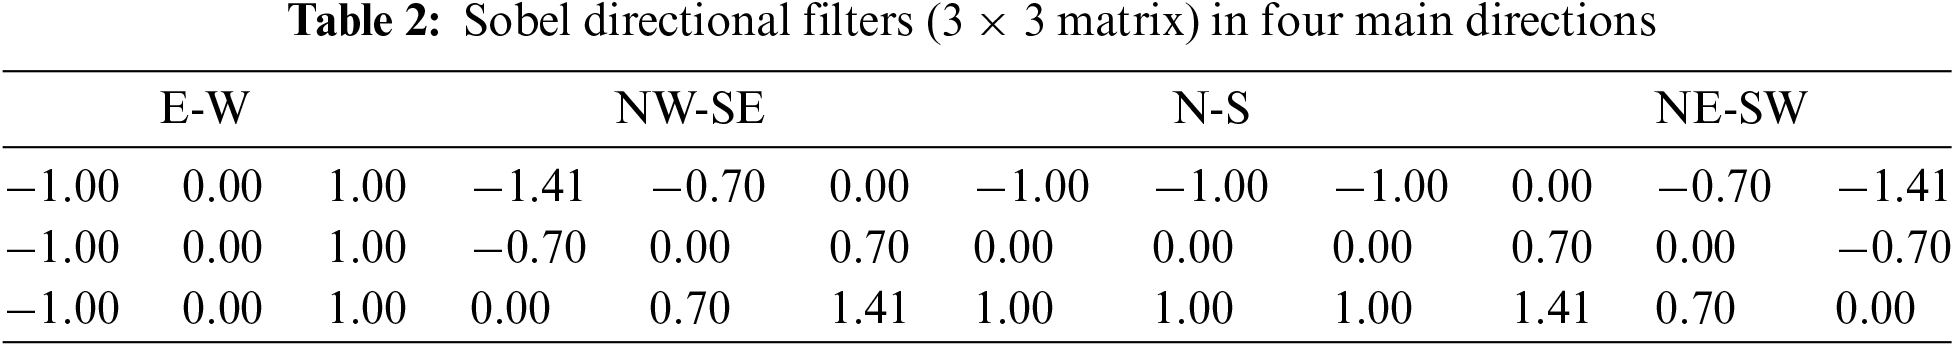
The processing techniques applied to Landsat 9 OLI/TIRS images for lineament extraction are of multiple order. In this study, we first georeferenced the images in the UTM (Universal Transverse Mercator) zone 32 projection system. The second stage involved image enhancement (principal component analysis, directional filtering), aimed at better discrimination of the lineaments to be mapped. These different techniques have already been used in numerous works [27–29]. Principal component analysis is used to enhance images and reduce the number of bands to be processed by compressing the information according to a hierarchy [27]. Principal component analysis was applied on Landsat 9 OLI/TIRS data. The results of the first three principal components, PC1, PC2 and PC3 (Fig. 5), give percentages of 81.93%, 10.44% and 3.26%, respectively. A total of 95.63% of the information. The linear spreading technique was then applied to these neo-channels for contrast enhancement. To maximize lineament extraction in the North-South (N-S); North East-South-West (NE-SW); North West-South East (NW-SE); East-West (E-W) directions, Sobel filters were appliedsssss to the PC images. Directional filters enhance the perception of lineaments by creating an optical shadow effect on the image as if it were illuminated by grazing light [30,31]. This type of filter enhances lineaments that are not favoured by the illumination source, and its size varies according to need. Only lineaments whose size is greater than half the convolution window are detected [32]. In this study, we opted for a convolution window of 3 by 3, which enabled us to detect lineaments as of few meters long. Table 2 shows the Sobel directional filters used in the four main directions.
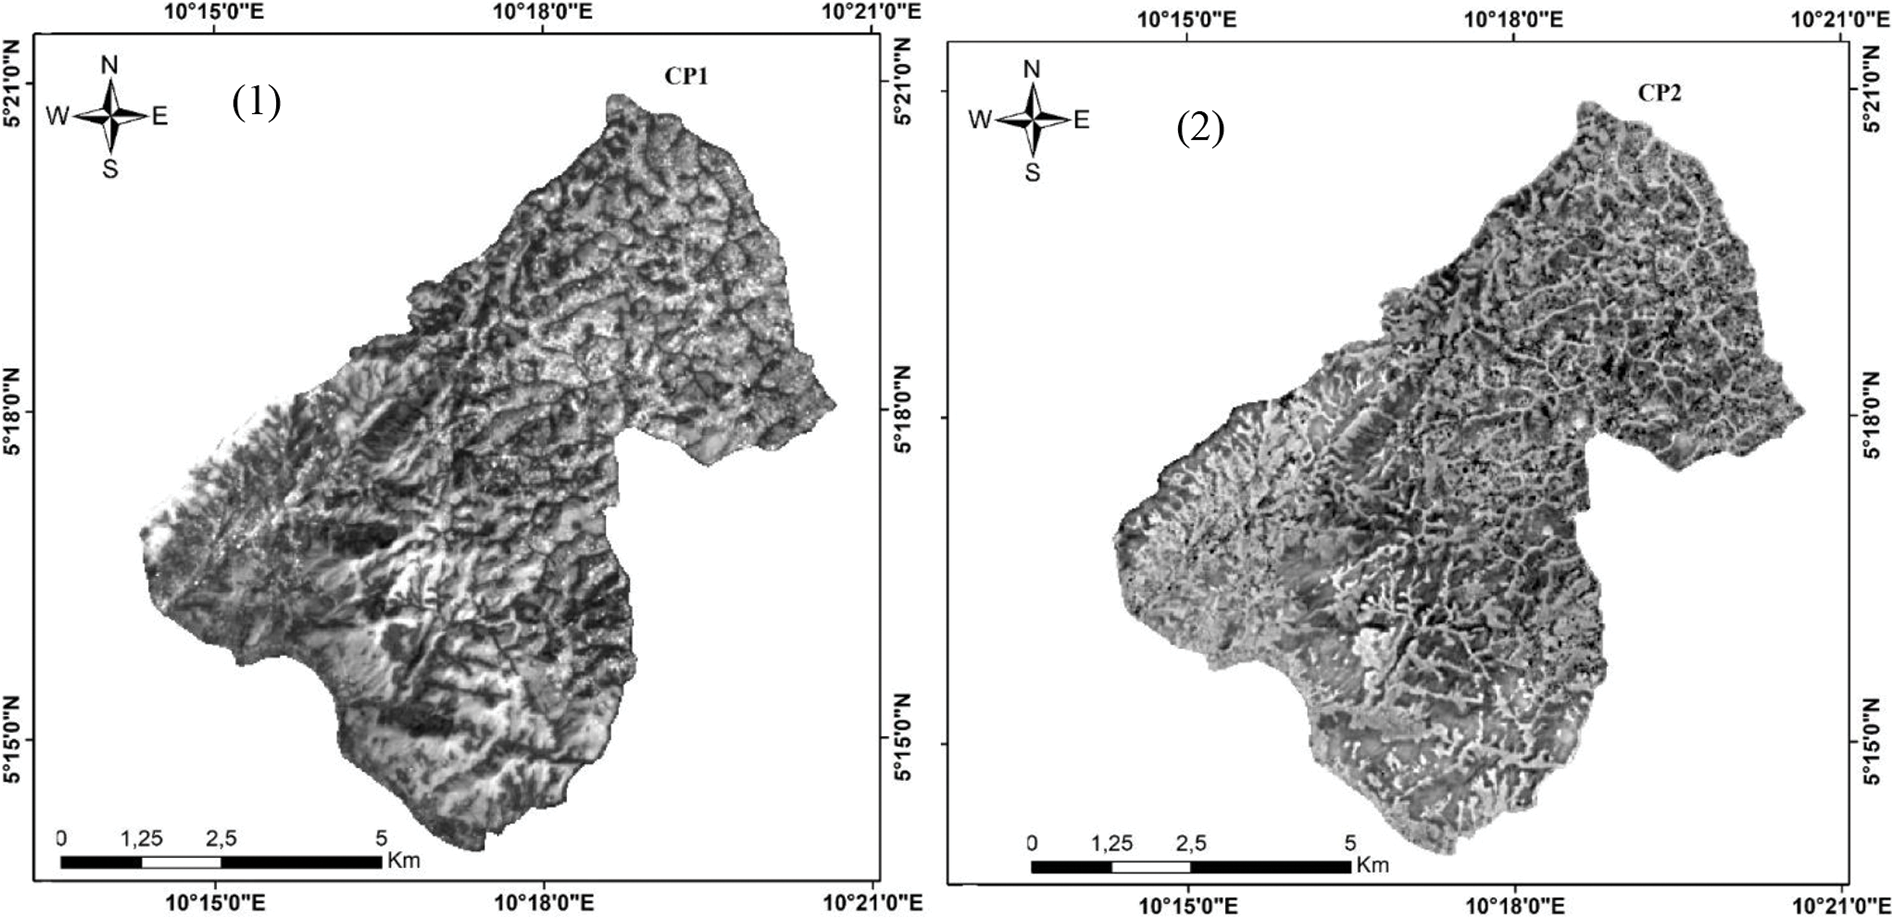
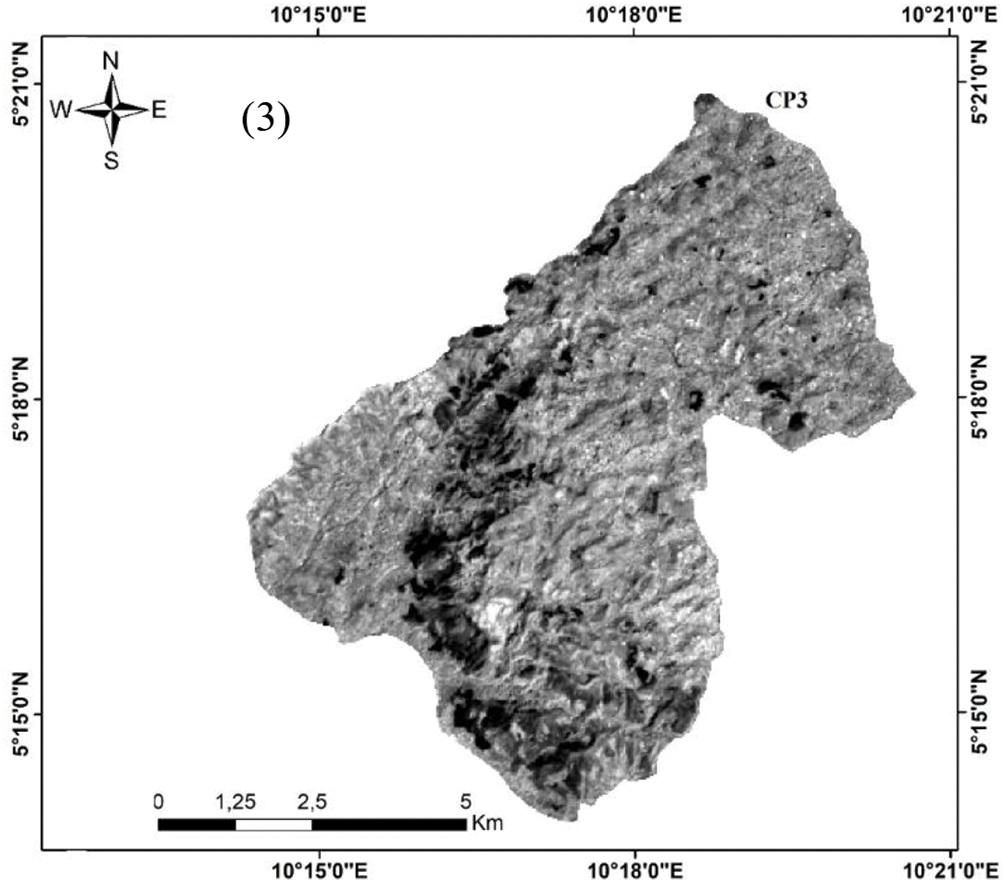
Figure 5: Principal component images 1, 2 and 3 obtained by processing of Landsat 9 OLI/TIRS image of the study area
The Digital Terrain Model (DTM) was processed by Shaded relief technique. Shaded relief technique is a classic mapping technique, which consists in representing the effect of relief by illuminating the model in a defined direction, thus creating shadows that form a monochrome image [31,33]. In this work, the image is filtered and enhanced with a sun azimuth of 345, an altitude of 45 and an elevation factor (Z) of 3 (Fig. 6).
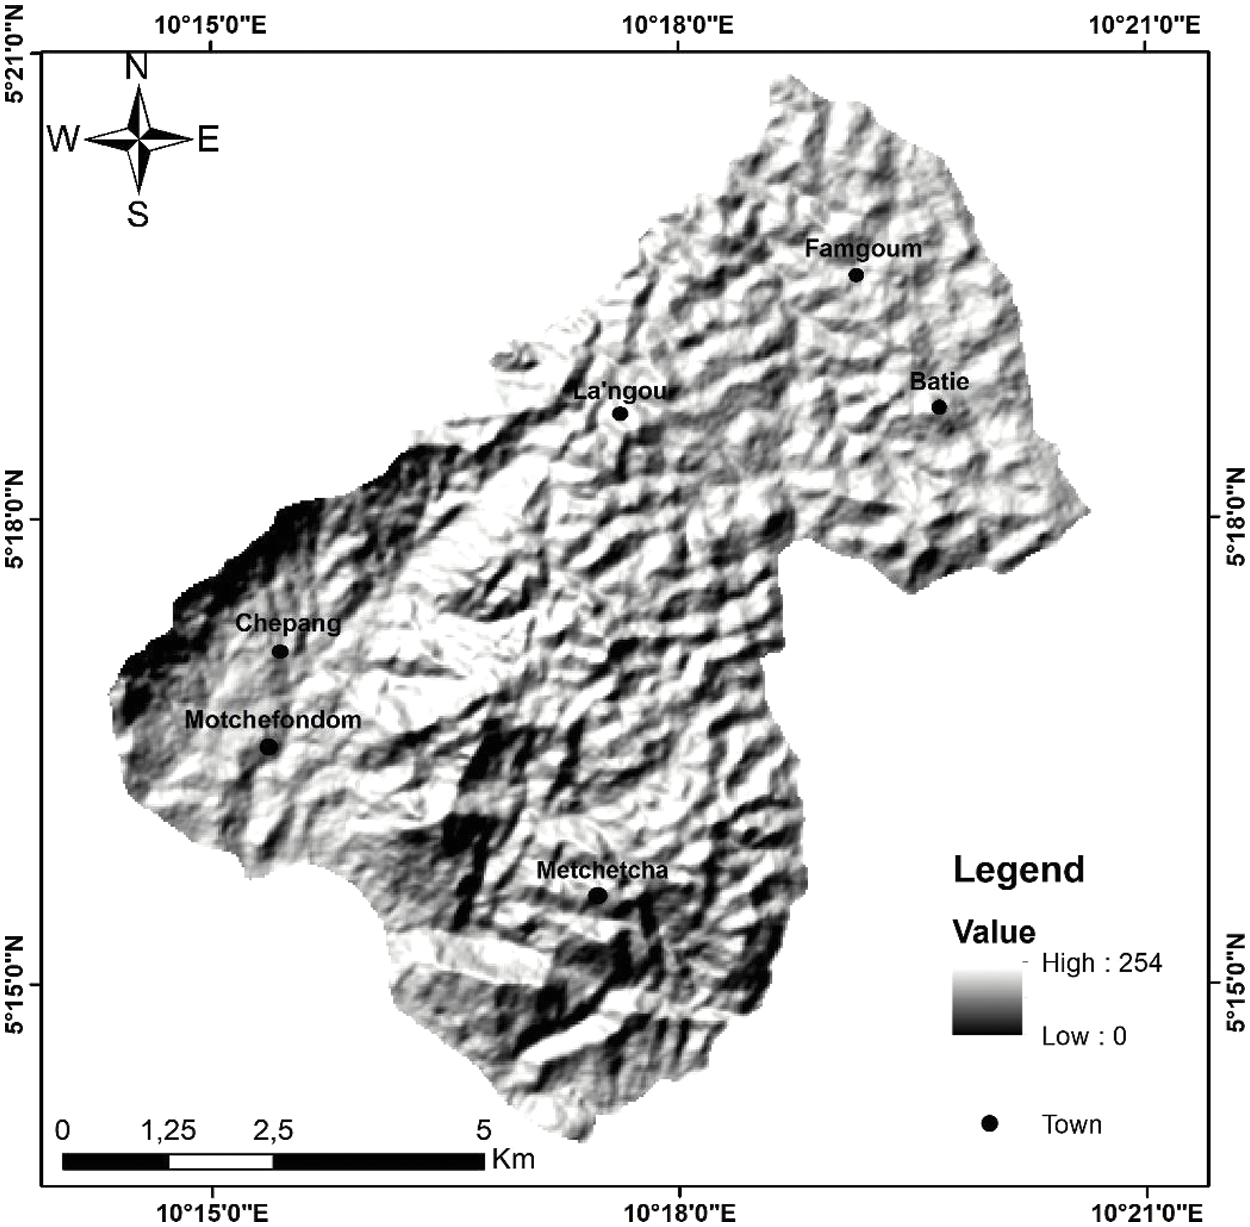
Figure 6: Shaded relief image derived from SRTM
The methods used to extract lineaments are categorized either as automatic, semi-automatic or manual [11,34]. In this work, we opted for manual extraction, as it allows the operator not only to choose the desired magnification and angle of view, but also to use several images from the same or different sources simultaneously, while drawing on his or her knowledge of the terrain. Before extracting the lineaments, the road network map was superimposed on the various processed images to remove structures of anthropogenic origin (roads, railroads). The lineament map was then created by on-screen vectorization of discontinuities in the form of linear or curvilinear structures marking the abrupt tonal changes observed in the images.
3.2.4 Validation of the Lineament Map
Once lineament mapping has been completed, it has to be validated, as satellite image processing regularly comes up along with reliability issues. Ground truth is the most reliable validation [29]. Validation is also achieved by superimposing the lineaments map on other maps or data sources. This study, used the geological map of the West Cameroon region (Fig. 3) and hydrographic network map to validate the Batie fracturing map. The approach consisted in comparing the orientations of the rectilinear river segments with those of the mapped lineaments.
The overall methodology used in this study is summarized in the flow chart in Fig. 7 below.
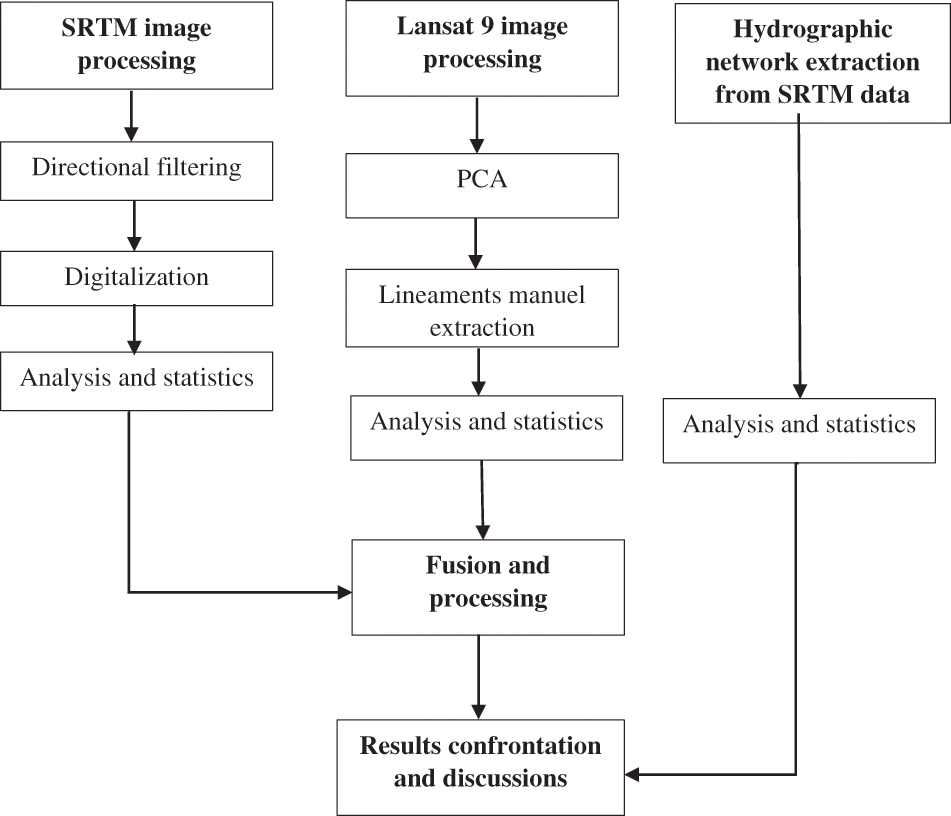
Figure 7: Flowchart
The application of the various techniques described above to Landsat and SRTM images revealed numerous lineaments. The results highlight 84 lineaments for the SRTM data, compared with 92 for the Landsat 9 OLI/TIRS data, the lineaments identified from all data were integrated and evaluated to produce a synthesis map (Figs. 8 and 9). A total of 176 lineaments were identified with a total length of 147.96 km with lengths ranging from 0.002 to 2.461 km. Without being exhaustive, this map is sufficiently representative of the area studied.
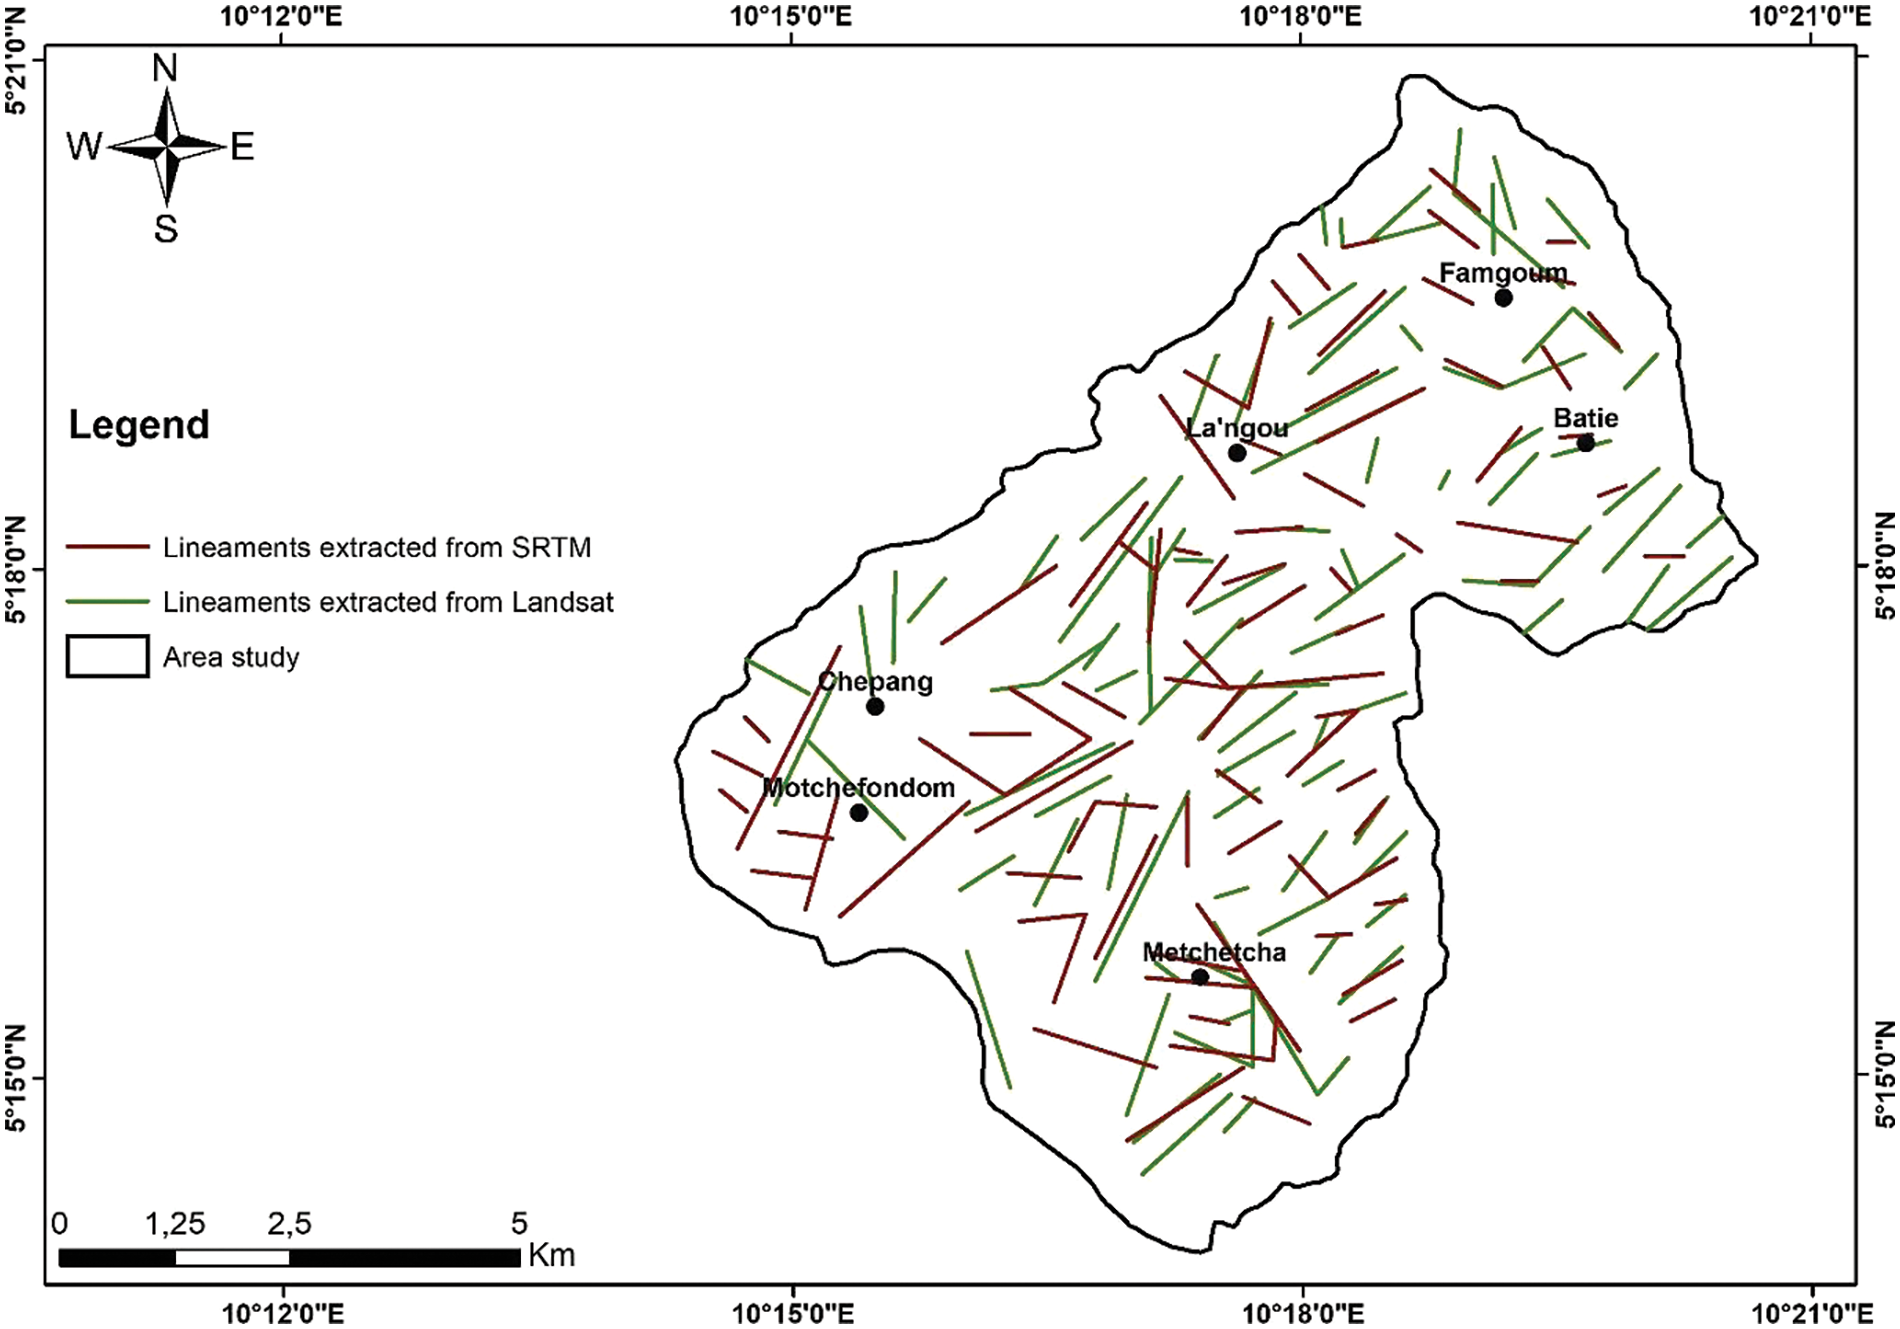
Figure 8: Lineaments map generated from both SRTM and Landsat 9 OLI/TIR satellite images
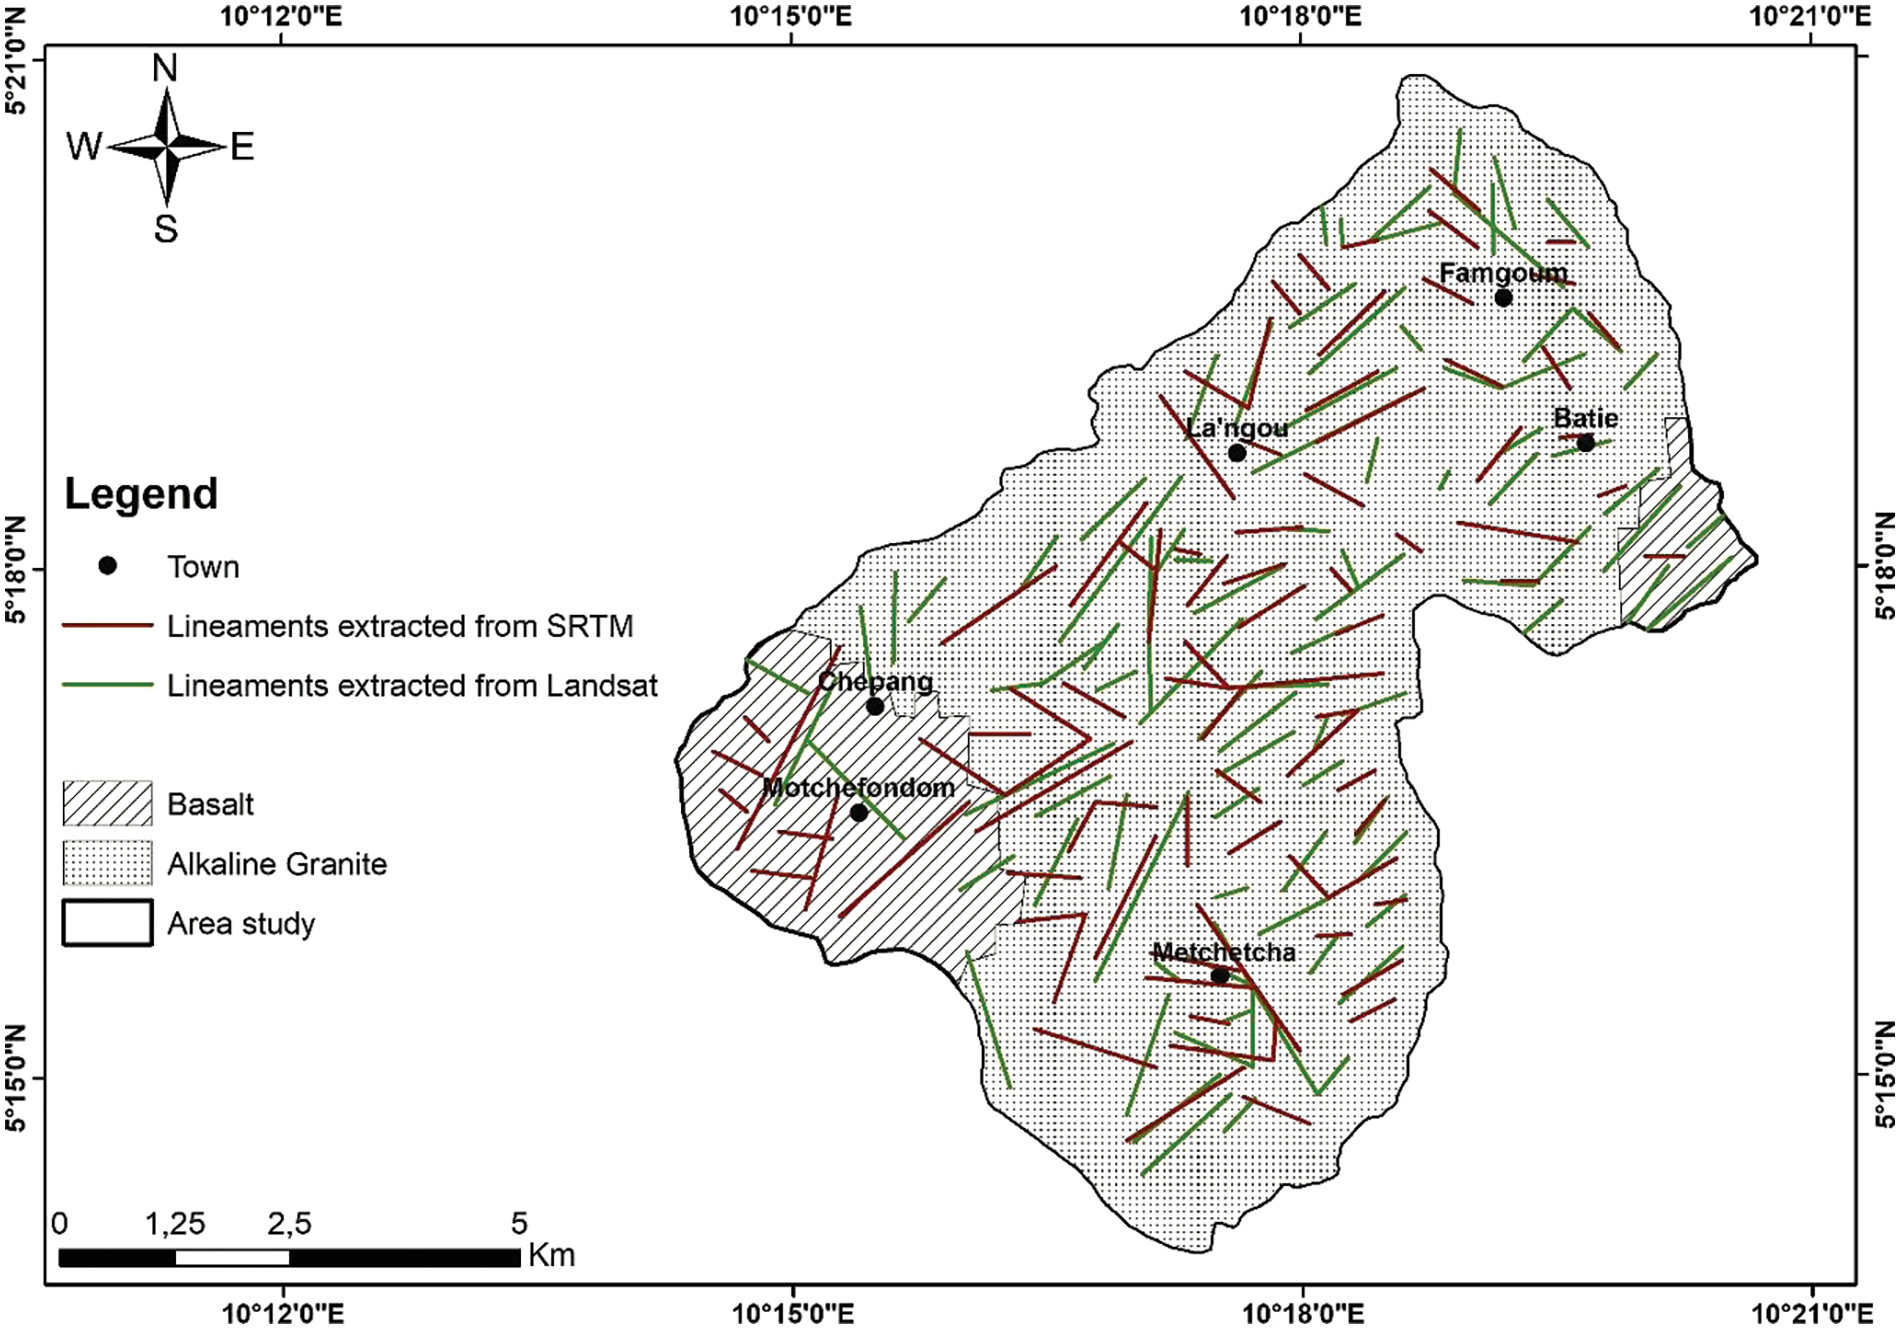
Figure 9: Geological sketch of the study area
4.2 Statistical Analysis of Lineament Networks
The statistical analysis of lineaments has been explored by several authors [35,36] in order to study the geometry of the lineaments network, and identify the dominant directions on a regional scale. The conventional method consists in producing directional rosettes of the lineaments in cumulative numbers and lengths, allowing the different families to be distinguished by classes of 10° of orientation. The directional rosettes (Figs. 10A and 10B) highlight four directional families of lineament: N-S (0° to 9° and 170° to 180°), NE-SW (10° to 79°), E-W (80° to 99°) and NW-SE (100° to 160°). The NE-SW orientation predominates, accounting for 63% of the information in terms of length and 56% in terms of frequency. The N-S lineaments family accounts for 6% of total length and 7% of frequencies. The E-W and NW-SE orientations account respectively for 12% and 19% of total length, and 14% and 23% in terms of frequency. Finally, lineaments belonging to the N-S and, to a lesser extent, NW-SE and E-W families are poorly represented, compared to those identified in the NE-SW direction (56%). This NE-SW direction dominates the lineaments synthesis map.
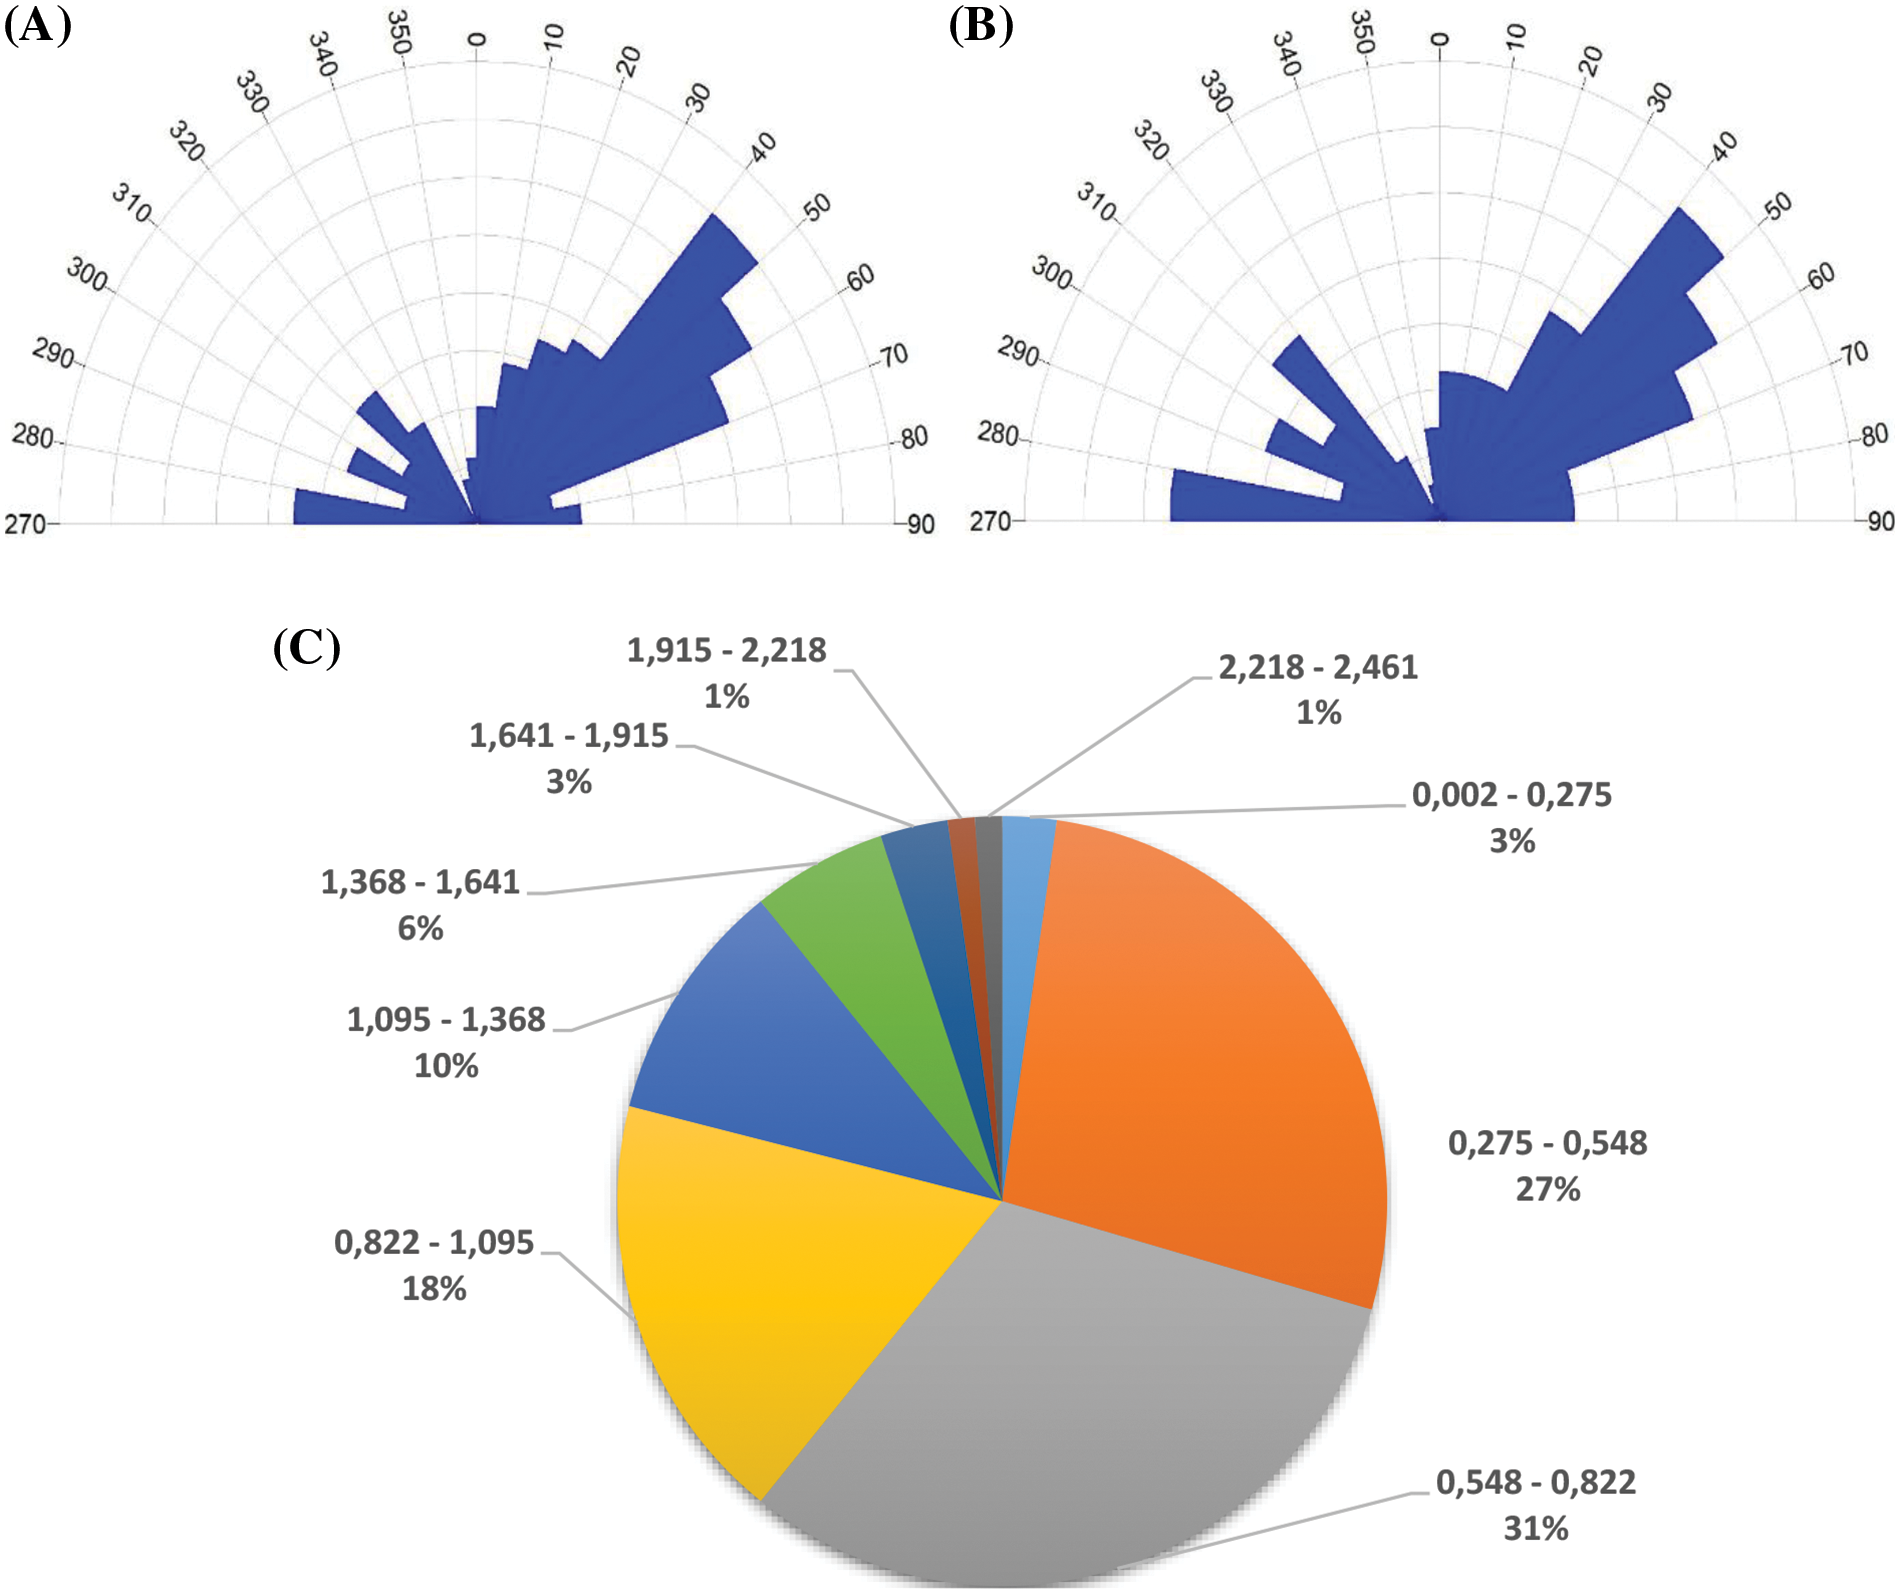
Figure 10: (A) Rose diagram length of lineaments rose diagram frequency of lineaments extracted from SRTM and Landsat 9 OLI/TIR datasets. (B) Rose diagram frequency of lineaments extracted from SRTM and Landsat 9 OLI/TIR datasets. (C) Distribution histograms giving information of the number and length of lineaments extracted from SRTM and Landsat 9 OLI/TIR datasets
Fig. 10C presents a pie chart indicating that out of the 176 identified lineaments, 34% are between 0.822 and 1.641 km long, and 31% are between 0.548 and 0.822 km long. The longest lineaments, over 1.641 km in length, are the least frequent. The smallest lineaments, between 0.002 and 0.548 km in length, account for 30% of all tectonic structures.
4.3 Superposition of Fracture Networks with the Structural Setting
The evaluation and validation of the lineaments extracted from the digital processing of satellite images is essential to assess the effectiveness of the method used [29,36]. The West Cameroon geological map (Fig. 3) shows a wide variety in both lithological and structural composition. The geological lineaments derived from this map are made up of lineaments that appear to be linked to bedrock and tectonic faults. According to [21], these lineaments are distributed along three directions:
- the NE-SW direction, most important, is the general orientation of the foliation,
- the NW-SE direction is attributed to general fracturing,
- the N-S direction illustrates the major break-ups.
The comparison of the directions of the lineaments derived from this work (Figs. 10A and 10B) with the structural directions in the existing geological map (Fig. 3) shows a high degree of concordance. However, this study highlighted more lineaments than those in the geological map.
For a better visualization of lineament concentration zones, a lineaments density map of the study area was produced. The lineaments database was permitted to produce lineament density maps using the “Line density” function in the ArcGIS software. The density is calculated in units of length per unit area. The overall analysis of the lineament density distribution (Fig. 11) shows spatial variability in lineament intensity, which is divided into 5 classes. This estimate was made possible by converting the raster data of the lineament synthesis map into vector data; this made it possible to calculate the area of the polygons in each class and deduce the corresponding percentages. The very low lineaments density class occupies 39% of the study area. These densities can be identified all over the study area, particularly along the western boundary, in the form of pockets to the southwest and northeast. Areas of low lineament density occupy 40% of the study area, and are also scattered over almost the entire study area in the form of pockets in the north-western, western and south-western extremities. Medium and high lineament densities account for 17% and 4%, respectively, and are scattered over almost the entire study area. The very high lineament density class occupies 1% of the study area and takes the form of three pockets, in the central and south-eastern parts of the study area.
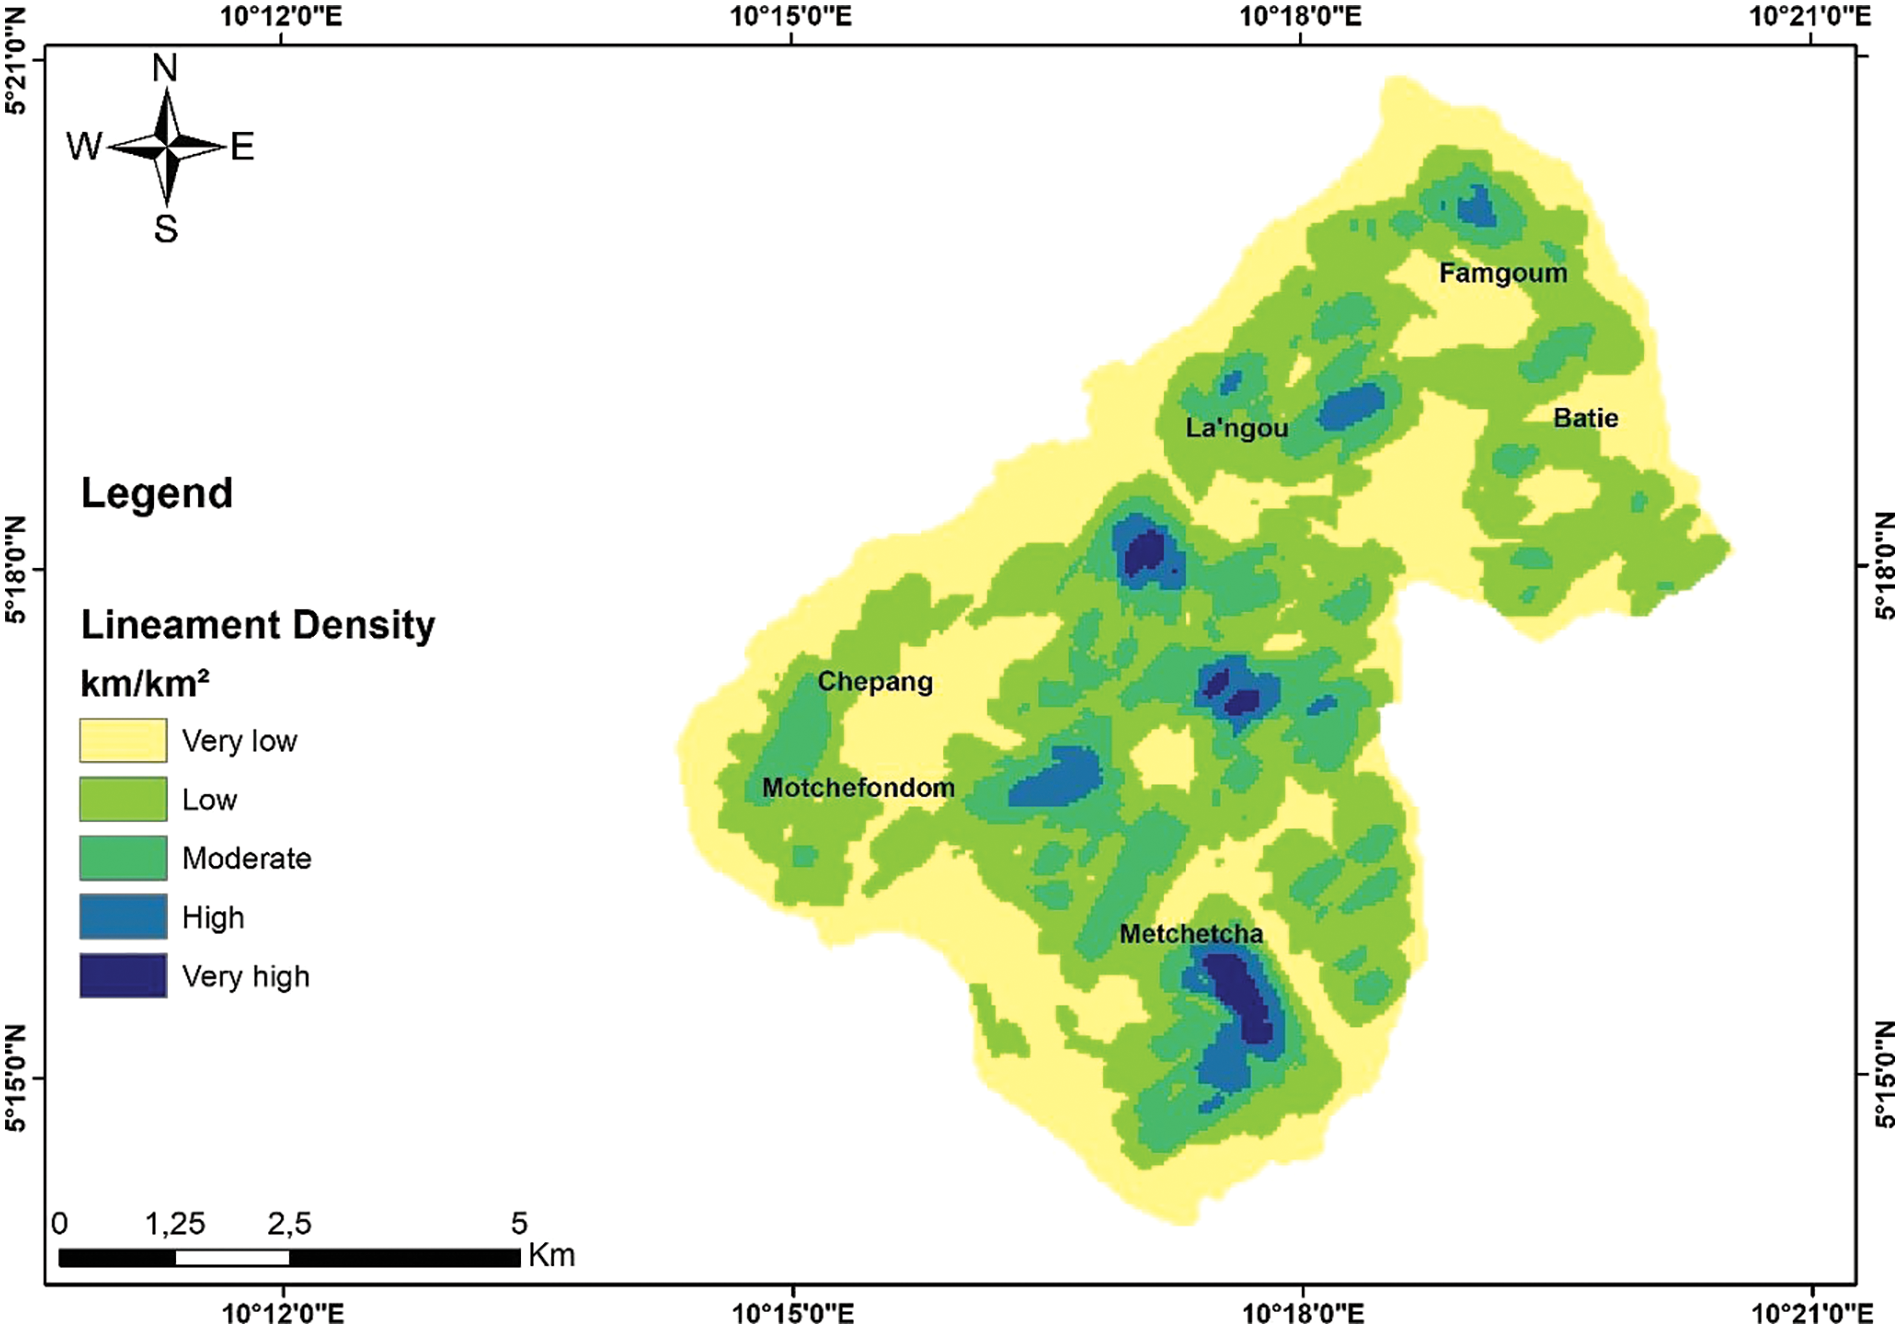
Figure 11: Lineament density generated both from SRTM and Landsat 9 OLI/TIRS satellite images
4.5 Drainage and Drainage Density
The hydrographic network is a characteristic element of texture and structure, and an important criterion for interpretation. The type associated with them generally reflects the lithology and tectonics of a region. Detailed study of the drainage is a means of reasoned spatial partitioning. This approach, supported by a directional analysis and a study of the spatial density of the hydrographic network, makes it possible to discriminate potential infiltration, then retention and recharge areas, and areas with predominant surface runoff. In the context of this study, analysis of the geometry of the hydrographic network obtained from SRTM images (Figs. 12 and 13) shows that the spatial distribution of the watercourses follows mainly the E-W, N-S, NW-SE and NE-SW directions.
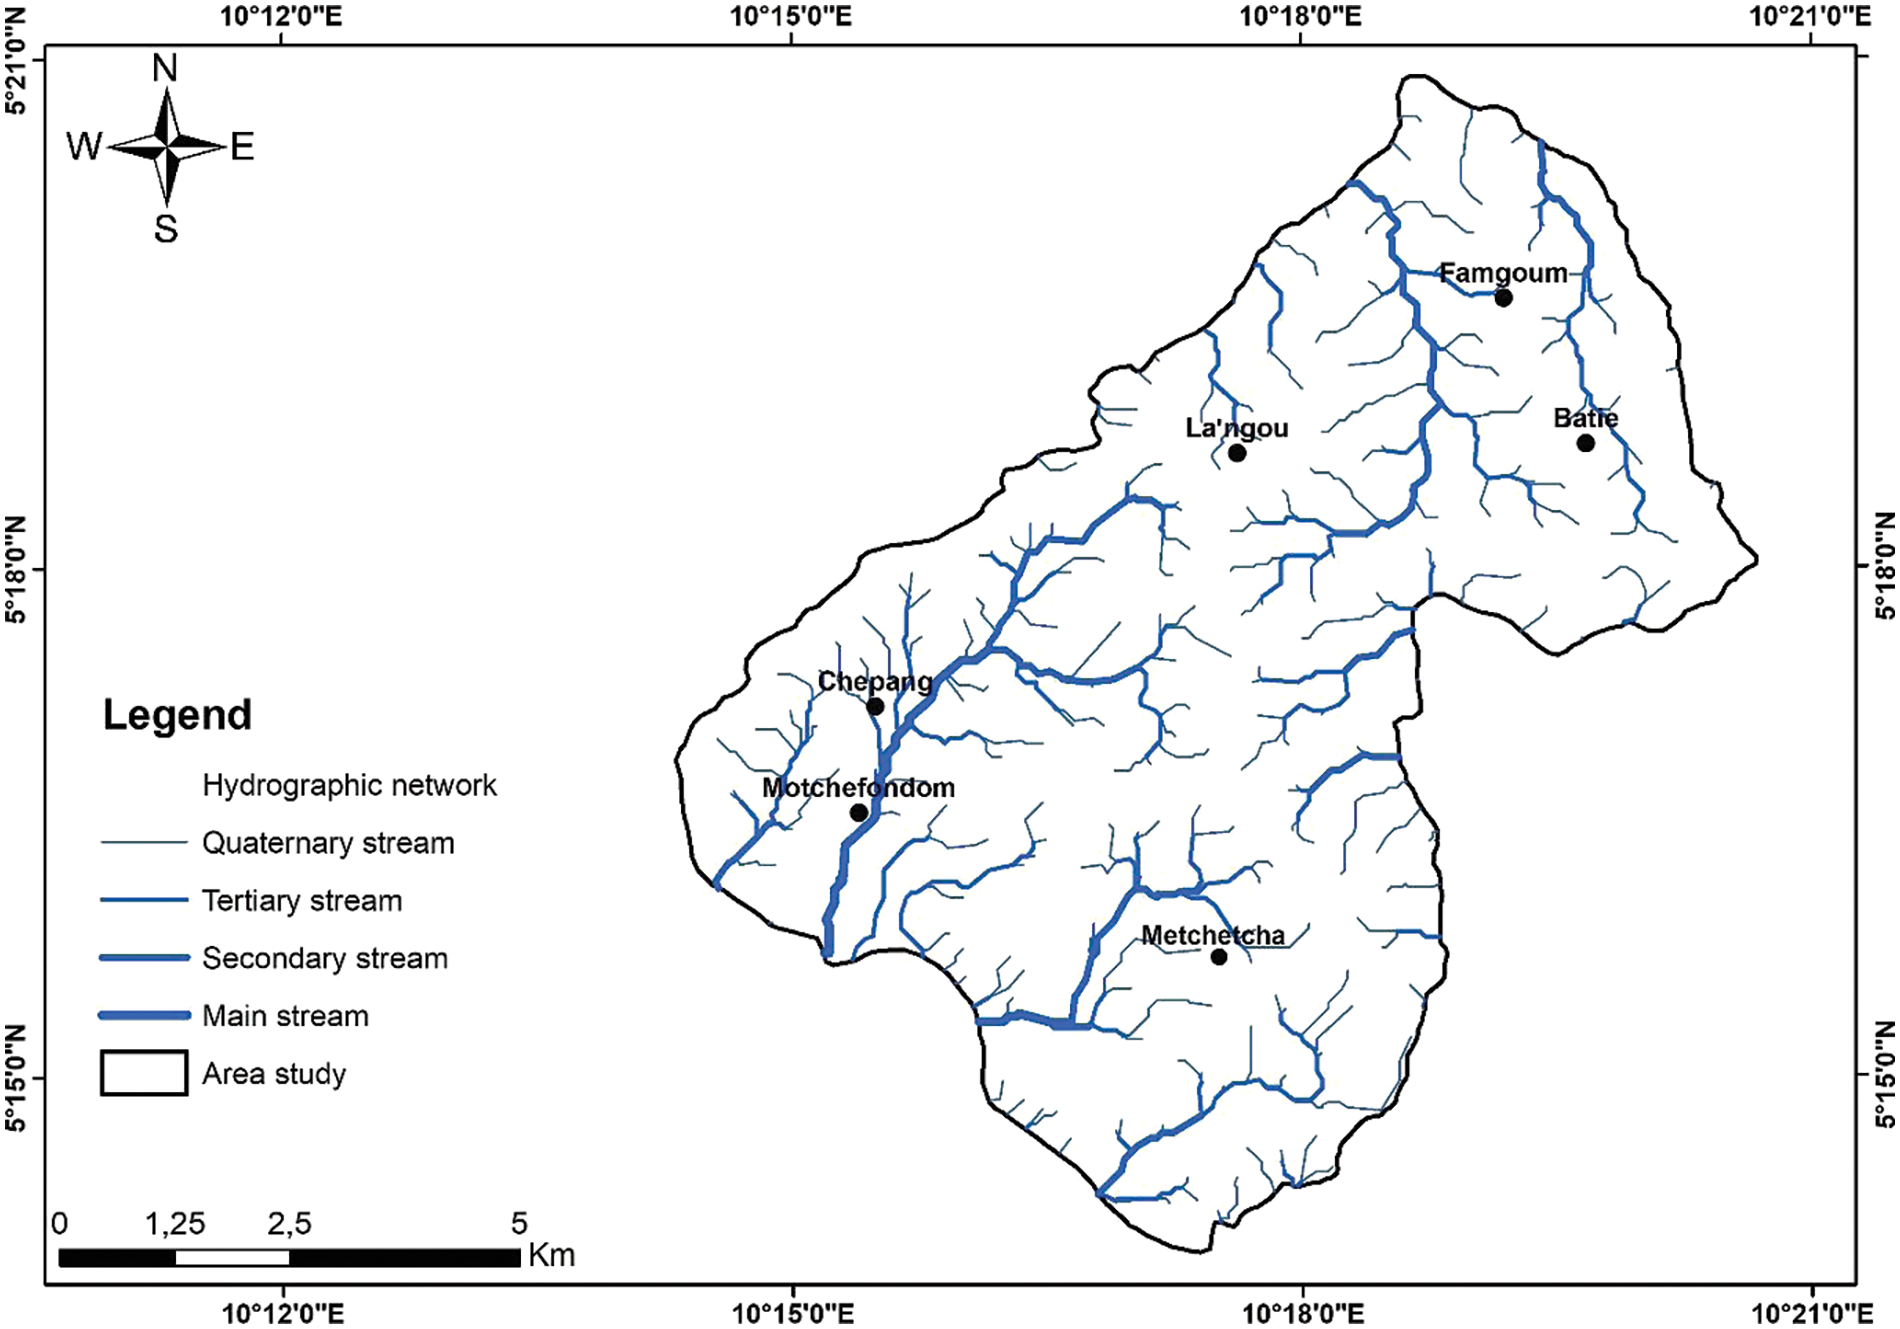
Figure 12: Drainage patterns of the research site
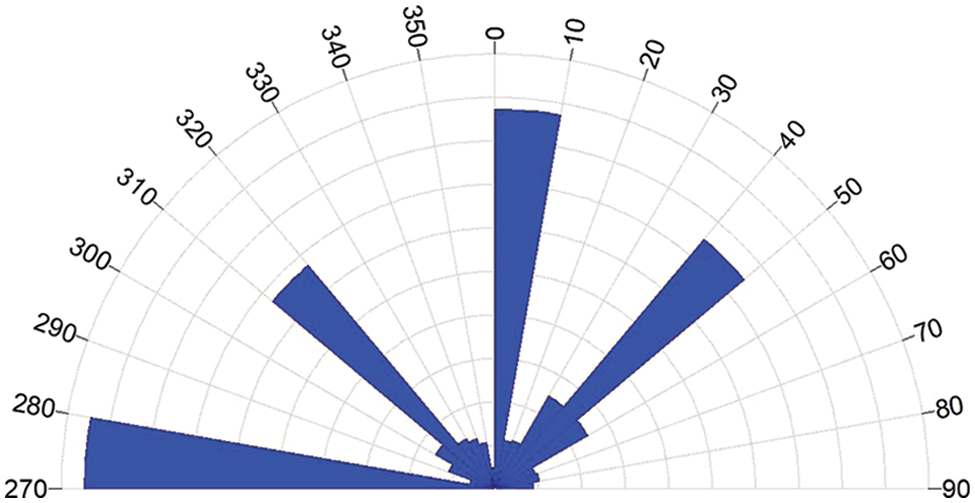
Figure 13: Rose diagram of drainage patterns
The drainage density map (Fig. 14) derived from SRTM data (90 m resolution) was produced using the “Kernel density” function in ArcGIS software. The analysis of this map revealed five main areas (Fig. 14). The domain of very low drainage densities identified throughout the study area, covers about 29% of the study area. The domain of low drainage densities is present in variable portions throughout the study area. This area covers 33% of the study zone. The medium drainage density domain is omnipresent in the study area, with a proportion of 25% of the study area. High drainage densities are located in pockets throughout the area, particularly in the South-West. This high-density area covers 11% of the study area. The domain of very high drainage densities was identified in the southwest of the study area, within the high-density domain. This area covers 1% of the study area.
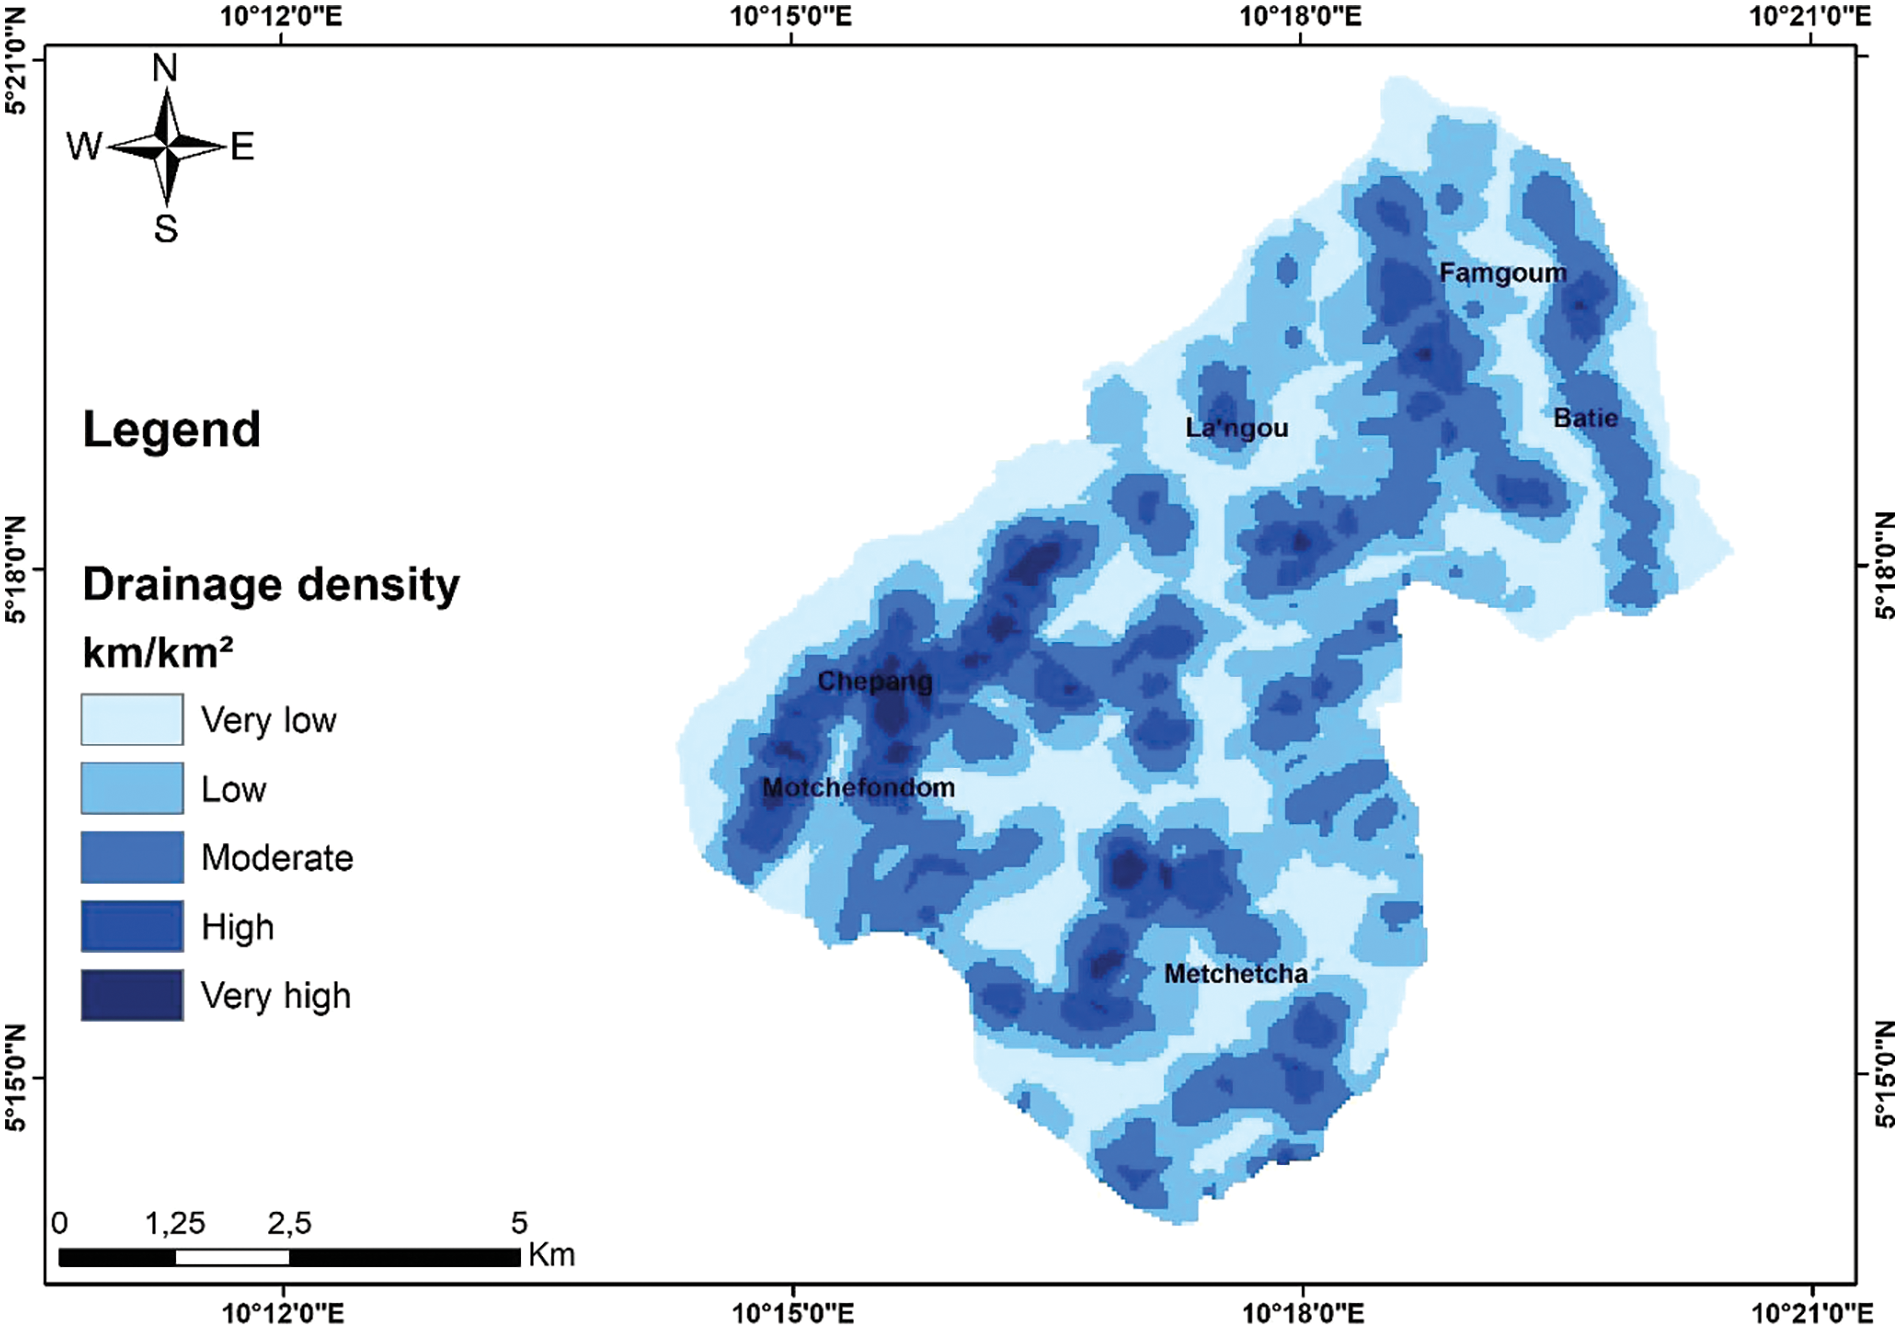
Figure 14: Drainage density classification of the research site
4.6 Confrontation of Fracture Networks with Drainage System
The lineament map was superimposed on the hydrographic network map (Fig. 15) to see if there is a link between fault orientations and the main directions of surface water course. The rosette of hydrographic network strands is illustrated in Fig. 15. Analysis of this figure shows that surface water flows in the following main directions: E-W, N-S, NW-SE and NE-SW. This result is similar to that of the lineaments network extracted from satellite images. The lineaments and hydrographic networks show the same behavior in terms of their distribution over the area studied. Fractures therefore also influence the flow of water on the ground surface. They act as drains, encouraging infiltration and water flow.
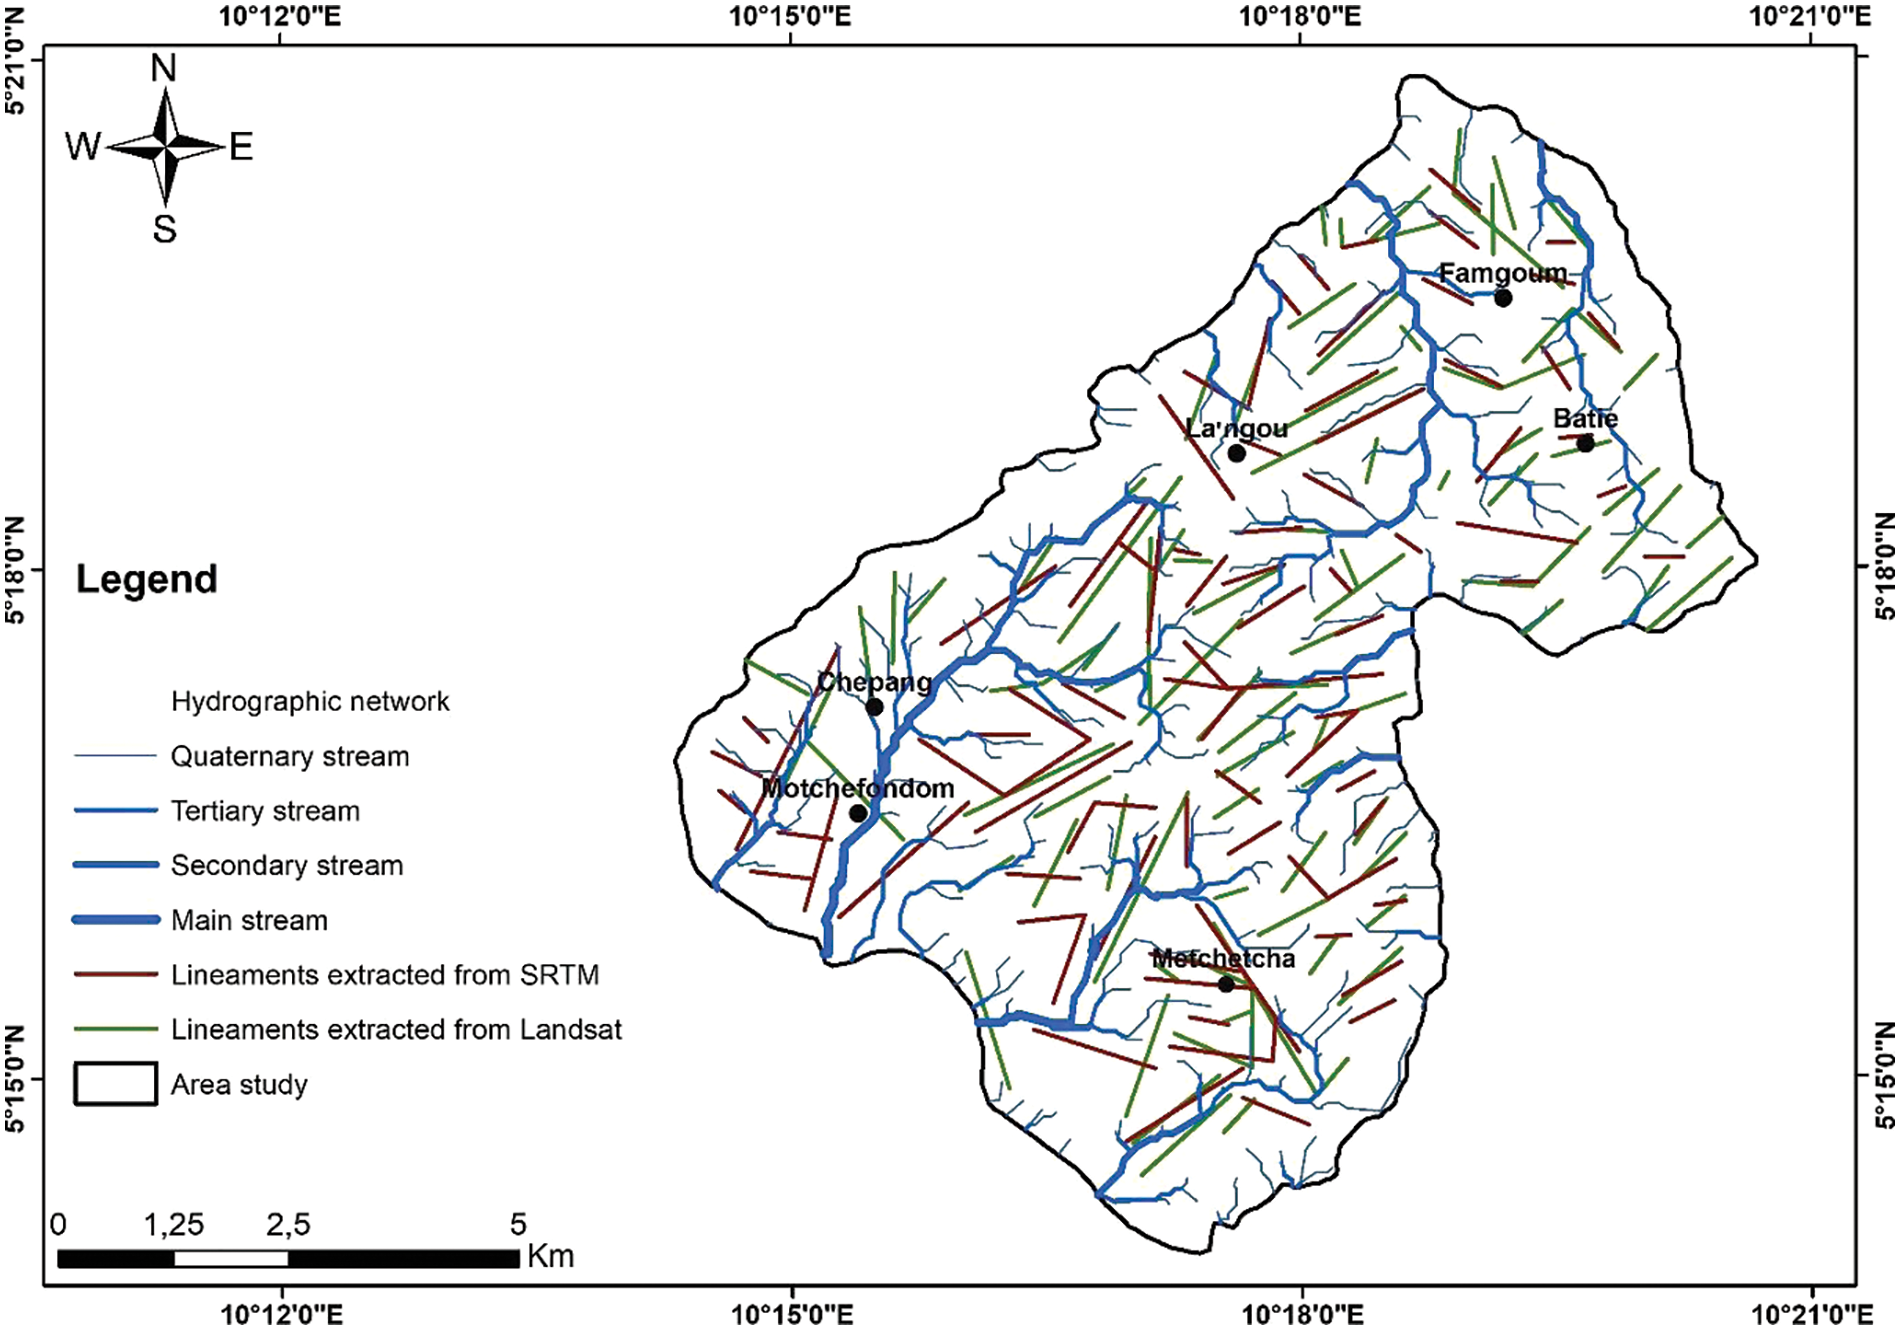
Figure 15: Relationship between the hydrographic and tectonic lineaments extracted from SRTM and Landsat 9 OLI/TIR datasets
The litho-structural discontinuity mapping using satellite imagery has been the subject of numerous studies in Cameroon [35,37,38]. These studies have led to a better understanding of fractured environments. Various pre-processing and processing techniques applied to satellite image data from the study area have made the litho-structural discontinuities more expressive. After eliminating linear structures unrelated to geological information, the map of the lineaments network was validated on the basis of pre-existing geological maps [23] and the hydrographic network derived from the digital terrain model. The directional analysis of the lineaments in the study area reveals four main directions: NE-SW with a predominance of the N40°–N50° class, NW-SE, N-S and E-W directions. These various directions reflect the multiple episodes of deformation events that may have occurred in the region throughout geological time [39]. The NE-SW lineaments are predominant; they would illustrate the second phase of deformation in the Central domain of the Central African Orogenic Belt, as shown by [40]. Ultimately, the results of the analysis of the predominant orientations of the lineaments highlighted in this study agree with the results from previous studies in this region [24,41,42].
The density of lineaments is an indicator of the degree of fracturing in the rock. In the Batie zone, this density of the fracture network varies spatially from one area to another. Areas of relatively high lineament density are identified as highly fractured rocks zones. According to [43], a high fracture density in a rock indicates significant hydrogeological potential, as fractures in the subsoil constitute natural corridors, privileged for fluid circulation. Therefore, of its medium to high fracture density zones, Batie has a good potential for groundwater supply to certain localities.
The hydrographic network shows dominant NE-SW and NW-SE orientations, in line with the dominant fracturing directions. Superimposing the lineaments map on the hydrographic network shows that there is a genetic link between the orientations of the various linear structures and the directions of surface water circulation.
The Batie structural map resulting from this study is a valuable tool for guiding the exploitation of groundwater resources. The study shows that lithological discontinuities such as faults and geological contacts as preferential zones for groundwater circulation. Lineament density maps, while popular, exhibit limited applicability in many instances. Despite this, they frequently serve as foundational elements in the creation of groundwater potential maps, even in areas where the accurate positioning of wells relies significantly on precise projections of well sites [44]. Lineament mapping results will provide valuable insights for decision-makers regarding well implementation in the Batie area. Therefore, the structural map is a fundamental document that can aid in the selection of sites for groundwater exploration boreholes. Acquiring data from boreholes already drilled in the study area is advisable. Correlations between borehole flow and the position of these boreholes in relation to the lineaments will enable us to identify the latter’s role in controlling groundwater flow. However, it is crucial to recognize that these maps offer a preliminary assessment. For a more robust approach, it is recommended to integrate lineament data with other sources of information, such as geophysical surveys or existing well data. As a future prospect of this current research, the automatic extraction of structural lineaments in the will be investigated. The integration of geophysical methods, such as electrical tomography and vertical electrical soundings in our future research project, will refine the results obtained and provide further clarification of the Batie area hydrogeology.
The methodological approach used in this study consists of the combination of two data sources (i.e., SRTM data and Landsat 9 OLI/TIR images). This approach has the merit of improving accuracy in lineament identification. The results obtained prove the effectiveness of this approach in mapping geological lineaments. However, it should be noted that the accuracy and quality of the lineaments mapped are highly dependent on the spatial resolution of the imagery. The use of optical images in mountainous and densely vegetated areas such as ours can sometimes be problematic, as they are mainly conditioned by the extent of cloud cover. On the other hand, according to [45], Radar images can be more effective in mountainous areas with steep slopes and uneven terrain, as the radar signal is more sensitive to topography and surface roughness. In addition, the vegetation-penetrating power of radar images (particularly in the ALOS PALSAR L-band) makes them more useful for detecting lineaments in vegetation-covered areas. It would be interesting to exploit the Radar data for comparison.
Remote sensing techniques remain a powerful tool for lineament mapping. The processing and analysis of Landsat 9 OLI/TIR and SRTM images have enabled us to map several major faults in the Batie region, which were previously poorly understood, including their relationship with the hydrographic network. Quantitatively, 176 geological lineaments have been identified. Their major directions are NE-SW, N-S, NW-SE and E-W. These different directional families are consistent with the fracturing pattern of the region. Superimposing these lineaments on the hydrographic network map illustrates the spatial and directional relationships between these different elements. This study shows that the layout of the various segments of the hydrographic network is influenced by fracturing. However, the lineaments identified must be treated with caution, as remote sensing analysis alone is not sufficient to confirm whether these fractures form groundwater reservoirs. Thus, further complementary hydrogeological information will significantly improve the identification of favorable sites for good productive water wells.
Acknowledgement: We want to thank the editor and anonymous reviewers for their valuable comments and suggestions for this paper.
Funding Statement: The authors received no specific funding for this study.
Author Contributions: Jean Aimé Mono: Supervision, data processing, data management software, interpretation, methodology, and writing–original draft. Appolinaire Bouba: Conceptualization. Jean Daniel Ngoh: Formal analysis. Olivier Ulrich Igor Owono Amougou: Data curation, Françoise Martine Enyegue A Nyam: Visualization, methodology. Théophile Ndougsa Mbarga: Supervision.
Availability of Data and Materials: The software and data presented in this paper are available at: https://earthexplorer.usgs.gov; https://www.usgs.gov.
Conflicts of Interest: The authors declare that they have no conflicts of interest to report regarding the present study.
References
1. Hobbs WH. Repeating patterns in the relief and in the structure of land. Bull Geol Soc Am. 1911;22(1):123–76. doi:10.1130/GSAB-22-123. [Google Scholar] [CrossRef]
2. O’leary D, Friedman J, Pohn H. Lineament, linear, lineation: some proposed new standards for old terms. Geol Soc Am Bull. 1976;87(10):1463–9. doi:10.1130/0016-7606(1976)87<1463:LLLSPN>2.0.CO;2 [Google Scholar] [CrossRef]
3. Maged M, Mazlan H. Lineament mapping using multispectral remote sensing satellite data. Int J Phys Sci. 2010;5(10):1501–7. [Google Scholar]
4. Pour AB, Hashim M, Makoundi C, Zaw K. Structural mapping of the Bentong-Raub suture zone using PALSAR remote sensing data, Peninsular Malaysia: implications for sediment-hosted/orogenic gold mineral systems exploration. Resour Geol. 2016;66(4):368–85. doi:10.1111/rge.2016.66.issue-4. [Google Scholar] [CrossRef]
5. Masoud A, Koike K. Tectonic architecture through Landsat-7 ETM+/SRTM DEM-derived lineaments and relationship to the hydrogeologic setting in Siwa region, NW Egypt. J Afr Earth Sci. 2006;45(4–5):467–77. [Google Scholar]
6. Maina M, Tudunwada I. Lineament mapping for groundwater exploration in Kano state, Nigeria. Int J Adv Agric Environ Eng. 2017;4:226–9. [Google Scholar]
7. Nanda S, Annadurai R, Barik KK. Geospatial decipherment of groundwater potential of Kattankolathur block of Tamil Nadu using MCDM techniques. Remote Sens Appl: Soc Environ. 2017;8:240–50. [Google Scholar]
8. Mollard J. A study of aerial Mosaics in Southern Saskatchewan and Manitoba: oil in Canada. Winnipeg; 1957. vol. IX, no. 40, p. 26–50. [Google Scholar]
9. Norman J. Photogeological fracture trace analysis as a subsurface exploration technique. Inst Ming Metall. 1976;85:52–62. [Google Scholar]
10. Jordan G, Schott B. Application of wavelet analysis to the study of spatial pattern of morphotectonic lineaments in digital terrain models. A case study. Remote Sens Environ. 2005;94(1):31–8. doi:10.1016/j.rse.2004.08.013. [Google Scholar] [CrossRef]
11. Ahmadi H, Pekkan E. Fault-based geological lineaments extraction using remote sensing and GIS–A review. Geosciences. 2021;11(5):183. doi:10.3390/geosciences11050183. [Google Scholar] [CrossRef]
12. Azman AI, Ab Talib J, Sokiman MS. The integration of remote sensing data for lineament mapping in the semanggol formation, Northwest Peninsular Malaysia. In: IOP Conference Series: Earth and Environmental Science, 2020; Kuala Lumpur, Malaysia, IOP Publishing. [Google Scholar]
13. Saadi NM, Zaher MA, El-Baz F, Watanabe K. Integrated remote sensing data utilization for investigating structural and tectonic history of the Ghadames Basin, Libya. Int J Appl Earth Obs Geoinform. 2011;13(5):778–91. [Google Scholar]
14. Abdelouhed F, Ahmed A, Abdellah A, Mohammed I, Zouhair O. Extraction and analysis of geological lineaments by combining ASTER-GDEM and Landsat 8 image data in the central high atlas of Morocco. Nat Hazards. 2022;111:1–23. [Google Scholar]
15. Rottensteiner F. Semi-automatic extraction of buildings based on hybrid adjustment using 3D surface models and management of building data in a TIS. Wien: Studienrichtung Vermessungswesen Technische Universität Wien Univ.; 2001. [Google Scholar]
16. Hajaj S, El Harti A, Jellouli A. Assessment of hyperspectral, multispectral, radar, and digital elevation model data in structural lineaments mapping: a case study from Ameln valley shear zone, Western anti-atlas Morocco. Remote Sens Appl: Soc Environ. 2022;27:100819. [Google Scholar]
17. Jira F, Aouragh MH, Lakhouili A, Belasri A, Jelbi M. Mapping and analysis of structural lineaments using Landsat 8-OLI images and multivariate statistical methods in Tarfaya coastal basin, Southwest Morocco. Model Earth Syst Environ. 2024;10(1):1441–55. doi:10.1007/s40808-023-01853-9. [Google Scholar] [CrossRef]
18. Shahfahad TS, Naikoo MW, Rahman A, Gagnon AS, Islam ARMT, et al. Comparative evaluation of operational land imager sensor on board landsat 8 and landsat 9 for land use land cover mapping over a heterogeneous landscape. Geocarto Int. 2023;38(1):2152496. doi:10.1080/10106049.2022.2152496. [Google Scholar] [CrossRef]
19. Cheunteu Fantah CA, Mezoue CA, Mouzong MP, Tokam Kamga AP, Nouayou R, Nguiya S. Mapping of major tectonic lineaments across Cameroon using potential field data. Earth, Planets Space. 2022;74(1):59. doi:10.1186/s40623-022-01612-7. [Google Scholar] [CrossRef]
20. Kwékam M, Affaton P, Bruguier O, Liégeois JP, Hartmann G, Njonfang E. The Pan-African Kekem gabbro-norite (West-CameroonU-Pb zircon age, geochemistry and Sr-Nd isotopes: geodynamical implication for the evolution of the central African fold belt. J Afr Earth Sci. 2013;84:70–88. doi:10.1016/j.jafrearsci.2013.03.010. [Google Scholar] [CrossRef]
21. Talla V. The Pan-African granite massif of Batie (West Cameroonpetrology-Petrostructural-Geochemistry (Thesis). University of Yaoundé I: Republic of Cameroon; 1995. [Google Scholar]
22. Nzenti J-P, Barbey P, Jegouzo P, Moreau C. A new example of a granulite belt in a Proterozoic collision chain: the Yaoundé migmatites, cameroon. Mech-Phys, Chem, Univ Sci, Earth Sci. 1984;299(17):1197–9. [Google Scholar]
23. Kwékam M, Talla V, Fozing EM, Tcheumenak Kouémo J, Dunkl I, Njonfang E. The Pan-African High-K I-type granites from Batie complex, West Cameroon: age, origin, and tectonic implications. Front Earth Sci. 2020;8:363. doi:10.3389/feart.2020.00363. [Google Scholar] [CrossRef]
24. Dumort JC. Geological map at scale 1:500,000, Federal Republic of Cameroon, Explanatory Note on the Douala-West sheet. Direction of Mines and Geology of Cameroon. 1986. [Google Scholar]
25. Showstack R. Landsat 9 satellite continues half-century of earth observations: eyes in the sky serve as a valuable tool for stewardship. BioScience. 2022;72(3):226–32. doi:10.1093/biosci/biab145. [Google Scholar] [CrossRef]
26. You H, Tang X, Deng W, Song H, Wang Y, Chen J. A study on the difference of LULC classification results based on Landsat 8 and Landsat 9 data. Sustainability. 2022;14(21):13730. doi:10.3390/su142113730. [Google Scholar] [CrossRef]
27. Bonn F, Rochon G. Remote sensing summary: thematic applications. Canada: Quebec University Press; 1992. [Google Scholar]
28. Yésou H, Besnus Y, Rolet J. Extraction of spectral information from Landsat TM data and merger with SPOT panchromatic imagery—A contribution to the study of geological structures. ISPRS J Photogrammetry Remote Sens. 1993;48(5):23–36. doi:10.1016/0924-2716(93)90069-Y. [Google Scholar] [CrossRef]
29. Kouamé K. Hydrogeology of discontinuous aquifers in the semi-mountainous Man-Danané region (western Côte d’Ivoire). Contribution of satellite image data and statistical and fractal methods to the development of a spatially referenced hydrogeological information system (Doctoral Thesis). University of Cocody; 1999. p. 210. [Google Scholar]
30. Marion A. Introduction aux techniques de traitement d’images. Eyrolles; 1987. [Google Scholar]
31. Riahi B, Guellala R, Gannouni S. Enhanced characterization of fractured aquifers in Siliana-Jebel Bargou region (North West Tunisia). Arab J Geosci. 2022;15(6):458. doi:10.1007/s12517-022-09730-y. [Google Scholar] [CrossRef]
32. Rezaei H, Bozorg-Haddad O, Demirel MC. Remote sensing application in water resources planning. In: Essential tools for water resources analysis, planning, and management. Singapore: Springer; 2021. p. 101–24. [Google Scholar]
33. Donnay JP. Mapping using isarithms. Presentation of a program using the moving average method. Bulletin of the Geographical Society of Liege; 1981. p. 7–18. [Google Scholar]
34. Farahbakhsh E, Chandra R, Olierook HK, Scalzo R, Clark C, Reddy SM, et al. Computer vision-based framework for extracting tectonic lineaments from optical remote sensing data. Int J Remote Sens. 2020;41(5):1760–87. doi:10.1080/01431161.2019.1674462. [Google Scholar] [CrossRef]
35. Assatse WT, Nouck PN, Tabod CT, Akame JM, Biringanine GN. Hydrogeological activity of lineaments in Yaoundé cameroon region using remote sensing and GIS techniques. Egyptian J Remote Sens Space Sci. 2016;19(1):49–60. [Google Scholar]
36. Koffi YP, Aretouyap Z, Gweth MMA, Meli’i JL, Biringanine GN, Fils SCN, et al. Contribution of landsat imagery to map vulnerable areas to seawater intrusion along the Mt.-cameroon coastal area using lineaments pattern. J Afr Earth Sci. 2023;204:104937. doi:10.1016/j.jafrearsci.2023.104937. [Google Scholar] [CrossRef]
37. Mandeng EPB, Bidjeck LMB, Wambo JDT, Taku A, Betsi TB, Ipan AS, et al. Lithologic and structural mapping of the Abiete-Toko gold district in southern cameroon, using Landsat 7 ETM+/SRTM. Comptes Rendus Géosci. 2018;350(3):130–40. [Google Scholar]
38. Messe MRD, Kenfack JV, Ngapgue F, Wouatong ASL, Makem EA, Keuni N. Lineaments analysis of Bafoussam (West-Cameroon) using remote sensing and vertical electrical sounding: hydrogeological implication. Egyptian J Remote Sens Space Sci. 2021;24(3):1023–36. [Google Scholar]
39. Prabhakaran A, Jawahar Raj N. Mapping and analysis of tectonic lineaments of Pachamalai hills, Tamil Nadu, India using geospatial technology. Geol, Ecol, Landsc. 2018;2(2):81–103. [Google Scholar]
40. Tchameni R, Pouclet A, Penaye J, Ganwa A, Toteu S. Petrography and geochemistry of the Ngaoundéré Pan-African granitoids in central North cameroon: implications for their sources and geological setting. J Afr Earth Sci. 2006;44(4–5):511–29. [Google Scholar]
41. Nono A, Likeng J, Wabo H, Youmbi GT, Biaya S. Influence of lithological nature and geological structures on groundwater quality and dynamics in the highlands of West cameroon. Int J Biol Chem Sci. 2009;3(2). [Google Scholar]
42. Kwékam M, Dunkl I, Fozing EM, Hartmann G, Njanko T, Tcheumenak KJ, et al. Syn-kinematic ferroan high-K I-type granites from Dschang in southwestern Cameroon: U–Pb age, geochemistry and implications for crustal growth in the late Pan-African orogeny; 2021. doi:10.1144/SP502-2019-19. [Google Scholar] [CrossRef]
43. Nouayti N, Khattach D, Hilali M. Cartographie des zones potentielles pour le stockage des eaux souterraines dans le haut bassin du Ziz (Maroc) : apport de la télédétection et du système d’information géographique. Bulletin de l’Institut Scientifique, Rabat, Section Sciences de la Terre. 2017;39(45–57):13. [Google Scholar]
44. Sander P. Lineaments in groundwater exploration: a review of applications and limitations. Hydrogeol J. 2007;15(1):71–4. doi:10.1007/s10040-006-0138-9. [Google Scholar] [CrossRef]
45. Jellouli A, El Harti A, Adiri Z, Chakouri M, El Hachimi J, Bachaoui EM. Application of optical and radar satellite images for mapping tectonic lineaments in kerdous inlier of the Anti-Atlas belt, Morocco. Remote Sens Appl: Soc Environ. 2021;22:100509. [Google Scholar]
Cite This Article
 Copyright © 2024 The Author(s). Published by Tech Science Press.
This work is licensed under a Creative Commons Attribution 4.0 International License , which permits unrestricted use, distribution, and reproduction in any medium, provided the original work is properly cited.
 Downloads
 Citation Tools