 Open Access
ARTICLE
Inversion of Water Quality TN-TP Values Based on Hyperspectral Features and Model Validation
1 College of Earth Sciences, Chengdu University of Technology, Chengdu, 610059, China
2 College of Management Science, Chengdu University of Technology, Chengdu, 610059, China
3 College of Ecology and Environment, Chengdu University of Technology, Chengdu, 610059, China
4 School of Information Engineering and Artificial Intelligence, Lanzhou University of Finance and Economics, Lanzhou, 730000, China
* Corresponding Author: Na Guo. Email:
Revue Internationale de Géomatique 2023, 32, 39-52. https://doi.org/10.32604/RIG.2023.046014
Received 15 September 2023; Accepted 03 November 2023; Issue published 20 December 2023
Abstract
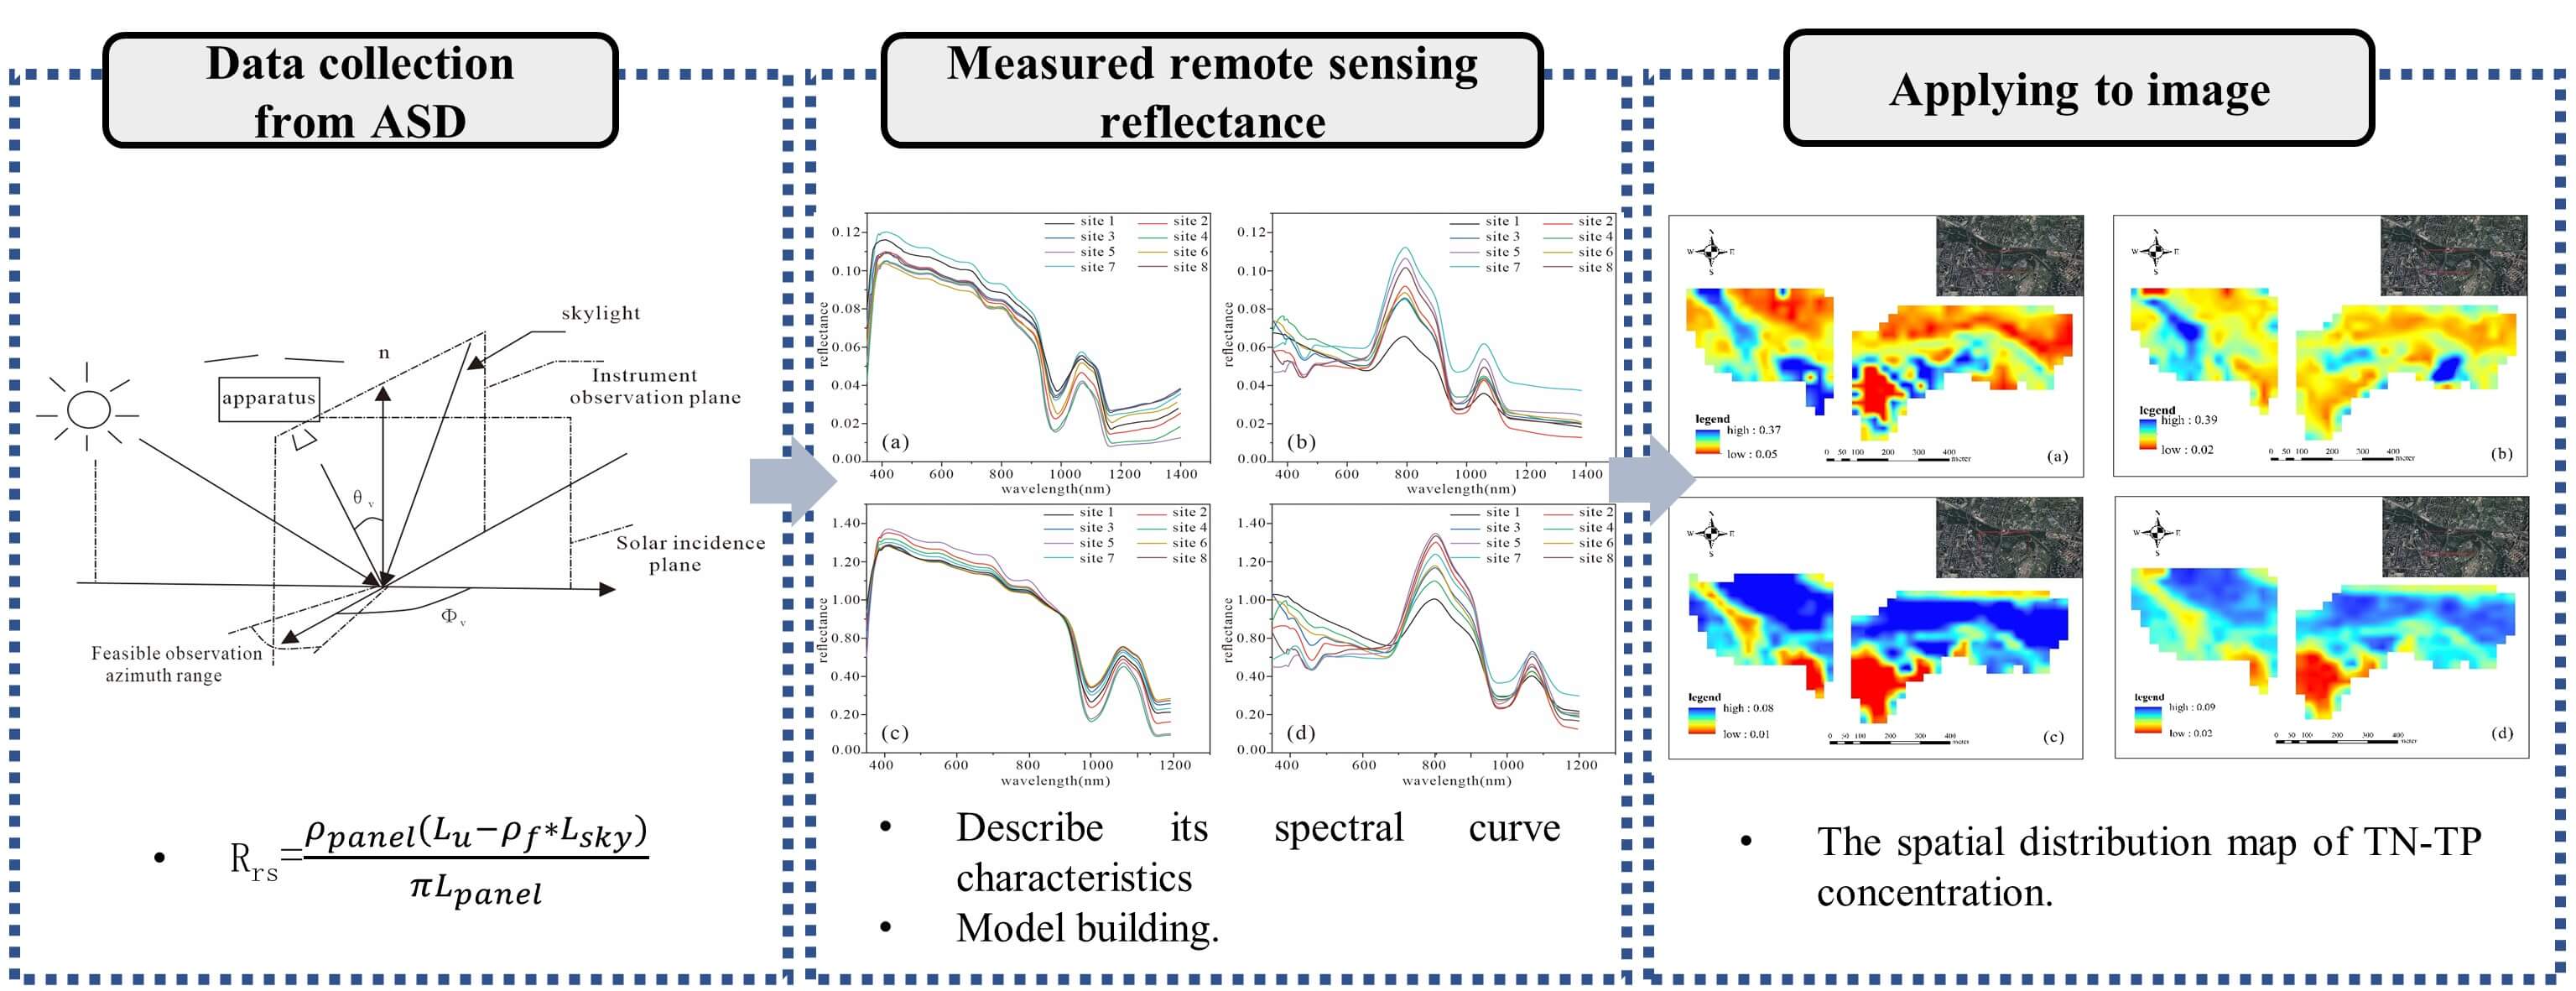
Using hyperspectral data collected in January and June 2022 from the Sha River, the concentrations of total nitrogen (TN) and total phosphorus (TP) were estimated using the differential method. The results indicate that the optimal bands for estimation vary monthly due to temperature fluctuations. In the TN model, the power function model at 586 nm in January exhibited the strongest fit, yielding a fit coefficient (R2) of 0.95 and F-value of 164.57 at a significance level (p) of less than 0.01. Conversely, the exponential model at 477 nm in June provided the best fit, with R2 = 0.93 and F = 80.95 at p < 0.01. In the TP model, the exponential model fit of the differential values at 851 nm with TP in January produced the best results, with R2 = 0.78 and F = 20.61. However, the overall fit in June outperformed that in January. Specifically, the quadratic and linear model fits of the differential values at 824 and 863 nm with TP achieved R2 = 0.96 and F-values of 34.42 and 203.34, respectively.Graphic Abstract

Keywords
Cite This Article
 Copyright © 2023 The Author(s). Published by Tech Science Press.
This work is licensed under a Creative Commons Attribution 4.0 International License , which permits unrestricted use, distribution, and reproduction in any medium, provided the original work is properly cited.


 Submit a Paper
 Propose a Special lssue
 View Full Text
 Download PDF
 Downloads
 Citation Tools