
 Submit a Paper
 Propose a Special lssue
 Open Access
ARTICLE

Enhancing Private Cloud Based Intrusion Prevention and Detection System: An Unsupervised Machine Learning Approach
1 Department of Electrical and Electronic Engineering, Faculty of Engineering and Technology, University of Buea, Buea, P.O. Box 63, Cameroon
2 Department of Training, Research, Development and Innovation, InchTech’s Solutions, Yaounde, P.O. Box 30109, Cameroon
3 Department of Computer Engineering, College of Technology, University of Buea, Buea, P.O. Box 63, Cameroon
4 Department of Computer Science, Faculty of Sciences, University of Yaoundé 1, Yaoundé, P.O. Box 812, Cameroon
5 South Polytech, Institut Universitaire des Grandes Ecoles des Tropiques (IUGET), Douala, P.O. Box 25080, Cameroon
6 Department of Electrical and Electronic Engineering, College of Technology, University of Buea, Buea, P.O. Box 63, Cameroon
* Corresponding Author: Aurelle Tchagna Kouanou. Email:
Journal of Cyber Security 2024, 6, 155-177. https://doi.org/10.32604/jcs.2024.059265
Received 01 October 2024; Accepted 20 November 2024; Issue published 09 January 2025
 View Full Text
 Download PDF
Abstract
Cloud computing is a transformational paradigm involving the delivery of applications and services over the Internet, using access mechanisms through microprocessors, smartphones, etc. Latency time to prevent and detect modern and complex threats remains one of the major challenges. It is then necessary to think about an intrusion prevention system (IPS) design, making it possible to effectively meet the requirements of a cloud computing environment. From this analysis, the central question of the present study is to minimize the latency time for efficient threat prevention and detection in the cloud. To design this IPS design in a cloud computing environment, Azure environment (Microsoft) and its concept of Virtual Private Cloud (VPC) were used. Then, an IPS design was deployed with a ruleset from a mined dataset (via K-means clustering) and processed. Finally, the correlation between the traffic analyzed (virtual network traffic in real-time, logs) and the filtering rules or ruleset of this IPS made it possible to obtain and discuss on a precision rate of around 0.9 in True Positive Rate (TPR) in the prevention Cross-Site Scripting (XSS) attacks targeting the cloud, for a latent time of approximately 6.4 ms. Subsequently, it is important to think about extending the detection capabilities, attack complexity, and high traffic consideration of this IPS.Keywords
About fifty years ago, the notion of the network was reduced to equipment of enormous size and complex architecture, exchanging a small amount of information, while requiring an enormous material resource [1]. After much research, there was a significant improvement in the size of the data exchanged, through a simplified network architecture. The Internet is the name that comes to mind when it comes to exploring the concept of a scalable network [1,2]. Other questions relating to the place of storage of information coming from the traffic generated by this network, or even to notions linked to the deployment of telecommunications services through the Internet, constitute the essentials of a more efficient technological environment. The concept of cloud computing, proposing a transformational paradigm involving the delivery of applications and services over the Internet using virtualization [2,3] and access mechanisms using microprocessors or smartphones, initially allows time to answer these questions. This is why more than $803 billion is planned to be spent in 2024 on solutions based on cloud computing technology [4].
It easily shows that this technology has attributes that explain why it is desired and coveted by the general public. For some, the goal here is to provide services to thousands of users to generate profit. For others, a point of honor is placed on the exploitation of vulnerabilities linked to this technology, to harm the confidentiality, integrity, and availability of stored data. These actions or attacks are perpetrated by hackers or hackers. These attacks can be phishing (which consists of attracting a victim through an email or a message formatted using deception means, so that the latter explicitly or implicitly provides the access keys to their personal information), spoofing, or even Distributed Denial of services (DDOS) and Internet of Thing (IoT) related threats [4,5].
Many existing solutions provide defense against these cyberattacks, such as intrusion prevention systems (IPS). The distributed cloud architecture is a source of vulnerability, due to the enormous latency, the large number of false positives, and the lack of consistency in tracking an uncertain intrusion. No wonder all the pillars of modern technology like Amazon, Microsoft, Cisco, Google, and McAfee spend colossal sums to secure cloud computing environments [5].
The distributed and open architecture of the cloud, the avenue of new generation attacks based on cloud computing, the enormous number of false positives, and the need to guarantee high availability of services are the main motivations for the reflection on a new IPS design in tier III’s cloud computing environment. Indeed, the cloud is a huge environment, a lot of data is loaded there at any time. It is therefore noted an increase in latency in the detection of intrusions within this environment. According to an IBM publication, the average time to detect an intrusion is approximately 277 days, or almost 9 months, in 2022. False Positive Rate (FPR) refers to the rate at which minor security events are detected. The objective was to reduce this ratio as much as possible. In other documentation, the question was raised of the choice of machine learning method (supervised or unsupervised) [6], providing a better value of the FPR. Also, the cloud has long posed security challenges such as interoperability, availability (data availability), portability, authentication, confidentiality (data confidentiality), integrity (data integrity), authentication (authentication), and trust.
The central question of the present study is how to minimize the latency time for efficient threat prevention and detection in the cloud. So, which architecture would best suit testing in a cloud computing environment? Which IPS design would be best suited to a tier III cloud computing environment? How to measure the performance of the clustering process, as well as the real-time intrusion prevention process in a cloud computing testing environment?
The main objective of this paper is to design an IPS that can be implemented in a cloud computing environment, with an average accuracy rate of around 90% and the lowest possible latency (352 ns–62.5 ms), using artificial intelligence to go in the same direction as another researcher [7,8]. After an in-depth study of all related fields, the following specific objectives:
• Build a testing environment adapted to the cloud computing environment;
• Propose and model an IPS design to effectively respond to the expectations of the existential context;
• Evaluate the performance of the clustering process, as well as the intrusion prevention process within this environment.
To carry out this analysis, some research was carried out on what has already been done on the concept of IPS in a cloud computing environment. Some of them focus on the latest capabilities and trends of IPS while others concentrate on giving an overview by providing surveys in cloud computing, machine learning, and threat intelligence information collection.
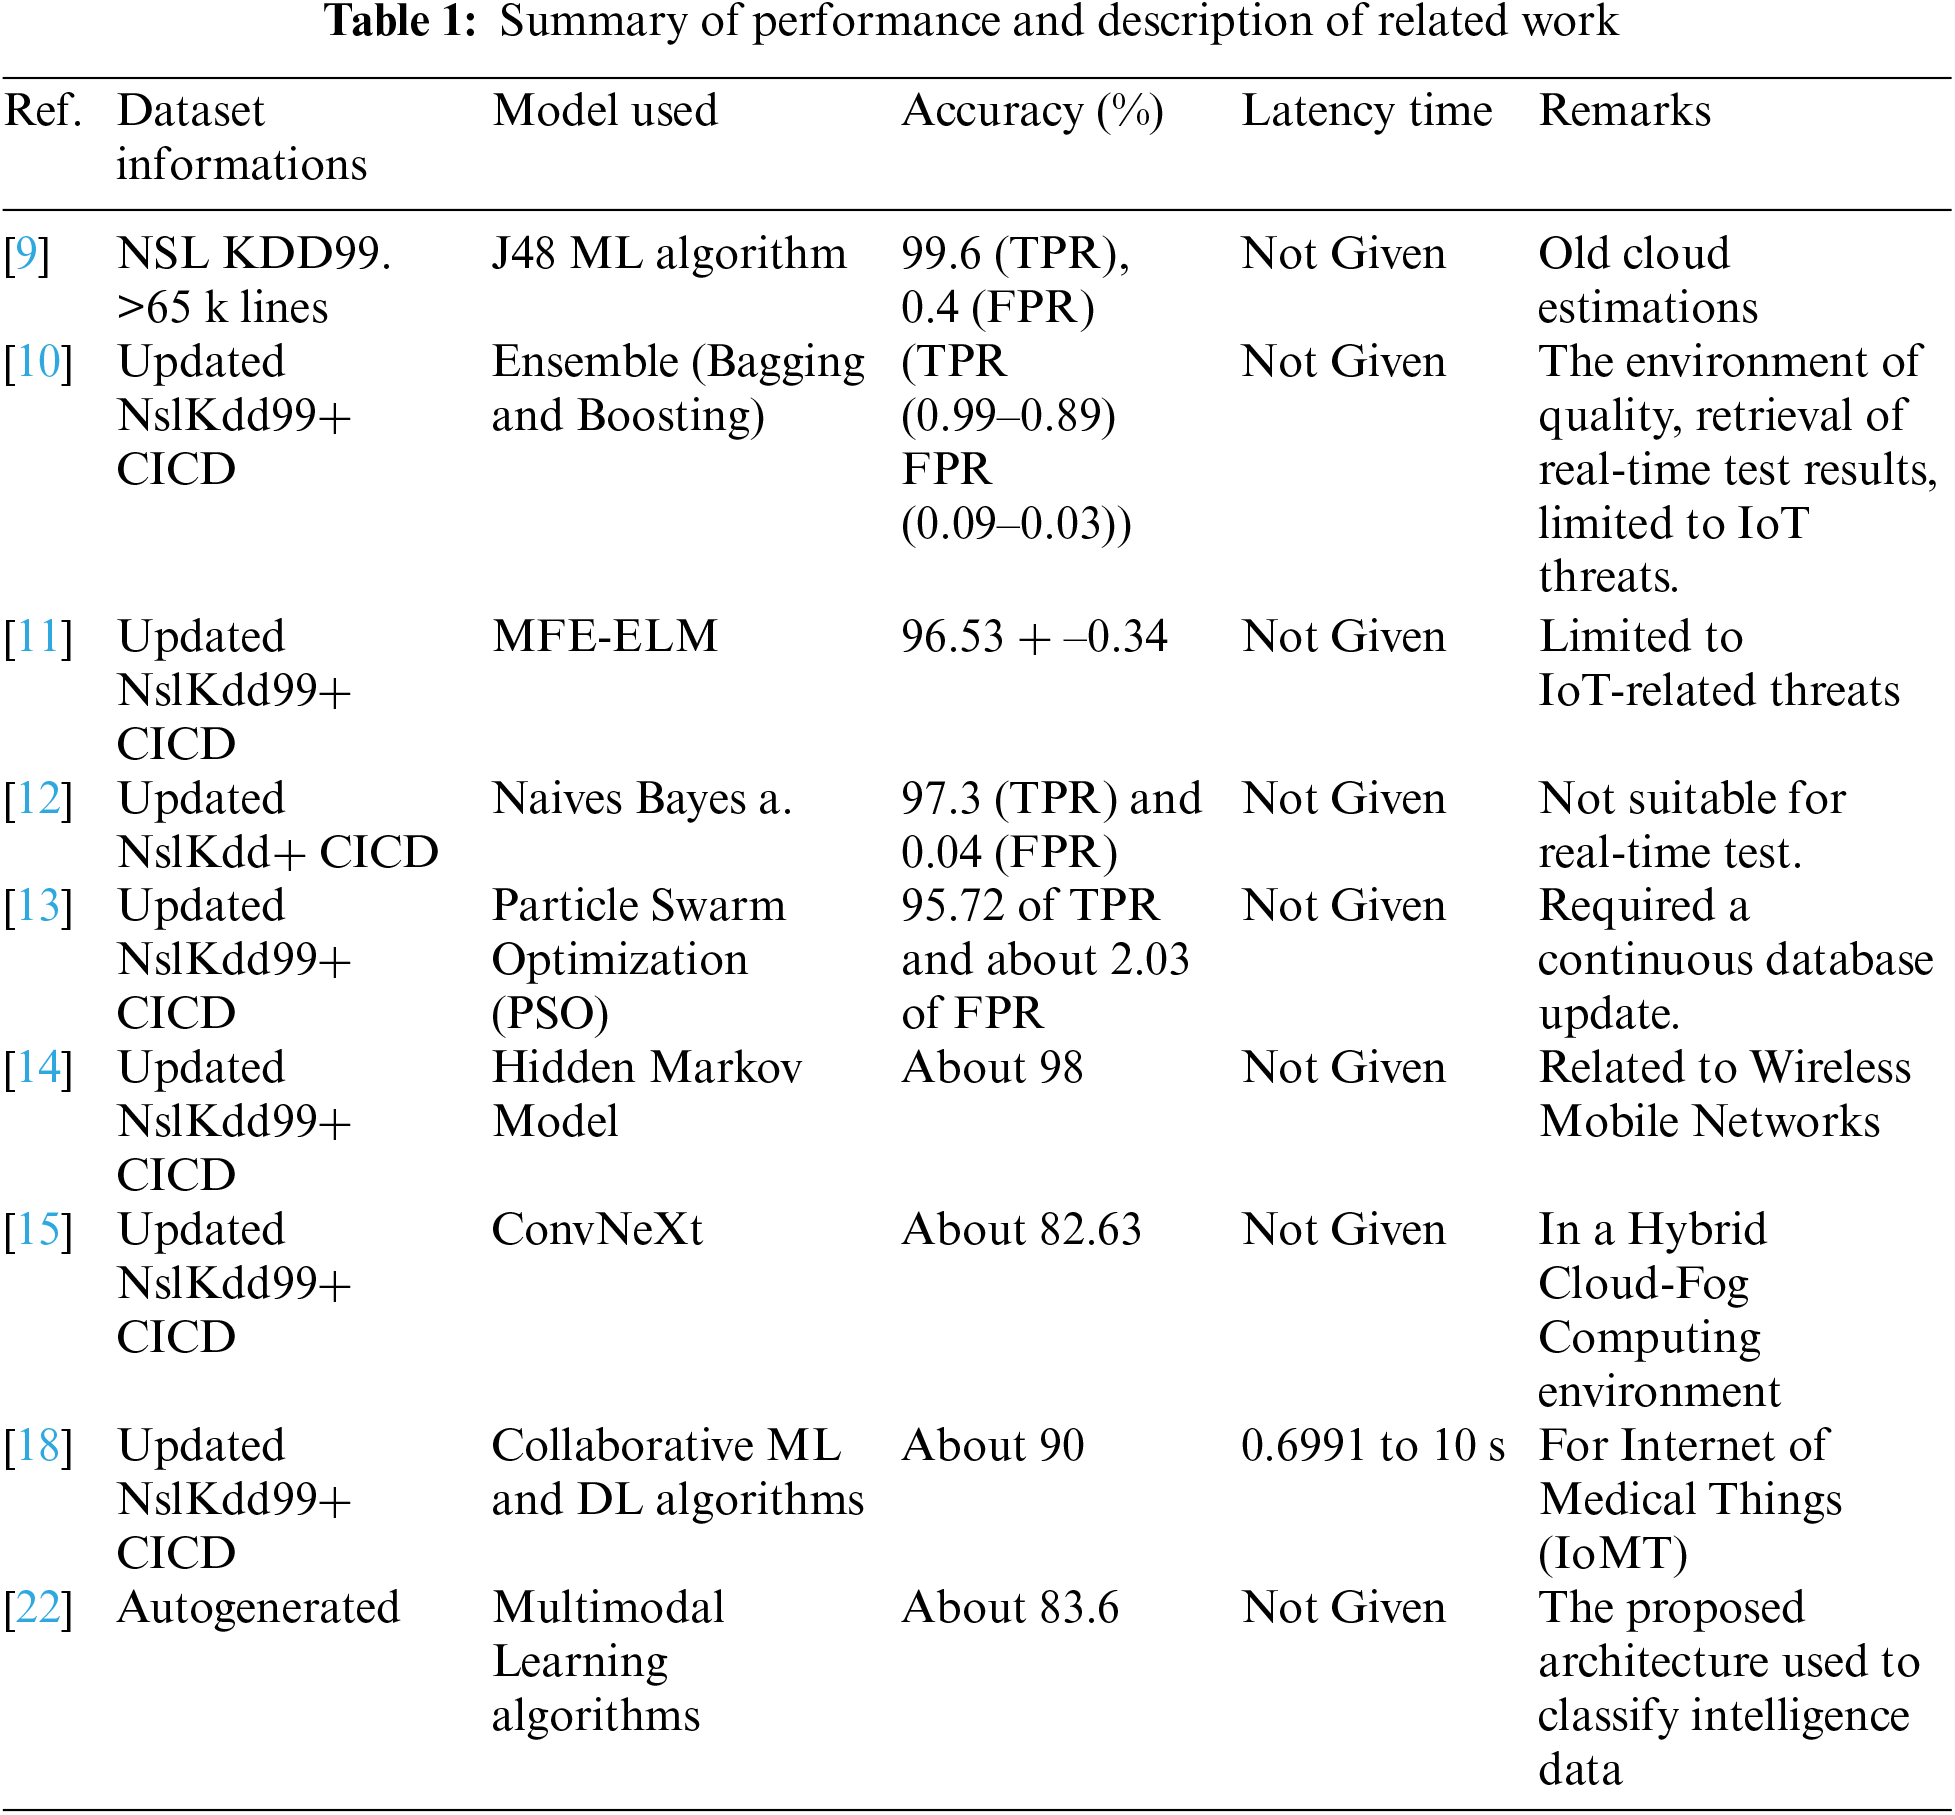
For that sake [9], the NSL-KDD has been mined with a Java-based J48 machine learning algorithm, to build a robust IDS architecture in a cloud computing environment. Thanks to the system put into place, an average TP Rate of about 99.6, an average FP Rate of about 0.4%, an average Precision of 99.6, and an average F-measure of 99.6% have been achieved. Although the results provided by this research are quite impressive, the context is based on old cloud estimations. In 2023, Bukhari et al. [10] performed contrasted research on the performances of the ensemble techniques for enhancing the security of IPS with another ML algorithm (Support Vector Machine (SVM), Artificial Neural Networks (ANN), K-Nearest Neighbor (KNN), Linear regression (LR), Decision tree (DT), and Random Forest (RF)), to neutralize threats and boost the cybersecurity for smart cities. The stacking and boosting algorithm of the ensemble techniques was by far the most performant and affordable in terms of TPR (0.99 for Stacking and 0.89 for boosting), FPR (0.09 for Stacking and 0.03 for Boosting), and F1-score (0.55 for Stacking 0.77 for boosting). Although this research has not given any details about the latency time, it gave a deep insight into not only preventing severe attacks in the IoT infrastructure but also paving the way for the development of a future IPS that is virtually impossible to penetrate. Furthermore, Lin et al. [11] proposed use of the concept of Multi-feature Extraction Extreme Learning Machine (MFE-ELM) algorithm on cloud nodes to detect and discover network intrusions to cloud nodes, assuming that heterogeneous data of the IoT are collected from those nodes. This little enhancement of ELM and SVM provides a quite impressive result in terms of accuracy (96.53 + –0.34 instead of 94.04 + –0.18). In 2024, Shag [12] used a Naive Bayes algorithm of machine learning to prevent and detect DDOS targeting a cloud computing environment. In terms of precision rate for the 21 features selected, the result was about 97.3% (TPR) and 0.04% (FPR). Although this is a quite great result, there was not any suitable real-time test and the end to conclude this interesting research. Within the same year, Wang et al. [13] used the particle Swarm-BP Network Algorithm for intrusion detection and security solidification in a cloud computing environment. This article introduced the concept of Particle Swarm Optimization to detect cyber threat signatures. As a result of this research activity, it has obtained about 95.72% of TPR and about 2.03% of FPR. Due to the outdated version of the detection database and a minority form of attacks (Dos, Probe, U2R…), there are still important enhancements that need to be done in this research paper. Also, in 2022, to protect Wireless Mobile Networks, some collaborative research led by Wang [14], helped the science to reach a better precision detection rate of about 98% using the (Hidden Markov Model) HMM algorithm. Another interesting research activity was the one led by Zhao et al. [15], for the development of a lightweight Intrusion Detection Model of the Internet of Things with Hybrid Cloud-Fog Computing. This article sees the coming of ConvNeXt, a lightweight algorithm model, achieving a precision rate of about 82.63% in a Hybrid Cloud-Fog Computing environment. One of the latest concepts of IPS in cloud computing is the Cloud Access Security Broker [16], where there is practically no limit in terms of enhancement. Also, in 2023, Devi et al. [17] performed a comprehensive review of the latest IDS/IPS solutions and their capabilities to detect and prevent intrusions in the cloud. The comparisons of the methodology provide the researchers with the security issues/challenges exposed in the cloud computing environment, and the significance of the design of a secure framework for the cloud is also being emphasized for achieving improved security in the cloud.
Hernandez-Jaimes et al. [18] proposed a novel taxonomy of intrusion detection schemes for the Internet of Medical Things (IoMT), which includes a comparative analysis of intrusion detection methods and a unique classification of current datasets for insights into detection performance. Additionally, it has been mentioned that the most common cyber security threats for IoT devices are DoS attacks, DDoS attacks, Ransomware, and MitM attacks. This is quite terrifying news when we know that most of the traffic related to IoT devices is managed in the cloud. Along with this, it has been discovered that collaborative detection models based on cloud-fog-edge architectures were effective in detecting the early stages of attacks and achieving improvements in detection times (from 0.6991 to 10 s, no matter the ML algorithm and the databases used), accuracy (about 90%), and robustness. Moreover, Eddermoug et al. [19], put into place a review article on attack prevention and profiling in cloud computing. The proposed scheme/system (composed of 3 steps) was based on the traditional concept of IPS with little enhancement for threat profiling with high performances and attack mitigation capability. This research, like many other authors [20,21], was useful for keeping in mind the basics of how an IPS works. In addition to that, Sowmya et al. [20] used to analyze about 72 research papers for implementing Deep Learning (DL) and ML in intrusion detection system enhancement. The main objective of that study was to retrieve AI-based mechanisms in intrusion prevention. For the latest cyber-attacks like DDoS, a precision rate of about 90% can be achieved. Some other review articles were focused on performing several publications on the latest cloud security challenges [22–26].
One of the latest ways to describe a cyber threat in a given environment is the concept of Threat Intelligence information. It is widely in use nowadays. Many authors have started to use these concepts to ease the management of their cyber-attacks. Among them, in 2021, we can notice the research of Zhang et al. [22] in China, where an automatic extraction of threat information for cyber threat information reporting has been put into place on Multimodal Learning. This Ex-Action algorithm can achieve a precision rate of about 83.60%, and there is no mention of the latency time. Another interesting aspect of this research was the proposed architecture used to classify intelligence data and its usage for achieving certain cybersecurity objectives (data availability, confidentiality, and integrity).
To carry out this analysis, some research was carried out on what has already been done on the concept of IPS in a cloud computing environment. These findings are summarized in Table 1.
At the end of the presentation of the state of the art, we noticed that none of the previous works has a better design that effectively meets the expectations of the cloud in terms of reducing latency for detection based on current predictions. However, to develop the design of the present study, we will largely rely on the perspectives of previous research. We will evaluate the performance criteria by taking an API attack as an experimental case. The selected model for this research will be based on an unsupervised ML algorithm (K-means Clustering) and the dataset will be auto-generated. This kind of dataset has been taken from the concept of Threat Intelligence Platform (TIP) Sources with a little additional ability to produce and monitor a dataset of threats locally and also, communicate new threats discovered to remote sources.
It will first be presented, the design chosen based on the technological aspects mentioned above. Then will come the presentation of the data processing process. To end this chapter, all the technical tools will be presented, which made it possible to carry out the project overall.
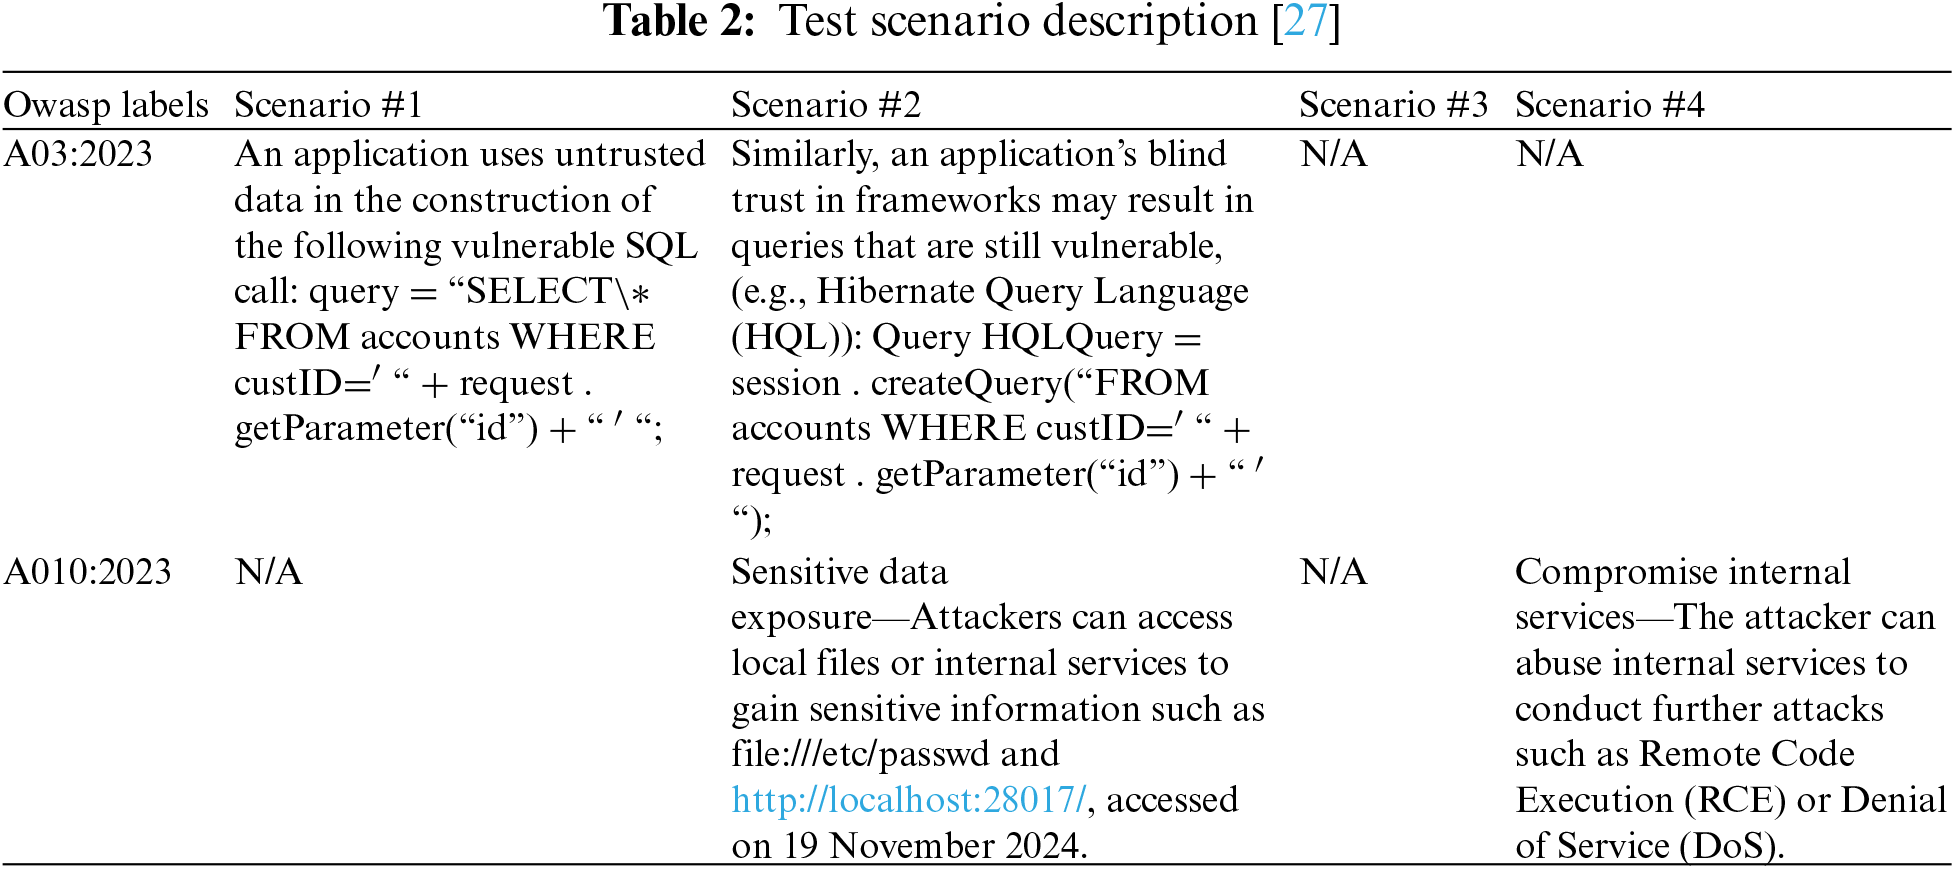
To test and materialize the architecture of this study, depending on available resources, we will focus on attacks based on APIs (Cross Site Scripting: XSS, Server-Side Request Forgery: SSRF), following the standard of the Open Web Application Security Project A03:2023 and A010:2023 [27]. The VPC will be that of Azure. The web proxy acts as an agent. Following this API concept, we will auto-generate the final dataset. Also, to comply with the Azure Service Level Agreement (SLA) relating to the behavior of all users in terms of ethics, we will limit ourselves to the web interfaces dedicated to testing. The algorithm used for the present work will be an unsupervised machine algorithm. Fig. 1 shows the pipeline of this proposed IPS model which will be explained in detail in the following parts. Table 2 provides a better overview of the actual scenarios considered during the Rest API test for the dataset constitution.
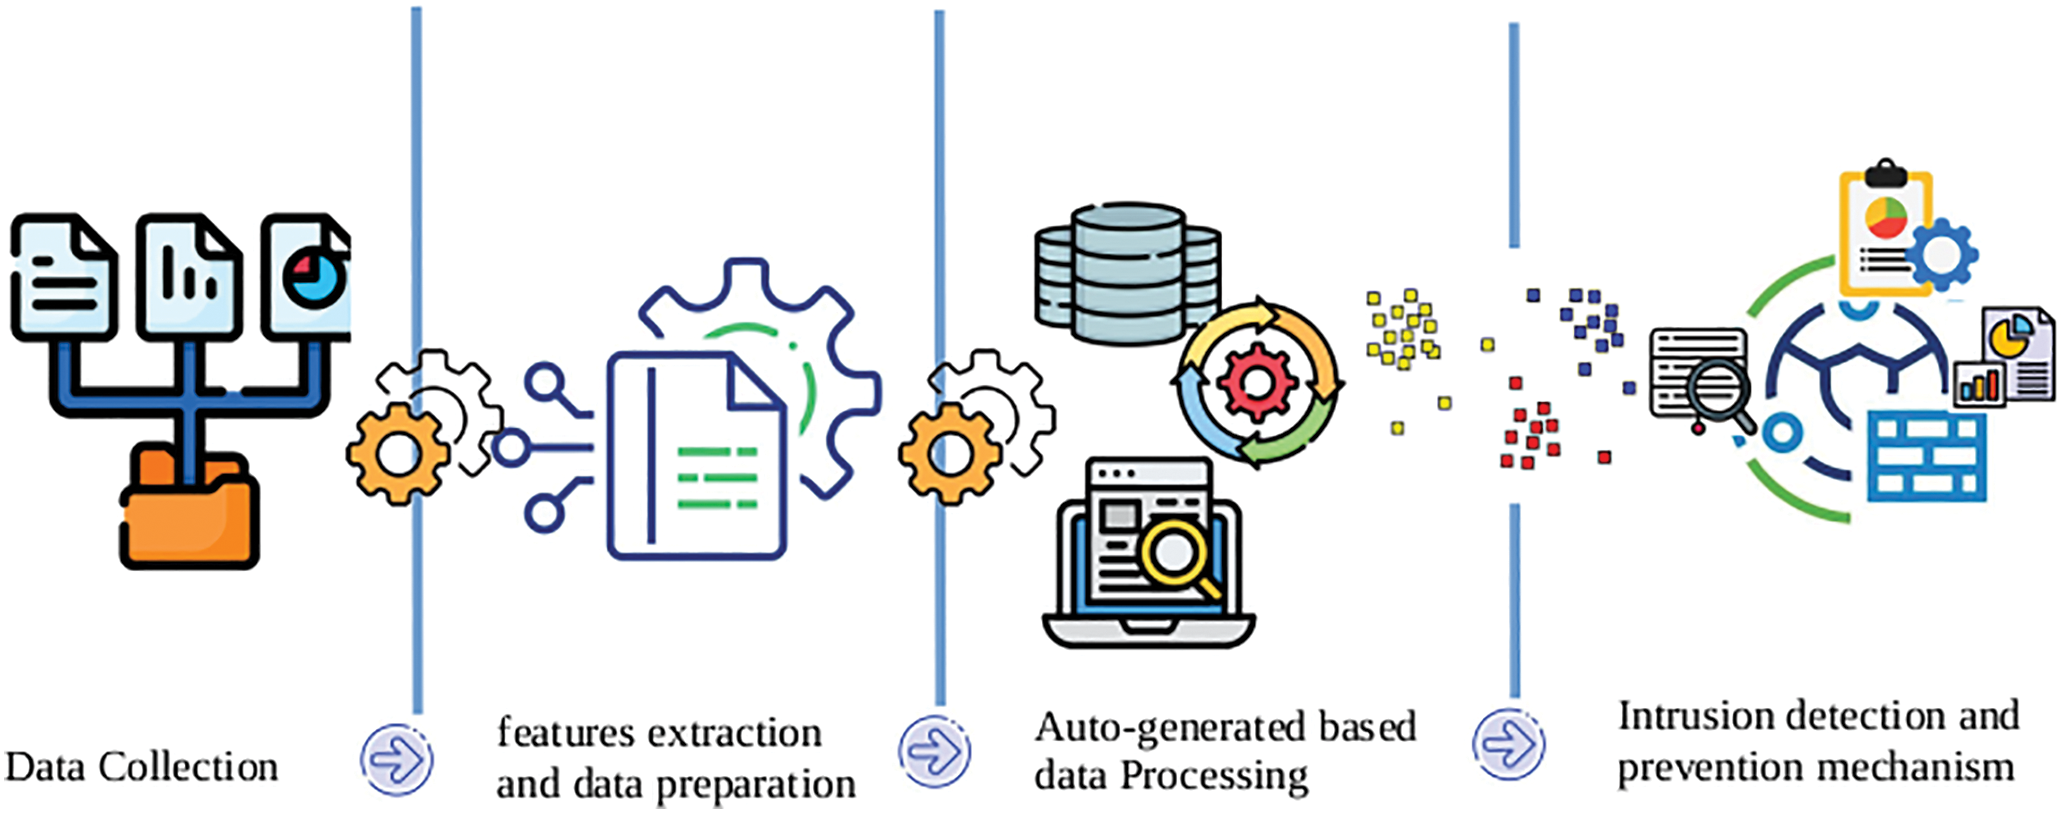
Figure 1: Pipeline of the proposed IPS model in cloud computing
Network traffic is assessed by the quantity of data generated during a specific time interval. The quality of processing of this information is reflected by the efficiency with which it was collected. As mentioned above, the test framework is a website. To do this, we use a web proxy to sniff all of this traffic. This information comes in a standardized base 64 format. After decoding, we organize the data stream sent into a queue.
On the other hand, you need a virus database with information on existing intrusions. This database is known as a dataset. If necessary, we design the dataset using a web traffic collector proxy server and a web vulnerability scanner. The web vulnerability scanner aims to send precise requests to a web interface. These requests can be malicious or harmless. For ethical reasons, we take the site https://demo.testfire.net/login.jsp (accessed on 19 November 2024) (From the Source API Altoroj Rest API) as the test interface. The web vulnerability scanner is called ‘A cunetix’ (version 10.3.x) and the web traffic collector is called ‘Burp Suite Community Edition’ (version 2023.12.1). We will provide more details on these tools later in this chapter. At the initial time, we will first send healthy requests to the test site for approximately 30 min using Acunetix. We materialize this process using Fig. 2 Burp Suite allows you to generate the log file of this experiment. Fig. 3 gives more details on this process.
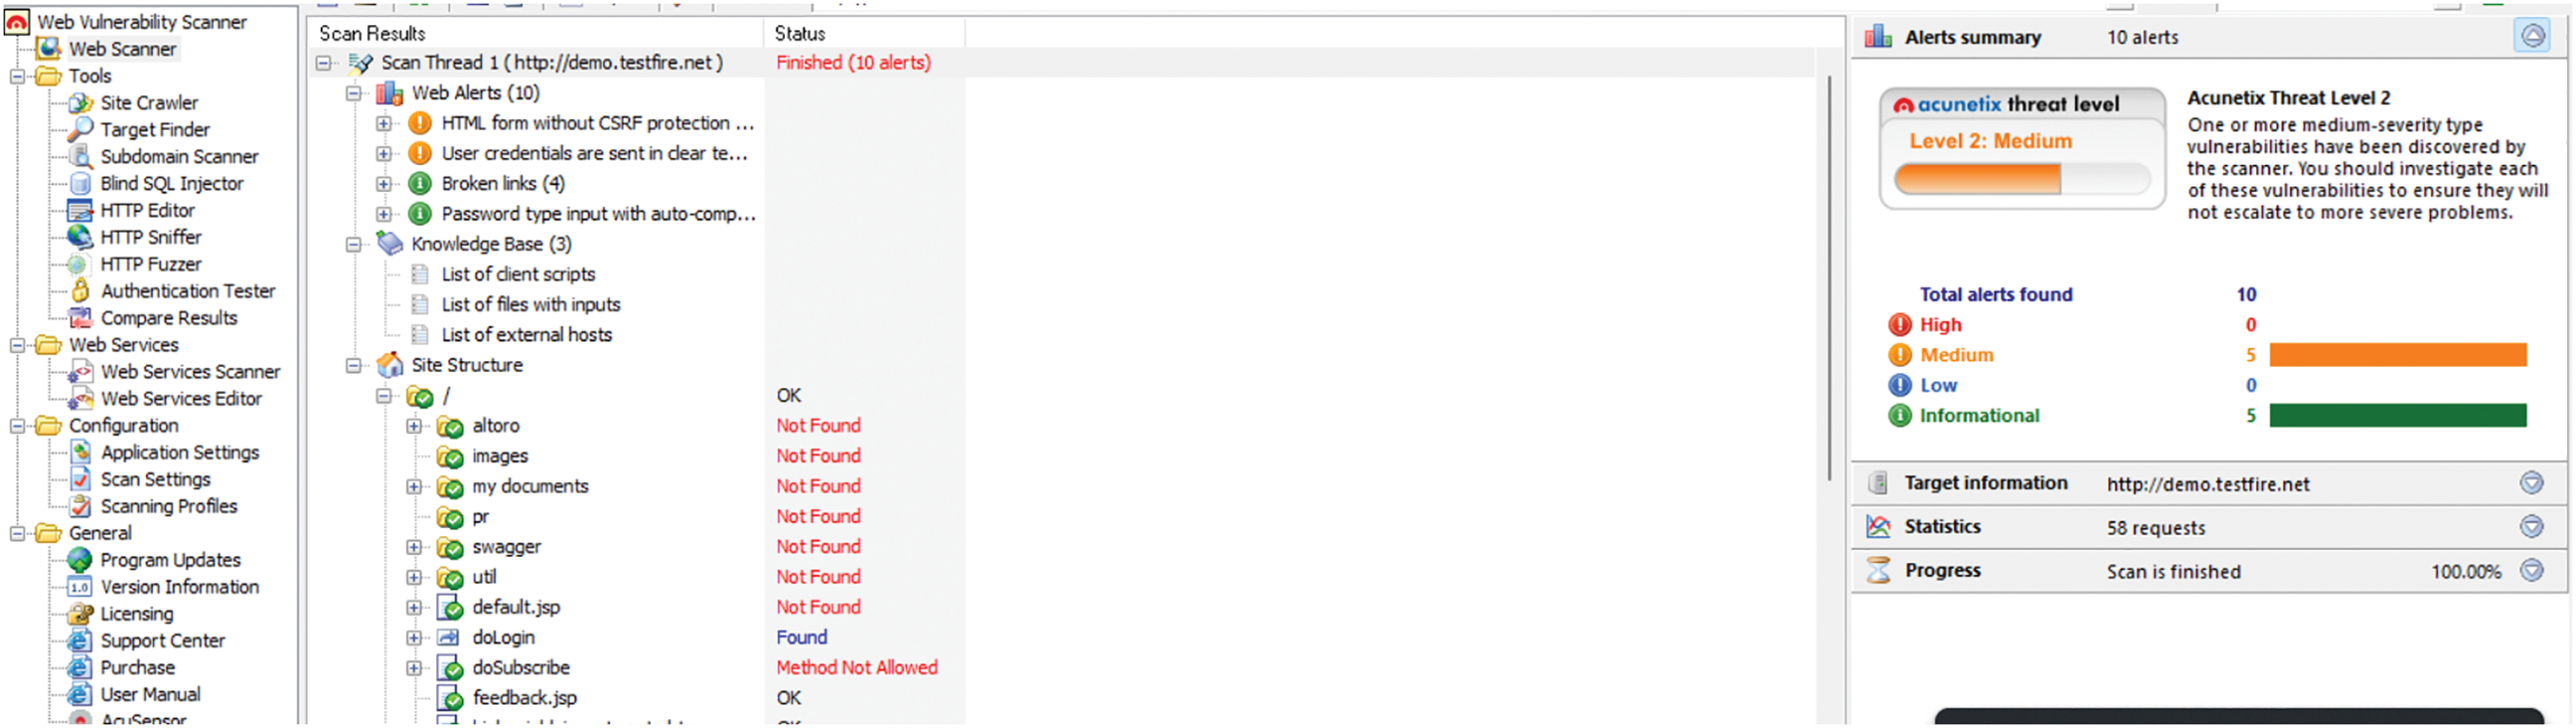
Figure 2: Vulnerability scanning with acunetix
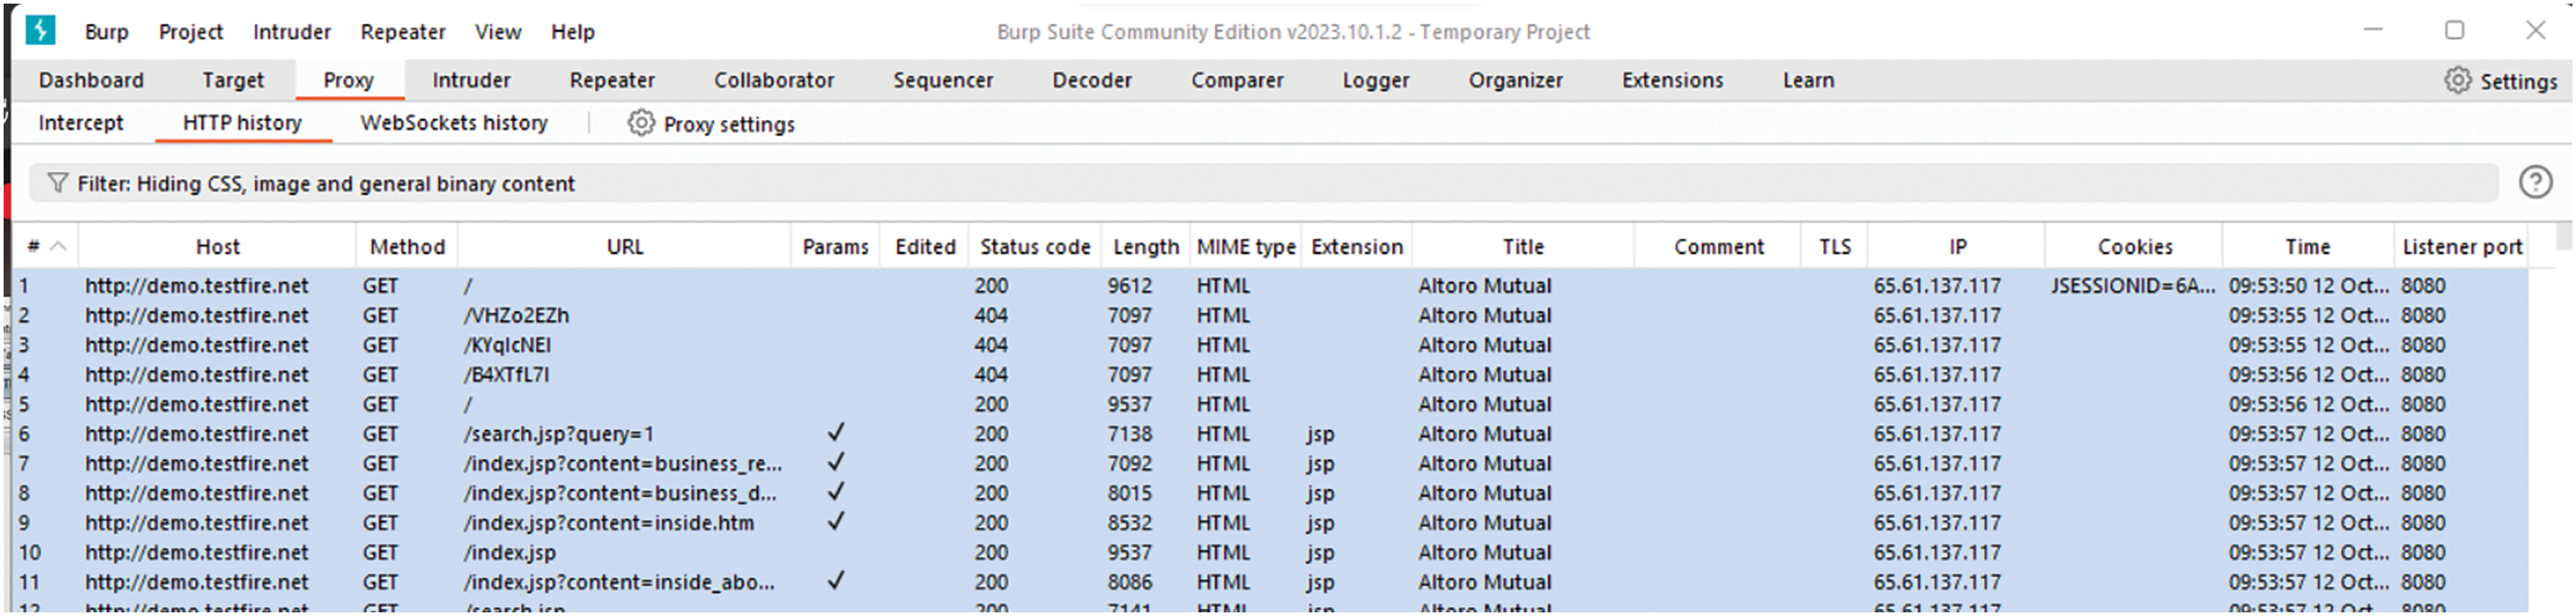
Figure 3: HTTP logs capture with Burp suite
The previous operation is repeated with the only difference that this time, malicious requests are sent to the test web interface. The two datasets have been generated, and merged; The result of this merger will serve as a viral database. The latter contains around 8000 lines.
The dataset is already available, we must now prepare it for future uses. Generally, when the data is extracted, most of the time:
• Data type errors (for example string type instead of digit or Boolean type);
• Reading and interpretation errors, materialized by the appearance of words like ‘NaN’ in the cells;
• The appearance of empty cells.
It is then a question in this part of addressing all these differences using Python (version 3.9.x) compiler in Visual Studio code (version 1.83.x).
3.3.1 Data Description and Exploration
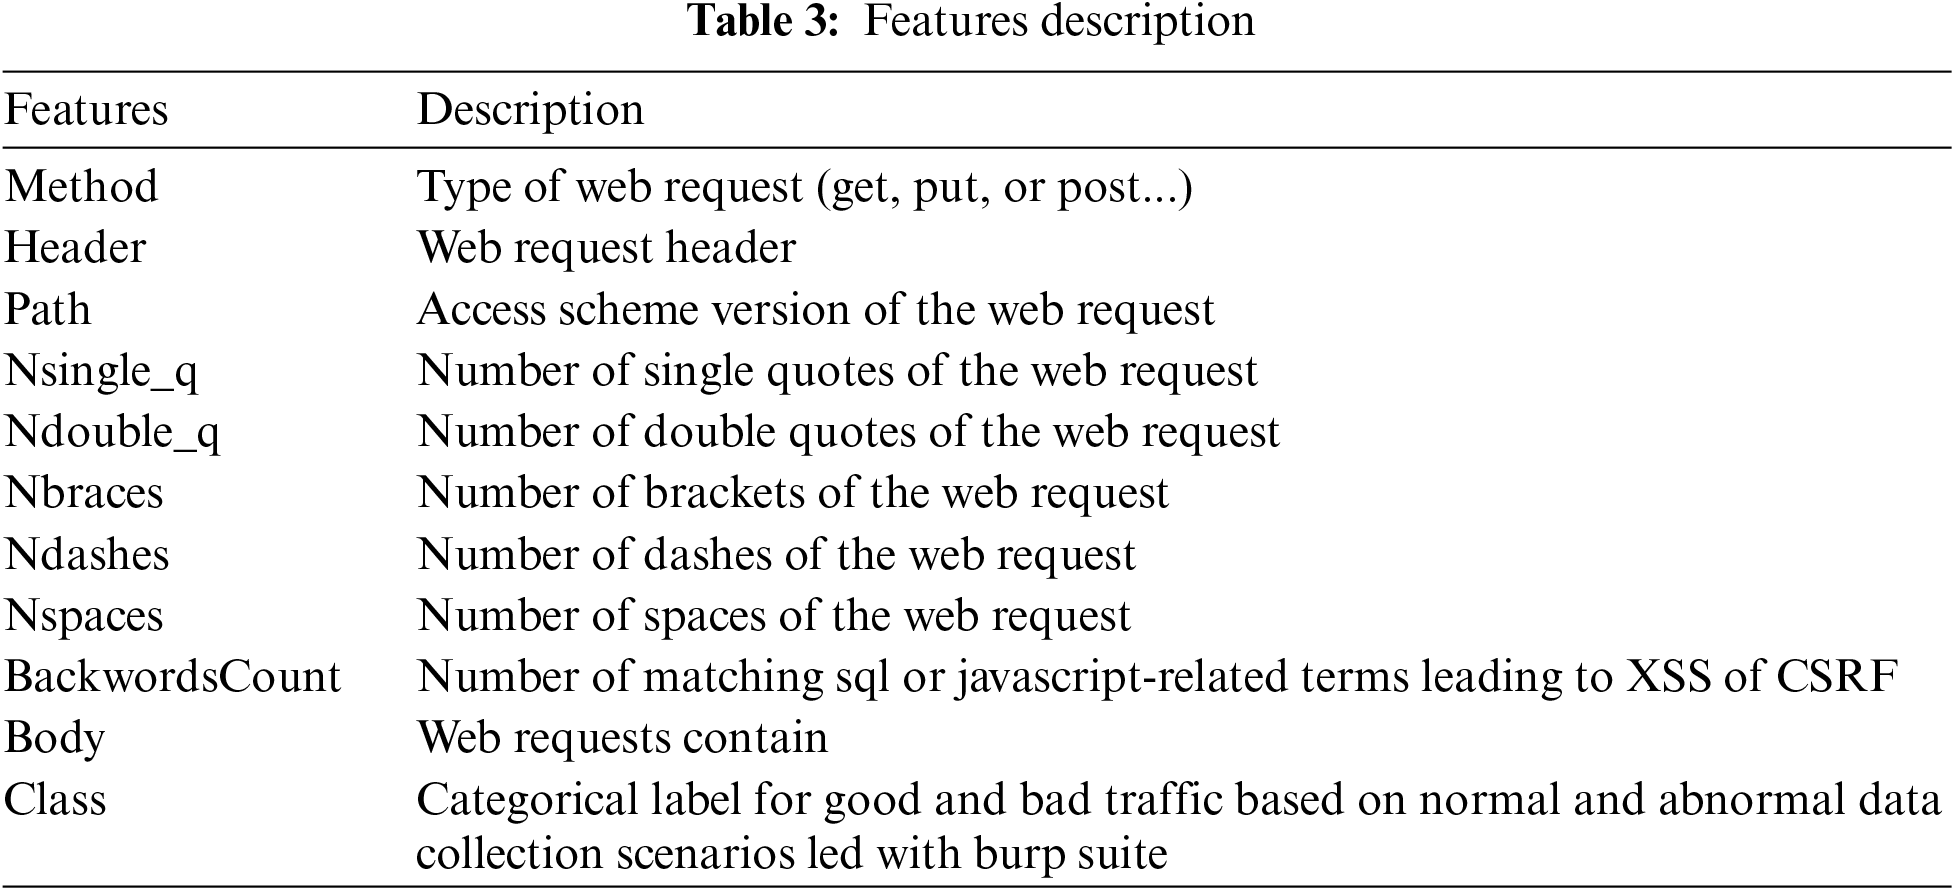
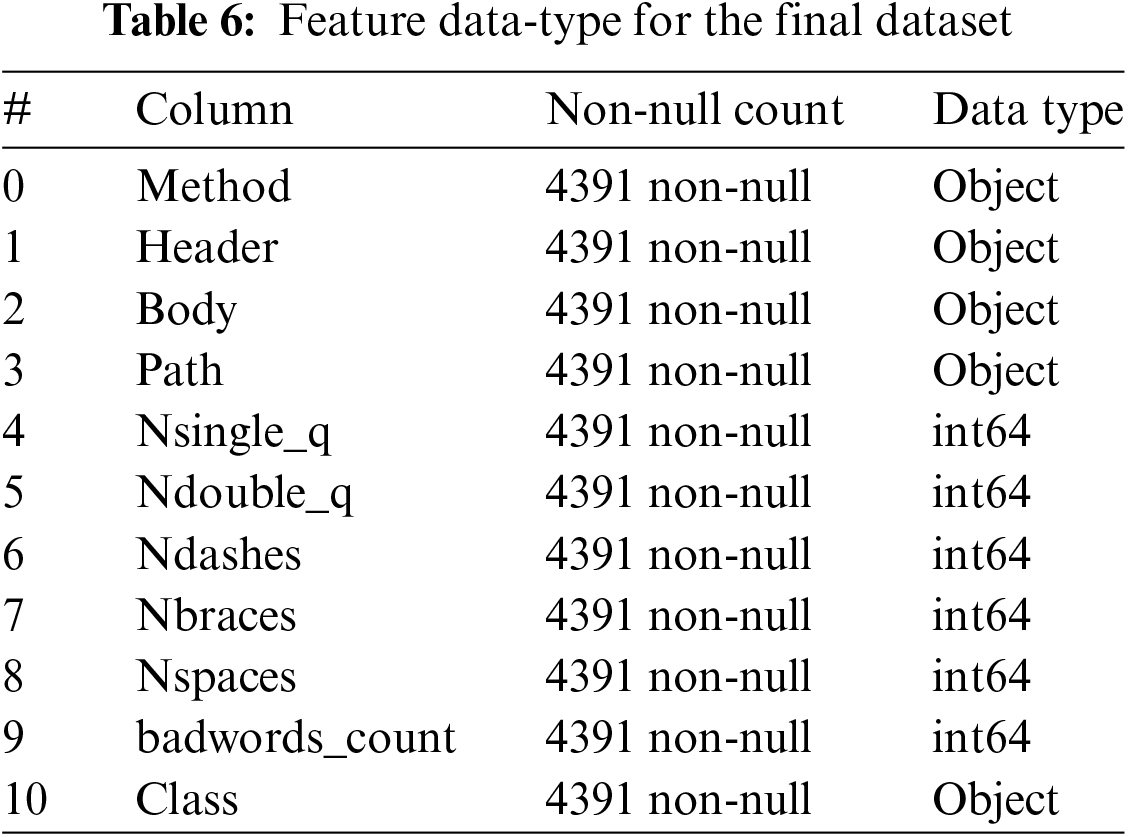
After generating the dataset, 11 data fields are found. Each request sent through a web interface has a certain amount of information. The request contains a method, a header, a path, and content. To differentiate between malicious traffic and healthy content, everything happens at the content level. A little analysis of the information provided by this content shows that it contains particular attributes. Generally, there are two classes of attributes (Good/Bad). From this concept, the pipeline relies on machine learning to carry out automatic classification. This allows for a better distinction than Acunetix. This automatic technique makes it possible to improve the performance criterion of reducing false positives in the operation of the IPS. But before diving into the heart of how this concept works, data preparation must be completed. It is noted that there is a certain amount of non-compliance. All that remains is to resolve these various problems. Table 3 shows the present feature’s description.
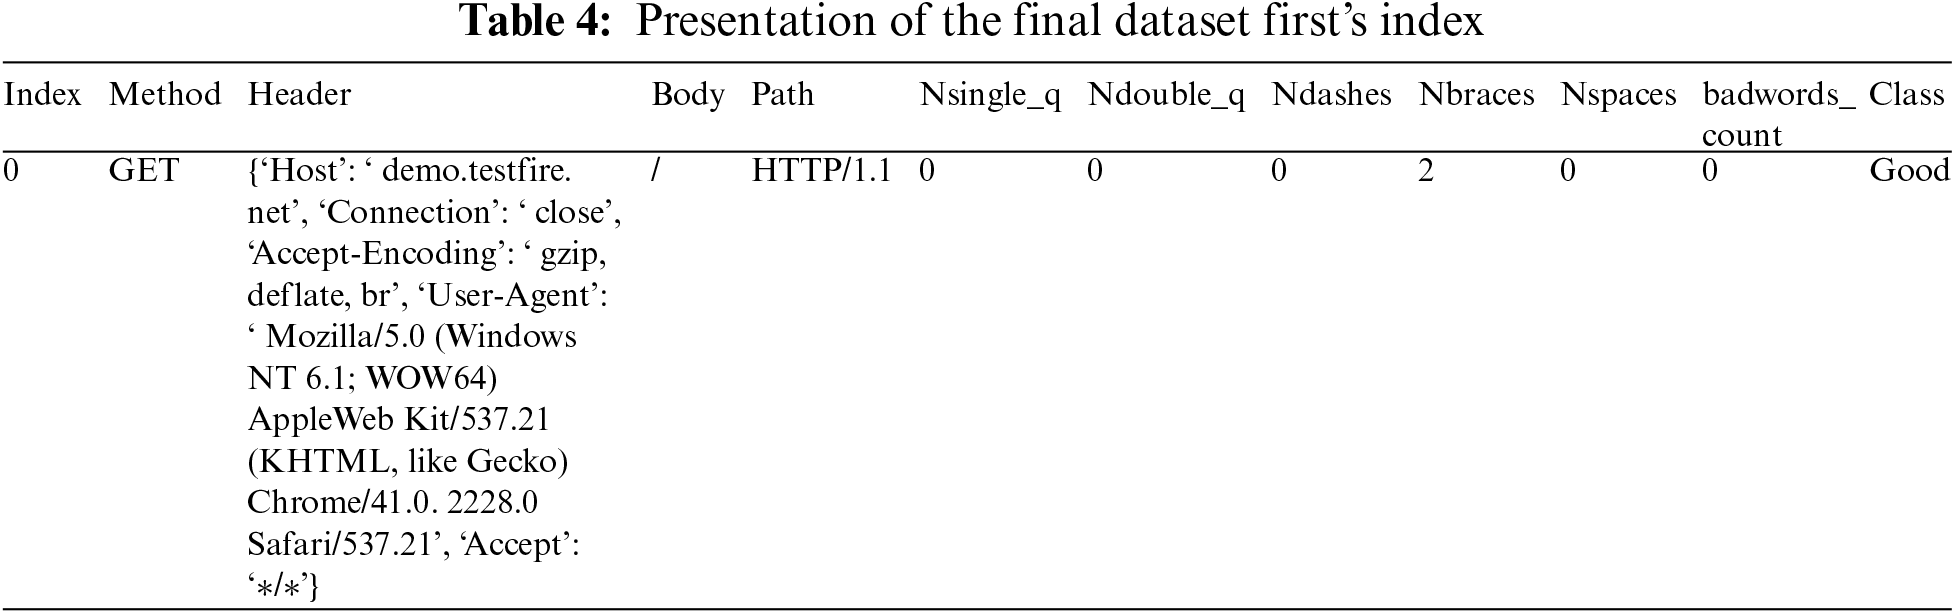
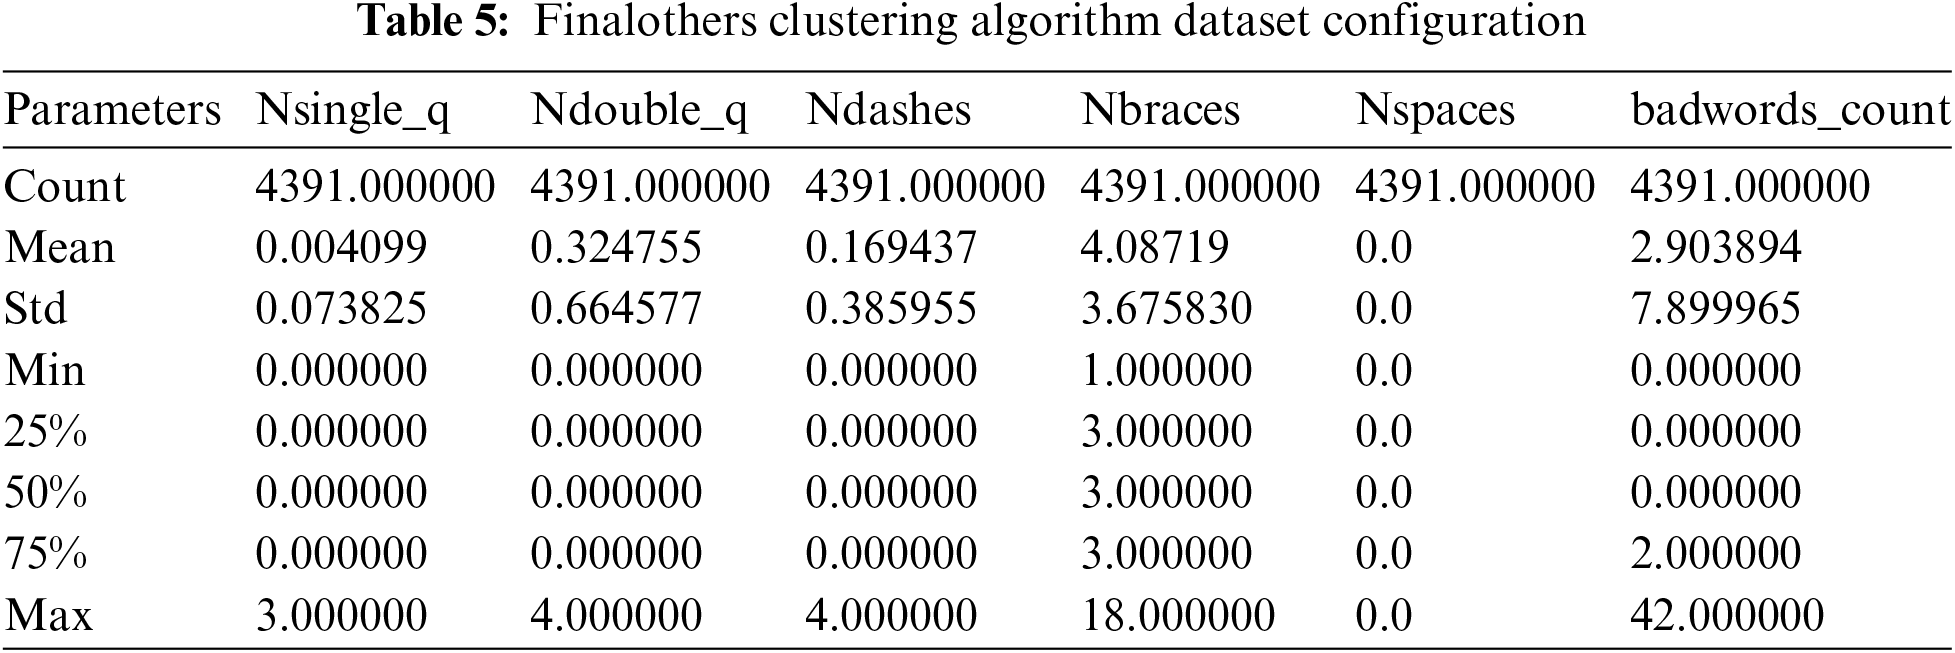
When the final dataset is carefully examined, it was noticed some cells with the keyword ‘NaN’. This expression is the result of a type conversion error or a reading problem. To resolve this problem, a simple modification of the data conversion attributes before display is sufficient. Also, there is the problem of empty lines or empty cells. A file of approximately 4390 lines is obtained afterward. With the dataset ready, we can now focus on the classification and machine learning process using artificial intelligence. Table 4 presents the final result for the first row and Table 5 gives the configuration of each feature of the final dataset. Table 6 presents the used feature data type for the final dataset.
3.4 Clustering: Uniform Effect of K-Means Clustering: Number of Clusters = Two Clusters
Cluster analysis provides a map of the data by dividing objects into groups (clusters) of objects of the same nature. Cluster analysis is also called unsupervised learning because it does not use any external information in generating a cluster. Although there are many other clustering algorithms (DBscan, Denclue, Hierarchical clustering), K-means is a foundation of most of them [28]. In this section, we mathematically formulate the fact that K-means clustering tends to produce clusters of uniform sizes, also called the uniform K-means effect. K-means are usually expressed by an objective function that depends on the proximity of the data points to the cluster centroids [29–34].
Let X = {x1, ⋯, xn}, the dataset, and ml =
Let d(Cp, Cq) =
Note that Dk is a constant for a given object whatever k. Also, n = Σkl = 1nl is the total number of objects in the dataset.
In this case, D2 is also a constant, and n = n1 + n2 is the total number of objects. If we substitute ml of Eq. (2) by
If we ask:
We then obtain:
The expression
We then have at final:
Equation (D) indicates that minimizing the K-means function F2 is equivalent to maximizing the distance function F(2)D. As F(2)D > 0, when m1 is different from m2, if we isolate the effect of || m1 − m2||2, maximizing F(2)D implies maximizing n1n2, which leads to n1 = n2 = n/2.
3.5 Test and Evaluation of the Design
Firstly, it is a question of evaluating the detection or prediction capacity of the entire design. Secondly, it is a question of evaluating the efficiency of prevention. For this purpose, we subdivide the evaluation into two categories: Clustering and real-time prevention.
Regarding clustering, the following evaluation criteria will be used:
• Silhouette score;
• Elbow score or intra-cluster sum of squares (WCSS);
• The t-SNE Manifold (2D materialization).
Regarding real-time detection and prevention, the following evaluation criteria will be used:
• Mean Time To Detect (MTTD)
• Mean Time To Contain (MTTC)
• False Positive Rate (FPR), which is expressed:
• True Positive Rate (TPR), which is expressed:
4.1.1 Construction of a Testing Environment Adapted to the Cloud
From the Azure interface, a VPC was created as expected. For testing purposes, we only needed two virtual instances namely. These different instances or machines use virtual resources such as the processor (CPU), memory, basic security tools, and IP addresses. There are two main modes of connection to these instances: Graphical User Interface (GUI) mode and console mode (via SSH). When using GUI mode, we use the Remote Desktop Protocol (RDP). It is through this protocol that we can make basic updates in a virtual instance, and subsequently deploy the IPS. Fig. 4 gives the presentation of the VPC.
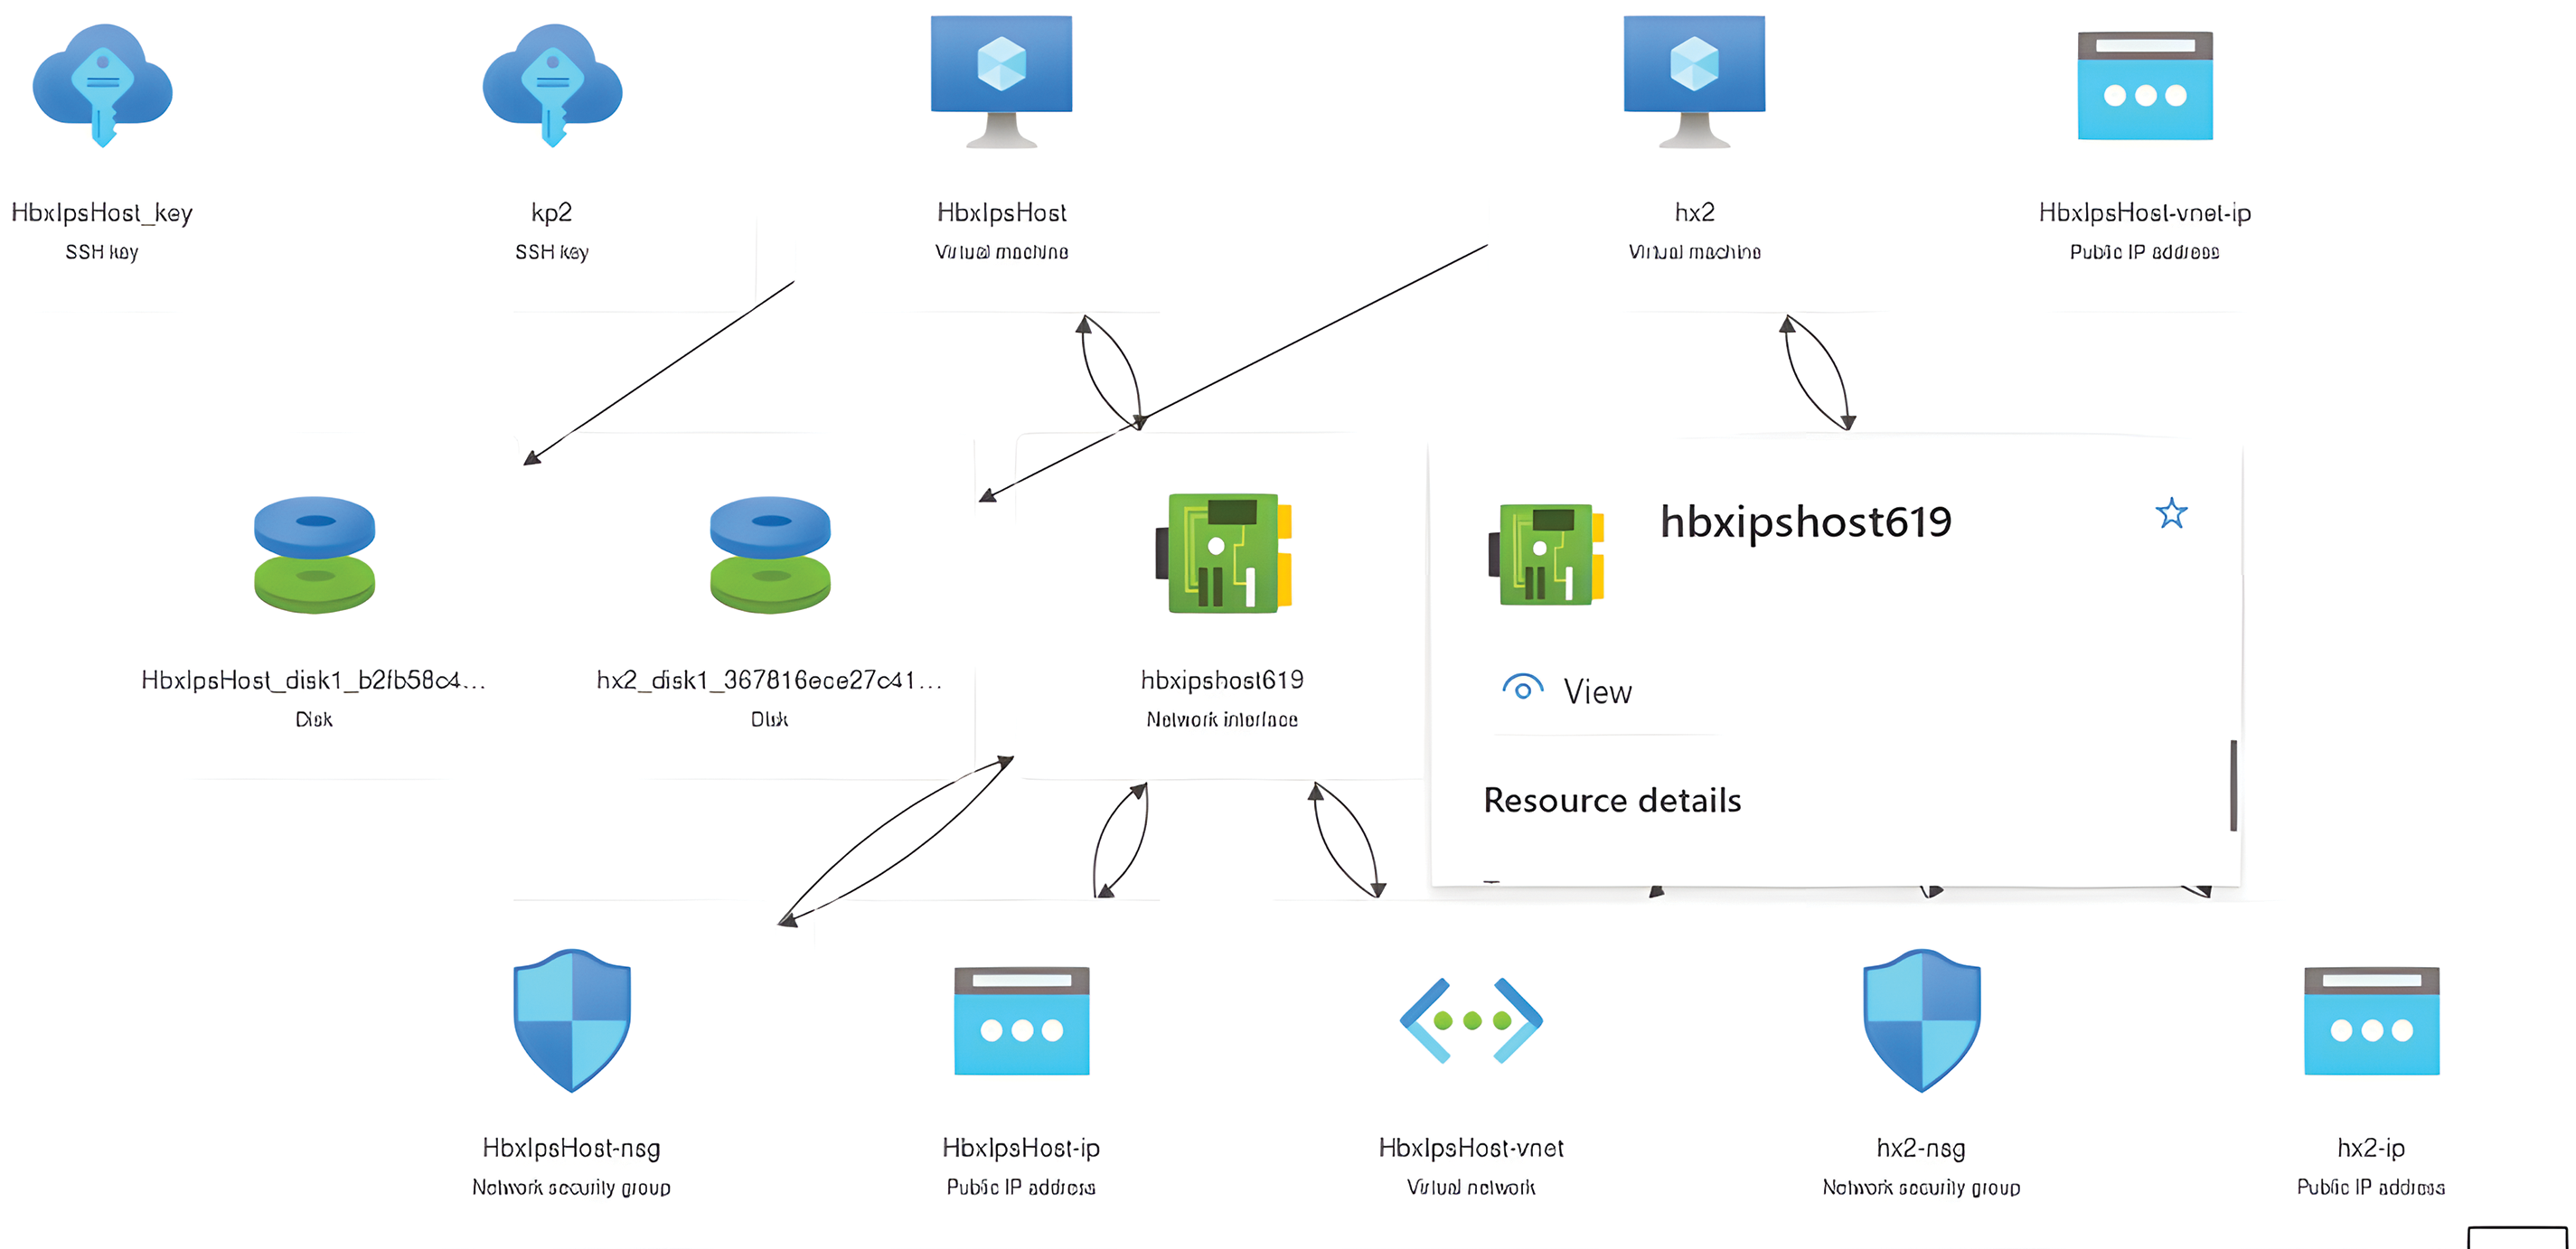
Figure 4: Virtual private cloud on Azure
Fig. 4 graphically sketches the architecture of the cloud testing environment used. Through the Azure interface, a VPC was created. It is noticed icons in Fig. 4, represent a particular cloud resource. The first icon is a blue cloud under a key. Entry into a virtual instance using the SSH protocol is done using this key. Two keys were created to access the two virtual instances. The first is named ‘HbxIpsHost_Key’ and the second is ‘kp2’. The keys submitted to this study must be guarded jealously because they are entry doors to the VPC resources. Virtual instances or even two virtual machines were also created. The VPIs respectively bear the name of their access key. They work exactly like real machines with the only difference being that they are virtualized. We notice a connection between these instances and other virtual resources. The hard disk icons represent the memories of the virtual instances. By default, virtual memories have an expandable capacity of 15 GigaBytes. For testing, this capacity is sufficient. We also observe the existence of two green icons. They materialize Central Processing Units or even processors, with 2 GHz capacity and two expandable cores. A little further down in the figure, we notice an icon in the form of armor in blue, which designates the default security group, configured by Azure. It allows the VPC to deliver traffic that complies with the Azure Service Level Agreement (SLA). There is also a blue icon referring to the public IP address of the virtual machines and an icon in the form “<...>” referring to the subnet to which the VPC belongs, because, are also considered to be virtual resources. It now becomes important to know the role of the VPC in the design of the Intrusion Prevention System.
4.1.2 Proposal for a Design of the Intrusion Prevention System to Effectively Respond to the Expectations of the Existential Context
As part of this part, a graphical materialization of the operation of the IPS was carried out while taking into account the characteristics of the cloud computing environment. We then define a Virtual Private Cloud (VPC), containing a few virtual resources or RaaS. Each data transmitted by any agent in this environment is sniffed, and then compressed to be sent to the monitoring station. The availability of these agents is ensured by the concept of load balancing. It is in this station that the IPS of the present study is located. This station can be an integral part of a demilitarization zone (DMZ). When the data arrives, the first task that is carried out is that of decompression. The role of compression and decompression processes is to reduce the weight of the data as much as possible.
Upstream, the IPS performs recognition tasks on the datasets containing data such as Indicators of compromise (IoCs) from the Common Vulnerability Exposures (CVE) and TTP from the Threat Intelligence Platform (TIPs) to be mined using a machine learning algorithm. The resulting information from this process will serve as a detection aid by comparison with the data collected within the VPC. If the traffic is healthy, a log containing the metadata of this traffic is generated and preserved. Url’s traffic is the main scope of the present research. Every time a host generates this type of traffic, the HTTP proxy is responsible for conveying it to the DMZ. To regulate the future high-traffic scheme, load balancing with IPS’s servers will be quite helpful. For instance, if the balancer is saturated, proxies will stop traffic transmission and will generate a local cache to insert the host’s URL queue awaiting decongestion. Otherwise, depending on the security policy defined in the VPC, the incident response procedure is executed. This incident response procedure (IRP) can result in quarantine or alarm transmission within the chain of a security operations center (SOC). But this does not stop there. The information collected from this intrusion is transmitted to the TIPs in order to enrich the publicly available datasets and allow the security solutions of other structures to be aware of the evidence of this intrusion. Fig. 5 presents the IPS design proposal. Fig. 6 gives the proposed traffic management mechanisms.
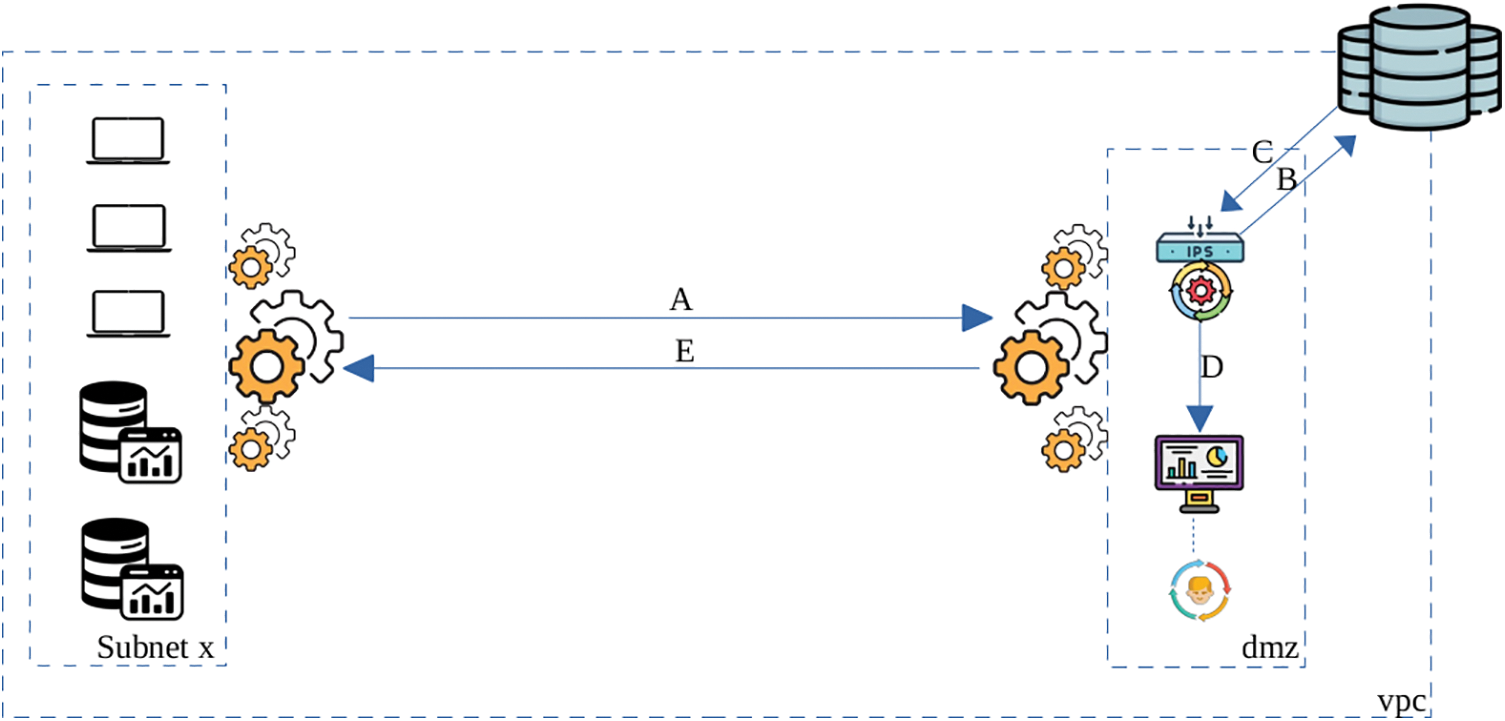
Figure 5: Proposed intrusion prevention system design
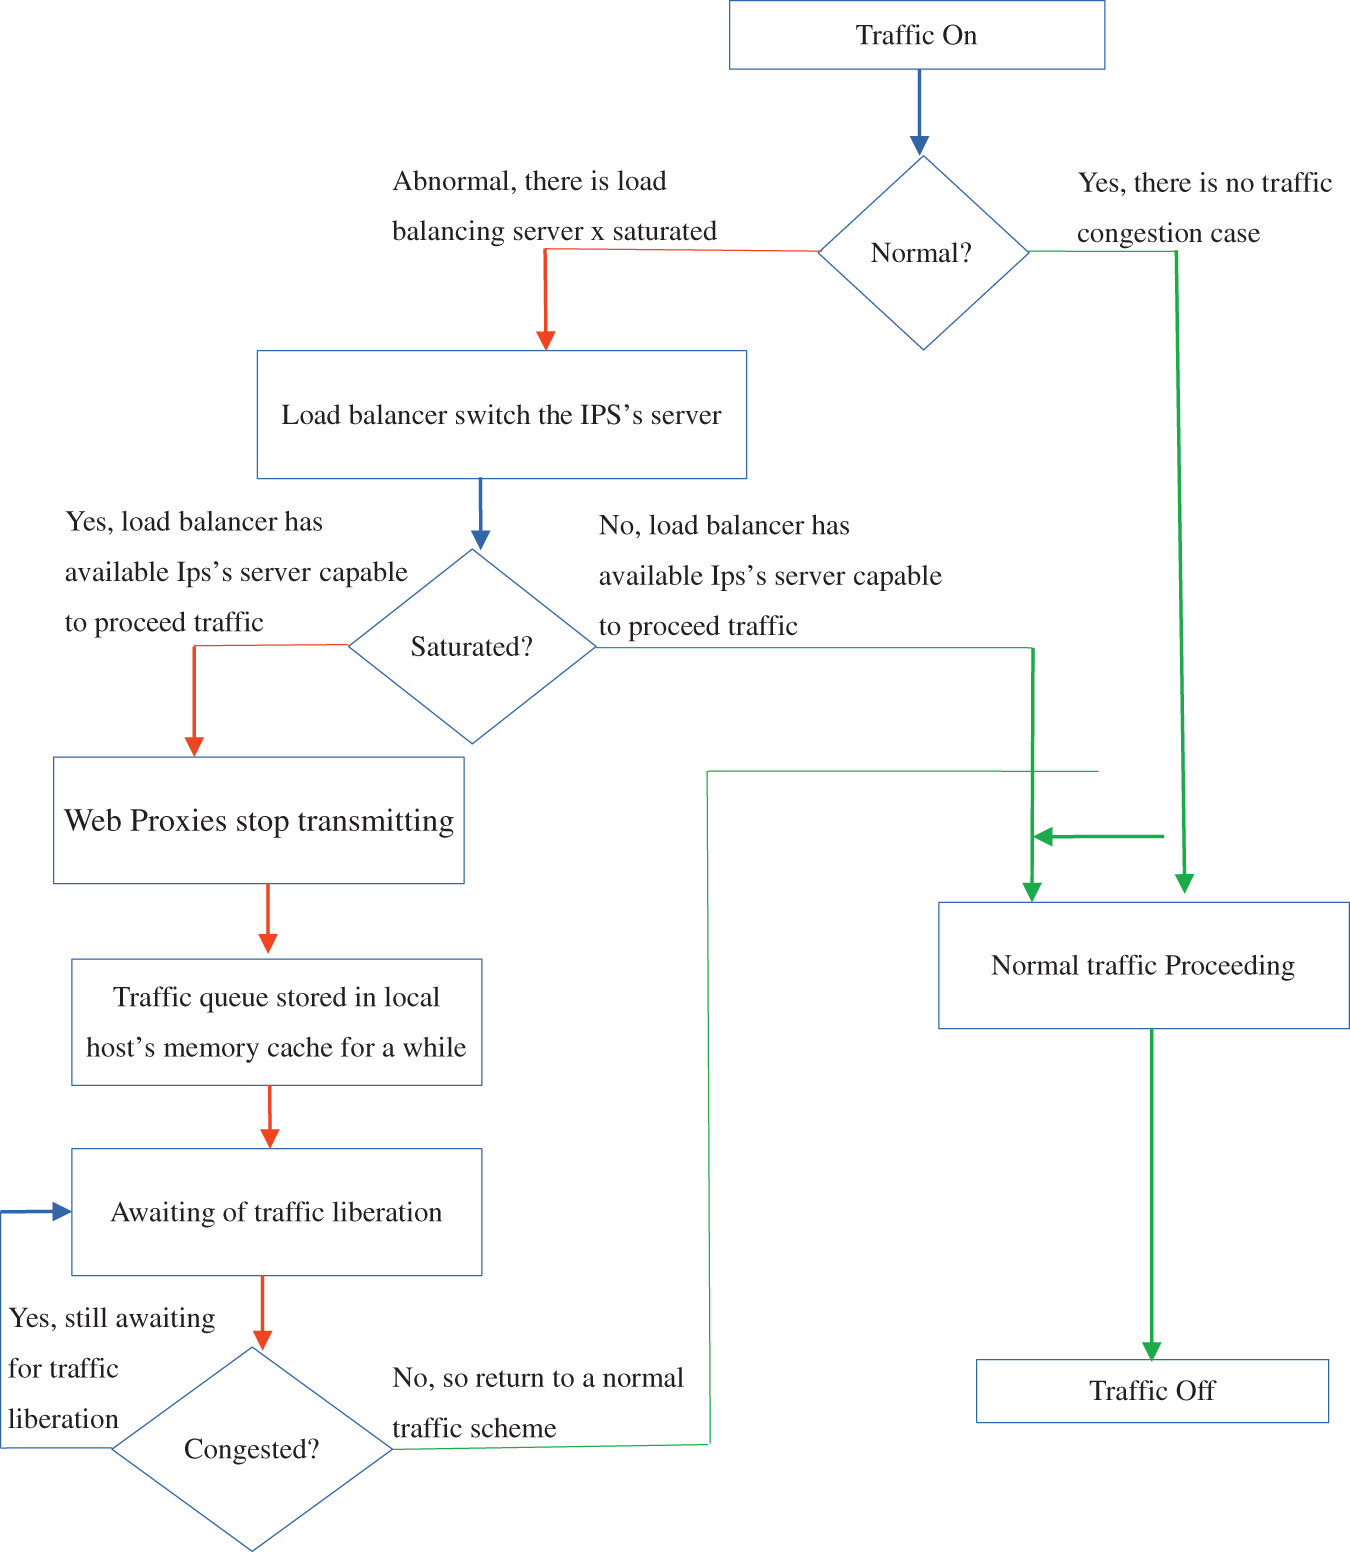
Figure 6: Traffic management of the proposed architecture
A: Metadata collected, compressed, and transmitted to the DMZ.
B: The IPS performs a dataset search at public TIPs based on the metadata.
C: The dataset is found, arranged, and returned to the IPS.
D: The dataset is mined with ML, and compared with the metadata coming from subnet x. The result of this process generates an alert. The evaluation of this alert is displayed.
E: The SOC processes this alert and implements prevention tasks according to the structure security policy.
The design has been presented, all that remains is to deploy it within the Azure VPC that has been set up. In use, it would now be important to know, using the performance parameters, how the design behaves.
4.1.3 Evaluation of the Design
The evaluation process takes place in 3 main phases. The first phase is the analysis of data from the self-generated dataset, the second phase consists of the evaluation of the clustering, and the last phase consists of the evaluation of the performance criteria of the IPS in real-time prevention activity.
Analysis of the Auto-Generated Dataset
The IPS design uses the dataset data from the TIP to build its detection model. Of the 4391 data obtained after data preparation across six features, there is a strong concentration of data at the intersection ‘nbspcaes-nspaces’. This means that one of the indicator attributes of a potential intrusion process is the number of spaces in a web request. Other parameters such as ‘nsingle_q’, ‘ndouble_q’, ‘ndashes’, and ‘nbraces’ are also parameters weighting the traffic evaluation. This analysis can be visualized in Fig. 7. According to Fig. 7, graphically there is feature-feature intersection. In blue, the convergence of each piece of data belonging to the dataset is represented in the form of points. In each case of interception, a high density at the input can be noticed, but a low density at the output. When analyzing the intersection Nsingle_q-Nsingle_q up to backwords_counts-badwords_count, a slight decrease in density can be noticed. The variety of data contained in this dataset makes it possible to estimate with good probability, and better data quality before the modeling process.
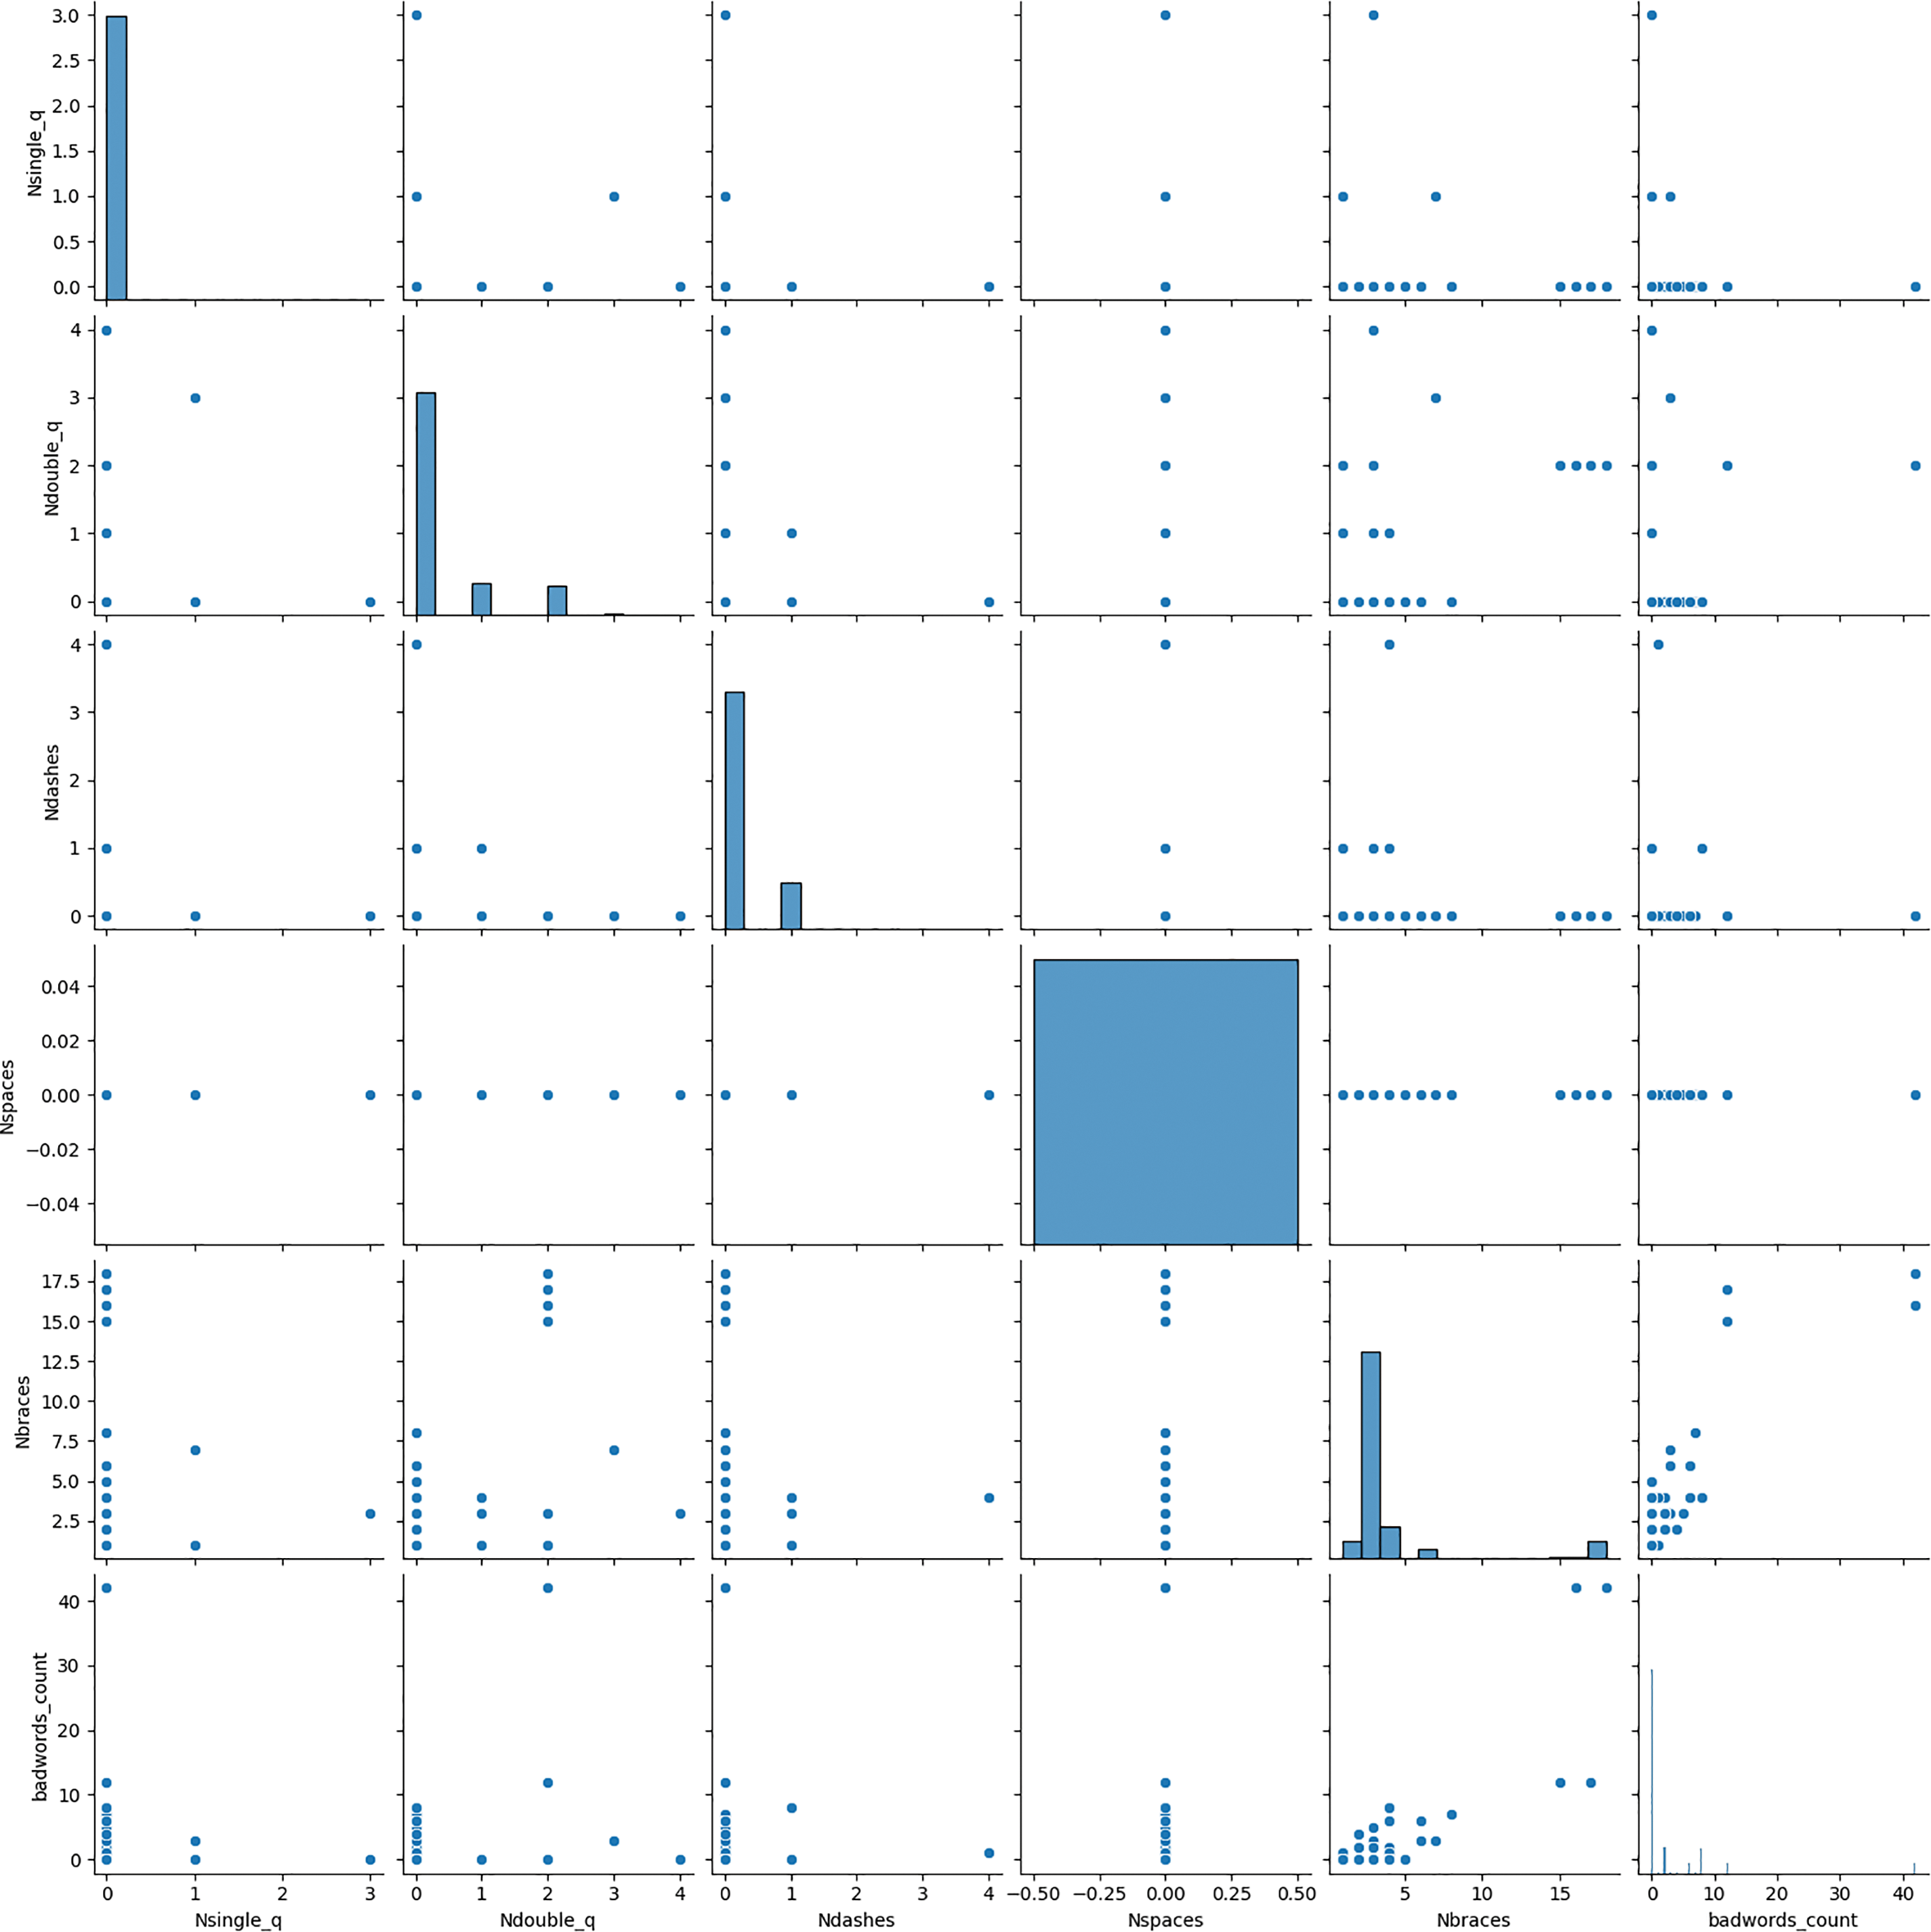
Figure 7: Dataset analysis
This information allowed us to have a certain appreciation of the clustering process because, depending on the ‘nspaces’ of a dataset line for example, cluster trend can already be estimated.
Evaluation of the Clustering Process
One of the processes for extracting the analyzed data is clustering. Through this step, we will somehow partition the object data coming from the dataset. At the same time, we will have an overview of the precision of this classification. Fig. 8 presents, in a 2D (two dimensions) format, the result of this process. Note also that given the number of features submitted to the present study, we would have more details in a 6D format.
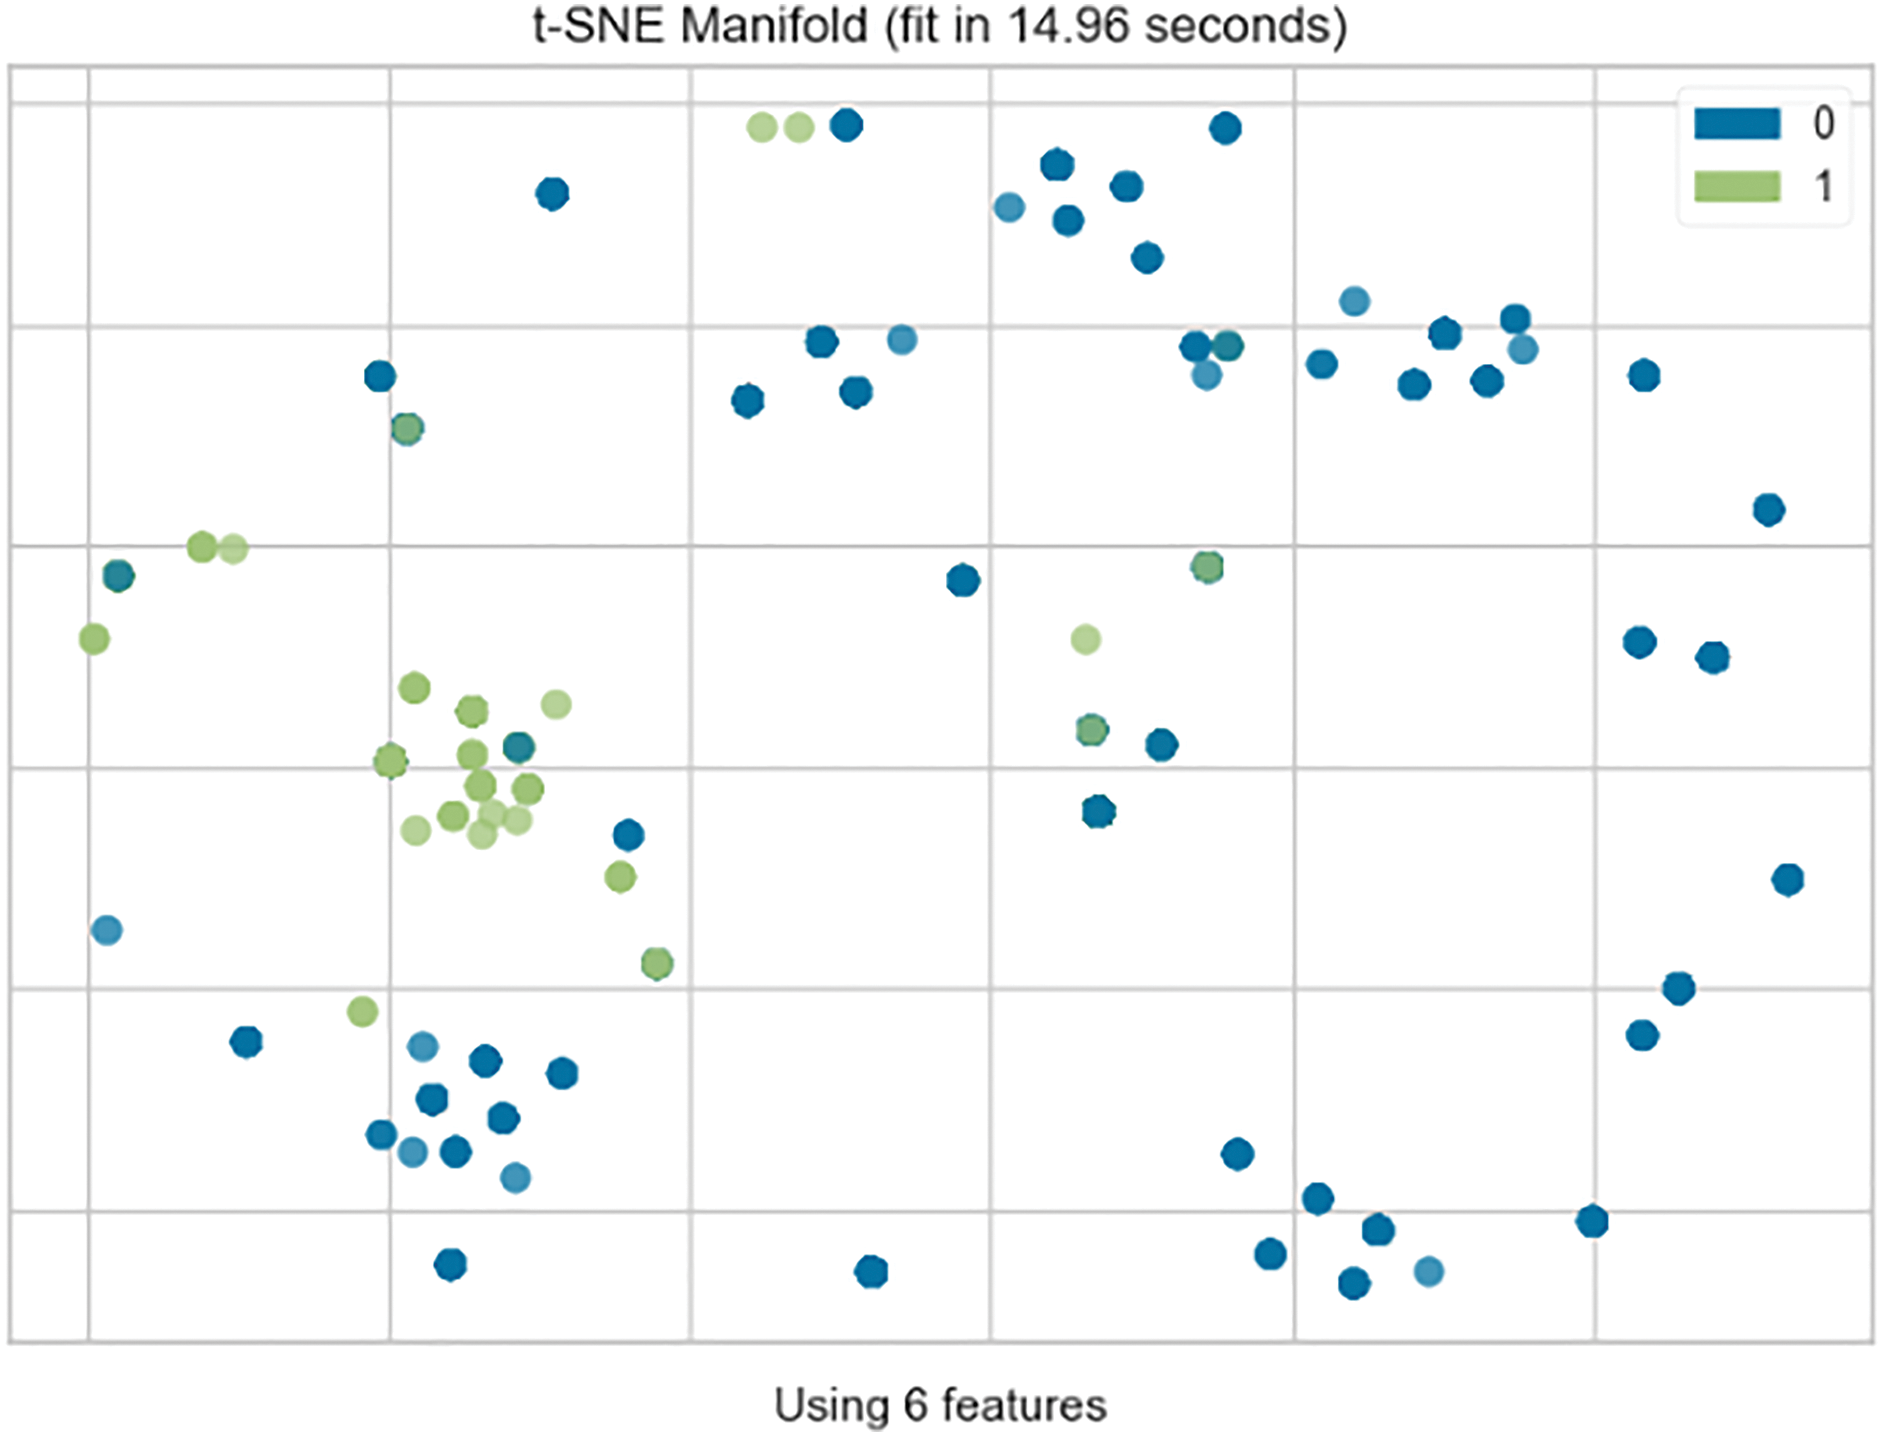
Figure 8: Result of clustering
In green, we have the objects from cluster 1, while in blue, we observe the objects from cluster 0. From this figure, we see a strong dominance of cluster 0. This means that it has more healthy activities emanating from this dataset as malicious activity. In more detail, we have a configuration of approximately 3073 instances from cluster 0 and 1318 instances for cluster 1. We note that the process took approximately 14.96 s via the Pycaret t-SNE tool. Fig. 9 illustrates the convergence of data towards cluster 0. This convergence can be explained by the fact that in the network, the majority of transactions are of a normal nature. We may get some variation from time to time, but by default, we have a large amount of harmless information.
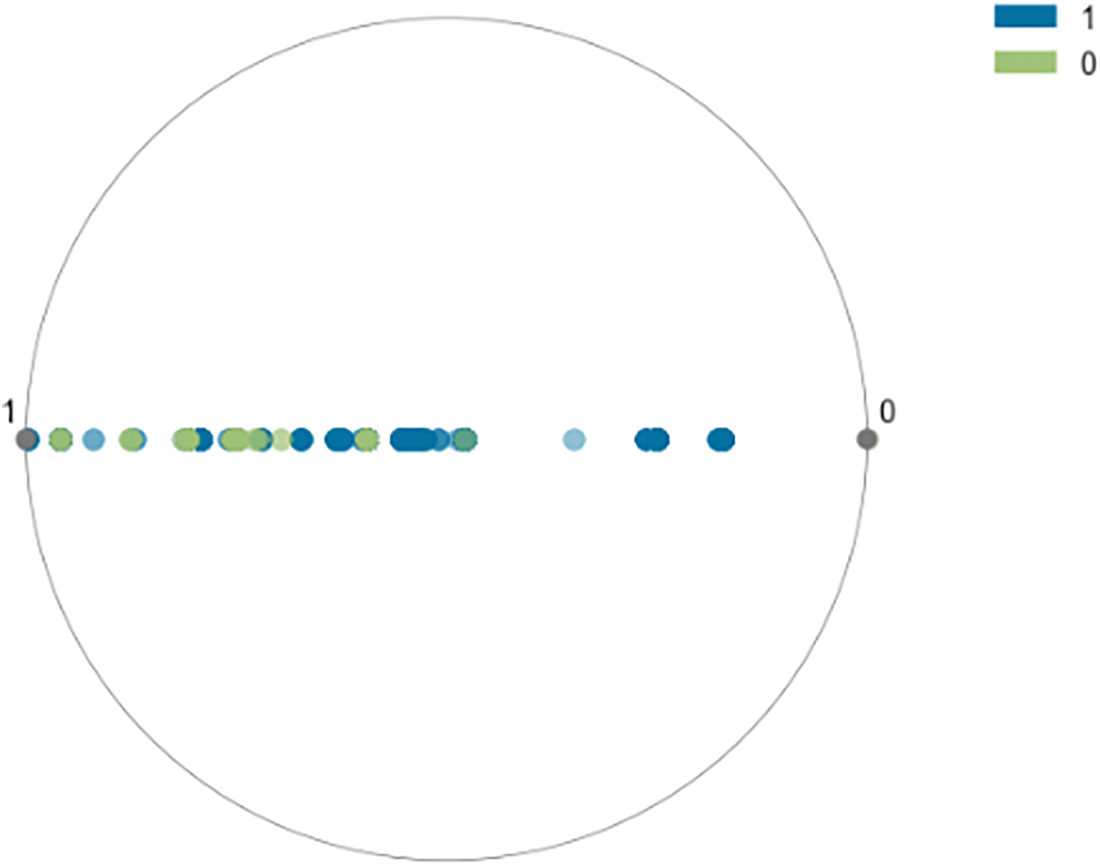
Figure 9: Study of objects’ convergences
In order to assess the consistency of the data during this process, the silhouette method was used. Its score makes it possible to evaluate the degree of precision with which the clustering was carried out. It displays the silhouette coefficient for each data point in a dataset. The silhouette coefficient quantifies the degree of cohesion and separation of a data point from its assigned cluster.
A higher silhouette coefficient indicates a better-defined and more appropriate cluster assignment. The y-axis is the silhouette score and the abscissa axis being the k value. The step is 0.25 on the ordinate and 1 on the abscissa (Fig. 10). For a number of clusters k = 2, we obtain a score of approximately 0.912 and an average score of 0.70 for several clusters k ranging from two to nine. This result makes it possible to estimate a better classification quality at the end of the clustering process. Fig. 11 shows the result of this process.
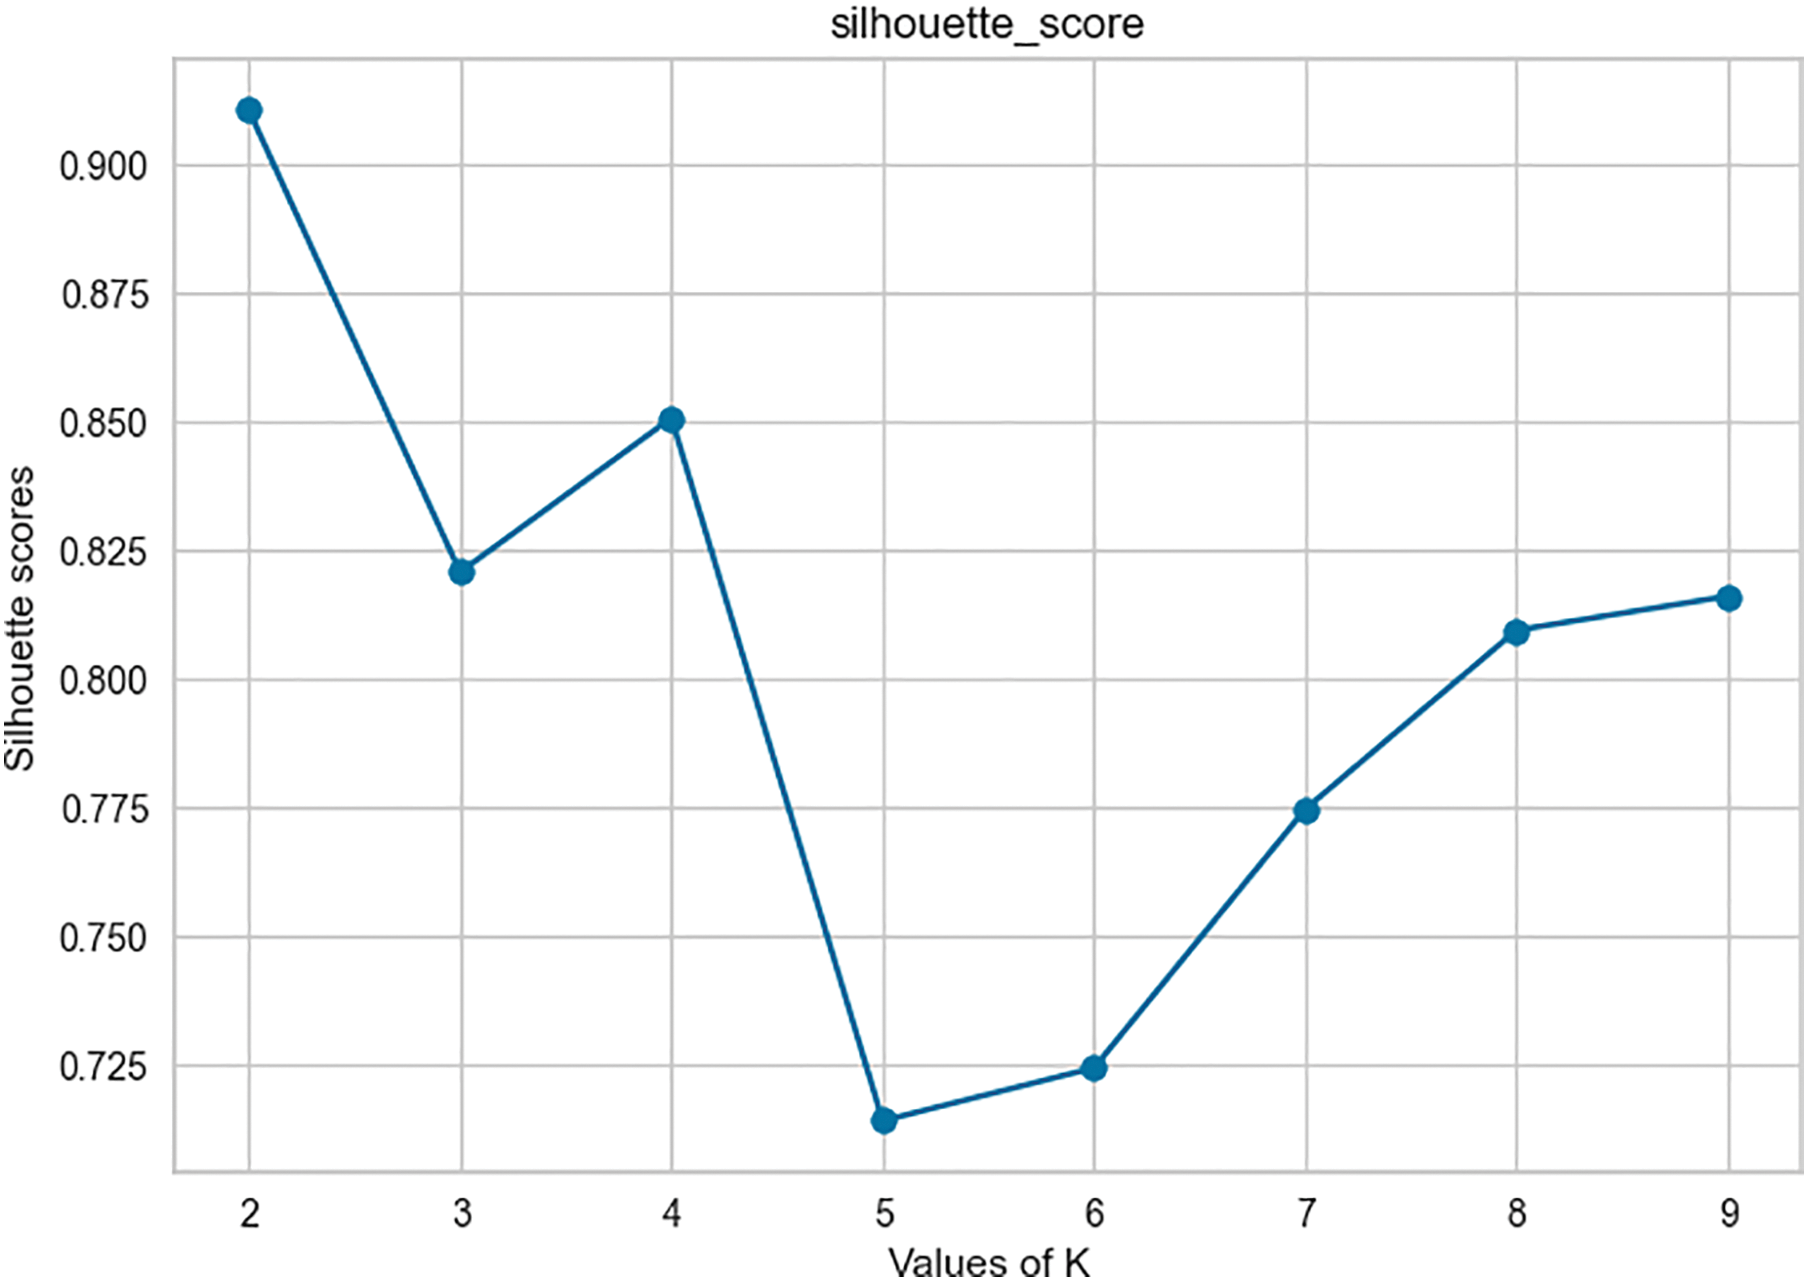
Figure 10: Silhouette’s score
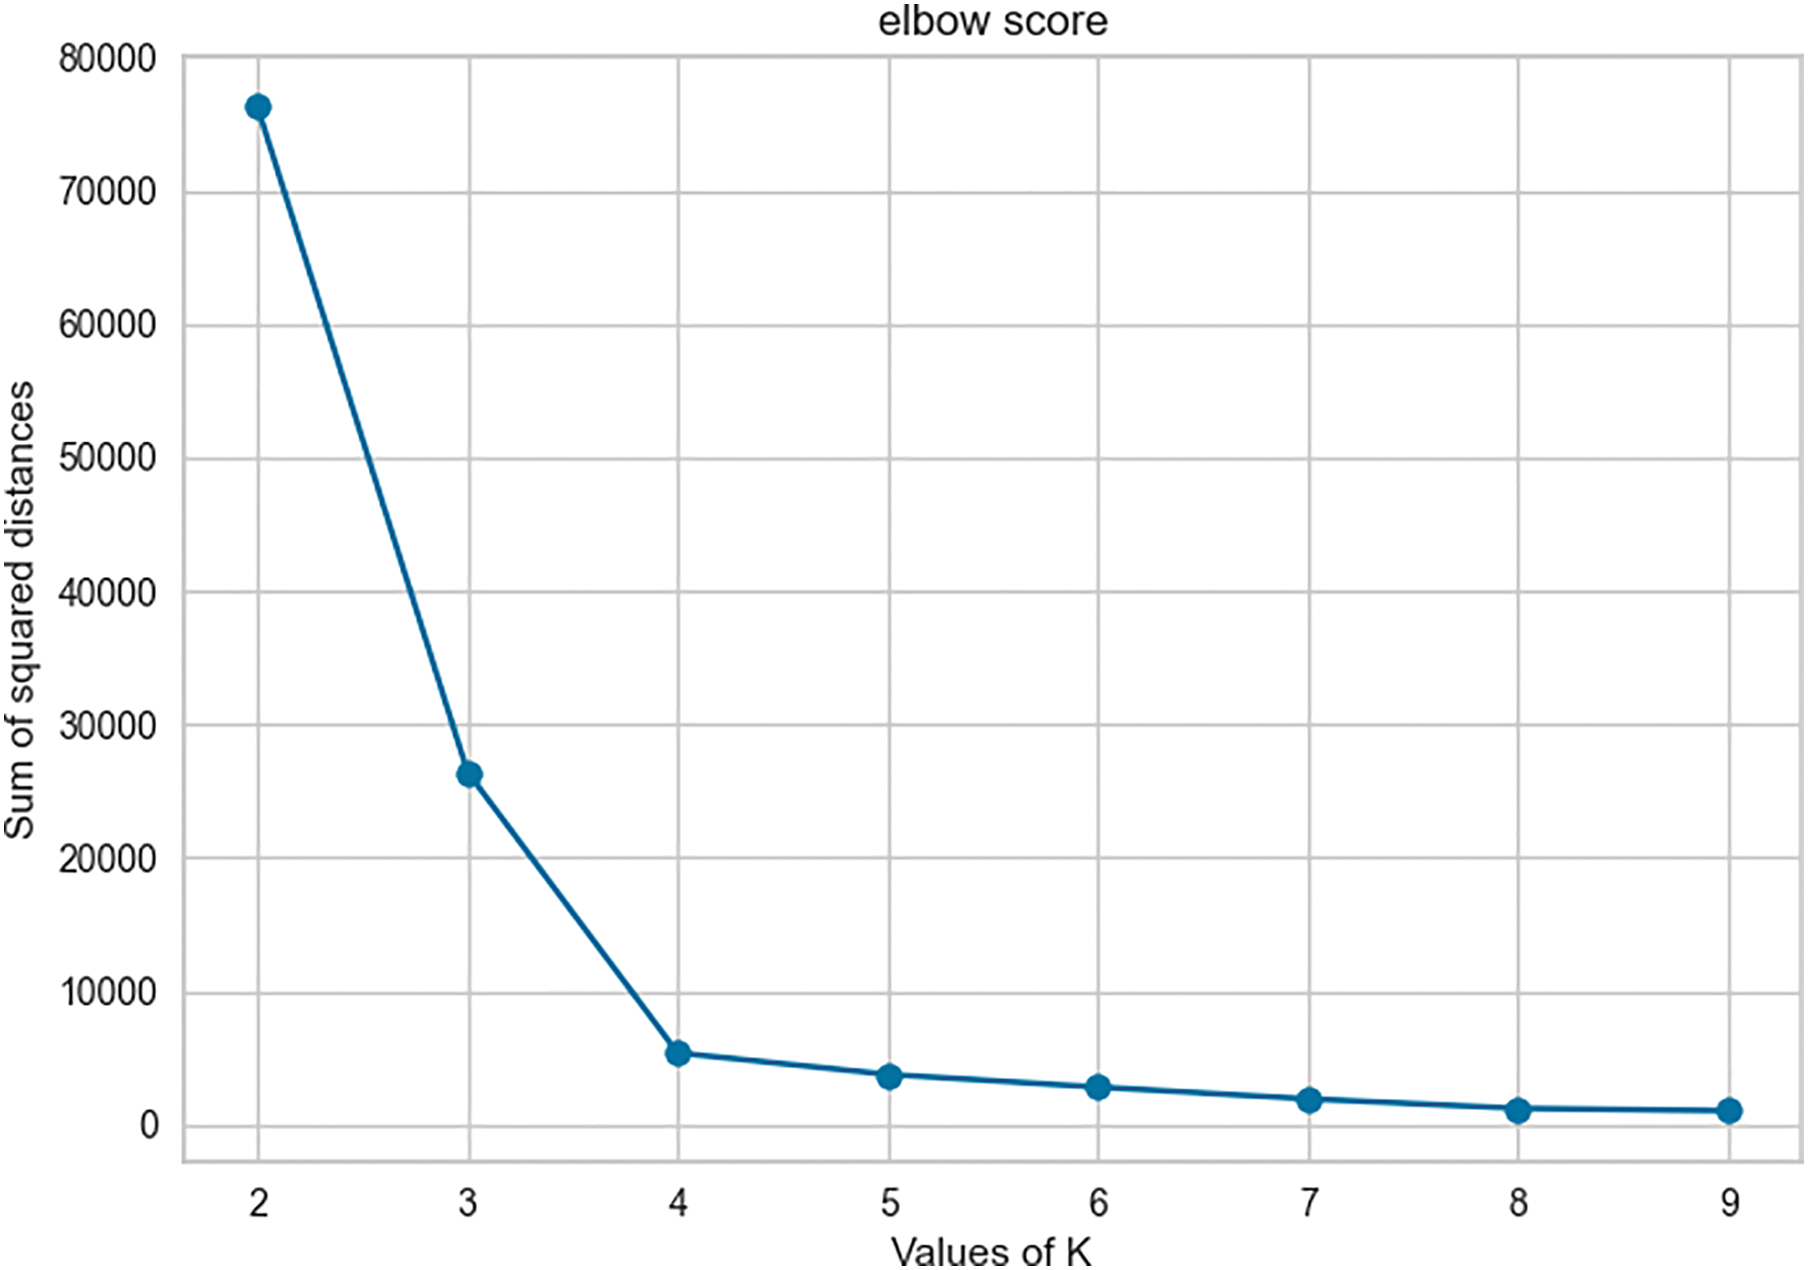
Figure 11: Elbow’s score
Following the clustering process, we will now predict (classify) incoming traffic based on pre-existing clusters. This task makes it possible to assess the quality of intrusion detection and prevention.
Evaluation of Prevention and Real-Time Detection of the Intrusion Prevention System
According to the design in Fig. 1, we will carry out the real-time test of the IPS. With both instances turned on, we launch the program named ‘cloudipstestprogram.py’. As indicated upstream, in this experiment we will collect performance parameters such as MTTD, MTTC, FTR, and TPR. The time expressed in second (s), around thirty seconds is necessary to retrieve the information we need. For the same occasion, we launch the web browser to transmit the HTTP requests. As indicated in the methodology, the malicious traffic test is carried out through the test site http://demo.testfire.com (accessed on 19 November 2024). Fig. 12 gives an overview of the information collected.
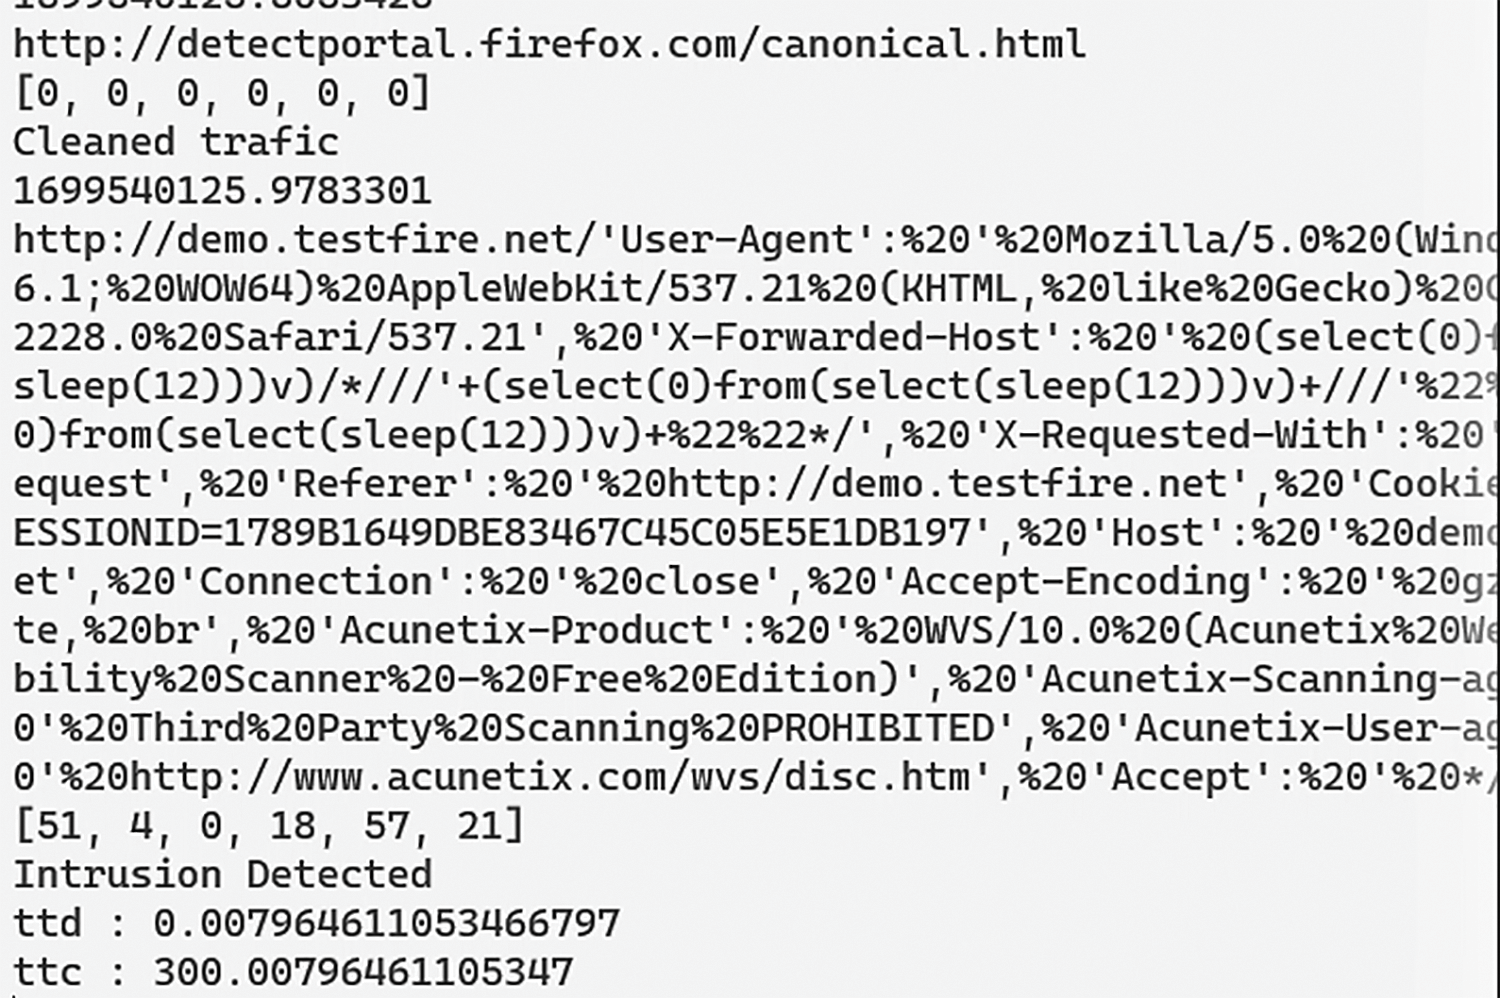
Figure 12: Realtime intrusion prevention of the proposed design
When we observe this capture, we notice a mention of ‘cleaned traffic’ and a mention of ‘intrusion detected’. These both materialize the cluster of membership of the detected information. For healthy information, there are no infection indicator parameters collected (features). We confirm this by the field [0,0,0,0,0,0]. A little further down, we can see malicious traffic coming from the test site. Compared to the previous case, we note a significant generation of features [51,4,0,18,57,21], indicators of malicious events. As agreed, we also have a little further down, the few performance parameters such as the TTD and the TTC. These intervene directly after an intrusion is detected. As we can see, we obtained practically 7.9 ms for detection and 307.9 ms for prevention (if applicable). Fig. 13 gives a graphical overview of the variation of the ttd over a 30 s experiment.
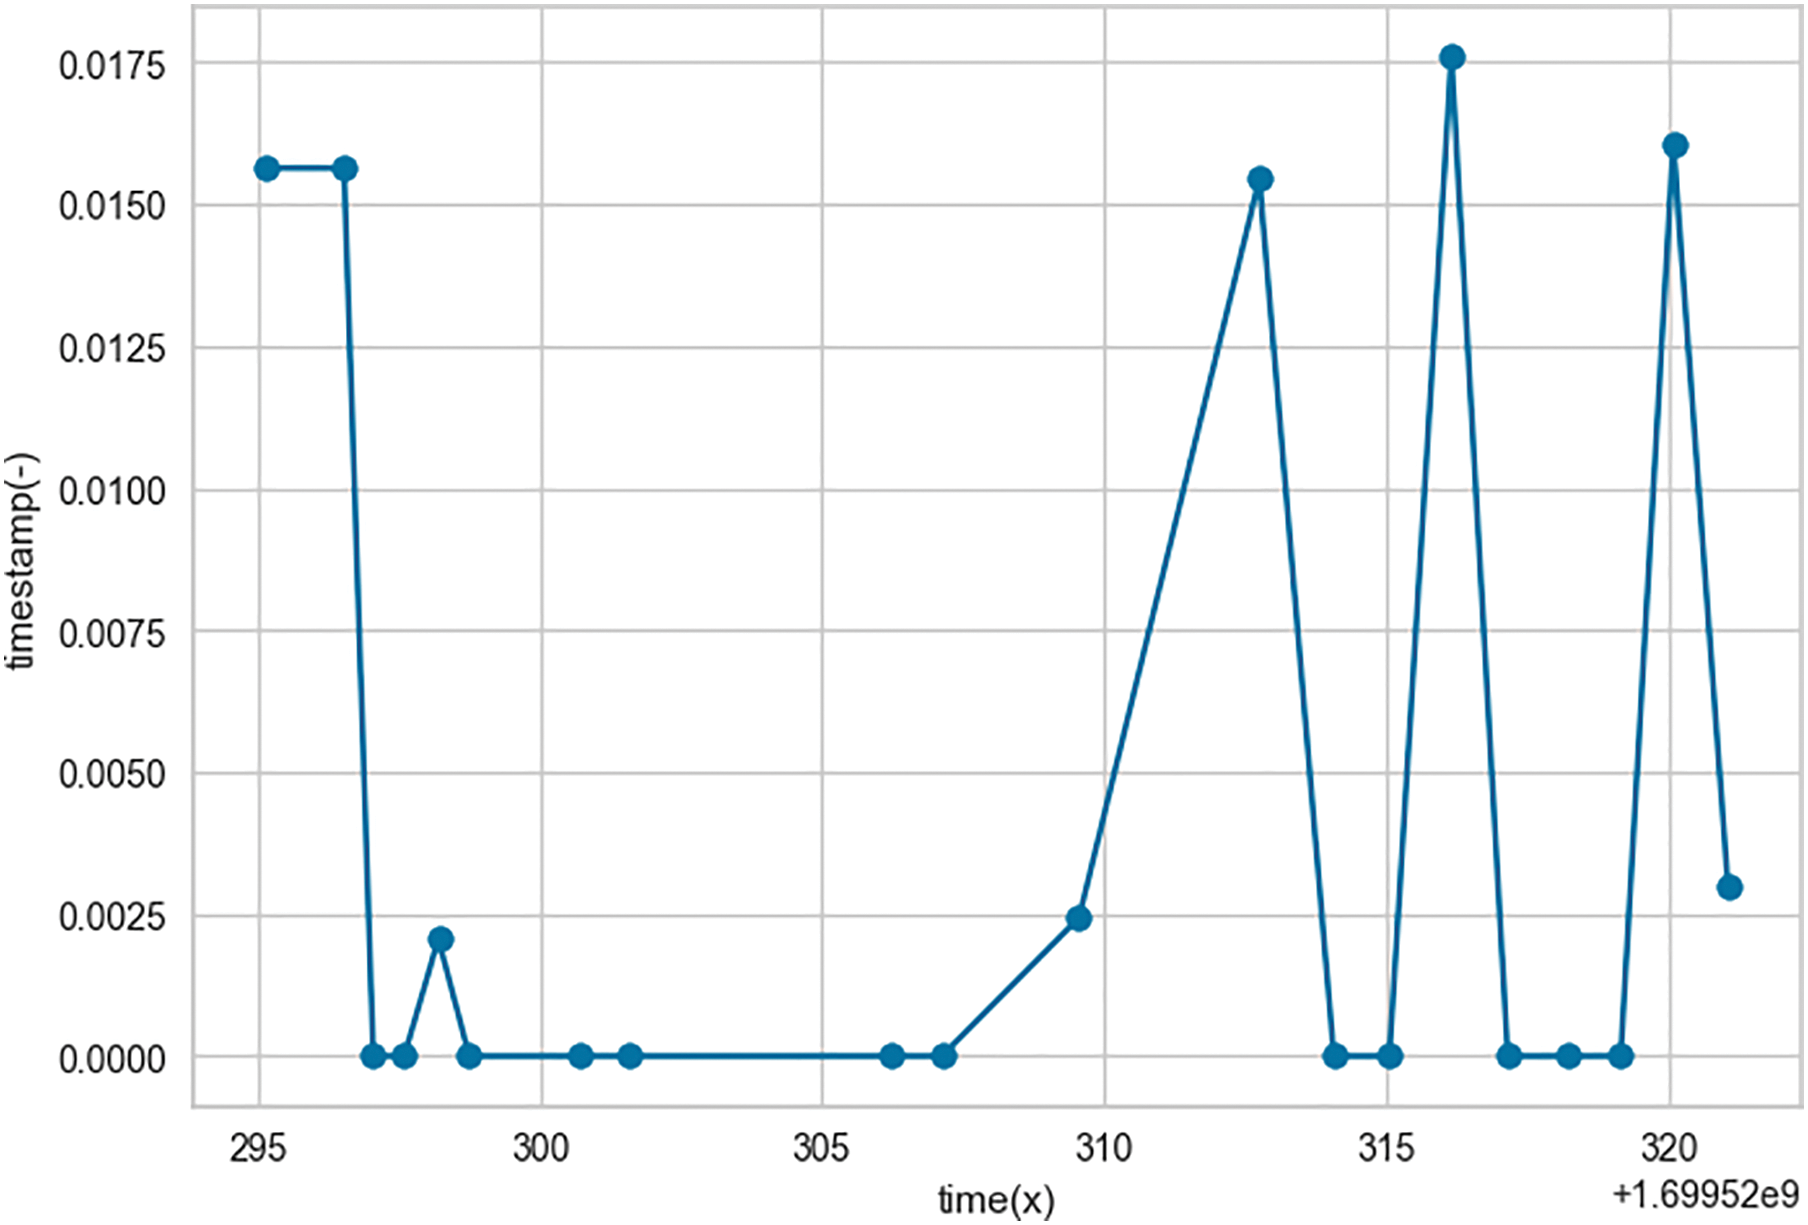
Figure 13: Variation of the time to detect over 30 s
There is a total of 4 mentions:
• The ‘avg mttd’ or the average detection time is around 6.5 ms;
• The ‘avg mttc’ or the average prevention time is approximately 306.5 ms;
• The ‘avg fpr’ or the average false positive rate is approximately 0.32877 (%/100);
• The ‘avg tpr’ or the average true positive rate is approximately 0.9303 (%/100).
If we compare this prevention time to the 270 days it takes on average for a structure in the world to prevent an intrusion, we understand that this result makes it possible to reduce as much as possible the latency time in the detection and prevention of an intrusion. Intrusion into the cloud computing environment.
The ‘avg fpr’ is also information whose quality should not be taken lightly. Roughly, it is estimated that about 30% is the amount of unnecessary information or security events that do not require any intervention by the security analyst. Although in a slightly broader environment, this figure will improve, it remains of capital importance. On the other hand, the ‘avg tpr’ estimates approximately 93% accuracy in detecting an intrusion in a cloud computing environment via the IPS design. To this end, SOC analysis can focus on each intrusion displayed on its interface while automatically avoiding false leads.
4.2.1 Building the Virtual Private Cloud
When we evaluate the process of setting up the cloud testing environment, we can say that it comes closest to the context of the present study. The results can determine with maximum precision the realities that can be encountered in a real environment [9–22]. Unlike the use of environments such as Virtual Box or VMware (which are proposing environments not far from the concept of cloud) as other authors do [21], the use of VPC allows you to have an overview and a better estimate of the behavior of the solution in a cloud computing environment. Furthermore, we remain focused on the importance of traffic (the number of hosts having participated in the test), which remains difficult to predict, because it continues to evolve exponentially. Interacting with this VPC also becomes a rather complicated task, because it is based on the internet. A minimum speed test of around 30 mb/s would be required for better interaction. As such, it is recommended to limit yourself to the virtual environment, although it is quite distant from the realities of the cloud environment compared to the VPC. It is also important to mention that, a data center tier 3 (with an Infrastructure as a Service or IaaS) is affordable to give a minimum requirement for conducting this research activity. In addition to Azure, Oracle Cloud Infrastructure (OCI), Amazon Web Services and Google Cloud platform can provide the same environment for this achievement.
4.2.2 Intrusion Prevention System Design
The IPS design, designed for this study, revolves around cloud technologies, long used to save time and availability. It all starts after setting up the VPC. Load balancer proxies ensure the availability of traffic transmission services to the DMZ. Compression is added to this process to make the data lighter. Also, there is no limit linked to a specific security context (authentication, zero-trust, static analysis, etc.) [9,12,17,19]. Added to these parameters, is the concept of threat intelligence, where the task of predicting the nature of cloud traffic is carried out through a quality database. Furthermore, the tendency and some latest security threat scopes (like DDOS, and ransomware [18]) of associating the design of the present study with environments as a premise was not taken into account. This detail weakens the interconnection of the IPS with corporate intranets. This gap can be filled by coupling the proxies (serving as intermediaries) of this design to open-source solutions so that it can take advantage of their capacity.
The evaluation of the design of the present study was carried out according to two plans. In terms of modeling (clustering), we are doing quite well with a precision of around 0.912 depending on the score (silhouette score). We would be able to obtain better precision with a dataset like KDD99 or CICIDS, as some authors [9–17]. We could also have used a supervised machine learning method [9,12,17,19], such as the regression tree for example. But this defect also allows us to gain in latency time (of the order of microseconds for detection). Although this slight parameter has some repercussions on the FPR and TPR, we remain confident in the effectiveness of the process in the context of saving time. Another parameter to take into account within this evaluation is the immense nature of the environment (cloud), where we are trying to make estimates. Although it is difficult to make an exact prediction of the traffic capacity coming from this environment in real-time, the VPC structure of the present study comes closest. Also, the MTTD (352 ns–62.5 ms) obtained during this approach is far greater than the 277 days it takes on average for a company to contain a security threat, and more insignificant than certain authors (0.66 s) [18]. Fig. 14 gives a glimpse of what this research activity consists of, by providing a little comparative analysis chart with what has been done by other researchers. Under high traffic conditions, although it is good to admit that the latency time will be coercively impacted, thanks to the latest connectivity capabilities with their minimizing effect. But for the case precision rate, more feeds or traffic generated by the system will give the design much more insight into the cyber threat landscape and by the way enhance its actual accuracy.
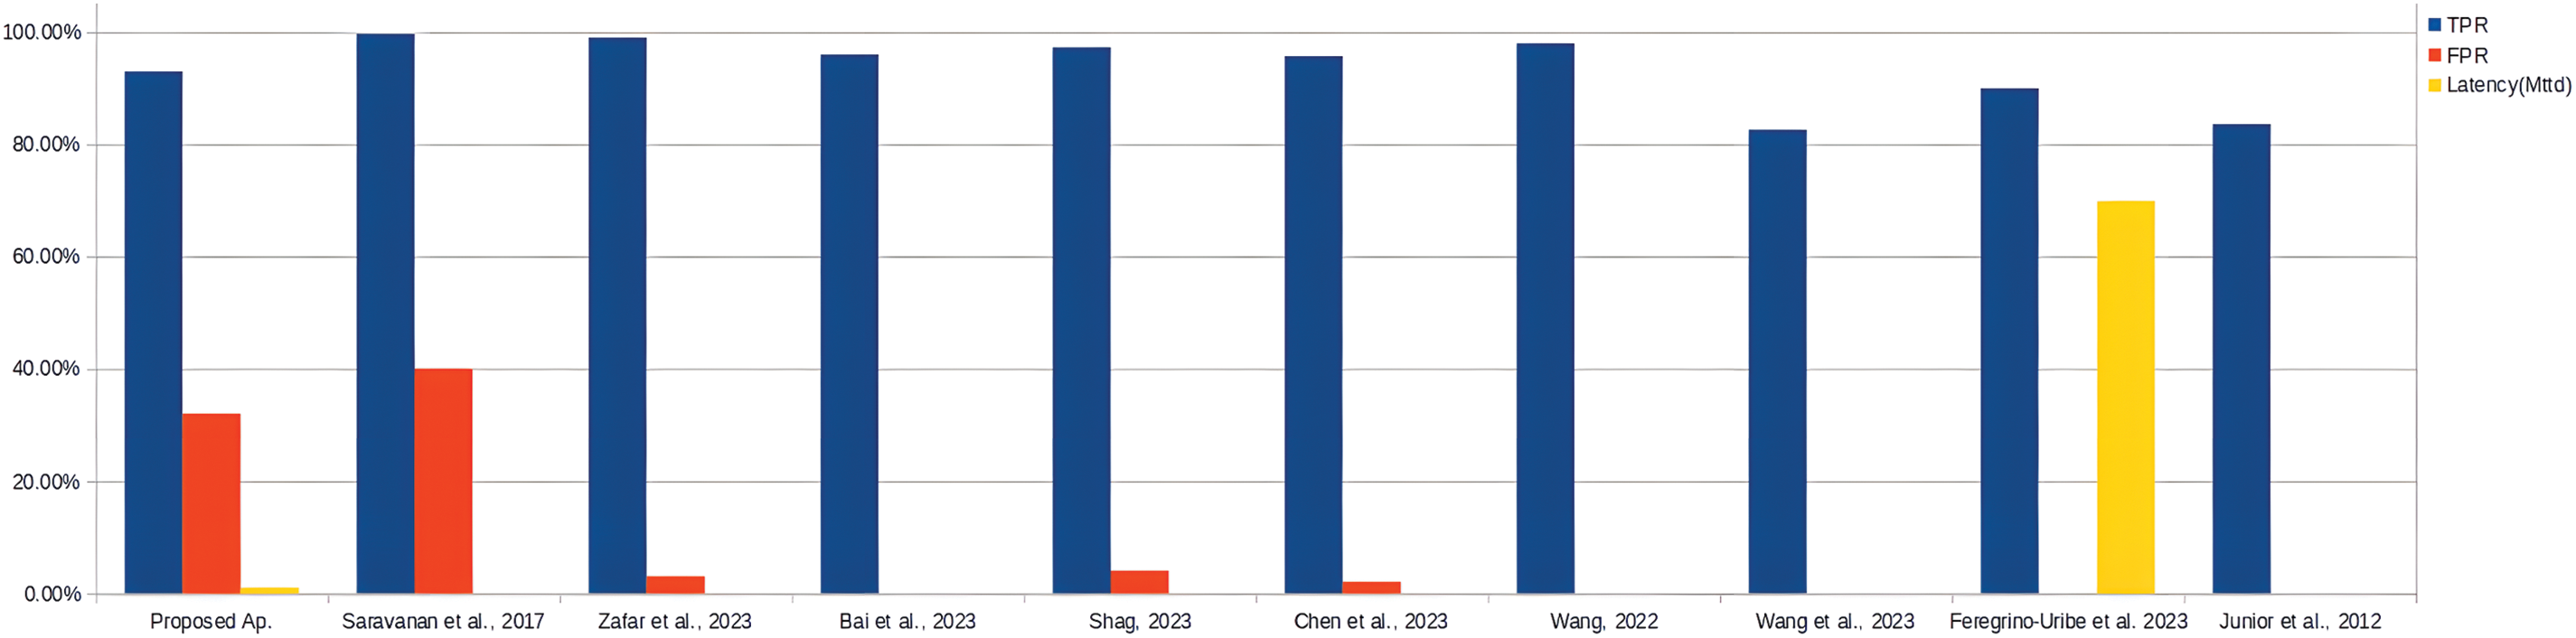
Figure 14: Comparative analysis of the proposed system [9–15,18,23]
To have traceability on the progress of this process, the performance criteria have been segmented according to two angles: the clustering side and the real-time prevention side. From the point of view of the clustering process, it obtained a satisfactory Silhouette score of approximately 91.04% and a value of approximately 85,000 units in the Elbow score. Regarding intrusion prevention, we obtain an MTTD of around 6.5 ms, an MTTC of around 306.5 ms, an FPR of around 30%, and a TPR of around 93.2%.
Given that we started with a design based solely on attacks targeting web traffic, it would be wise to focus on other types of attacks, notably ransomware. Also, it will be a question of automating the transfer of datasets from TIPs. Although a hybrid machine learning algorithm has not been used in this research activity, it is important to recognize that it could be useful to enhance detection capabilities and adaptability to new and emerging cyber threats, where each single ML algorithm will be responsible for a given detective and preventive function.
From all that has been said, it is tremendously important to recognize some prominent limits of this research. For the time being, they are presented as follows:
• A consideration needs to be made of High traffic conditions and resource consumption;
• Attacks scope, landscape and methodology have to be extended;
• 2 × 9 TPR precision rate is still difficult to achieve an unacceptable FPR due to the inconsistent dataset;
The following points represent some future work perspectives of this research activity:
• Appropriate Machine Learning Mechanism to improve the present IDPS in extremely high traffic conditions;
• Electromagnetism impact of cyber-physical resource consumption due to IDPS performance
• Error and Uncertainty evaluation for AI-based threat prevention and detection targeting the cloud.
Acknowledgement: The authors are very grateful to Inchtech’s Team (www.inchtechs.com, accessed on 19 November 2024) for their support and assistance during the conception of that work.
Funding Statement: We wish to confirm that there is no financial support for this work that could have influenced its outcome.
Author Contributions: Theophile Fozin Fonzin designed the project, worked on the methodology part, supervised and corrected the paper draft; Halilou Claude Bobo Hamadjida designed the project, worked on the methodology part, developed the software, wrote the first draft of the paper; Aurelle Tchagna Kouanou designed the project, worked on the methodology part, provided the environment and corrected the paper draft; Valery Monthe worked on the methodology part, improved the results session and reviewed the paper; Anicet Brice Mezatio supervised and corrected the paper draft; Michael Sone Ekonde supervised, corrected the paper draft and reviewed the paper. All authors reviewed the results and approved the final version of the manuscript.
Availability of Data and Materials: The data supporting the findings of this work are available in the manuscript.
Ethics Approval: This article does not contain any studies with human participants and/or animals performed by any of the authors.
Conflicts of Interest: The authors declare no conflicts of interest to report regarding the present study.
References
1. V. Mansi, R. Saurabh, and V. Jyoti, “A survery on cloud computing and security challenges to cloud computing,” Int. J. Comput. Appl., vol. 175, no. 29, pp. 29–33, 2020. doi: 10.5120/ijca2020920830. [Google Scholar] [CrossRef]
2. Huawei Technologies Co, “Introduction to cloud computing,” in Cloud Computing Technology. Zhejiang, China: Springer, Posts & Telecom Press 2023, 2023. doi: 10.1007/978-981-19-3026-3. [Google Scholar] [CrossRef]
3. E. A. Adeniyi, S. A. Ajagbe, O. A. Oki, A. O. Adebayo, and O. Olasupo, “Application of machine learning algorithm in cloud-to-edge computing: Analysis and limitations,” in 2023 IEEE AFRICON, Nairobi, Kenya, 2023, pp. 1–6. doi: 10.1109/AFRICON55910.2023.10293346. [Google Scholar] [CrossRef]
4. S. Pal, D. -N. Le, and P. Pattnaik, “Introduction to cloud computing,” in Cloud Computing Solutions: Architecture, Data Storage, Implementation and Security. Hoboken, NJ, USA: Willey, Scrivener Publishing, 2022. doi: 10.1002/9781119682318.ch2. [Google Scholar] [CrossRef]
5. S. A. Ajagbe, J. B. Awotunde, and H. Florez, “Ensuring intrusion detection for IoT services through an improved CNN,” SN Comput. Sci., vol. 5, no. 1, 2024, Art. no. 49. doi: 10.1007/s42979-023-02448-y. [Google Scholar] [CrossRef]
6. G. A. Taiwo, T. O. Akinwole, and O. B. Ogundepo, “Statistical analysis of stakeholders perception on adoption of AI/ML in sustainable agricultural practices in rural development,” in Lecture Notes in Networks and Systems, X. S. Yang, S. Sherratt, N. Dey, and A. Joshi, Eds. Singapore: Springer, 2024, vol. 1003. doi: 10.1007/978-981-97-3302-6_11. [Google Scholar] [CrossRef]
7. H. Taherdoost, “Insights into cybercrime detection and response: A review of time factor,” Information, vol. 15, no. 5, 2024, Art. no. 273. doi: 10.3390/info15050273. [Google Scholar] [CrossRef]
8. A. Tanyi-Jong Akem, M. Gucciardo, and M. Fiore, “Ultra-low latency user-plane cyberattack detection in SDN-based smart grids,” in Proc. 15th ACM Int. Conf. Future Sustain. Energy Syst. (e-Energy ’24), New York, NY, USA, Association for Computing Machinery, 2024, pp. 676–682. doi: 10.1145/3632775.3661995. [Google Scholar] [CrossRef]
9. S. Santhiya and S. Saravanan, “Intrusion detection and prevention system in cloud using decision tree mode,” Int. J. Adv. Res. Comput. Commun. Eng., vol. 6, no. 1, pp. 343–346, 2017. doi: 10.17148/IJARCCE.2017.6167. [Google Scholar] [CrossRef]
10. O. Bukhari, P. Agarwal, D. Koundal, and S. Zafar, “Anomaly detection using ensemble techniques for boosting the security of intrusion detection system,” in Proc. Comput. Sci. Int. Conf. Mach. Learn. Data Eng., vol. 218, no. 2023, pp. 1003–1013, 2023. doi: 10.1016/j.procs.2023.01.080. [Google Scholar] [CrossRef]
11. H. Lin, Q. Xue, J. Feng, and D. Bai, “Internet of things intrusion detection model and algorithm based on cloud computing and multi-feature extraction extreme learning machine,” Direct Sci. Dig. Commun. Netw., vol. 9, no. 2023, pp. 111–124, 2023. doi: 10.1016/j.dcan.2022.09.021. [Google Scholar] [CrossRef]
12. Y. Shag, “Prevention and detection of DDOS attack in virtual cloud computing environment using Naive Bayes Algorithm of machine learning,” Measur.: Sens., vol. 31, no. 2024, pp. 1–9, 2024. doi: 10.1016/j.measen.2023.100991. [Google Scholar] [CrossRef]
13. Z. Wang, X. Chen, and X. Shao, “Intrusion detection-data security protection scheme based on particule swarm-BP network algorithm in cloud computing environment,” J. Electr. Comput. Eng., vol. 2023, no. 4, pp. 1–10, 2023. doi: 10.1155/2023/1128545. [Google Scholar] [CrossRef]
14. X. Wang, “A collaborative detection method of wireless mobile network intrusion based on cloud computing,” Wirel. Commun. Mobile Comput., vol. 2022, no. 1, pp. 1–12, 2022. doi: 10.1155/2022/1499736. [Google Scholar] [CrossRef]
15. G. Zhao, Y. Wang, and J. Wang, “Lightweight intrusion detection model of the Internet of Things with hybrid cloud-fog computing,” Secur. Commun. Netw., vol. 2023, pp. 1–16, 2023. doi: 10.1155/2023/7107663. [Google Scholar] [CrossRef]
16. D. Bhattacharya, A. Biswas, S. Rajkumar, and R. Setvaambi, “Dymnamic cloud access security broker using artificial intelligence,” Mach. Learn. Predict. Anal., vol. 33, no. 2021, pp. 335–342, 2021. doi: 10.1007/978-981-15-7106-0_33. [Google Scholar] [CrossRef]
17. B. S. K. Devi and T. Subbulakshmi, “Intrusion detection and prevention of DDoS attacks in cloud computing environments: A review of issues and current methods,” Int. J. Cloud Comput., vol. 12, no. 5, pp. 450–481, 2023. doi: 10.1504/IJCC.2023.134001. [Google Scholar] [CrossRef]
18. M. L. Hernandez-Jaimes, A. Martinez-Cruz, K. A. Ramirez-Gutièrrez, and C. Feregrino-Uribe, “Artificial intelligence for IoMT security: A review of intrusion detection systems, attacks, datasets and Cloud-Forg-Edge architectures,” Internet Things, no. 23, 2023, Art. no. 100887. doi: 10.1016/j.iot.2023.100887. [Google Scholar] [CrossRef]
19. N. Eddermoug, A. Mansour, M. Azmi, M. Sadik, E. Sabir and H. Bahassi, “A litterature review on attack prevention and prefiling in cloud computing,” in Proc. Comput. Sci. 1st Int. Workshop Human-Centr. Innov. Computat. Intell., vol. 220, no. 2023, pp. 970–977, 2023. doi: 10.1016/j.procs.2023.03.134. [Google Scholar] [CrossRef]
20. T. Sowmya and E. A. Mary Anita, “A comprehensive review of AI based intrusion detection system,” Measur.: Sens., vol. 28, no. 2023, pp. 1–13, 2023. doi: 10.1016/j.measen.2023.100827. [Google Scholar] [CrossRef]
21. D. Singh and S. Lata, “Intrusion detection system in cloud environment: Litterature survey & future research directions,” Int. J. Inf. Manag. Data Insights, vol. 2, no. 2022, pp. 1–14, 2022. doi: 10.1016/j.jjimei.2022.100134. [Google Scholar] [CrossRef]
22. H. Zhang, G. Shen, C. Guo, Y. Gui, and C. Jiang, “EX-Action: Automatically extracting threat actions from cyber threat intelligence report based on multimodal learning,” Secur. Commun. Netw., vol. 2021, no. 2, pp. 1–12, 2021. doi: 10.1155/2021/5586335. [Google Scholar] [CrossRef]
23. A. Patel, M. Taghavi, K. Bakhtizyari, and J. C. Junior, “An intrusion detection and prevention system in cloud comuting: A systematic review,” J. Netw. Comput. Appl., vol. 36, no. 1, pp. 25–41, 2012. doi: 10.1016/j.jnca.2012.08.007. [Google Scholar] [CrossRef]
24. H. Jin et al, “A VMM-based Intrusion prevention system in cloud computing environment,” J. Supercomput., Spinger, vol. 10, no. 3, pp. 1–19, 2011. doi: 10.1007/s11227-011-0608-2. [Google Scholar] [CrossRef]
25. C. M. Ou, “Host-based intrusion detection systems adapted from agent-based artificial immune systems,” J. Netw. Comput. Appl., vol. 6, no. 1, pp. 25–41, 2012. doi: 10.1016/j.neucom.2011.07.031. [Google Scholar] [CrossRef]
26. A. Uddin and L. Hasan, “Design and analysis of real-time network intrusion detection and prevention system using open source tools,” Int. J. Comput. Appl., vol. 138, no. 7, pp. 6–11, 2016. doi: 10.5120/ijca2016908921. [Google Scholar] [CrossRef]
27. OWASP, “API7:2023 Server Side Request Forgery,” 2023. Accessed: Nov. 19 2024. [Online]. Available: https://owasp.org/API-Security/editions/2023/en/0xa7-server-side-request-forgery/ [Google Scholar]
28. P. N. Tan, M. Steinbach, and V. Kumar, Introduction to Data Mining. UK: Addison-Wesley, Reading, 2005. doi: 10.1007/978-0-387-47716-9. [Google Scholar] [CrossRef]
29. W. Junjie, “Cluster analysis and K-means clustering: An introduction. Advances in K-means clustering: A data mining thinking,” in Advances in K-Means Clustering. Berlin, Heidelberg: Springer, 2012, pp. 1–16. doi: 10.1007/978-3-642-29807-3_1. [Google Scholar] [CrossRef]
30. S. Lloyd, “Least squares quantization in PCM,” Int. Electr. Electron. Eng. Trans., Inf., vol. 28, no. 2, pp. 129–137, 1982. doi: 10.1109/TIT.1982.1056489. [Google Scholar] [CrossRef]
31. MacQueen, “Some methods for classification and analysis of multivariate observations,” in Proc. 5th Berkeley Symp. Mathemat. Statist. Probabil., 1967, pp. 281–297. [Google Scholar]
32. MathWorks, “k-Means Clustering,” 2024. Accessed: Nov. 19 2024. [Online]. Available: https://www.mathworks.com/help/stats/k-means-clustering.html [Google Scholar]
33. A. Tchagna Kouanou, D. Tchiotsop, R. Tchinda, C. Tchito Tchapga, A. N. Kengnou Telem and R. Kengne, “A machine learning algorithm for biomedical images compression using orthogonal transforms,” Int. J. Image, Graph. Signal Process., vol. 10, no. 11, pp. 38–53, 2018. doi: 10.5815/ijigsp.2018.11.05. [Google Scholar] [CrossRef]
34. A. Tchagna Kouanou, D. Tchiotsop, T. Fozin Fonzin, B. Mounmo, and R. Tchinda, “Real-time image compression system using an embedded board,” Sci. J. Circuit., Syst. Signal Process., vol. 7, no. 4, pp. 81–86, 2019. doi: 10.11648/j.cssp.20180704.11. [Google Scholar] [CrossRef]
Cite This Article
 Copyright © 2024 The Author(s). Published by Tech Science Press.
This work is licensed under a Creative Commons Attribution 4.0 International License , which permits unrestricted use, distribution, and reproduction in any medium, provided the original work is properly cited.
 Downloads
 Citation Tools