 Open Access
ARTICLE
Performance Evaluation of Machine Learning Algorithms in Reduced Dimensional Spaces
1 Department of Electrical Engineering and Computer Science, Alabama A&M University, Huntsville, AL, 35811–7500, USA
2 U.S. Army Aviation and Missile Command, Huntsville, AL, 35898–5000, USA
* Corresponding Author: Kaveh Heidary. Email:
Journal of Cyber Security 2024, 6, 69-87. https://doi.org/10.32604/jcs.2024.051196
Received 29 February 2024; Accepted 02 August 2024; Issue published 28 August 2024
Abstract
This paper investigates the impact of reducing feature-vector dimensionality on the performance of machine learning (ML) models. Dimensionality reduction and feature selection techniques can improve computational efficiency, accuracy, robustness, transparency, and interpretability of ML models. In high-dimensional data, where features outnumber training instances, redundant or irrelevant features introduce noise, hindering model generalization and accuracy. This study explores the effects of dimensionality reduction methods on binary classifier performance using network traffic data for cybersecurity applications. The paper examines how dimensionality reduction techniques influence classifier operation and performance across diverse performance metrics for seven ML models. Four dimensionality reduction methods are evaluated: principal component analysis (PCA), singular value decomposition (SVD), univariate feature selection (UFS) using chi-square statistics, and feature selection based on mutual information (MI). The results suggest that direct feature selection can be more effective than data projection methods in some applications. Direct selection offers lower computational complexity and, in some cases, superior classifier performance. This study emphasizes that evaluation and comparison of binary classifiers depend on specific performance metrics, each providing insights into different aspects of ML model operation. Using open-source network traffic data, this paper demonstrates that dimensionality reduction can be a valuable tool. It reduces computational overhead, enhances model interpretability and transparency, and maintains or even improves the performance of trained classifiers. The study also reveals that direct feature selection can be a more effective strategy when compared to feature engineering in specific scenarios.Keywords
Machine learning (ML) has proven highly effective in extracting valuable and actionable insights from data across various domains, including cybersecurity [1–5]. However, developing computationally efficient, transparent, and accurate predictive models for cybersecurity applications, especially in real-time network monitoring, remains a challenge. One key obstacle is the vast number of features, which can vary significantly depending on the level of detail captured from network traffic [6–9]. Ravi et al. [6] used deep learning on sensor data from wearable devices, which often have high dimensionality, implying potential benefits from dimensionality reduction for performance improvement. Berisha et al. [9] discussed the “curse of dimensionality” in digital medicine, highlighting the challenge high-dimensional data poses for machine learning algorithms, and potentially the value of dimensionality reduction.
Dimensionality reduction, a form of data compression, tackles the challenge of high-dimensional data by reducing the number of features while preserving the essential information within the dataset. It serves as a preprocessing step that mitigates the detrimental effects of feature correlations, redundancy, and irrelevance, thereby enhancing data quality, reducing computational overhead, increasing model transparency, and improving performance in machine learning applications. Lowering the dimensionality of data offers significant advantages in the development of machine learning models, particularly in scenarios involving high-dimensional data [10–13]. Cuesta et al. [10] combined dimensionality reduction with machine learning to forecast solar radiation, suggesting dimensionality reduction’s role in enhancing machine learning performance in this specific application.
Lower-dimensional spaces offer several advantages, including reduced computational overhead. This translates to smaller memory requirements and lower processing loads, ultimately leading to faster training times and lower latency inference for real-time applications. Conversely, high-dimensional datasets can introduce complexities that hinder analysis and modeling. This can result in less interpretable and less robust ML models. Dimensionality reduction techniques effectively mitigate overfitting and improve model resilience to noise. Additionally, these techniques, in conjunction with feature engineering, can enhance model performance on unseen data.
This paper investigates the impact of data dimensionality reduction and the number of training instances on the performance of binary machine learning classifiers. The evaluation of trained models employs a variety of metrics, including true-positive rate (TPR) or recall, true-negative rate (TNR) or specificity, precision, F-score, and accuracy. The study specifically examines how the number of training instances, especially very low numbers, affects the performance of seven types of binary classifiers: logistic regression (LR), support vector classifier (SVC), decision tree (DT), random forest (RF), k-nearest neighbor (KNN), Naïve Bayes (NB), and neural network (NN).
This study employs two distinct approaches for feature engineering and data dimensionality reduction: supervised and unsupervised methods [14,15]. Unsupervised methods focus on data exploration and uncovering inherent structure. Within this category, two feature projection techniques are utilized: principal component analysis (PCA) and singular value decomposition (SVD) [16–19]. Supervised methods, on the other hand, leverage class labels of the feature vectors to identify the most relevant features for prediction. Here, we explore two feature selection techniques: univariate feature selection (UFS) using chi-squared statistics and mutual information (MI) [20–23]. References [17,18] focused on Principal Component Analysis (PCA), a popular technique for dimensionality reduction. Understanding PCA is crucial for evaluating how well algorithms perform in reduced spaces. Reference [20] explored techniques for reducing dimensionality in complex datasets, which can significantly impact the performance of machine learning algorithms in those lower-dimensional spaces.
This paper utilizes the Canadian Institute of Cybersecurity (CIC) Distributed Denial-of-Service (DDoS) 2019 Friday Afternoon Evaluation Dataset [23]. The original dataset, CICDDoS2019-Friday-Afternoon, is a CSV file generated by CICFlowMeter-V3, containing network traffic features extracted from network packet capture (PCAPs). It comprises 225,745 rows, each representing a packet header or feature vector, and 79 columns containing attributes or features, including a label indicating the traffic type. The dataset is roughly balanced, containing 97,718 benign traffic entries and 128,027 DDoS attack entries. All features except the label are numerical. For our analysis, the dataset was preprocessed by converting the label column to binary (0: benign, 1: DDoS) and removing twelve features with constant values. The resulting dataset retains 225,745 rows, with each row containing a 66-dimensional feature vector and its corresponding binary label. Within this dataset, 97,718 vectors are labeled as benign (0), and the remaining 128,027 are labeled as DDoS attack (1).
The paper is structured as follows: Section 2 provides contextual information on dimensionality reduction, while Section 3 outlines the relevant processes and definitions. Section 4 details the simulation methodology and presents the results. Section 5 offers conclusions. Acknowledgements and references are given at the end.
The abundance of massive datasets, often referred to as “Big Data,” has revolutionized the field of machine learning (ML). These vast datasets allow for training increasingly intricate ML models with more parameters, leading to improved accuracy and superior generalization capabilities across diverse tasks like predictive analytics. However, this power comes with challenges.
Ensuring data quality, processing massive amounts of data, interpreting complex models, and mitigating their sensitivity to noise are all hurdles to overcome. Additionally, achieving clear explanations for model decisions remains a goal.
Dimensionality reduction offers a powerful approach to these challenges. It transforms high-dimensional data into a lower-dimensional space, essentially filtering out irrelevant features and noise while preserving the essential information. This not only improves computational efficiency but also enhances model transparency by simplifying the feature space. Furthermore, it reduces overfitting by focusing on relevant features and strengthens generalization capabilities by focusing on core information and underlying trends in the data.
Within this context, dimensionality reduction, particularly feature selection, becomes a critical preprocessing step. It streamlines the data by reducing complexity, leading to increased model accuracy, robustness, and interpretability. Feature engineering, often achieved through dimensionality reduction, plays another vital role. By creating new features or transforming existing ones to reveal underlying patterns, feature engineering helps build stable, robust, and interpretable models [23–26]. Pham et al. [25] evaluated three feature dimension reduction techniques specifically in the context of machine learning models for crop yield prediction. This demonstrates the importance of understanding how dimensionality reduction impacts performance in machine learning tasks.
While Big Data brings immense potential, addressing its challenges is crucial for successful machine learning applications. Dimensionality reduction and feature engineering stand as powerful tools for navigating Big Data landscapes and building effective models.
This paper investigates the effects of four dimensionality reduction methods on the performance of a binary classifier. We analyze the impact of both supervised and unsupervised techniques. Principal Component Analysis (PCA) and Singular Value Decomposition (SVD) are the two unsupervised methods explored. These techniques transform the data by projecting features into new spaces and achieve dimensionality reduction by selecting the most significant components based on eigenvalues (PCA) or singular values (SVD) of the data matrix [10,16–19].
The supervised methods, which leverage class labels of the training vectors for selection of features, include univariate feature selection (UFS) based on chi-square statistics and feature selection using mutual information (MI). Our investigation, focusing on the CIC dataset and a Random Forest (RF) classifier, reveals that feature selection methods generally outperform feature extraction techniques (like PCA and SVD) in this specific context [26–29]. This suggests that directly selecting the most relevant features might be more effective than relying solely on dimensionality reduction through feature transformation.
This section details the evaluation process for assessing the performance of various binary machine learning (ML) classifiers when training data is limited. We also explore methods used for assessment of the impact of dimensionality reduction techniques on classifier performance. We evaluate seven binary ML classifiers on a dataset containing positive (attack) and negative (benign) samples. The performance of trained ML classifiers are assessed using two key metrics: true-positive rate (TPR) and true-negative rate (TNR). These classifiers are trained with very low numbers of labeled exemplars and the performance of trained classifiers are compared.
To comprehensively gauge the impact of the limited number of trainers, the experiments are repeated twenty-five times for each setting of the number of trainers. Each repetition involves training the classifier with randomly selected trainers and then utilizing the trained classifier to assign labels to a much larger number, compared to the training set, of randomly chosen test elements which include no training elements. The range of performance parameters is recorded for each classifier.
The binary classifiers considered are as follows: (i) logistic regression (LR) model using the limited-memory Broyden-Fletcher-Goldfarb-Shanno (L-BFGS) algorithm; (ii) support vector classifier (SVC) with a linear kernel; (iii) decision tree (DT) with a maximum depth of five; (iv) random forest (RF) with one hundred estimators; (v) nearest neighbor (KNN) using five neighbors; (vi) Naïve Bayes (NB) with a Gaussian distribution assumption; and (vii) neural network (NN) with one hidden layer consisting of sixty-four nodes and a dropout rate of twenty percent [28–31]. Reference [31] provides a basic understanding of logistic regression, which is helpful because its performance can be significantly impacted by the number of features, making it a useful case study for exploring the effects of dimensionality reduction on machine learning algorithms.
We have also investigated the impact of data dimensionality reduction on the binary ML classifier performance across a wide range of trainer numbers. Specifically, we assess the effects of four dimensionality reduction methods, encompassing two feature extraction procedures utilizing data projection methods and two feature selection techniques, on classifier performance.
The feature extraction methods, which rely on data projection techniques, employ principal component analysis (PCA) and singular value decomposition (SVD) algorithms to project the data into new spaces and represent the data points using new features. In the PCA algorithm, the data is projected along the computed eigenvectors, which serve as the new features. These eigenvectors are subsequently ranked according to the values of their corresponding eigenvalues. By specifying the desired number of dimensions, k, only the features with the highest eigenvalues are retained, while the rest are discarded, effectively reducing data dimensionality. On the other hand, the SVD algorithm expresses the data as the product of three matrices: left and right orthonormal matrices, which comprise the singular vectors or directions, and a middle diagonal matrix, which contains the singular values [14–18]. Data dimensionality reduction is achieved by discarding the smaller singular values and their corresponding singular vectors beyond the k largest ones. It must be noted that both projection methods discussed in this paper utilize only the feature vectors, without incorporating their labels. Therefore, they are both categorized as unsupervised dimensionality reduction methods. Unlike PCA and SVD algorithms, feature selection methods reduce data dimensionality without projecting the data into new spaces. In the methods discussed here, such as univariate feature selection (UFS) and mutual information (MI) feature selection, a user-prescribed number of features, denoted as k, are selected to best represent the labeled data. Both methods assess each feature independently and assign scores based on their importance [21–23]. UFS and MI-FS calculate feature scores using, respectively, chi-squared statistics and mutual information with respect to the target label. These methods are both categorized as supervised dimensionality reduction methods.
The metrics used to evaluate the performance of the binary classifier include true-positive rate (TPR) or recall, true-negative rate (TNR) or specificity, precision, F-score, and accuracy, which will be defined shortly. Evaluation of the binary classifier involves assigning one of two labels to each test vector, namely, zero- also called benign or negative- and one also called attack or positive. True-positive (TP) refers to the attack test vectors which the trained classifier correctly labels as positive, true-negative (TN) denotes benign test vectors which the classifier correctly labels as negative, false-positive (FP) indicates benign test vectors mislabeled as positive by the classifier, and false-negative (FN) represents attack test vectors mislabeled as negative by the classifier. Recall or TPR is the proportion of positive cases that the classifier correctly classifies. Specificity or TNR is the proportion of negative cases that are correctly classified by the classifier. Precision is the proportion of positive classifications that are truly positive. F-score is the harmonic mean of recall and precision. Accuracy is the proportion of classifier predictions that are correct. Eqs. (1)–(5) below summarize the classifier performance metrics [27–30]. Table 1 summarizes the descriptions of the classifier evaluation metrics.

The dataset, which is obtained from Reference [24], consists of 225,745 numerical feature vectors, each comprising sixty-six features and one binary label. Among these, 97,718 are labeled as zeros (benign or normal) while the remaining 128,027 are labeled as ones (DDoS or attack). In every simulation, both the training and test sets are balanced to ensure an equal number of normal and attack elements in each set.
Each experiment utilizes a user-defined number of training elements. These elements are randomly selected from separate sets containing normal and attack data. The test set, consistently containing 10,000 elements from each class across all experiments, is constructed after assembling the training set. This is done by randomly selecting elements from the remaining elements within their respective original sets (normal or attack).
To ensure consistent feature scales across training and testing data, both sets undergo normalization in each experiment. This normalization process involves setting the mean and standard deviation of each feature to zero and one, respectively, for both the training and test sets.
4.1 Effect of Number of Trainers on RF Classifier Performance
In the experiment depicted in Fig. 1, the number of training elements from each class was initially set at 10, 25, 50, and 100, and was incrementally increased to 1000 in steps of 100. For each setting of the number of trainers, a random forest (RF) classifier was trained, and the trained classifier was subsequently used to assign labels to the test set, which comprised twenty thousand elements equally divided between normal and attack instances.
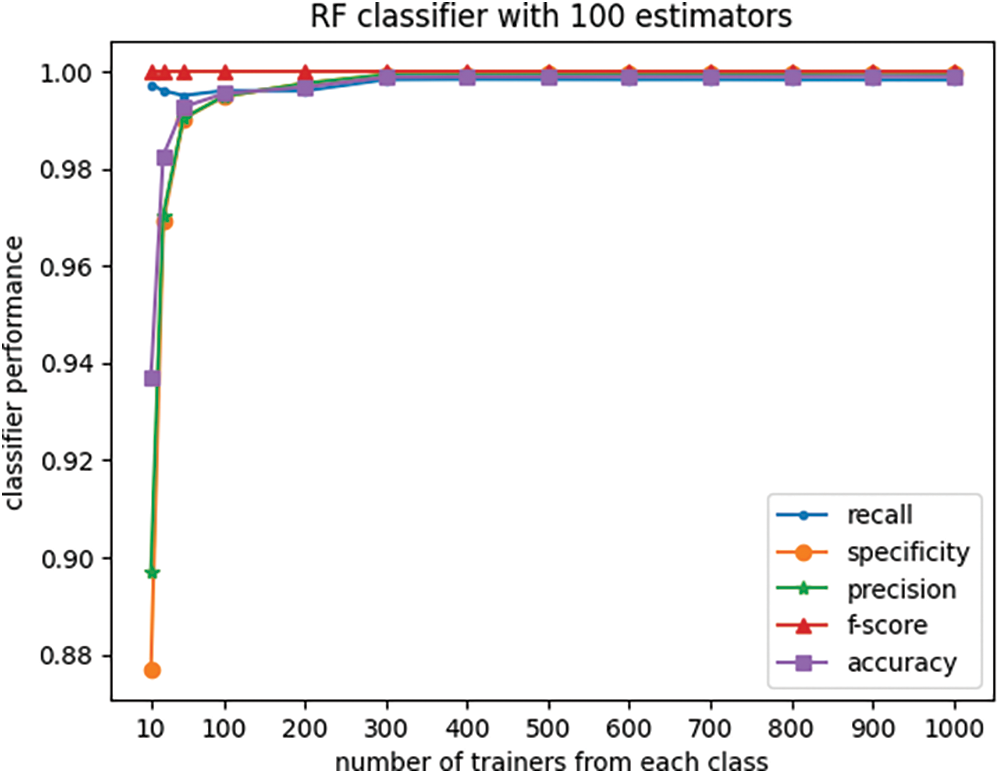
Figure 1: Effect of the number of trainers on RF classifier performance
For each setting of the number of trainers the experiment was repeated twenty-five times, and the results of classifier performance were recorded and subsequently averaged across all experiment iterations. The plots in Fig. 1 illustrate the effect of the number of trainers on the RF classifier performance, as measured by five different metrics.
Furthermore, the boxplots in Figs. 2 and 3 display the variations in recall and specificity of the RF classifier across all twenty-five experiment iterations for each setting of the number of trainers. The line plots in these figures depict the mean values across the twenty-five iterations of each experiment.
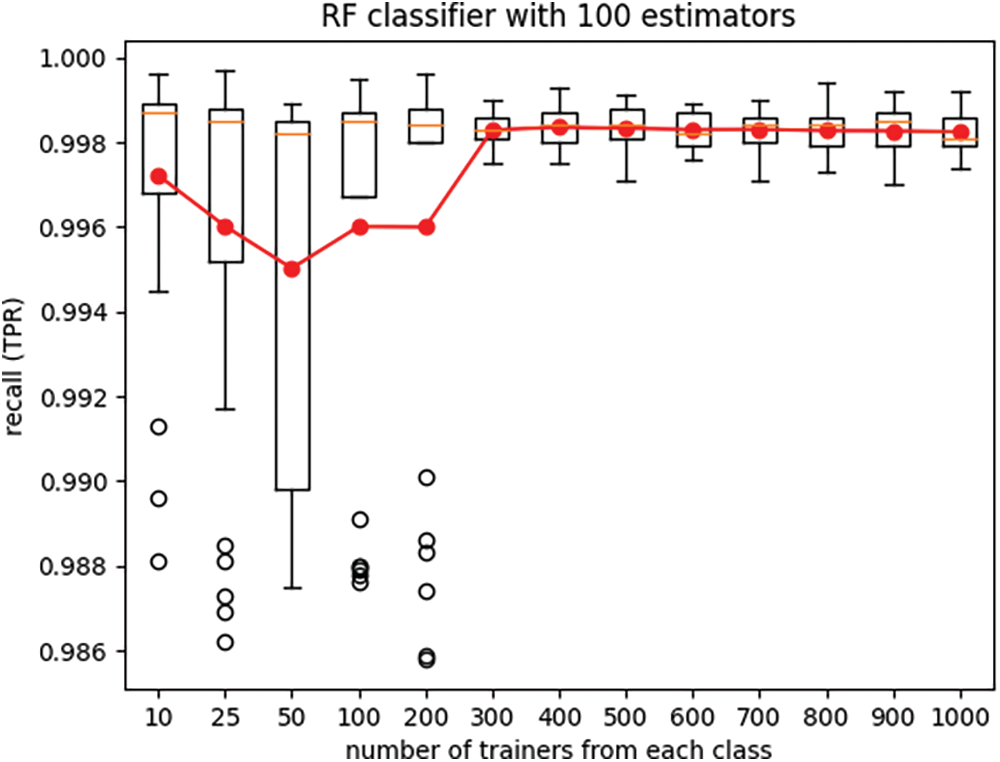
Figure 2: True-positive rate (recall) of the RF classifier
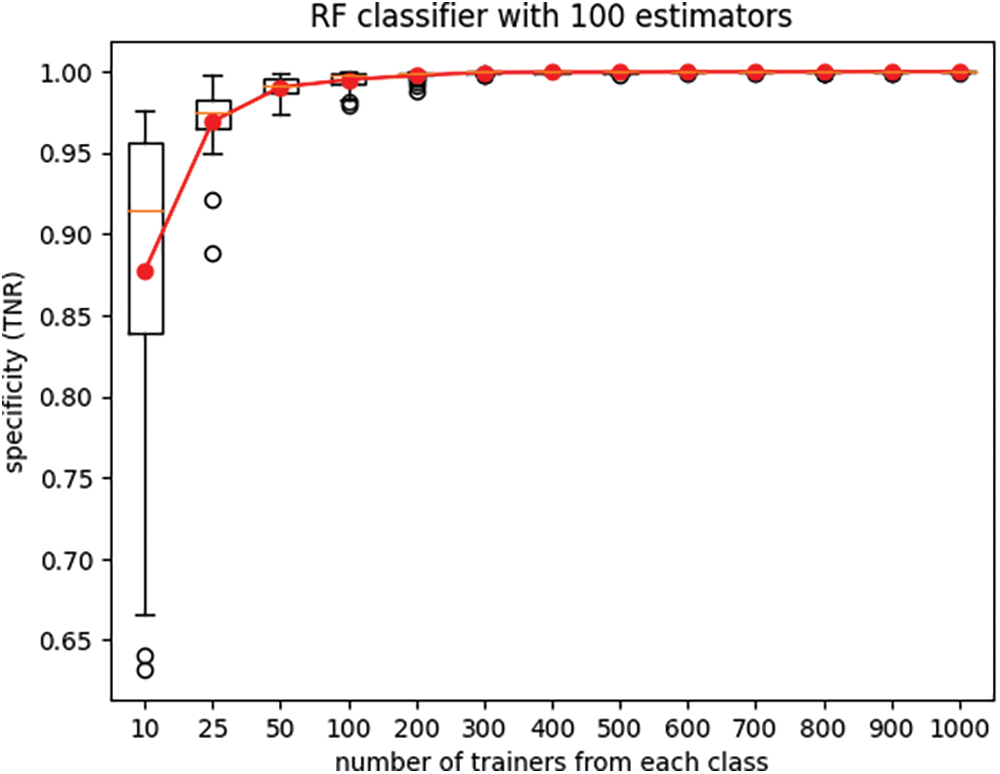
Figure 3: True-negative rate (specificity) of the RF classifier
It is seen from Figs. 2 and 3 that performance of classifiers trained with very small trainer sets can have large variances across different instantiations of the experiment. Small trainer sets do not fully capture the underlying trends of the dataset, and as a result the classifier trained with such trainer sets lack generalization ability. As anticipated, increasing the number of trainers resulted in improved classifier performance and reduced performance variance across different experiment iterations. Although training and testing of classifiers with limited datasets are normally done using k-fold cross validation, the goal of this experiment is different. The goal of the experiment of Figs. 2 and 3 is to illustrate that limited training data can result in wide dispersion and significant variability of performance metrics recall and specificity.
4.2 Effect of Classifier Type on Performance
This section aims to ascertain and compare the baseline performance metrics of standard classifiers on our dataset in order to select one classifier for further investigation. Specifically, seven types of classifiers—logistic regression (LR), support vector classifier (SVC), decision tree (DT), random forest (RF), k-nearest neighbors (KNN), Naïve Bayes (NB), and feedforward neural network (NN)—were trained using the same training set. Subsequently, these trained classifiers were employed to classify the same test set, which consisted of packet headers that had not been trained on. The investigation centered on the impact of the number of trainers on classifier performance, with comparisons drawn among the various classifiers.
The parameter settings used for the classifiers are as follows: L-BFGS solver for LR; Linear kernel for SVC; Maximum depth of five for DT; One-hundred estimators for RF; Five neighbors for KNN; Gaussian distribution for Naïve Bayes; One hidden layer with sixty-four nodes, twenty percent dropout, and ReLU activation function for NN.
The test set consists of 20,000 elements, equally divided between normal and attack vectors. The number of training elements from each class was set at 20, 100, and 500. For each setting of the number of trainers, the experiment was repeated twenty-five times. In each repetition, different sets of trainers and testers were selected. Seven classifiers were trained using the same training set, and the performance of these trained classifiers was evaluated using the same test set.
The boxplots in Figs. 4 through 7 depict the performance of various classifiers, with each figure illustrating the variations in classifier performance across twenty-five iterations of the experiment for all seven classifiers, with a fixed number of trainers. The number of trainers for each experiment is provided in the titles of the respective plots. In each figure, the red line represents the average performance measure across all twenty-five experiment iterations. These results indicate that the RF classifier exhibits the best overall performance. Additionally, it is observed that recall (TPR) exhibits much lower variance than specificity (TNR) across different experiments for all seven classifiers when the number of trainers from each class is set to one hundred.
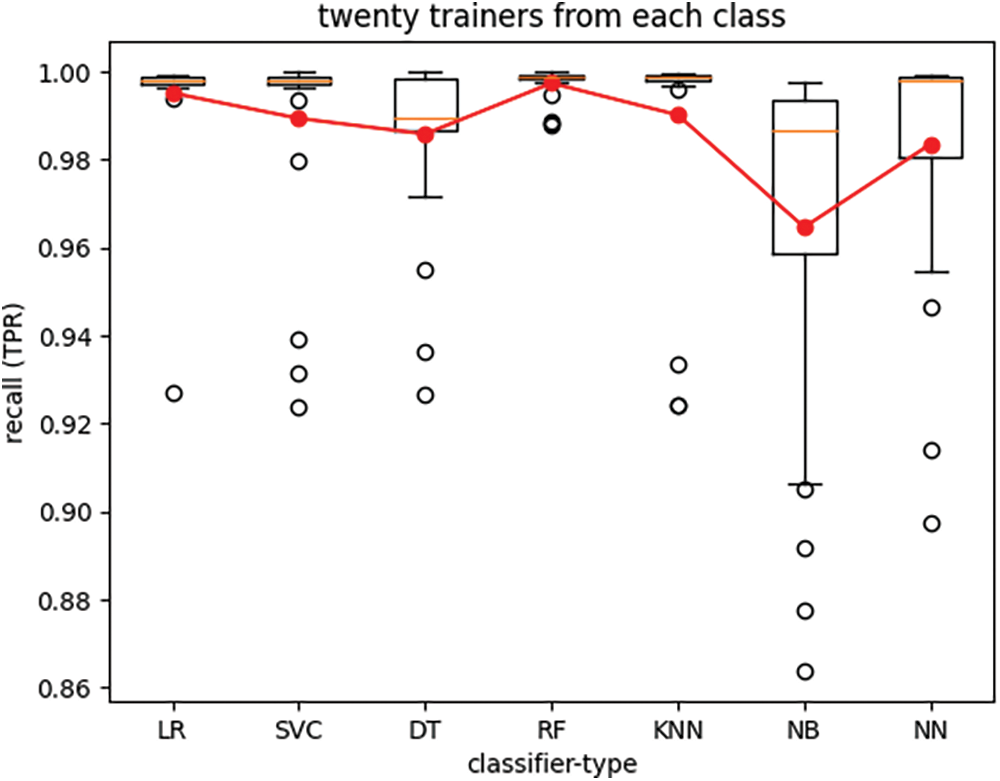
Figure 4: True-positive rate of seven classifier types trained with twenty trainers from each class
Tables 2 through 4 present the mean and standard deviation of three performance measures, namely recall, specificity, and accuracy for different classifiers across varying numbers of trainers from each class, across twenty-five experiment iterations.

Figs. 4–7 and Tables 2–4 demonstrate that for our dataset RF emerges as the preferred classifier due to its superior performance, as evidenced by higher recall and specificity metrics, along with greater stability in performance across smaller trainer sets.
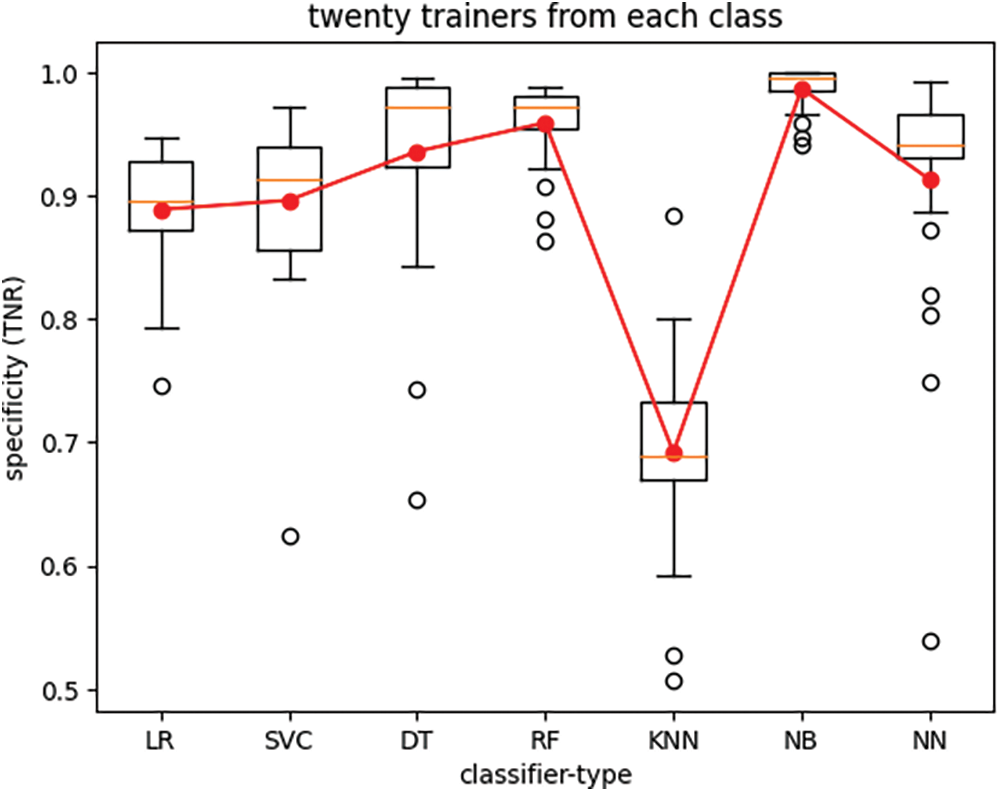
Figure 5: True-negative rate of seven classifier types trained with twenty trainers from each class
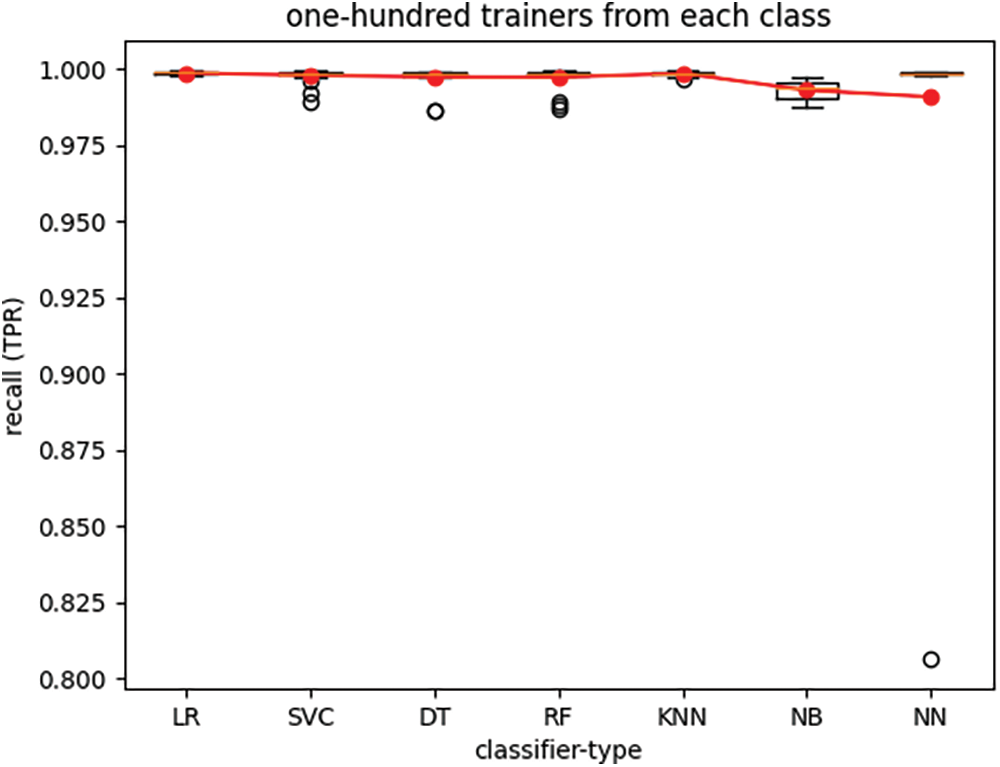
Figure 6: True-positive rate of seven classifier types trained with one-hundred trainers from each class
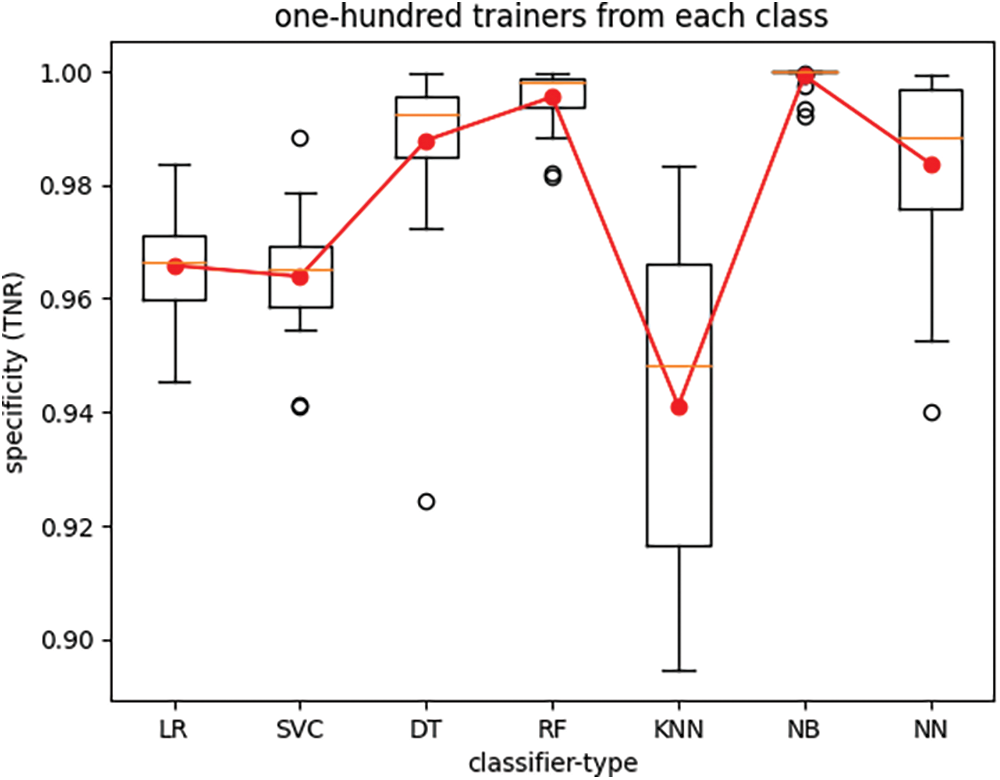
Figure 7: True-negative rate of seven classifier types trained with one-hundred trainers from each class


4.3 Effect of Dimensionality Reduction on Classifier Performance
Dimensionality reduction serves as a preprocessing step aimed at mitigating the effects of feature mutual correlations and redundancy, thereby enhancing data quality, and reducing noise. By employing techniques such as feature extraction and feature selection in machine learning applications, dimensionality reduction not only reduces computational costs but also improves model performance, enhances model robustness, and increases model transparency.
4.3.1 Dimensionality Reduction in Projection Spaces
A dataset consisting of two hundred feature vectors, equally divided between normal and attack instances, was randomly selected from the datasets described in Section 4. The corresponding eigenvectors and eigenvalues of the 66-dimensional dataset were then computed. The plot of Fig. 8 shows all 66 eigenvalues, where the mean eigenvalue is 0.96.
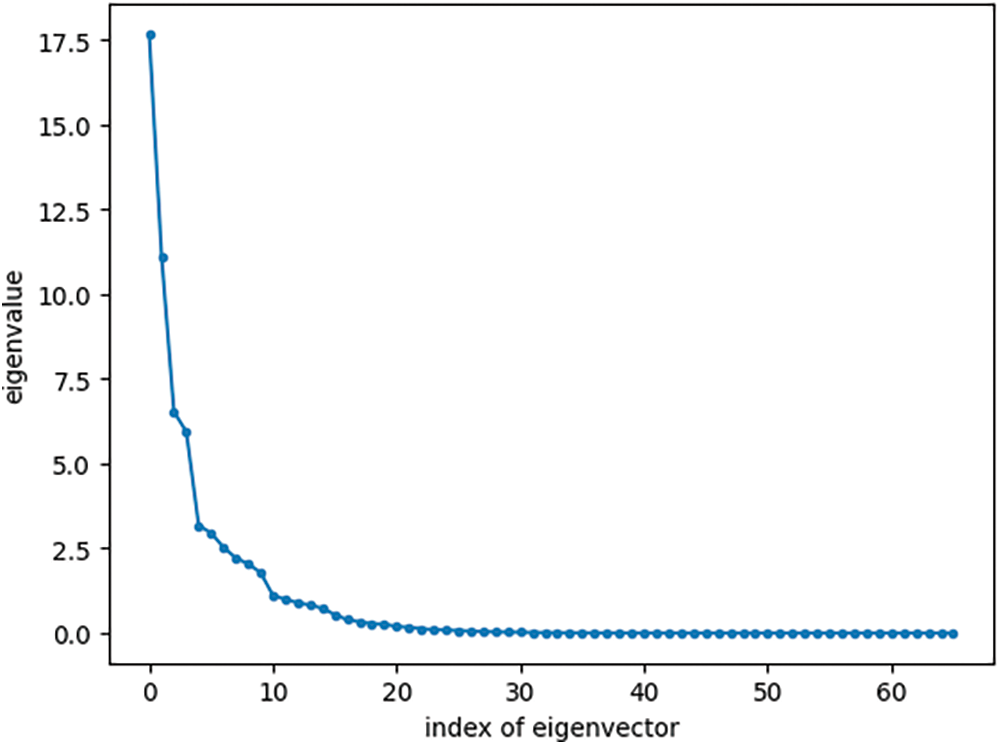
Figure 8: Eigenvalues of the training set
The dataset described earlier can be compressed while retaining most of the information through a technique called Principal Component Analysis (PCA). PCA projects the data onto a new space defined by a set of eigenvectors, also known as principal components or directions. Importantly, these eigenvectors capture the greatest variance in the data. By applying the Kaiser criterion [17], we can identify the most significant eigenvectors—those with eigenvalues exceeding one. In our case, eleven such eigenvectors are identified. This allows us to project both the training dataset and any new data point, from the original 225,754 elements, onto this new, lower-dimensional space of eleven dimensions with minimal loss of information.
In this experiment, we investigate the impact of feature extraction and data dimensionality reduction using PCA on classifier performance. We begin by projecting the training and test data into a new eigenspace and utilizing a user-defined number of features to train and test the classifier.
Figs. 9 and 10 depict the effect of dimensionality reduction on the RF classifier performance across various training set sizes. For each setting of the number of trainers, trainers and testers were randomly selected. The train and test sets were then projected onto the new space using PCA, and the classifier was trained using the reduced-dimensional training set. Subsequently, the trained classifier was employed to predict labels for the reduced-dimensional test vectors.
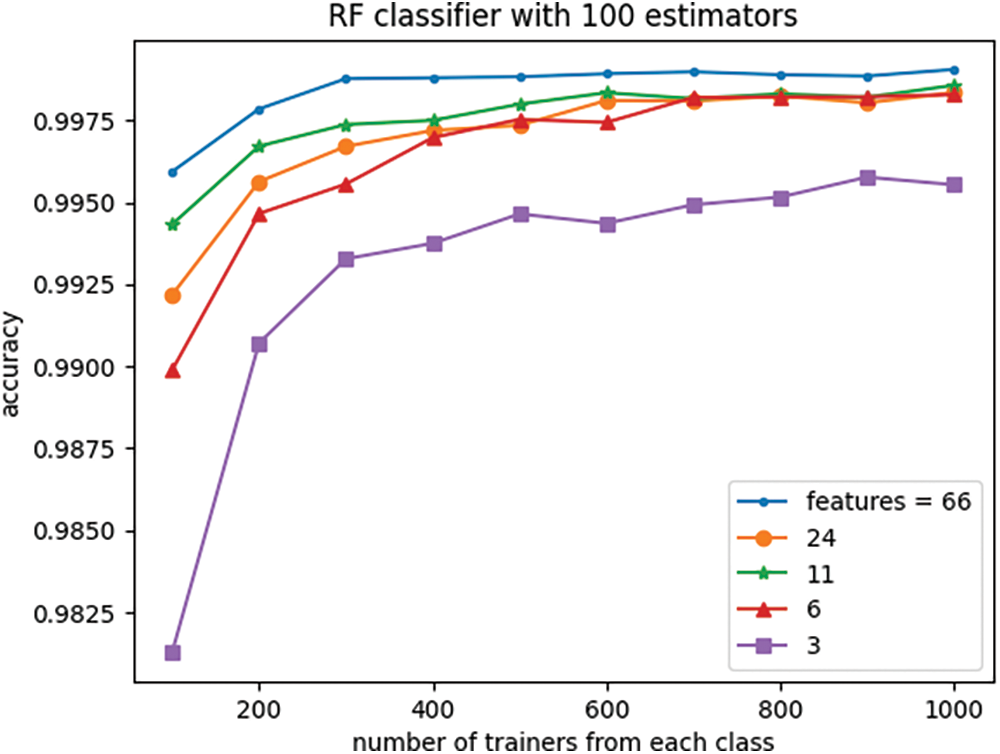
Figure 9: Effect of the number of features and trainers on classifier accuracy
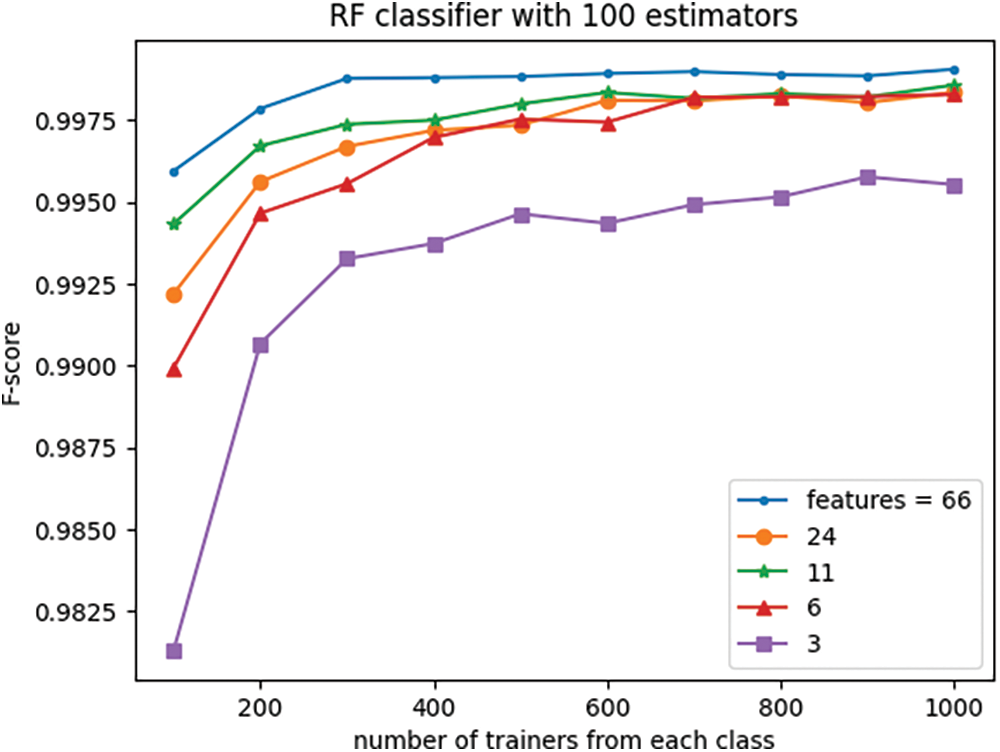
Figure 10: Effect of the number of features and trainers on classifier F-score
This process was repeated twenty-five times for each setting of the number of trainers, and the performance results were averaged across all experiment iterations. We chose to use a simpler approach instead of k-fold validation. This is because we wanted to use a small number of trainers and a much larger test set. Additionally, our dataset was very large, containing 195,436 samples (half normal, half attack data). Using k-fold validation wouldn’t have been efficient in this case.
The experiment demonstrates that the RF classifier’s performance, measured by accuracy and f-score, remains relatively stable even as the data dimension is reduced from the original 66 to 6, particularly for large numbers of trainers. However, for trainer sets smaller than 600, reducing the data dimensionality to eleven leads to only slightly diminished performance in comparison to the original 66-dimensional data, yet it still outperforms the 24-dimensional space. This observation suggests that while the 24-dimensional space preserves more information from the original 66-dimensional data compared to 11 dimensions, it also contains significantly more noise.
Interestingly, reducing the dimensionality to three does not significantly affect classifier performance especially when the trainer set is large.
The plots of Fig. 11 compare the effects of dimensionality reduction using two projection methods, namely, principal component analysis (PCA) and singular value decomposition (SVD) on the classifier performance. It is noted that both methods lead to virtually identical results.
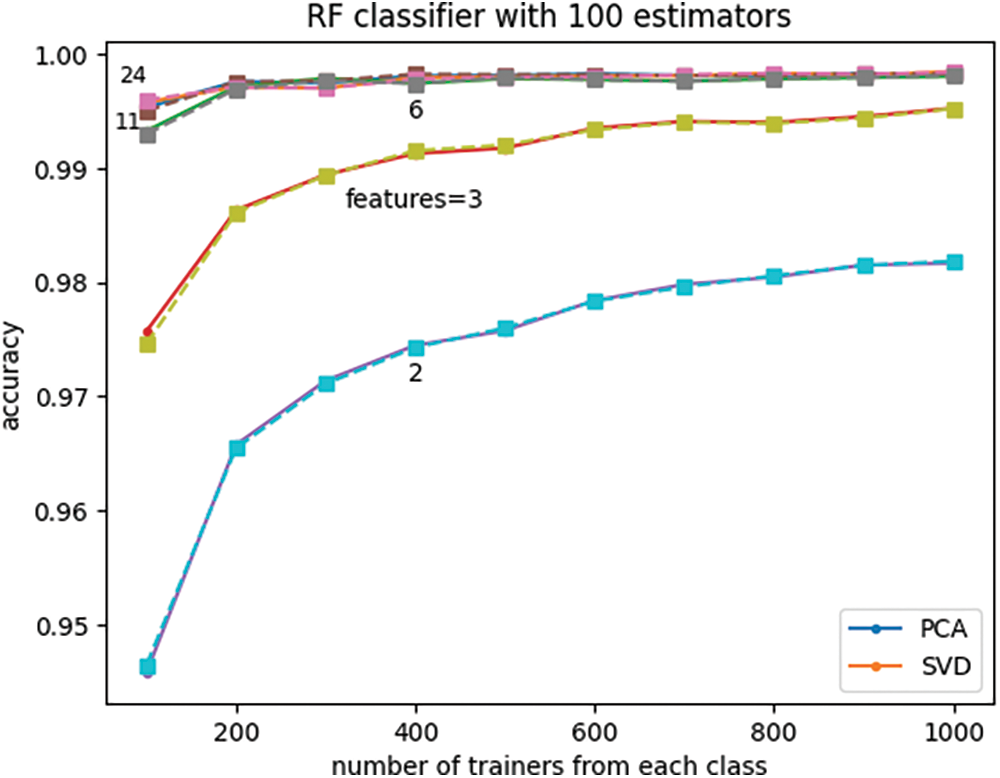
Figure 11: Effect of the number of trainers, features, and projection method on classifier accuracy
4.3.2 Dimensionality Reduction with Feature Selection
This section investigates the impact of dimensionality reduction through feature selection on classifier performance. Unlike PCA and SVD, which project data into orthonormal spaces and select components based on eigenvalues or singular values, feature selection does not involve projecting data into a new space. Instead, feature selection methods evaluate the importance of each feature based on its mutual relationship or dependence with the binary label. This section explores two such feature selection methods, assessing how effectively they identify and retain the most relevant features for data classification.
Both univariate feature selection (UFS) and mutual information feature selection (MI-FS) aim to identify the most informative features for classification. UFS utilizes the chi-squared test, while MI-FS leverages mutual information, to measure the strength of the relationship between each individual feature and the target label [21–23].
These methods assign scores to each feature based on the calculated dependence. Features are then ranked according to their scores. The user-specified parameter k determines the number of top-scoring features to retain for the classification task. The remaining features, deemed less informative, are discarded from the dataset.
Figs. 12 through 17 illustrate the impact of dimensionality reduction and the number of trainers on classifier performance. In Figs. 12–16, alongside the feature selection methods, the results obtained using one projection method, namely PCA, are also presented for comparison. As expected, consistently, increasing the number of trainers leads to improved classifier accuracy regardless of the dimensionality reduction method employed.
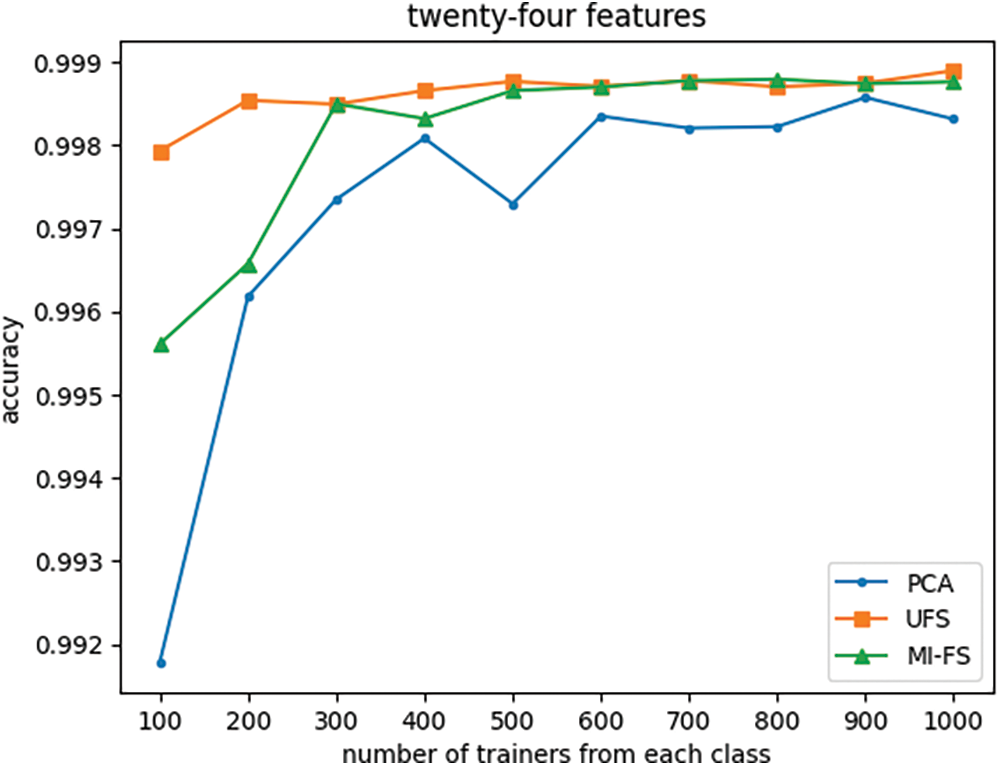
Figure 12: Effect of the number of trainers and feature selection method on classifier accuracy with number of features fixed at twenty-four
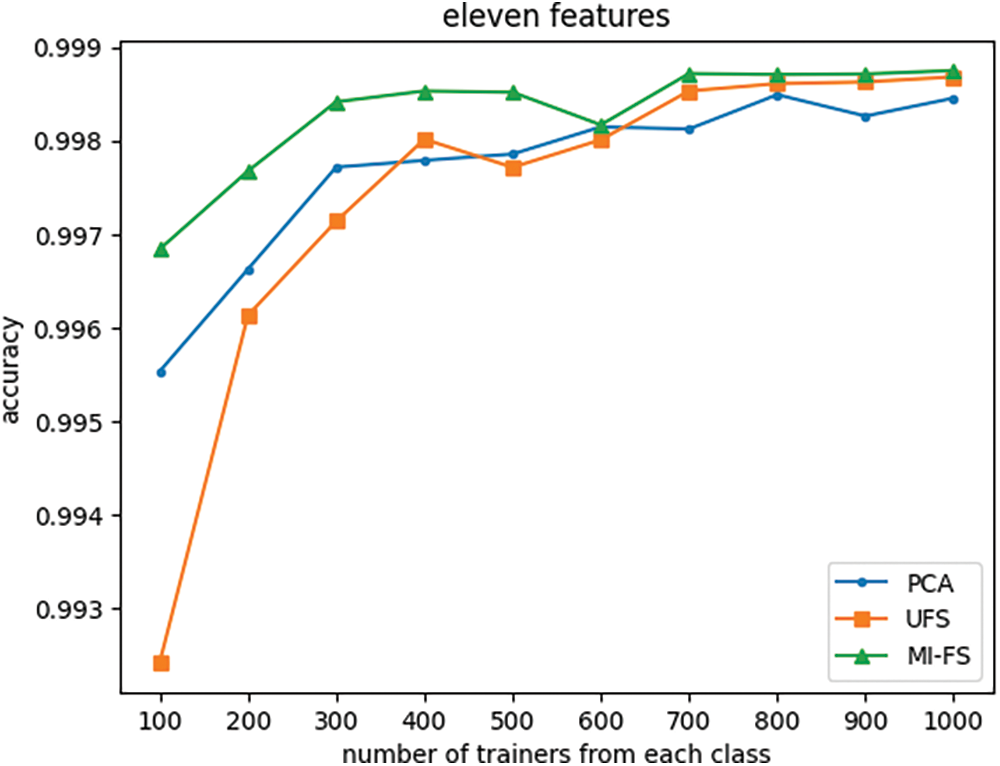
Figure 13: Effect of the number of trainers and feature selection method on classifier accuracy with number of features fixed at eleven
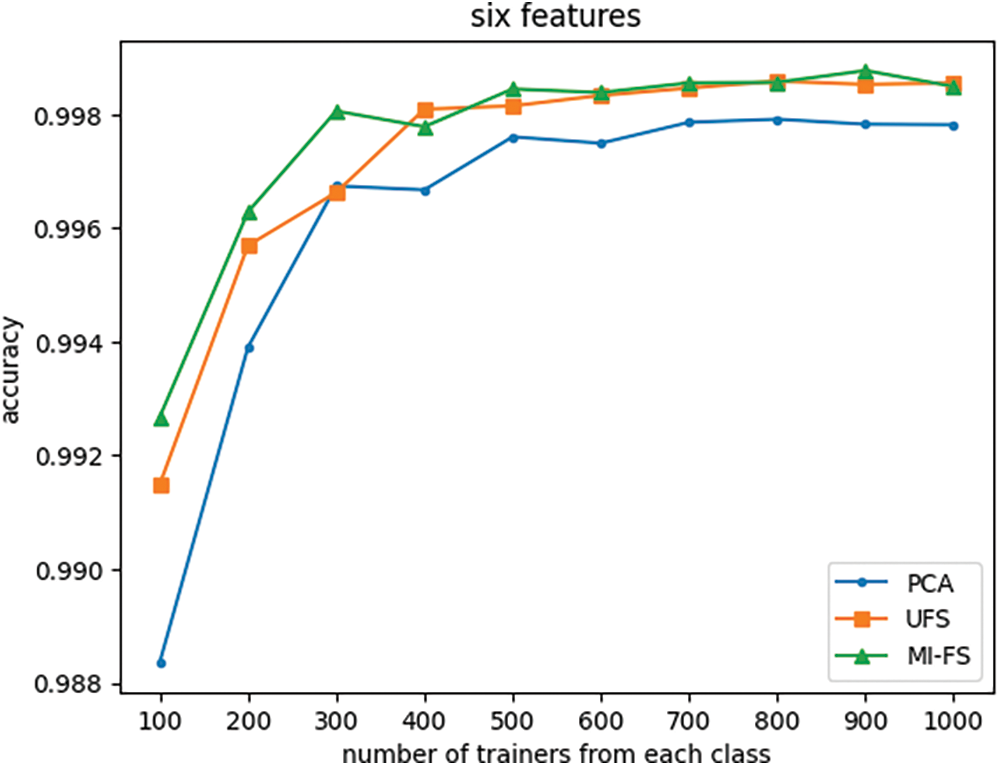
Figure 14: Effect of the number of trainers and feature selection method on classifier accuracy with number of features fixed at six
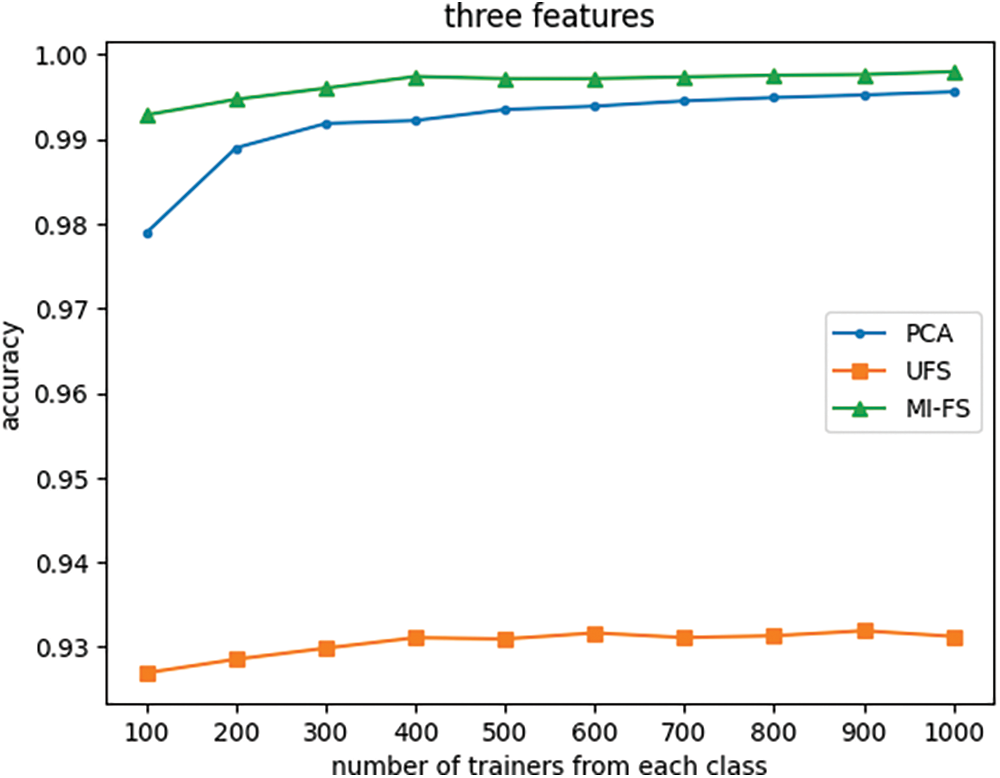
Figure 15: Effect of the number of trainers and feature selection method on classifier accuracy with number of features fixed at three
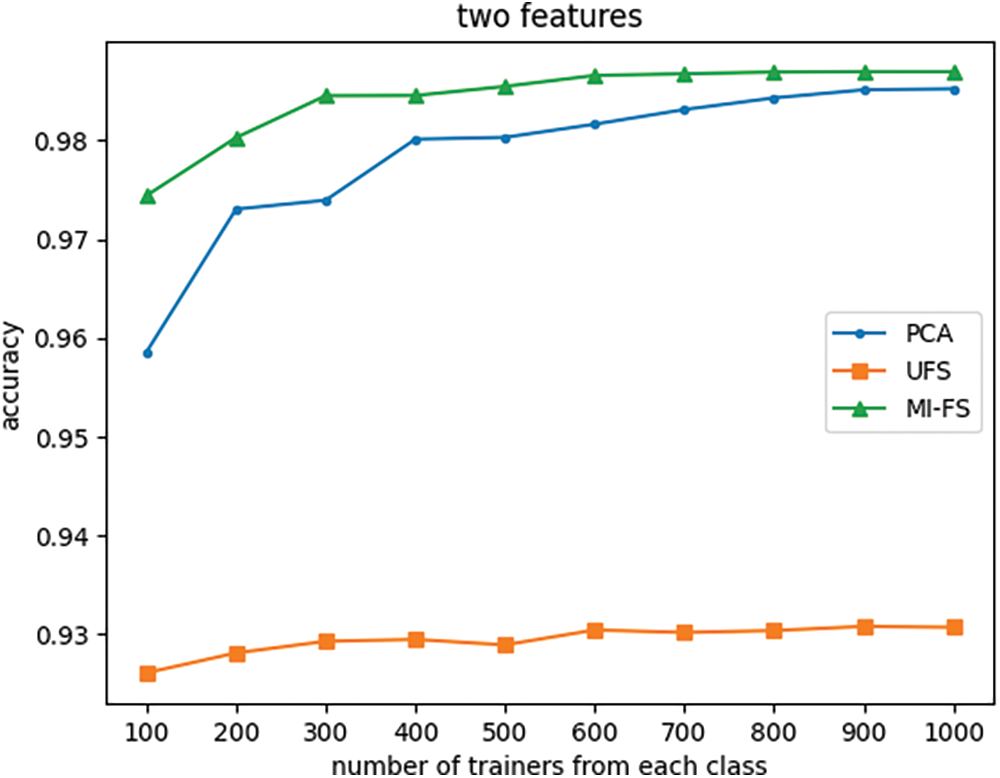
Figure 16: Effect of the number of trainers and feature selection method on classifier accuracy with number of features fixed at two
Fig. 12 indicates that when the number of features is reduced from its original value of 66 to 24, the UFS and MI-FS methods both outperform PCA across all trainer counts. Additionally, it demonstrates that for smaller trainer counts, the UFS method outperforms MI-FS. However, Figs. 13 through 16 reveal that when the number of features is further reduced to eleven or fewer, MI-FS outperforms UFS.
Moreover, the results depicted in Fig. 17 suggest that the number of selected features can be reduced from the original 66 to 6 without any drastic adverse effect on classifier performance.

Figure 17: Effect of the number of trainers and selected features on classifier accuracy
In this study, we thoroughly investigated the performance of seven binary machine learning classifiers using an open-source dataset. Through experimentation and analysis, we gained valuable insights into the impacts of different factors on classifier performance. Our evaluation of performance metrics, including true-positive rate (TPR), true-negative rate (TNR), precision, F-score, and accuracy, provided comprehensive insights into classifier behavior. These metrics allowed us to assess the classifiers’ abilities to correctly classify positive and negative instances, identify potential trade-offs between precision and recall, and evaluate overall predictive performance.
Our analysis of the chosen dataset reveals that the random-forest (RF) classifier outperforms the other six examined classifiers across several performance metrics. We investigated the impact of training set size on the RF classifier’s performance, using a variety of evaluation metrics. Interestingly, even when trained with a very low number of examples, the RF classifier achieves reasonably good performance, as evidenced by its concurrently high average recall and specificity. However, using very small training sets can introduce unwanted variability in the performance metrics.
This study investigates how different data dimensionality reduction techniques affect the accuracy of the trained random forest classifier. We have examined two approaches: feature engineering through projection (PCA and SVD) and feature selection in the native space. Interestingly, both projection methods, PCA and SVD, yielded virtually identical performance for the trained classifier. This study has shown that dimensionality reduction using feature selection in the native space is more effective than feature selection in projected spaces. Furthermore, our analysis reveals that feature selection based on mutual information is preferable to chi-squared statistics. These findings demonstrate that carefully chosen dimensionality reduction techniques can reduce computational cost and improve model interpretability without compromising the trained machine learning model’s performance.
Our study lays the groundwork for future research in several directions. Firstly, the effects of nonlinear dimensionality reduction methods including t-distributed stochastic neighbor embedding (t-SNE) is an important area to be investigated. Further investigation into the robustness of classifiers under different data distributions and imbalance ratios could provide valuable insights into their generalization capabilities. Additionally, exploring advanced techniques such as ensemble learning, deep learning, and transfer learning could lead to further improvements in classifier performance across diverse domains. Overall, this study contributes to the ongoing efforts to advance the state-of-the-art in binary classifier performance evaluation and optimization. By addressing key challenges and exploring innovative methodologies, we aim to empower practitioners and researchers in their pursuit of building more accurate, reliable, and interpretable machine learning models for real-world applications.
Acknowledgement: The authors gratefully acknowledge the insightful reviews and constructive comments provided by the reviewers of the Journal of Cybersecurity.
Funding Statement: Kaveh Heidary and Venkata Atluri were partially funded by US Army Combat Capabilities Development Command (CCDC) Aviation & Missile Center, https://www.avmc.army.mil/ (accessed on 5 February 2024), CONTRACT NUMBER: W31P4Q-18-D-0002 through Georgia Tech Research Institute and AAMU-RISE.
Author Contributions: The authors confirm contributions to the paper as follows: study conception, design, analysis and interpretation of results, draft manuscript: Kaveh Heidary; data collection and interpretation of results: Venkata Atluri; analysis and interpretation of results: John Bland. All authors reviewed the results and approved the final version of the manuscript.
Availability of Data and Materials: The data used in the experiments of this paper is open-source and available at https://www.unb.ca/cic/datasets/ddos-2019.html (accessed on 5 February 2024).
Ethics Approval: Not applicable.
Conflicts of Interest: The authors declare that they have no conflicts of interest to report regarding the present study.
References
1. R. Kaur, D. Gabrijelcic, and T. Klobucar, “Artificial intelligence for cybersecurity: literature review and future research directions,” Inf. Fusion, vol. 97, no. 6, pp. 1–29, Sep. 2023. [Google Scholar]
2. A. J. Azambuja, C. Plesker, K. Schutzer, R. Anderl, B. Schleich and V. R. Almeida, “Artificial intelligence-based cybersecurity in the context of industry-4,” Electronics, vol. 12, no. 8, pp. 1–18, Apr. 2023. [Google Scholar]
3. S. R. Mubarakova, S. T. Amanzholova, and R. K. Uskenbayeva, “Using machine learning methods in cybersecurity,” Eurasian J. Math. Comput. Appl., vol. 10, no. 1, pp. 69–78, Mar. 2022. [Google Scholar]
4. Z. Lv, L. Qiao, J. Li, and H. Song, “Deep learning-enabled security issues in the Internet of Things,” IEEE Internet Things J., vol. 8, no. 12, pp. 9531–9538, Jun. 2021. doi: 10.1109/JIOT.2020.3007130. [Google Scholar] [CrossRef]
5. D. Barton and A. Z. Li, A Brief History of Machine Learning in Cybersecurity. Security Info Watch, Nov. 2019. Accessed: Jun. 27, 2024. [Online]. Available: https://www.securityinfowatch.com/cybersecurity/article/21114214/a-brief-history-of-machine-learning-in-cybersecurity [Google Scholar]
6. D. Ravi, C. Wong, B. Lo, and G. Z. Yang, “A deep learning approach to on-node sensor data analytics for mobile or wearable devices,” IEEE J. Biomed. Health Inform., vol. 21, no. 1, pp. 56–64, Jan. 2017. doi: 10.1109/JBHI.2016.2633287. [Google Scholar] [PubMed] [CrossRef]
7. K. Bresniker, A. Gavrilovska, J. Holt, D. Milojicic, and T. Tran, “Grand challenge: Applying artificial intelligence and machine learning to cyber security,” Computer, vol. 52, no. 12, pp. 45–52, Dec. 2019. doi: 10.1109/MC.2019.2942584. [Google Scholar] [CrossRef]
8. R. A. Lahcen and R. Mohapatra, “Challenges in cybersecurity and machine learning,” Panam. Math. J., vol. 32, no. 1, pp. 14–33, Jan. 2022. [Google Scholar]
9. V. Berisha et al., “Digital medicine and curse of dimensionality,” npj Digital Med., vol. 4, no. 153, pp. 1–8, Oct. 2021. [Google Scholar]
10. E. G. Cuesta, R. Aler, D. P. Vazquez, and I. M. Calvan, “A combination of supervised dimensionality reduction and learning methods to forecast solar radiation,” Appl. Intell., vol. 53, no. 11, pp. 13053–13066, Jun. 2023. doi: 10.1007/s10489-022-04175-y. [Google Scholar] [CrossRef]
11. S. Velliangiri, S. Alagumuthukrishnan, and S. I. Thankumarjoseph, “A review of dimensionality reduction techniques for efficient computation,” Procedia Comput. Sci., vol. 165, no. 8, pp. 104–111, Feb. 2020. doi: 10.1016/j.procs.2020.01.079. [Google Scholar] [CrossRef]
12. W. Jia, M. Sun, J. Lian, and S. Hou, “Feature dimensionality reduction: A review,” Complex Intell. Syst., vol. 8, pp. 2663–2693, Jan. 2022. [Google Scholar]
13. R. R.Aziz, C. K. Verma, and N. Srivastava, “Artificial neural network classification of high dimensional data with novel optimization approach of dimension reduction,” Annals Data Sci., vol. 5, no. 4, pp. 615–635, Dec. 2018. doi: 10.1007/s40745-018-0155-2. [Google Scholar] [CrossRef]
14. J. Clark and F. Provost, “Unsupervised dimensionality reduction versus supervised regularization for classification from sparse data,” J. Data Min. Knowl. Disc., vol. 33, no. 4, pp. 871–916, Jul. 2019. doi: 10.1007/s10618-019-00616-4. [Google Scholar] [CrossRef]
15. T. Hastie, R. Tibshirani, and J. Friedman, The Elements of Statistical Learning: Data Mining, Inference, and Prediction ,2nd Ed. Berlin: Springer, Aug. 2008. [Google Scholar]
16. S. Deegalla and H. Bostrom, “Reducing high-dimensional data by principal component analysis vs. random projection for nearest neighbor classification,” in Proc. 5th Int. Conf. Mach. Learn. Appl. (ICMLA’06), Orlando, FL, USA, 2006, pp. 245–250. [Google Scholar]
17. I. T. Jolliffe, “Principal component analysis and factor analysis,” in Principal Component Analysis, New York, NY: Springer, pp. 115–128, 1986. [Google Scholar]
18. I. T. Jolliffe, “Interpreting principal components: Examples,” in Principal Component Analysis, 2nd ed. New York: Springer, 2002, pp. 63–76. [Google Scholar]
19. P. N. Belhumeur, J. P. Hespanha, and D. J. Kriegman, “Eigenfaces vs. fisherfaces: Recognition using class specific linear projection,” IEEE Trans. Pattern Anal. Mach. Intell., vol. 19, no. 7, pp. 711–720, Jul. 1997. doi: 10.1109/34.598228. [Google Scholar] [CrossRef]
20. J. A. Lee and M. Verleysen, Nonlinear Dimensionality Reduction (Information Science and Statistics), 2007 ed. New York, NY, USA: Springer, 2007. [Google Scholar]
21. J. R. Vergara and P. Estevez, “A review of feature selection methods based on mutual information,” Neural Comput. Appl., vol. 24, no. 1, pp. 10–23, Jan. 2014. doi: 10.1007/s00521-013-1368-0. [Google Scholar] [CrossRef]
22. M. Beraha, A. M. Metelli, M. Papini, A. Trinzoni, and M. Rostelli, “Feature selection via mutual information: New theoretical insight,” in Int. Joint Conf. Neural Netw. (IJCNN), Budapest, Hungary, Jul. 2019. [Google Scholar]
23. G. Chandrashekar and F. Sahin, “A survey on feature selection methods,” Comput. Electr. Eng., vol. 40, no. 1, pp. 16–28, Jan. 2014. doi: 10.1016/j.compeleceng.2013.11.024. [Google Scholar] [CrossRef]
24. CIC-DDoS 2019 Dataset. Accessed: Feb. 5, 2024. [Online]. Available: https://www.unb.ca/cic/datasets/ddos-2019.html [Google Scholar]
25. H. T. Pham, J. Awange, and M. Kuhn, “Evaluation of three feature dimension reduction techniques for machine-learning based crop yield prediction models,” Sensors, vol. 22, no. 17, pp. 1–18, Sep. 2022. doi: 10.3390/s22176609. [Google Scholar] [PubMed] [CrossRef]
26. M. Altin and A. Cakir, “Exploring the influence of dimensionality reduction on anomaly detection performance in multivariate time series,” Mar. 2024, arXiv:2403.04429. [Google Scholar]
27. C. M. Bishop, Pattern Recognition and Machine Learning. New York, NY, USA: Springer, 2006. [Google Scholar]
28. A. Geron, Hands-on Machine Learning with Scikit-Learn. Oreilly, Boston: Keras & TensorFlow, 2019. [Google Scholar]
29. S. A. Hicks et al., “On evaluation metrics for medical applications of artificial intelligence,” Nature Sci. Rep., vol. 12, no. 5979, pp. 1–9, Apr. 2022. doi: 10.1038/s41598-022-09954-8. [Google Scholar] [PubMed] [CrossRef]
30. Metric and scoring: quantifying the quality of predictions. Accessed: Mar. 10, 2024. [Online]. Available: https://scikit-learn.org/stable/modules/generated/sklearn.metrics.precision_recall_fscore_support.html [Google Scholar]
31. A. Pal, “Logistic Regression: A Simple Primer,” Cancer Res. Stat. Treat. vol. 4, no. 3, pp. 551–554, Jul. 2021. [Google Scholar]
Cite This Article
 Copyright © 2024 The Author(s). Published by Tech Science Press.
This work is licensed under a Creative Commons Attribution 4.0 International License , which permits unrestricted use, distribution, and reproduction in any medium, provided the original work is properly cited.


 Submit a Paper
 Propose a Special lssue
 View Full Text
 Download PDF
 Downloads
 Citation Tools