
 Submit a Paper
 Propose a Special lssue
 Open Access
ARTICLE

Factor Structure and Longitudinal Invariance of the CES-D across Diverse Residential Backgrounds in Chinese Adolescents
1 Beijing Key Laboratory of Learning and Cognition and Department of Psychology, Capital Normal University, Beijing, 100048, China
2 Center for Child Development, Capital Normal University, Beijing, 100048, China
* Corresponding Authors: Shan Lu. Email: ; Jing Xiao. Email:
(This article belongs to the Special Issue: Mental Health and Social Development)
International Journal of Mental Health Promotion 2024, 26(4), 261-269. https://doi.org/10.32604/ijmhp.2024.043729
Received 10 July 2023; Accepted 26 December 2023; Issue published 04 May 2024
 View Full Text
 Download PDF
Abstract
Background: Valid and reliable measures of depressive symptoms are crucial for understanding risk factors, outcomes, and interventions across rural and urban settings. Despite this need, the longitudinal invariance of these measures over time remains understudied. This research explores the structural components of the Center for Epidemiological Studies Depression Scale (CES-D) and examines its consistency across various living environments and temporal stability in a cohort of Chinese teenagers. Method: In the initial phase, 1,042 adolescents furnished demographic details and undertook the CES-D assessment. After a three-month interval, 967 of these participants repeated the CES-D evaluation. The study employed Confirmatory factor analysis (CFA) to scrutinize the scale’s structural integrity. We investigated factorial invariance by conducting a two-pronged CFA: one comparing urban vs. rural backgrounds, and another contrasting the results from the initial assessment with those from the follow-up. Results: The CES-D demonstrated adequate reliability in both rural and urban high school student samples. The preliminary four-factor model applied to the CES-D demonstrated a good fit with the collected data. Invariance tests, including multigroup analyses comparing rural and urban samples and longitudinal assessments, confirmed the scale’s invariance. Conclusions: The results suggest that the CES-D serves as a reliable instrument for evaluating depressive symptoms among Chinese adolescents. Its applicability is consistent across different living environments and remains stable over time.Keywords
Depression ranks as one of the most common and impactful mental health disorders worldwide [1]. The Report on National Mental Health Development in China (2019–2020) reveals that around 30% of junior high school students and 40% of their high school counterparts exhibit depressive symptoms [2]. Adolescents, more often than preadolescents and adults, encounter intense emotional conflicts and face severe emotional challenges, which can precipitate a sharp rise in mental disorders, including depression [3]. Adolescents with clinical depression or depressive symptoms are more likely to face significant lifelong challenges and developmental delays [4]. In conclusion, the significant impact of depression on the physical and mental well-being of adolescents underscores the urgent necessity for a dependable and accurate tool to assess depressive symptoms in this age group.
The Center for Epidemiological Studies Depression Scale (CES-D) is widely used across diverse populations, including adults, adolescents, clinical, and nonclinical groups, underscoring its potential as an effective tool for screening depressive symptoms [5–7]. However, the CES-D’s factor structure has shown inconsistencies in various studies. Initially, Radloff’s evaluation of the 20-item CES-D, conducted on American adults living in community settings, revealed a four-factor structure comprising positive affect, depressed affect, somatic complaints, and interpersonal problems [5]. This structure has been validated in multiple countries, such as Germany, China, the USA, Australia, India, the Philippines, and Singapore [8,9]. Nevertheless, subsequent studies have suggested alternative factor structures, with reports varying from one [10,11], two [10,12–14], three [15–19], to even five factors [6,20], reflecting differences possibly due to linguistic variations and sample characteristics. Cultural and ethnic diversities may contribute to these variations in factor structure [8]. As a result, the objective of this research is to explore both the factor structure and the consistency of the CES-D within samples of Chinese adolescents.
Measurement invariance (MI) is essential for assessing the consistency of scale items’ meanings and factor structure across diverse populations. It enables researchers to determine whether observed differences between groups represent genuine distinctions or are merely artifacts of the measurement tool. Establishing MI of a scale across different groups is a crucial prerequisite for valid cross-group and longitudinal comparisons [21]. Previous research has highlighted variations in the associations of depressive symptoms among adolescents residing in rural and urban areas of China [22]. However, to make valid comparisons, it is imperative to first confirm that the CES-D adheres to the principle of measurement equivalence in both urban and rural settings. Only with this assurance can differences in CES-D scores be meaningfully interpreted and compared.
Measurement invariance (MI) analysis is critical not only across different groups but also over various time points, especially in longitudinal studies. For meaningful interpretation of changes in CES-D scores across time, ensuring the measurement instrument’s stability is crucial. MI is a prerequisite for determining whether observed score variations reflect actual changes in depressive symptoms. Adolescents’ perceptions of symptoms might shift due to evolving socioeconomic contexts. Over time, these shifts in perspective, coupled with changes in cognitive development, can influence how symptoms are reported, potentially introducing biases in longitudinal data [23,24]. Therefore, confirming MI is essential before conducting longitudinal comparisons. This ensures that the CES-D reliably tracks the progression of depressive symptoms in adolescents and guarantees that the screening results are free from biases related to temporal changes.
The main goal of this research was to examine the measurement invariance of the CES-D, both between rural and urban settings and over time, across two assessment periods in a group of Chinese adolescents. This commenced with a confirmatory factor analysis (CFA) to scrutinize the scale’s factor composition, anticipating that the CES-D’s four-dimensional model would demonstrate robust psychometric qualities in each evaluation. Building upon this initial analysis, we hypothesized and examined whether the CES-D maintains MI across urban and rural settings, as well as over different time points.
This study’s data were collected from five middle schools in China through convenience sampling, with the objective of evaluating adolescent mental health. With a response rate exceeding 95%, students filled out a demographic survey and the CES-D [5] during the initial assessment phase. The final sample comprised 1,042 students: 521 girls, 505 boys, and 16 with unspecified gender. Of these participants, 525 were from rural areas and 517 from urban settings. The mean age was 16.27 years, with a standard deviation of 0.90 years (M = 16.27, SD = 0.90).
Three months after the initial survey, a follow-up assessment was conducted in the same schools, with 967 students participating again. This follow-up sample consisted of 490 girls, 462 boys, and 15 students with unspecified gender. Among these, 491 were from rural areas and 476 from urban settings. At the time of the follow-up, the average age of the participants was 16.27 years (M = 16.27, SD = 0.91), indicating a relatively narrow age range.
The CES-D (Center for Epidemiological Studies Depression Scale; Radloff, 1977) is a self-report instrument comprising 20 items, designed to measure depressive symptoms experienced in the preceding week. Respondents rate each item using a 4-point Likert scale, where 1 signifies ‘rarely or less than 1 day’ and 4 represents ‘most or all of the time, 5–7 days.’ This results in a cumulative score range from 20 to 80. Previous studies have established the CES-D’s robust internal consistency [25,26]. In our study, the Cronbach’s alpha values were 0.942 and 0.945 for the first and second waves, respectively, confirming its excellent reliability.
This study employed CFA and invariance testing across rural and urban contexts as well as longitudinally. The analysis was performed using R software. We employed weighted least squares means and variance-adjusted estimates, a choice informed by the four-category response format of the questionnaire items [27].
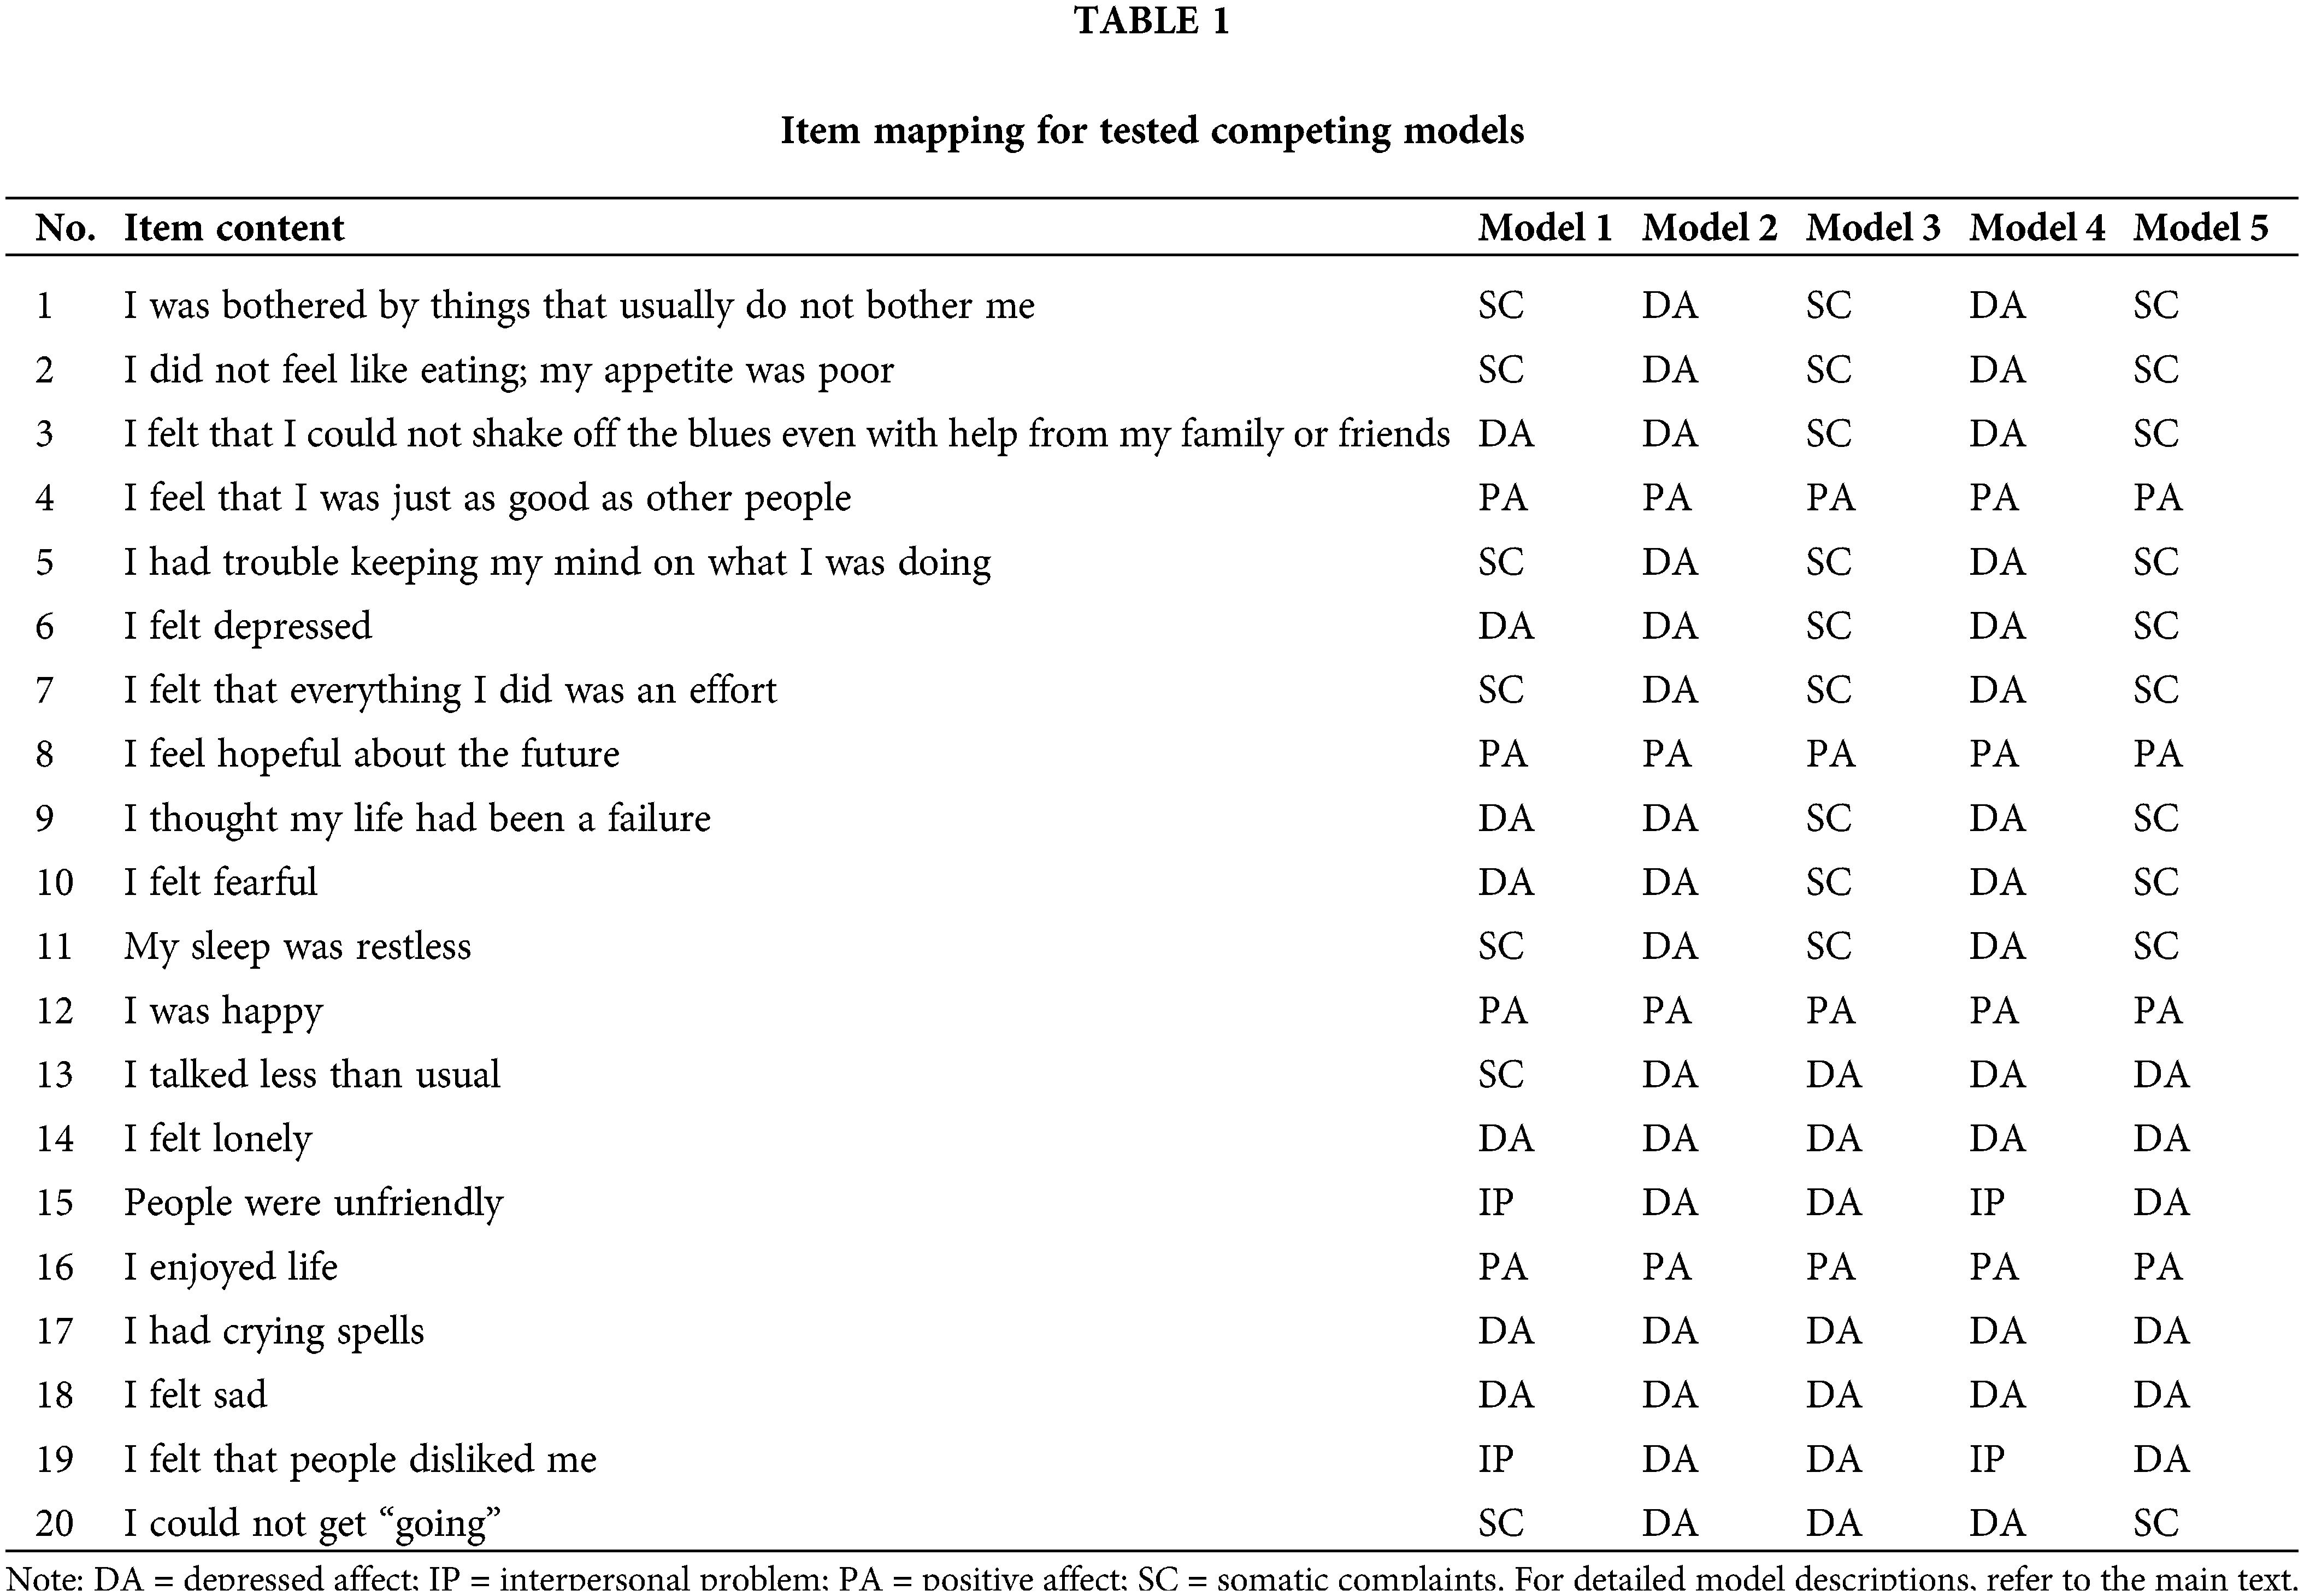
The analysis comprised three steps. Initially, structural validity was assessed through CFA on the first wave data (n = 1,042) to establish the CES-D’s factor structure. We compared five distinct models (detailed in Table 1). Model 1, reflecting Radloff’s initial conceptualization identified a four-factor structure, with depressed affect (DA), somatic complaints (SC), positive affect (PA), and interpersonal problems (IP), has shown satisfactory fit in various international studies [8,9]. Model 2 proposed a two-factor structure differentiating positive from negative items, validated across diverse populations [13,14]. Model 3, was further recognized by Wang et al. in their study focusing on adolescents from mainland China [18], segmented the CES-D into three factors: a four-item positive affect factor, a nine-item somatic complaints factor, and a seven-item depressed affect factor. Model 4 suggested a three-factor model grouping positive affect, interpersonal problems, and a combined factor for depressed affect and somatic complaints [19]. Finally, Model 5 suggested a three-factor framework, combining positive affect into two novel factors that evolved from the original components of depressed affect, interpersonal issues, and somatic complaints [15].
Consistent with standard procedures, the fit of the model was assessed using several criteria: chi-square (χ2), root mean square error of approximation (RMSEA), comparative fit index (CFI), and Tucker–Lewis index (TLI) [15,28]. Consistent with recommendations for structural equation modeling, we reported the 90% confidence interval for RMSEA (90% CI), providing a more precise assessment of model fit. This interval indicates the range in which the true RMSEA value likely falls, with an acceptable model criteria set at RMSEA ≤ 0.08 and CFI and TLI values ≥ 0.90 [15]. Given the distinct structures of the models under comparison, we opted for the Bayesian information criterion (BIC) over chi-square differences. Following Raftery’s guidelines, a lower BIC value denotes a more favorable model fit. Specifically, a ∆BIC exceeding 10 points is indicative of a substantial improvement in the model [29].
In the subsequent stage, having determined the most suitable CES-D model, our focus shifted to examining its factorial invariance in different residential settings, specifically between rural and urban areas, using data from wave 1 (n = 1,042) and wave 2 (n = 967). In line with established methodologies [15,30], we initially assessed the model’s fit for each residential context separately. This was followed by multigroup invariance testing, which encompassed configural invariance (uniform factor structures across groups), metric invariance (consistent factor loadings), and scalar invariance (equivalence in factor loadings and thresholds). This approach aligns with standard practices in factorial invariance testing [31–33]. For nested model comparisons, Cheung and Rensvold conducted a study using data of unequal values and demonstrated that among various parameters, ΔCFI was the most effective indicator of model variance [34]. The ΔCFI test was superior to the Δχ2 test for variance in nested models [35]. Therefore, we used ΔCFI for nested model comparisons. The establishment of measurement invariance is deemed credible when ∆CFI does not exceed 0.01. A range of 0.01 to 0.02 in ∆CFI implies a decrease in model fit, yet the significance of this difference cannot be conclusively determined. If ∆CFI surpasses 0.02, the model is considered to be differentially structured [36,37].
Thirdly, our study proceeded with longitudinal measurement invariance, utilizing the follow-up sample (n = 967). This step was crucial to determine if the CES-D reliably gauges the same construct over time. The standard sequence of invariance tests–configural, metric, and scalar–was applied, ensuring equality of the respective parameters across both assessment periods. For these tests, we adhered to the criteria of ∆CFI < 0.01.
Fourth, as part of the longitudinal invariance analysis for the CES-D, we extracted factor loadings for each item from waves 1 and 2. We then calculated the average factor loadings for each dimension. Using SPSS 26.0, we determined the average variance extracted (AVE) at both time points to assess the convergent validity of the factor structure. Furthermore, to assess the CES-D’s internal consistency reliability, we calculated Cronbach’s alpha coefficients.
CFA and comparisons of competing models
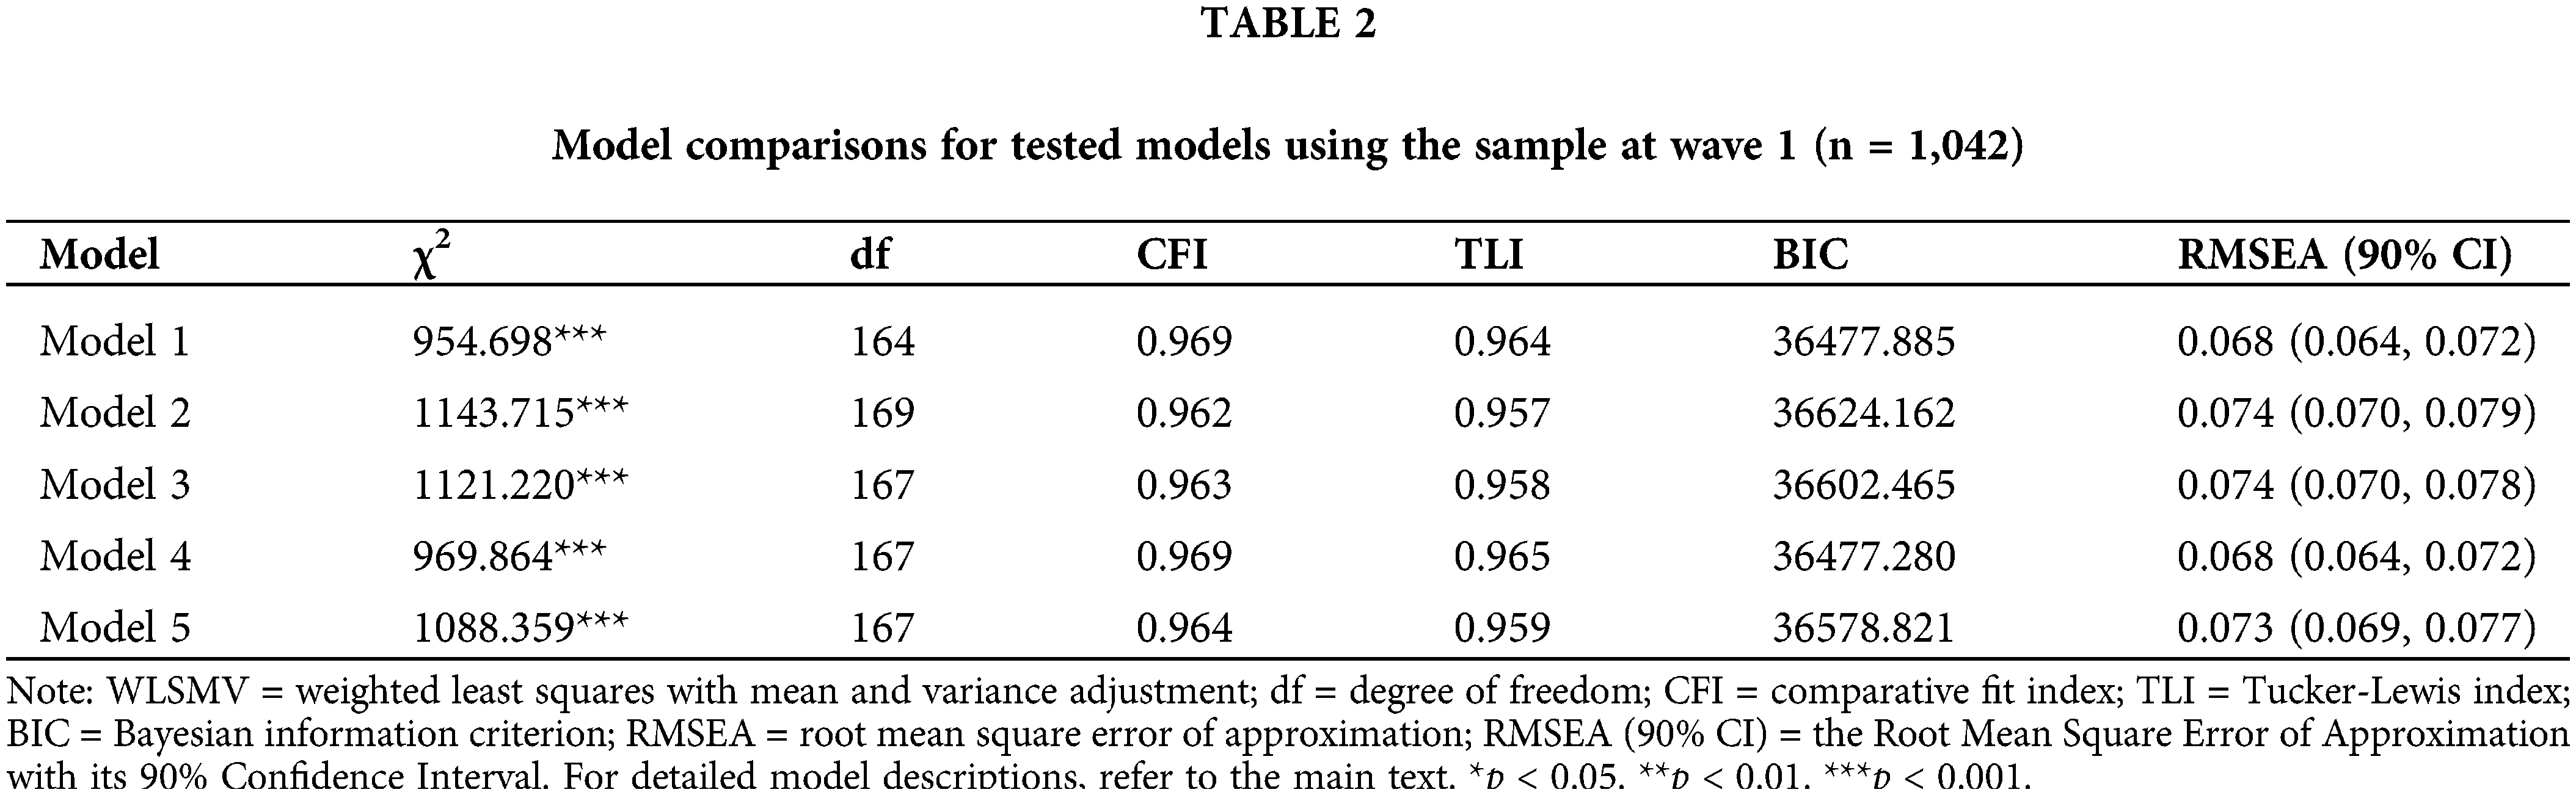
Table 2 presents the fit indices for the five structural models evaluated in this research. Each model achieved an acceptable fit, as indicated by CFI and TLI values exceeding 0.90, and RMSEA values falling below 0.08. Notably, both the initial four-factor model (Model 1) and Model 4 showed the most favorable alignment with the data, as reflected in their lowest BIC values (∆BIC > 10) compared to the others. Considering the slight difference in fit between these models (∆BIC = 0.605) and the widespread validation of the original four-factor structure in diverse racial/ethnic populations [38,39], including numerous Asian countries [40,41], our study further substantiates the four-factor structure’s applicability to Chinese adolescents.
Measurement invariance across rural and urban contexts
Table 3 outlines the goodness-of-fit indices for both the independent models and those testing invariance between rural and urban settings. For wave 1, the four-factor model exhibited a satisfactory fit in both rural and urban groups. Specifically, for the rural group, the fit indices were χ2 (164) = 549.188, p < 0.001, CFI = 0.966, TLI = 0.961, RMSEA = 0.067. Similarly, for the urban group, the indices were χ2 (164) = 527.973, p < 0.001, CFI = 0.977, TLI = 0.973, RMSEA = 0.066. Moreover, in the comparison of nested models–namely configural, metric, and scalar invariance–the model fit did not show any notable decline. This observation is supported by the change in CFI (∆CFI), where the fit indice exceeded the recommended benchmark.
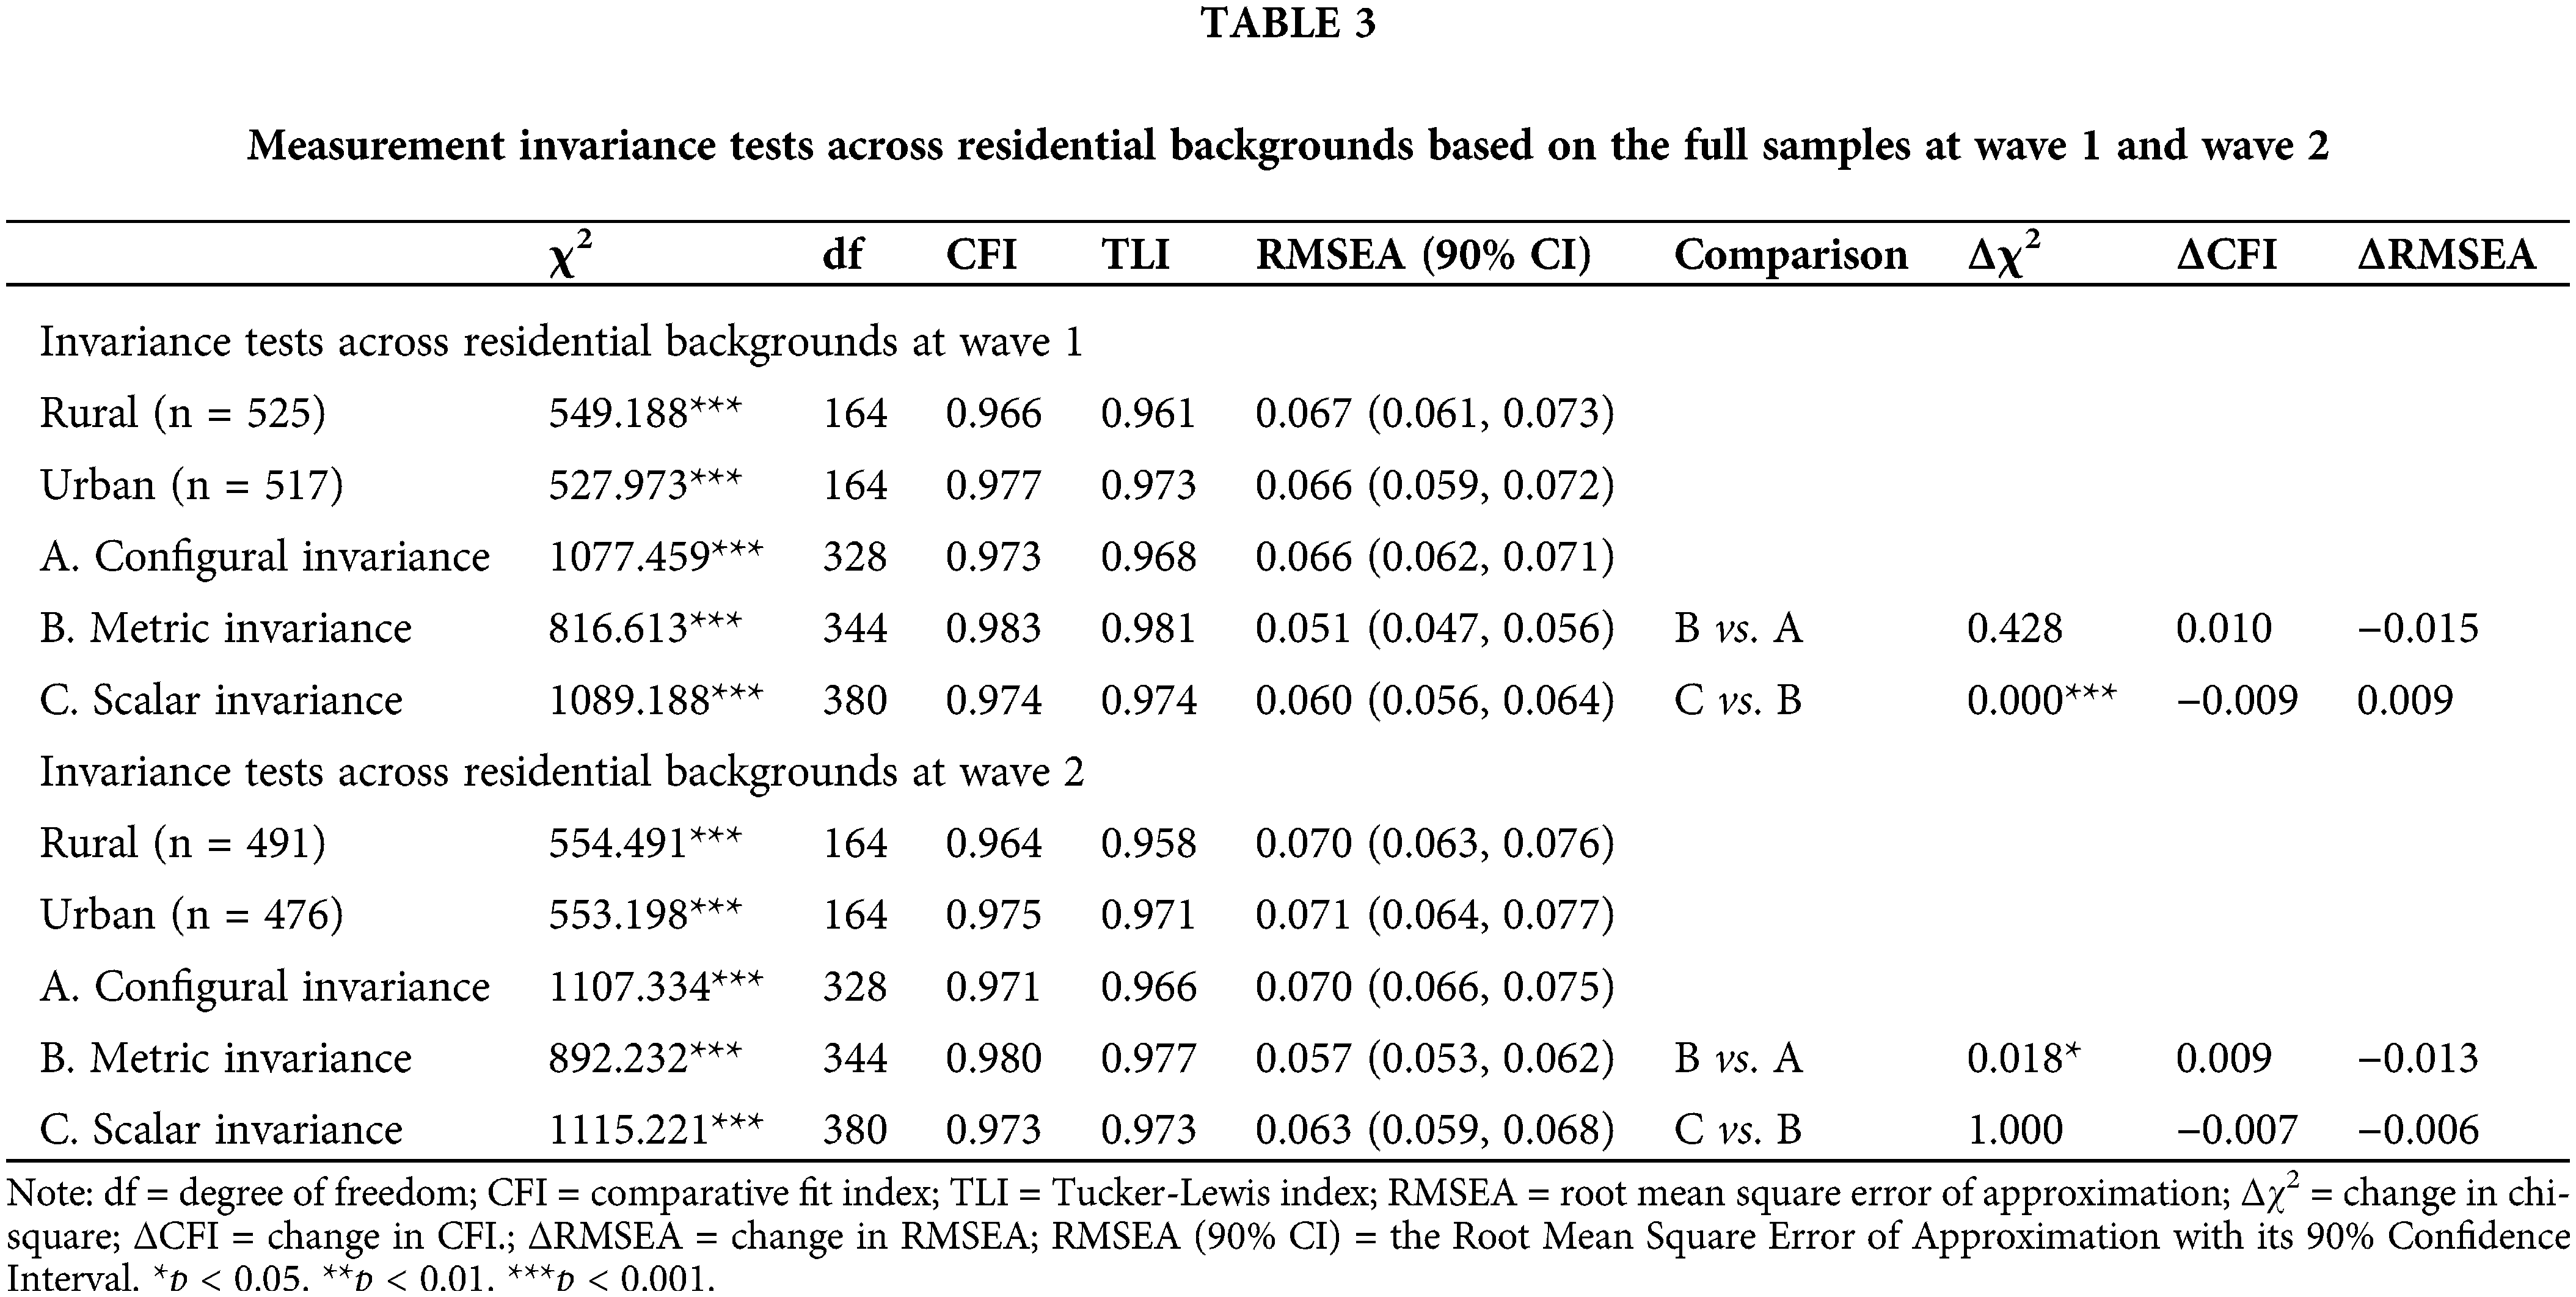
For wave 2, the four-factor model continued to show a satisfactory fit for both rural and urban groups. Specifically, the fit indices for the rural group were χ2 (164) = 554.491, p < 0.001, CFI = 0.964, TLI = 0.958, RMSEA = 0.070. For the urban group, they were χ2 (164) = 553.198, p < 0.001, CFI = 0.975, TLI = 0.971, RMSEA = 0.071. Assessing the nested models, which include configural, metric, and scalar invariance, we observed no substantial reduction in model fit, as the ΔCFI values consistently stayed above the advised thresholds. This result corroborates the configural, metric, and scalar invariance of the four-factor model in both rural and urban contexts.
Longitudinal measurement invariance
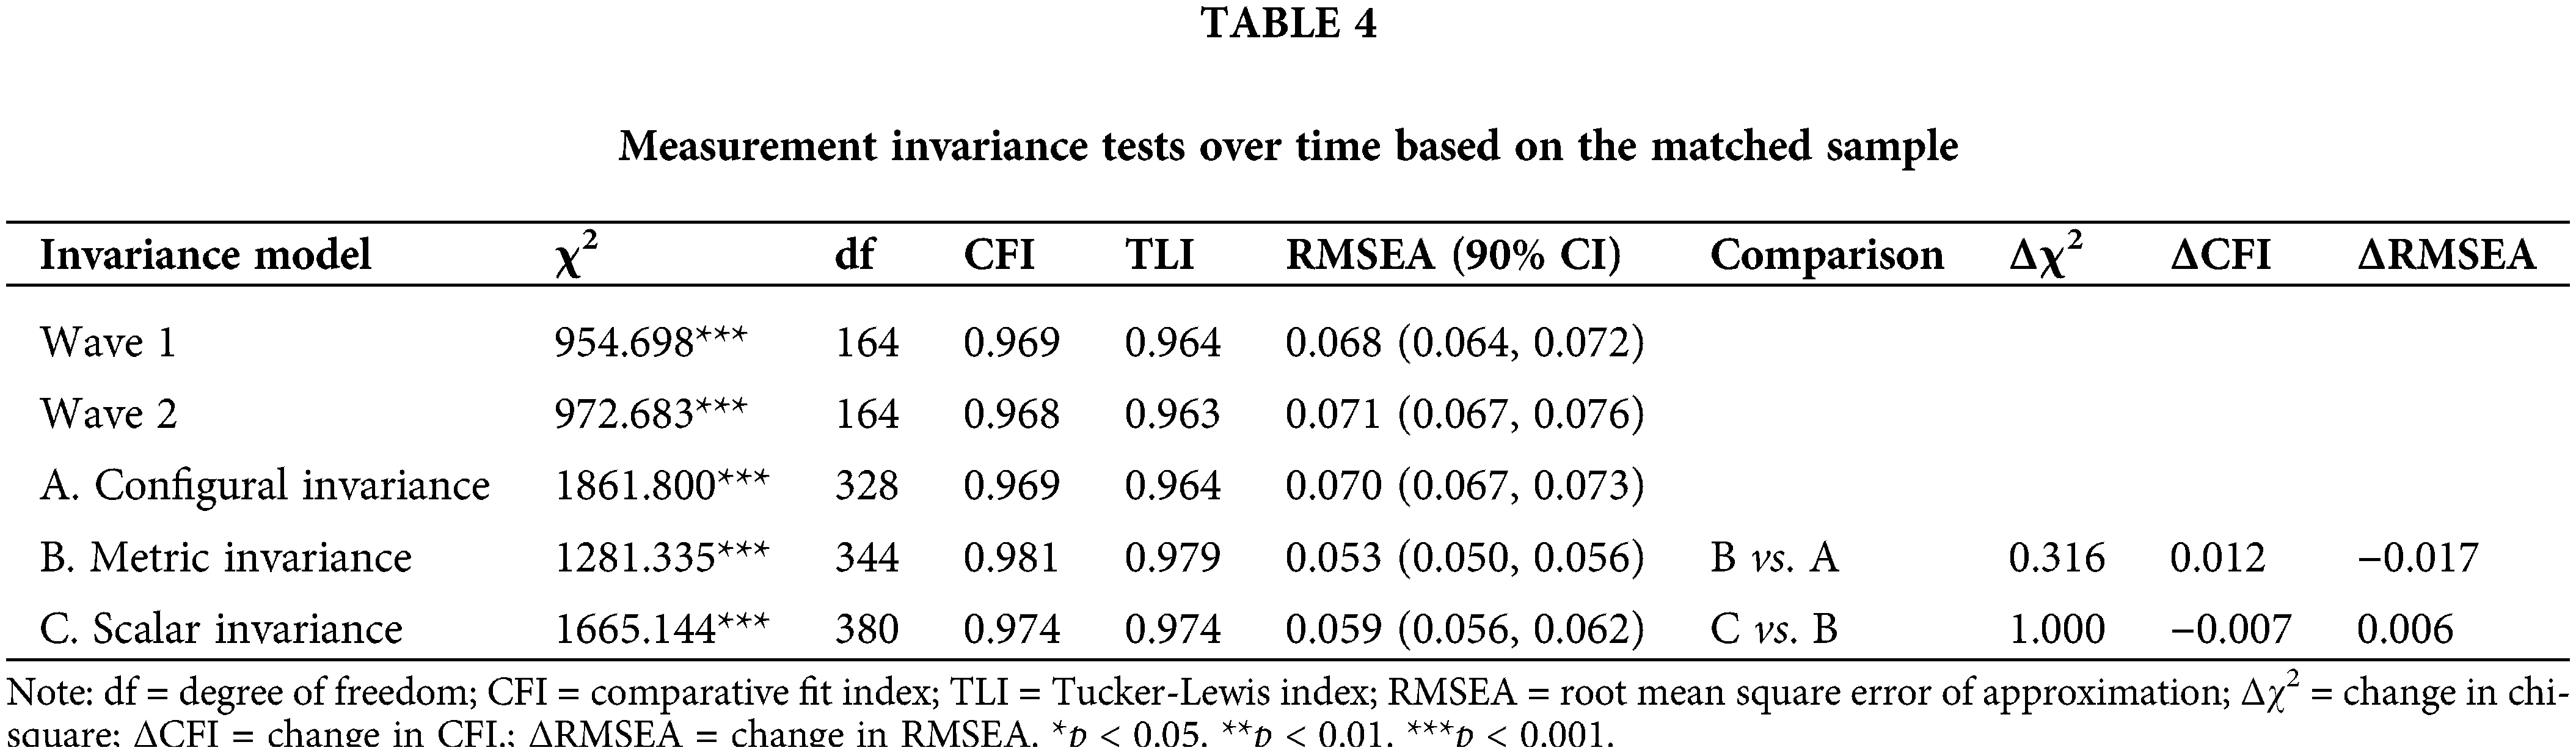
Table 4 shows that the four-factor model maintained an acceptable fit across both assessment waves. For wave 1, the fit indices were χ2 (164) = 954.698, p < 0.001, CFI = 0.969, TLI = 0.964, RMSEA = 0.068; For wave 2, the indices were χ2 (164) = 972.683, p < 0.001, CFI = 0.968, TLI = 0.963, RMSEA = 0.071. The tests for longitudinal invariance, encompassing configural, metric, and scalar invariance, all received support. Remarkably, the most stringent model, positing equal factor loadings and item thresholds, demonstrated robust fit indices: χ2(380) = 1,665.144, CFI = 0.974, TLI = 0.974, RMSEA = 0.059. In comparing nested models, ΔCFI was 0.012 when assessing configural vs. metric invariance. A ΔCFI within the range of 0.01 to 0.02 indicates a moderate but not significant deterioration in model fit, which does not provide sufficient evidence to reject invariance [36,37]. When comparing metric invariance and scalar invariance, the ΔCFI equals 0.007. Since this value is below 0.01, it indicates a good fit of the model. Thus, the longitudinal measurement invariance of the CES-D’s four-factor model was maintained.
Factor analysis of CES-D and further psychometric characterization
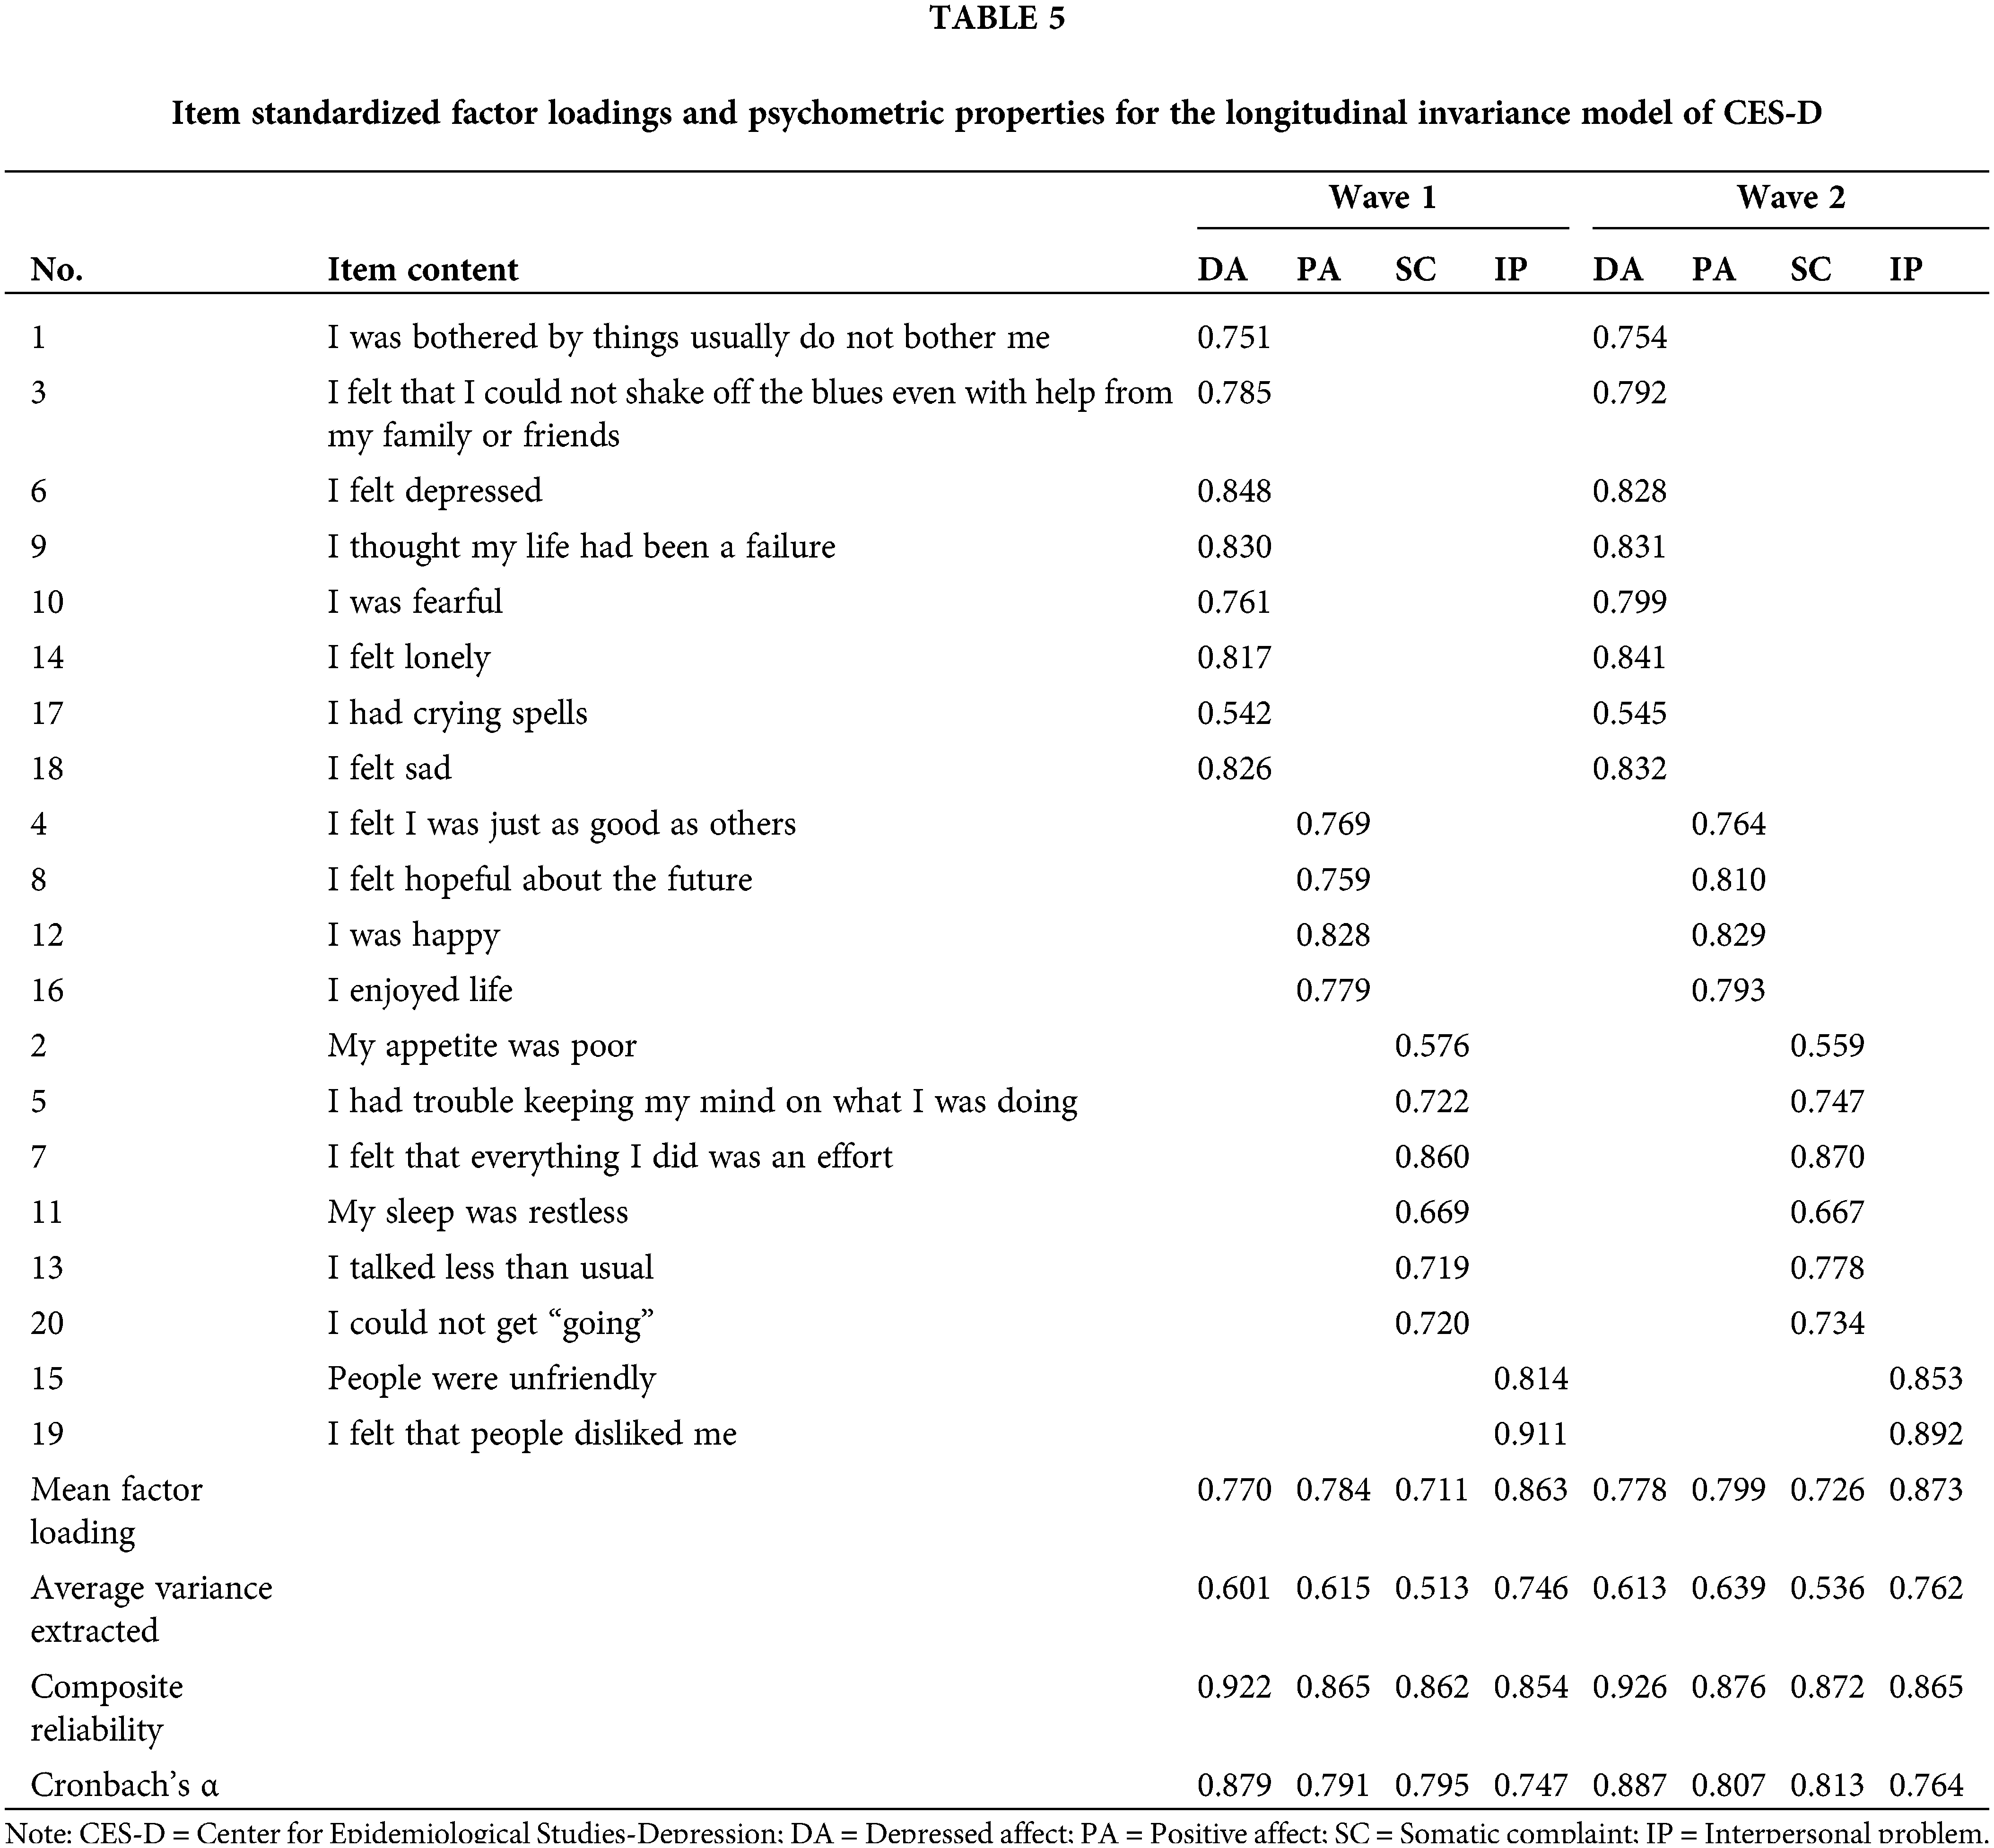
In the analysis of the CES-D’s longitudinal invariance model, we examined the factor loadings for each item at both wave 1 and wave 2. As detailed in Table 5, during wave 1, item loadings across the four dimensions of the CES-D–Depressed Affect (DA), Positive Affect (PA), Somatic Complaints (SC), and Interpersonal Problems (IP)–varied between 0.542 (“I had crying spells”) and 0.911 (“I felt that people disliked me”). At wave 2, these loadings ranged from 0.545 (“I had crying spells”) to 0.892 (“I felt that people disliked me”). Additionally, the mean factor loadings for all dimensions exceeded 0.7 at both waves, indicating reliable measurement of the latent constructs. Additional psychometric evaluations revealed that the average variance extracted (AVE) for all factors exceeded 0.5 in both waves. This indicates that more than 50% of the variance in the observed items was explained by the latent variables, thus affirming adequate structural validity [42]. Furthermore, the composite reliability (CR) values were above 0.85 in both assessments, reflecting outstanding reliability. Moreover, all domains recorded values above 0.74, reflecting consistent internal consistency ranging from acceptable to excellent across the two waves. In conclusion, the factor analysis conducted on the CES-D scale indicates that it maintains a range from satisfactory to excellent in terms of reliability and validity when used to assess adolescent samples across the two waves.
The objective of this research was to analyze the factor structure of the CES-D and to ascertain its consistency across various living environments and through time among high school students in mainland China. Our analyses confirmed the CES-D’s robust reliability in both rural and urban high school student populations. Through confirmatory factor analysis (CFA), we explored and contrasted various factor structures. The results consistently favored the original four-factor model, indicating its satisfactory fit. Furthermore, invariance tests, including both multigroup (comparing rural and urban samples) and longitudinal analyses, consistently supported the scale’s stability. These results underscore the reliability and efficacy of the CES-D in measuring depressive symptoms in Chinese adolescents, consistently across different living environments and over time.
Several aspects of our findings merit further discussion. Initially, the findings revalidated Radloff’s four-factor framework (encompassing depressive affect, positive affect, somatic complaints, and interpersonal problems) for the CES-D. This aligns with previous studies conducted in various countries and with different samples [8,9,43,44]. Following Liang’s criteria, factor loadings above 0.5 indicate a robust representation of scale constructs [45]. In our study, all items within the CES-D’s four-factor structure had factor loadings over 0.5, confirming strong convergent validity. Significantly, the average variance extracted, composite reliability, and Cronbach’s alpha all surpassed the acceptable benchmarks. This indicates that the CES-D items proficiently represent the latent variables, affirming the reliability and validity of the initial four-factor model. This highlights the scale’s appropriateness for investigating depressive experiences among Chinese adolescents.
However, the potential for other factor structures within the CES-D warrants consideration. The comparative analysis of our models showed that a three-factor structure, encompassing positive affect, interpersonal problems, and a revised depressed affect factor that combines the original depressed affect with somatic complaints, closely paralleled Radloff’s four-factor model in terms of fit. This observation suggests that the adolescents in our study might view depressive symptoms as reflecting mental phenomena, distinguishing between somatic and psychological distress, but also possibly perceiving their sadness as a combination of these symptoms. Such perceptions could stem from adolescents being influenced by both traditional mind–body holistic concepts and Western psychological models that distinguish between psychological and somatic symptoms [14].
Secondly, our study demonstrated the MI of the CES-D between rural and urban Chinese adolescents. Configural invariance was established for the CES-D’s four-factor structure, indicating that the scale measures the same constructs in both rural and urban areas. The finding of metric invariance confirms that scale increments are interpreted similarly across these areas. Furthermore, the support for scalar invariance suggests uniform item thresholds in both contexts. it seems that adolescents, irrespective of their rural or urban backgrounds, interpret depressive symptoms in a uniform manner when evaluated using the CES-D. This uniformity enables researchers to reliably conclude that any score disparities between these groups are true reflections of differing levels of depressive symptoms.
Thirdly, our study confirmed the longitudinal invariance of the CES-D. By establishing configural invariance, it is clear that the CES-D consistently evaluates the same constructs across the two different time points. Metric invariance suggests that the scale’s unit increment retains consistent meaning over time. Additionally, the endorsement of longitudinal scalar invariance indicates stable item thresholds across the waves. These findings corroborate that the CES-D scores are consistent over time, supporting the conclusions of previous longitudinal studies on the CES-D [24,46,47]. Crucially, this implies that any observed changes in depressive symptoms are genuine and not attributable to measurement artifacts or shifts in item interpretation. Hence, the CES-D demonstrates its reliability as a tool for monitoring changes in depressive symptoms among adolescents. This ensures that subsequent screenings and evaluations are impartial and accurately represent real shifts in their mental health condition.
This research distinctively employed categorical confirmatory factor analysis (CFA) using the weighted least squares means and variance-adjusted estimator. This approach marks a departure from numerous prior studies that have analyzed CES-D items as continuous variables [9,17,39]. This approach allows for a more nuanced investigation of the CES-D’s factor structure. As far as we are aware, this research represents the inaugural effort to evaluate the rural-urban invariance of the CES-D, constituting a notable advancement in this area of study. By examining both rural-urban and longitudinal invariance, our study provides a comprehensive illustration of the CES-D’s measurement properties.
The use of convenience sampling from five schools may limit the representativeness of our sample. Future studies could improve generalizability by adopting a stratified sampling approach for a more diverse representation of the Chinese adolescent population. Our analysis was based on only two time points. Subsequent research could benefit from including additional time points to provide a more detailed temporal picture. Considering the 3-month interval used in our study, future research should explore the impact of different time intervals as potential confounding factors.
In conclusion, our study highlights the effectiveness of the CES-D’s four-factor model, which includes Depressed Affect, Positive Affect, Somatic Complaints, and Interpersonal Problems. This model accurately reflects the scale’s foundational structure in adolescents, showcasing robust reliability and validity. Notably, the feasibility of the three-factor model also suggests its potential applicability in various contexts or specific sub-groups.
A key finding is the CES-D’s invariance across rural and urban settings and its temporal stability, highlighting the scale’s robustness. This confirms the consistency in interpreting CES-D outcomes between rural and urban adolescents, reinforcing the tool’s effectiveness in tracking the progression of depressive symptoms in this demographic.
Considering these results, the CES-D stands out as a versatile instrument for both cross-sectional and longitudinal research. Its flexible factor structure, coupled with its established invariance, positions it as a valuable asset for researchers delving into the nuances of adolescent depression across diverse contexts.
Acknowledgement: We are indebted to all participants to attend our study.
Funding Statement: The authors received no specific funding for this study.
Author Contributions: The authors confirm contribution to the paper as follows: study conception and design: XJ, LQ and LS; data collection: XJ; analysis and interpretation of results: LS, XCC, CYJ; draft manuscript preparation: CYJ, XCC, LS, XJ and LQ. All authors reviewed the results and approved the final version of the manuscript.
Availability of Data and Materials: Data and analysis codes are available upon reasonable request by emailing the corresponding author.
Ethics Approval: The study was approved by Beijing Key Laboratory of Learning and Cognition and Department of Psychology Ethics committee at the Capital Normal University (IRB number: psycnu20200812). All participants signed the informed consent in this study.
Conflicts of Interest: The authors declare that they have no conflicts of interest to report regarding the present study.
References
1. Vigo D, Thornicroft G, Atun R. Estimating the true global burden of mental illness. Lancet Psychiatry. 2016;3(2):171–8. doi:10.1016/S2215-0366(15)00505-2. [Google Scholar] [PubMed] [CrossRef]
2. Fu XL, Zhang K, Chen XF. Report on national mental health development in China (2019–2020). Beijing, China: Social Science Literature Press; 2021. [Google Scholar]
3. Rikard-Bell C, Hunt C, McAulay C, Hay P, Morad A, Cunich M, et al. Adolescent depression from a developmental perspective: the importance of recognizing developmental distress in depressed adolescents. Int J Environ Res Public Health. 2022;19(23):16029. doi:10.3390/ijerph192316029. [Google Scholar] [PubMed] [CrossRef]
4. Huang CC, Chen Y, Cheung S. Early childhood exposure to intimate partner violence and teen depression symptoms in the U.S. Health Soc Care Commun. 2021;29(5):e47–55. doi:10.1111/hsc.13240. [Google Scholar] [PubMed] [CrossRef]
5. Radloff LS. The CES-D scale: a self-report depression scale for research in the general population. Appl Psychol Meas. 1977;1(3):385–401. doi:10.1177/014662167700100306. [Google Scholar] [CrossRef]
6. Niu L, He J, Cheng C, Yi J, Wang X, Yao S. Factor structure and measurement invariance of the Chinese version of the center for epidemiological studies depression (CES-D) scale among undergraduates and clinical patients. BMC Psychiat. 2021;21(1):463. doi:10.1186/s12888-021-03474-x. [Google Scholar] [PubMed] [CrossRef]
7. Carleton RN, Thibodeau MA, Teale MJN, Welch PG, Abrams MP, Robinson T, et al. The center for epidemiologic studies depression scale: a review with a theoretical and empirical examination of item content and factor structure. PLoS One. 2013;8(3):e58067. doi:10.1371/journal.pone.0058067. [Google Scholar] [PubMed] [CrossRef]
8. Blodgett JM, Lachance CC, Stubbs B, Co M, Wu YT, Prina M, et al. A systematic review of the latent structure of the center for epidemiologic studies depression scale (CES-D) amongst adolescents. BMC Psychiat. 2021;21(1):197. doi:10.1186/s12888-021-03206-1. [Google Scholar] [PubMed] [CrossRef]
9. Kato T. Measurement invariance in the center for epidemiologic studies-depression (CES-D) scale among English-speaking whites and Asians. Int J Environ Res Public Health. 2021;18(10):5298. doi:10.3390/ijerph18105298. [Google Scholar] [PubMed] [CrossRef]
10. Edwards MC, Cheavens JS, Heiy JE, Cukrowicz KC. A reexamination of the factor structure of the center for epidemiologic studies depression scale: is a one-factor model plausible? Psychol Assess. 2010;22(3):711–5. doi:10.1037/a0019917. [Google Scholar] [PubMed] [CrossRef]
11. Stansbury JP, Ried LD, Velozo CA. Unidimensionality and bandwidth in the center for epidemiologic studies depression (CES-D) scale. J Pers Assess. 2006;86(1):10–22. doi:10.1207/s15327752jpa8601_03. [Google Scholar] [PubMed] [CrossRef]
12. Dardas LA, Xu H, Shawashreh A, Franklin MS, Wainwright K, Pan W. Psychometric properties and factor structure of the center for epidemiologic studies depression scale in a national sample of Arab adolescents. Issues Ment Health Nurs. 2019;40(5):437–43. doi:10.1080/01612840.2018.1534912. [Google Scholar] [PubMed] [CrossRef]
13. Leykin Y, Torres LD, Aguilera A, Muñoz RF. Factor structure of the CES-D in a sample of Spanish-and English-speaking smokers on the Internet. Psychiat Res. 2011;185(1–2):269–74. doi:10.1016/j.psychres.2010.04.056. [Google Scholar] [PubMed] [CrossRef]
14. Lee SW, Stewart SM, Byrne BM, Wong JPS, Ho SY, Lee PWH, et al. Factor structure of the center for epidemiological studies depression scale in Hong Kong adolescents. J Pers Assess. 2008;90(2):175–84. doi:10.1080/00223890701845385. [Google Scholar] [PubMed] [CrossRef]
15. Zhu X, Shek DTL, Dou D. Factor structure of the Chinese CES-D and invariance analyses across gender and over time among Chinese adolescents. J Affect Disord. 2021;295:639–46. doi:10.1016/j.jad.2021.08.122. [Google Scholar] [PubMed] [CrossRef]
16. Yang L, Jia CX, Qin P. Reliability and validity of the center for epidemiologic studies depression scale (CES-D) among suicide attempters and comparison residents in rural China. BMC Psychiat. 2015;15(1):76. doi:10.1186/s12888-015-0458-1. [Google Scholar] [PubMed] [CrossRef]
17. Heo EH, Choi KS, Yu JC, Nam JA. Validation of the center for epidemiological studies depression scale among Korean adolescents. Psychiatry Investig. 2018;15(2):124–32. doi:10.30773/pi.2017.07.19. [Google Scholar] [PubMed] [CrossRef]
18. Wang M, Armour C, Wu Y, Ren F, Zhu X, Yao S. Factor structure of the CES-D and measurement invariance across gender in mainland Chinese adolescents: factor structure and invariance of the CES-D. J Clin Psychol. 2013;69(9):966–79. doi:10.1002/jclp.21978. [Google Scholar] [PubMed] [CrossRef]
19. Ying YW. Depressive symptomatology among Chinese-Americans as measured by the CES-D. J Clin Psychol. 1988;44(5):739–46. doi:10.1002/1097-4679(198809)44:5<739:AID-JCLP2270440512>3.0.CO;2-0. [Google Scholar] [PubMed] [CrossRef]
20. Kim G, Decoster J, Huang CH, Chiriboga DA. Race/ethnicity and the factor structure of the center for epidemiologic studies depression scale: a meta-analysis. Cultur Divers Ethnic Minor Psychol. 2011;17(4):381–96. doi:10.1037/a0025434. [Google Scholar] [PubMed] [CrossRef]
21. Vandenberg RJ, Lance CE. A review and synthesis of the measurement invariance literature: suggestions, practices, and recommendations for organizational research. Organ Res Methods. 2000;3(1):4–70. doi:10.1177/109442810031002. [Google Scholar] [CrossRef]
22. Zhang J, Sun W, Kong Y, Wang C. Reliability and validity of the center for epidemiological studies depression scale in 2 special adult samples from rural China. Compr Psychiat. 2012;53(8):1243–51. doi:10.1016/j.comppsych.2012.03.015. [Google Scholar] [PubMed] [CrossRef]
23. Arenas E, Teruel G, Gaitán-Rossi P. Time and gender measurement invariance in the modified Calderon depression scale. Health Qual Life Outcomes. 2022;20(1):100. doi:10.1186/s12955-022-02007-8. [Google Scholar] [PubMed] [CrossRef]
24. Verhoeven M, Sawyer MG, Spence SH. The factorial invariance of the CES-D during adolescence: are symptom profiles for depression stable across gender and time? J Adolesc. 2013;36(1):181–90. doi:10.1016/j.adolescence.2012.10.007. [Google Scholar] [PubMed] [CrossRef]
25. Zhou Z, Shek DTL, Zhu X, Dou D. Positive youth development and adolescent depression: a longitudinal study based on mainland Chinese high school students. Int J Environ Res Public Health. 2020;17(12):4457. doi:10.3390/ijerph17124457. [Google Scholar] [PubMed] [CrossRef]
26. Chi X, Huang L, Wang J, Zhang P. The prevalence and socio-demographic correlates of depressive symptoms in early adolescents in China: differences in only child and non-only child groups. Int J Environ Res Public Health. 2020;17(2):438. doi:10.3390/ijerph17020438. [Google Scholar] [PubMed] [CrossRef]
27. Kliem S, Krieg Y, Beller J, Braehler E, Baier D. Psychometric properties of the Somatic Symptom Scale 8 (SSS-8) in a representative sample of German adolescents. J Psychosom Res. 2021;149:110593. doi:10.1016/j.jpsychores.2021.110593. [Google Scholar] [PubMed] [CrossRef]
28. Shek DTL, Yang Z, Ma CMS, Chai CWY. Subjective outcome evaluation of service-learning by the service recipients: scale development, normative profiles and predictors. Child Ind Res. 2021;14(1):411–34. doi:10.1007/s12187-020-09765-1. [Google Scholar] [CrossRef]
29. Raftery AE. Bayesian model selection in social research. Sociol Methodol. 1995;25:111. doi:10.2307/271063. [Google Scholar] [CrossRef]
30. Liu JD, Chung PK. Factor structure and measurement invariance of the Subjective Vitality Scale: evidence from Chinese adolescents in Hong Kong. Qual Life Res. 2019;28(1):233–9. doi:10.1007/s11136-018-1990-5. [Google Scholar] [PubMed] [CrossRef]
31. Pignon B, Peyre H, Ferchiou A, van Os J, Rutten BPF, Murray RM, et al. Assessing cross-national invariance of the community assessment of psychic experiences (CAPE). Psychol Med. 2019;49(15):2600–7. doi:10.1017/S0033291718003574. [Google Scholar] [PubMed] [CrossRef]
32. Suh H, van Nuenen M, Rice KG. The CES-D as a measure of psychological distress among international students: measurement and structural invariance across gender. Assess. 2017;24(7):896–906. doi:10.1177/1073191116632337. [Google Scholar] [PubMed] [CrossRef]
33. Wu PC. Longitudinal measurement invariance of beck depression inventory-II in early adolescents. Assess. 2017;24(3):337–45. doi:10.1177/1073191115608941. [Google Scholar] [PubMed] [CrossRef]
34. Cheung GW, Rensvold RB. Cross-cultural comparisons using non-invariant measurement items. Appl Behav Sci Rev. 1998;6(1):93–110. doi:10.1016/S1068-8595(99)80006-3. [Google Scholar] [CrossRef]
35. Cheung GW, Rensvold RB. Testing factorial invariance across groups: a reconceptualization and proposed new method. J Manage. 1999;25(1):1–27. doi:10.1177/014920639902500101. [Google Scholar] [CrossRef]
36. Cheung GW, Rensvold RB. Evaluating goodness-of-fit indexes for testing measurement invariance. Struct Equ Mol: A Multidiscip J. 2002;9(2):233–55. doi:10.1207/S15328007SEM0902_5. [Google Scholar] [CrossRef]
37. Ren F, Liu JL, Fang YS, Wang MC. Measurement invariance of the CES-D in adult sample. Chinese J Clin Psychol. 2019;27(5):973−7+1061. doi:10.16128/j.cnki.1005-3611.2019.05.025. [Google Scholar] [CrossRef]
38. Armenta BE, Sittner Hartshorn KJ, Whitbeck LB, Crawford DM, Hoyt DR. A longitudinal examination of the measurement properties and predictive utility of the center for epidemiologic studies depression scale among North American indigenous adolescents. Psychol Assess. 2014;26(4):1347–55. doi:10.1037/a0037608. [Google Scholar] [PubMed] [CrossRef]
39. Nguyen HT, Kitner-Triolo M, Evans MK, Zonderman AB. Factorial invariance of the CES-D in low socioeconomic status African Americans compared with a nationally representative sample. Psychiatry Res. 2004;126(2):177–87. doi:10.1016/j.psychres.2004.02.004. [Google Scholar] [PubMed] [CrossRef]
40. Zhang B, Fokkema M, Cuijpers P, Li J, Smits N, Beekman A. Measurement invariance of the center for epidemiological studies depression scale (CES-D) among chinese and dutch elderly. BMC Med Res Methodol. 2011;11:74. doi:10.1186/1471-2288-11-74. [Google Scholar] [PubMed] [CrossRef]
41. Zhang Y, Ting RZW, Lam MHB, Lam SP, Yeung RO, Nan H, et al. Measuring depression with CES-D in Chinese patients with type 2 diabetes: the validity and its comparison to PHQ-9. BMC Psychiat. 2015;15:198. doi:10.1186/s12888-015-0580-0. [Google Scholar] [PubMed] [CrossRef]
42. Fornell C, Larcker DF. Evaluating structural equation models with unobservable variables and measurement error. J Mark Res. 1981;18(1):39. doi:10.2307/3151312. [Google Scholar] [CrossRef]
43. Brooks JL, Adams LB, Woods-Giscombé CL, Currin EG, Corbie-Smith GM. Factor analysis of the center for epidemiological studies depression scale in American Indian women. Res Nurs Health. 2022;45(6):733–41. doi:10.1002/nur.22267. [Google Scholar] [PubMed] [CrossRef]
44. Cosco TD, Lachance CC, Blodgett JM, Stubbs B, Co M, Veronese N, et al. Latent structure of the centre for epidemiologic studies depression scale (CES-D) in older adult populations: a systematic review. Aging Ment Health. 2020;24(5):700–4. doi:10.1080/13607863.2019.1566434. [Google Scholar] [PubMed] [CrossRef]
45. Liang L, Yang J, Yao S. Measurement equivalence of the SDQ in Chinese adolescents: a horizontal and longitudinal perspective. J Affect Disord. 2019;257:439–44. doi:10.1016/j.jad.2019.06.049. [Google Scholar] [PubMed] [CrossRef]
46. Ferro MA, Speechley KN. Factor structure and longitudinal invariance of the center for epidemiological studies depression scale (CES-D) in adult women: application in a population-based sample of mothers of children with epilepsy. Arch Womens Ment Health. 2013;16(2):159–66. doi:10.1007/s00737-013-0331-5. [Google Scholar] [PubMed] [CrossRef]
47. Motl RW, Dishman RK, Birnbaum AS, Lytle LA. Longitudinal invariance of the center for epidemiologic studies-depression scale among girls and boys in middle school. Educ Psychol Meas. 2005;65(1):90–108. doi:10.1177/0013164404266256. [Google Scholar] [CrossRef]
Cite This Article
 Copyright © 2024 The Author(s). Published by Tech Science Press.
This work is licensed under a Creative Commons Attribution 4.0 International License , which permits unrestricted use, distribution, and reproduction in any medium, provided the original work is properly cited.
 Downloads
 Citation Tools