
 Submit a Paper
 Propose a Special lssue
 Open Access
ARTICLE
Intrusion Detection in NSL-KDD Dataset Using Hybrid Self-Organizing Map Model
1 Knowledge Unit of Systems and Technology, University of Management and Technology, Sialkot, 51310, Pakistan
2 Department of Computer Science, University of Wah, Wah Cantt, 47010, Pakistan
3 Department of Computer Engineering, College of Computer and Information Sciences (CCIS), King Saud University, Riyadh, 11451, Saudi Arabia
4 Department of AI Convergence Network, Ajou University, Suwon, 16499, Republic of Korea
* Corresponding Author: Jehad Ali. Email:
(This article belongs to the Special Issue: Leveraging AI and ML for QoS Improvement in Intelligent Programmable Networks)
Computer Modeling in Engineering & Sciences 2025, 143(1), 639-671. https://doi.org/10.32604/cmes.2025.062788
Received 27 December 2024; Accepted 18 February 2025; Issue published 11 April 2025
 View Full Text
 Download PDF
Abstract
Intrusion attempts against Internet of Things (IoT) devices have significantly increased in the last few years. These devices are now easy targets for hackers because of their built-in security flaws. Combining a Self-Organizing Map (SOM) hybrid anomaly detection system for dimensionality reduction with the inherited nature of clustering and Extreme Gradient Boosting (XGBoost) for multi-class classification can improve network traffic intrusion detection. The proposed model is evaluated on the NSL-KDD dataset. The hybrid approach outperforms the baseline line models, Multilayer perceptron model, and SOM-KNN (k-nearest neighbors) model in precision, recall, and F1-score, highlighting the proposed approach’s scalability, potential, adaptability, and real-world applicability. Therefore, this paper proposes a highly efficient deployment strategy for resource-constrained network edges. The results reveal that Precision, Recall, and F1-scores rise 10%–30% for the benign, probing, and Denial of Service (DoS) classes. In particular, the DoS, probe, and benign classes improved their F1-scores by 7.91%, 32.62%, and 12.45%, respectively.Keywords
With the rise of networked technologies like the Internet of Things, mobile devices, and cloud-based services, the Internet has become the most crucial security service available today. A network’s attack surface increases with complexity, which makes it simpler for cybercriminals to take advantage of weaknesses using advanced tactics like malware, zero-day threats, root-to-local assaults, Distributed Denial of Service (DDoS) attacks, probing, and user-to-remote attacks [1]. To effectively address new and changing threats, security measures must use cutting-edge deep learning and data mining techniques [2]. A proactive alerting method for spotting irregularities in network traffic is anomaly detection [3]. Significant cyberattacks can go undetected without suitable intrusion detection systems, compromising network availability, confidentiality, and integrity.
A critical area of study for cybersecurity experts is intrusion detection. It entails identifying and reacting to hazardous or unauthorized activity within a system or network. Usually, anomaly-based and signature-based approaches are used to identify unusual trends in system behavior or network traffic [4]. Signature-based intrusion detection systems (SIDS) identify anomalous activity using a predetermined set of signatures. This approach continues to work until more sophisticated threats appear. An excellent illustration of how attackers might get around security is zero-day assaults [5], which use out-of-date signatures. Furthermore, polymorphic and encrypted malware [6] can readily avoid detection by changing its payload.
The noteworthy disadvantages underscore the necessity of a detection strategy capable of tackling zero-day assaults and more intricate vulnerabilities. Anomaly detection methods are better suited for dynamic contexts because they can swiftly adjust to constantly changing threats [7]. Furthermore, identifying risks from internal traffic also increases efficacy [8]. Several deep learning and machine learning techniques are used in anomaly detection to quickly and accurately identify anomalous traffic characteristics that depart from accepted norms. Attacks are post-identified when anomalies or outliers reveal unusual activity.
Many infiltration cases happened in the past when system security was not fully implemented, costing the attacked companies millions of dollars in losses [9]. As a result, there is now more pressure to counter sophisticated attack techniques. Anomaly-based Detection (AIDS) and Signature-based Detection (SIDS) are the two main types of Intrusion Detection Systems (IDS) that are incorporated into modern computer security systems. Using pre-established algorithms, SIDS detects attacks by comparing studied traffic with known data patterns. It works well, where threats are identified but not enough to handle unforeseen and future risks [10]. Consequently, it can be argued that this method is overly passive and defensive, suggesting frequent system changes are unavoidable. Since it only works against recognized threats, it is even harder to identify new kinds of cyberattacks. Conversely, Intrusion Detection Systems create a reasonable baseline of behavior using statistical and machine learning methods, and they consider departures from this baseline to be possible signs of a security event. This method works well for identifying sophisticated or hitherto undiscovered attacks. Its drawback is that its reliance on behavioral patterns frequently produces more false positives, requiring the impacted user to alter their usage habits [11].
Fig. 1 depicts intrusion detection systems classified into five classes: network IDS, Hybrid IDS, Host-Based IDS, Misuse, and Anomaly. Network IDS monitors network traffic for any unusual activity and then looks closely at abnormal bandwidth usage or suspicious packets. Host-based IDS monitors activities on a single system or host and provides host-specific analysis. Hybrid-based IDS integrates host-based and network-based intrusion IDS features, balancing its components’ strengths, improving accuracy, and reducing false positives. Modern-day threats like zero-day attacks require more robust systems that detect these unknown and novel attacks, and anomaly-based intrusion detection systems do this. Anomaly-based IDS, due to its ability to capture unknown vulnerabilities as early as possible, has trained many machine learning and deep learning models in the system to attain more efficacy. When it comes to detecting vulnerabilities and intrusion by matching or comparing to known attack patterns, Misuse-based IDS is used. The system can attain very low positive rates if the signature database is comprehensive and up to date.
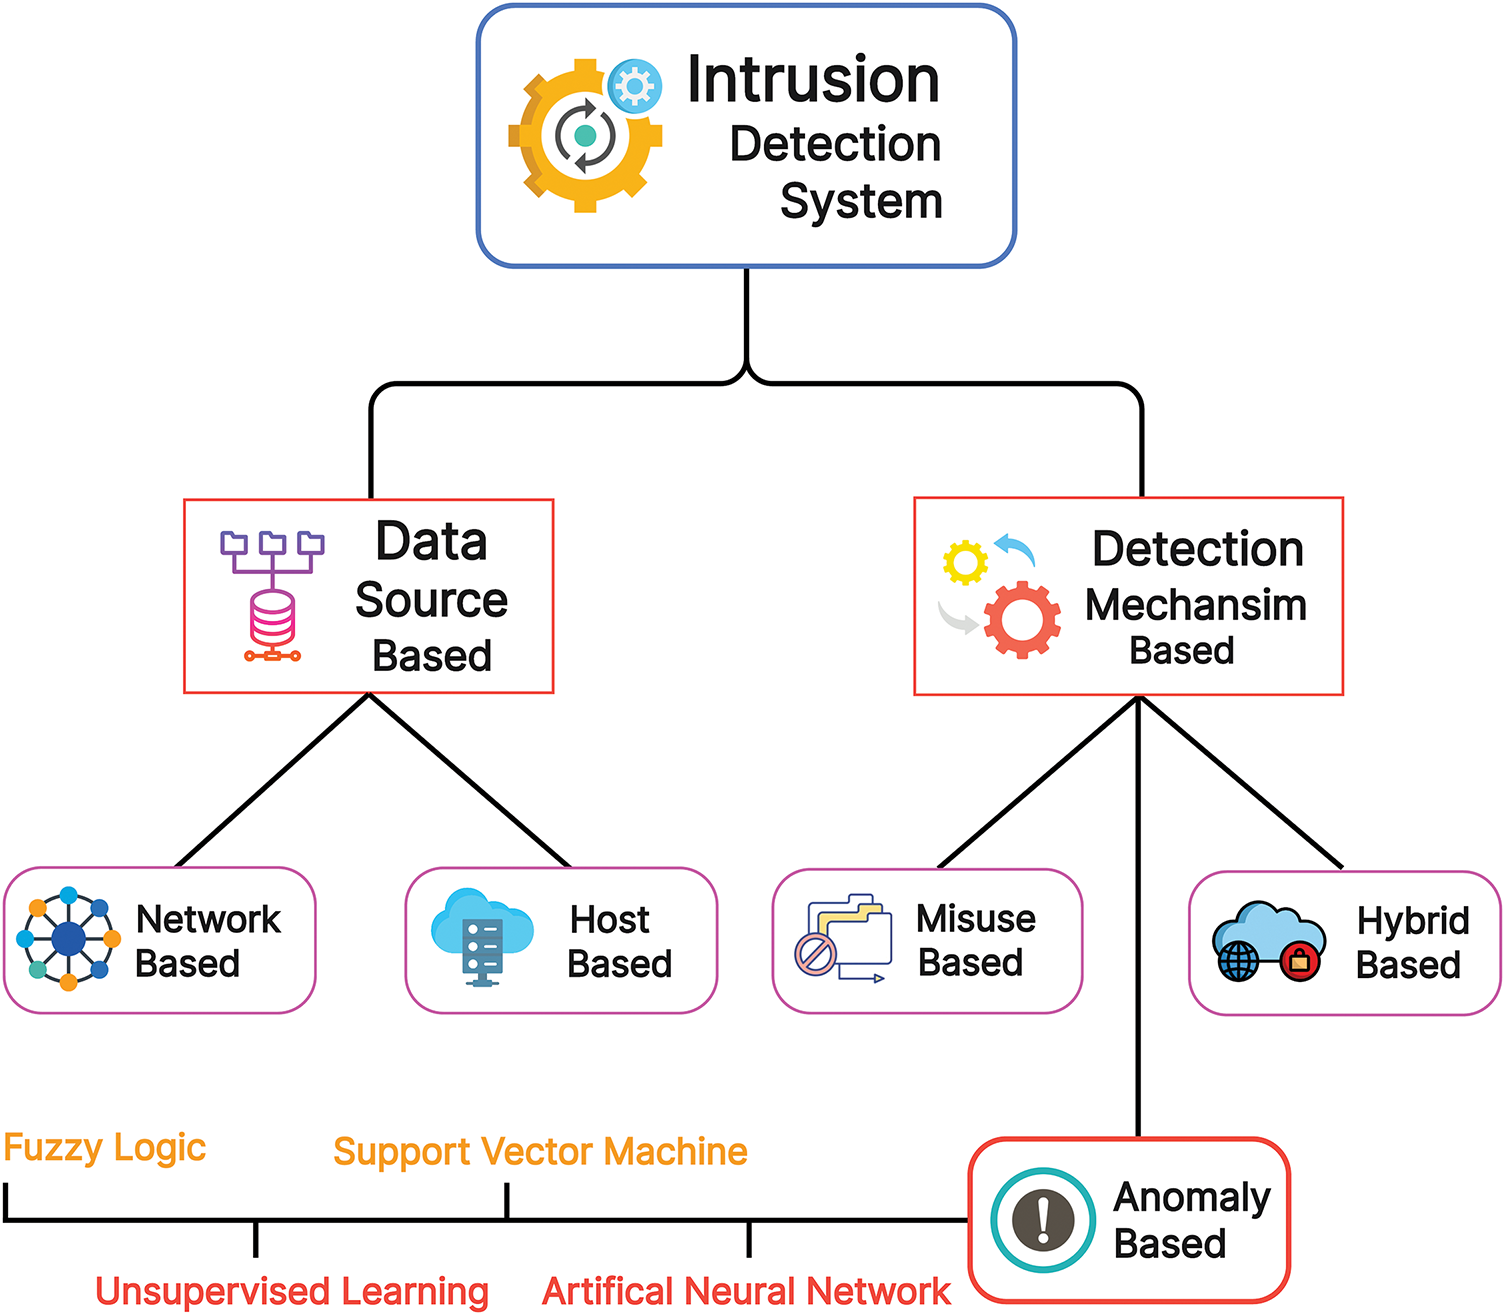
Figure 1: Intrusion detection system types
The main topic of this study is the application of machine learning methods for intrusion detection, including Extreme Gradient Boosting (XGBoost) and Self-Organizing Map (SOM). The goal of this project is to create a reliable intrusion detection system. Deployment of network edges and comprehensive evaluation metrics will help academics evaluate and contrast our method with current systems. The method of deployment incorporates a three-tier framework for resource-limited network edges: 1) SOM-based dimensionality reduction at the edge to minimize transmission overhead, 2) XGBoost-based real-time intrusion detection or classification, and finally, dynamic updates via federated learning or Growing Self-Organization Map (GSOM) without relying on cloud resources. Enhancement will be obtained by enhancements of energy-efficient hyperparameter optimization, maintaining low latency, energy consumption, and bandwidth efficiency. The effectiveness of the suggested intrusion detection system will be assessed using the confusion matrix. Our SOM-based XGBoost model’s output will help develop a fresh method for intrusion detection.
This paper’s main contributions are as follows:
• This study is intriguing because it integrates a Self-Organizing Map (SOM) with XGBoost for intrusion detection, combining dimensionality reduction and gradient-boosted classification in a novel manner.
• This novel method outperforms well-known approaches like Multilayer Perceptron (MLP) and SOM-KNN (k-nearest neighbors) by reducing high-dimensional network traffic data and lowering complexity, SOM makes anomaly detection easier before classification. XGBoost significantly reduces false positives while effectively handling unbalanced data.
• This hybridization approach that leverages unsupervised learning for dimensionality reduction and supervised learning for classification efficiently classifies multiple network attack types rather than binary detection, leading to its real-world applicability.
The paper’s structure is intended to aid readers in comprehending the suggested research. The difficulties with current intrusion detection systems are covered in Section 4, which also examines related work. The preprocessing, grouping, and classification stages of the suggested model’s technique are described in Section 5. An overview of the NSL-KDD dataset is given in Section 6. The performance indicators are shown in Section 7. Section 8 describes the multiple machine learning models developed in this paper and their visuals. Experimental data and a thorough comparison of the models employed in this study are presented in Section 9. A final discussion of the study’s what, why, and how is given in Section 10. The relevance of the findings is summed up in Section 11.
The Internet of Things (IoT) industry’s explosive expansion has sparked serious privacy and security issues. The authors [12] present a novel intrusion detection system integrating t-distributed Stochastic Neighbor Embedding a nonlinear dimension reduction technique with a Support Vector Machine. The authors focus on addressing the issue of low detection accuracy in rare types of classes User to Root (U2R) and Remote to Local (R2L) through significantly transcending data representation just a step before classification. Implementing t-distributed Stochastic Neighbor Embedding (t-SNE) with Support Vector Machine (SVM) results in 96.51% and 86.60% of detection accuracy for R2L and U2R classes. Reference [13] that uses fine-tuned hyperparameter tweaks to improve performance with minimal computing expense to solve the botnet attack prediction problem. The model uses dropout layers to reduce underfitting and overfitting. Deep Neural Network-Based Botnet Prediction Model (DBoTPM), one of the most precise and effective botnet prediction algorithms, attains 100% detection accuracy in real-world data evaluations.
Using the UNSW-NB15 dataset, deep learning models such as Artificial Neural Network (ANN), Deep Neural Networks (DNN), and Recurrent Neural Network (RNN) have shown exemplary performance in multi-class and binary classifications of IoT network infections [14]. The International Geomagnetic Reference Field Recursive Feature Elimination (IGRFRFE) fusion strategy, which combines Information Gain (IG) and Random Forest (RF) Importance with MLP and ensemble feature selection, was introduced to improve feature selection and detection within UNSW-NB15. When used on the UNSW-NB15 dataset in 2021, a CNN-based method [15] detected network intrusions with 93.5% accuracy. With a 98.89% accuracy rate, the UNSW-NB15 model outperformed the KDD99 dataset regarding precision.
Machine learning models such as SVM, K-NN, deep learning, and neural network models were contrasted for verified forensic analysis. The CTU-13 and Torii Botnet dataset botnet patterns were categorized. With accuracy rates of 61.4%, 93.3%, and 99.99%, respectively, the neural network model surpassed SVM and K-NN, according to the authors’ [16] results table. Nevertheless, the neural network similarity model’s (NNSM) capacity to generalize across heterogeneous data is constrained by overfitting.
Model performance is frequently constrained by computational and resource constraints, which results in inaccurate detection, misclassification, and less-than-ideal system outcomes. Bharatiya [17] explores intrusion detection using Principal Component Analysis and SVM using the KDD’99 dataset. The author established that reducing the dimension of given data (input) causes a decline in classification execution time and misclassification rates. Preserving the features through Principal Component Analysis (PCA) helps remove noise and redundancy, control computational overhead, and enhance predictive accuracy.
Lu et al. employ a unique research approach by optimizing Kernal PCA, a dimensionality reduction method through the Bald Eagle Search (BES) tuner. The proposition of CS-RF: cost-sensitive random forest [18] prompts to attain superior performance for detecting the accuracy of intrusion to achieve 98.70% detection accuracy, and reducing 11.32 s of training time. This approach outperforms traditional approaches like PCA, ISOMAP, and Locally Linear Embedding (LLE). Minority class intrusion was also detected promisingly, showing enhanced real-time intrusion detection.
Kim et al. uses cross-device method [19] uses a single autoencoder model on the N-BaIoT datasets and shows strong recall (0.9994–0.9997) and precision (0.9999–1.0000). Authors call it ‘Lightweight’ because it just uses one simple model, this approach achieves scalability, efficiency, and computational simplicity. Using a variety of machine learning techniques, such as Decision Tree, Naïve Bayes, Logistic Regression, Random Forest, K-NN, and deep learning algorithms including CNN, RNN, and Long short-term memory (LSTM), a robust ensemble framework that included data preparation, training, and detection was tested. With F1-scores above 0.99, the results show that CNN performed better than alternative deep learning models for most attack types. Furthermore, with F1-scores near 1.0, the Random Forest and Decision Tree models showed the best detection accuracy [20].
In this high-tech age, industrial IoT needs a strong botnet prevention plan. A deep learning strategy for Industrial IoT is put forth by AttackNet [21] to thwart complex botnet attacks. On the N-BaIoT dataset, an adaptive hybrid approach that combines convolutional neural networks with gated recurrent units is used achieving 99.75% accuracy, precision, and recall. AttackNet performs noticeably better than existing techniques, with accuracy gains ranging from 3.2% to 16.07%. This hybrid strategy provides excellent accuracy, effective processing, and resistance to botnet attacks.
IoT systems may be impacted by security breaches that jeopardize data integrity and service availability, according to Abusitta et al. The authors suggest a denoising autoencoder to enhance feature extraction from IoT data, which is often noisy and inherently heterogeneous [22]. Two layers comprise the model: a decision layer that gathers pertinent characteristics for anomaly identification and a neutral layer that eliminates unnecessary features. The suggested approach performs more accurately when detecting malicious data than existing IoT-based anomaly detection techniques. It outperforms systems based on Restricted Boltzmann Machines (RBM), Stack Autoencoders (SAE), and Stack Denoising Autoencoders (SDAE) with classification accuracy of 91.4% at layer 1, 93.7% at layer 2, and 96.4% at the last layer.
Abusitta et al. talk about how IoT systems might be impacted by security threats that jeopardize data integrity and service availability. The authors suggest a denoising autoencoder [22] to improve feature extraction from IoT data, which is inherently heterogeneous and frequently noisy. A neutral layer eliminates unnecessary features from the model, while a decision layer collects pertinent features for anomaly detection. The accuracy of the suggested approach in detecting malicious data is higher than that of existing IoT-based anomaly detection techniques. The classification accuracy surpasses the performance of systems based on Restricted Boltzmann Machines (RBM), Stack Autoencoders (SAE), and Stack Denoising Autoencoders (SDAE) at layer 1, layer 2, and layer 3, reaching 91.4%, 93.7%, and 96.4%, respectively.
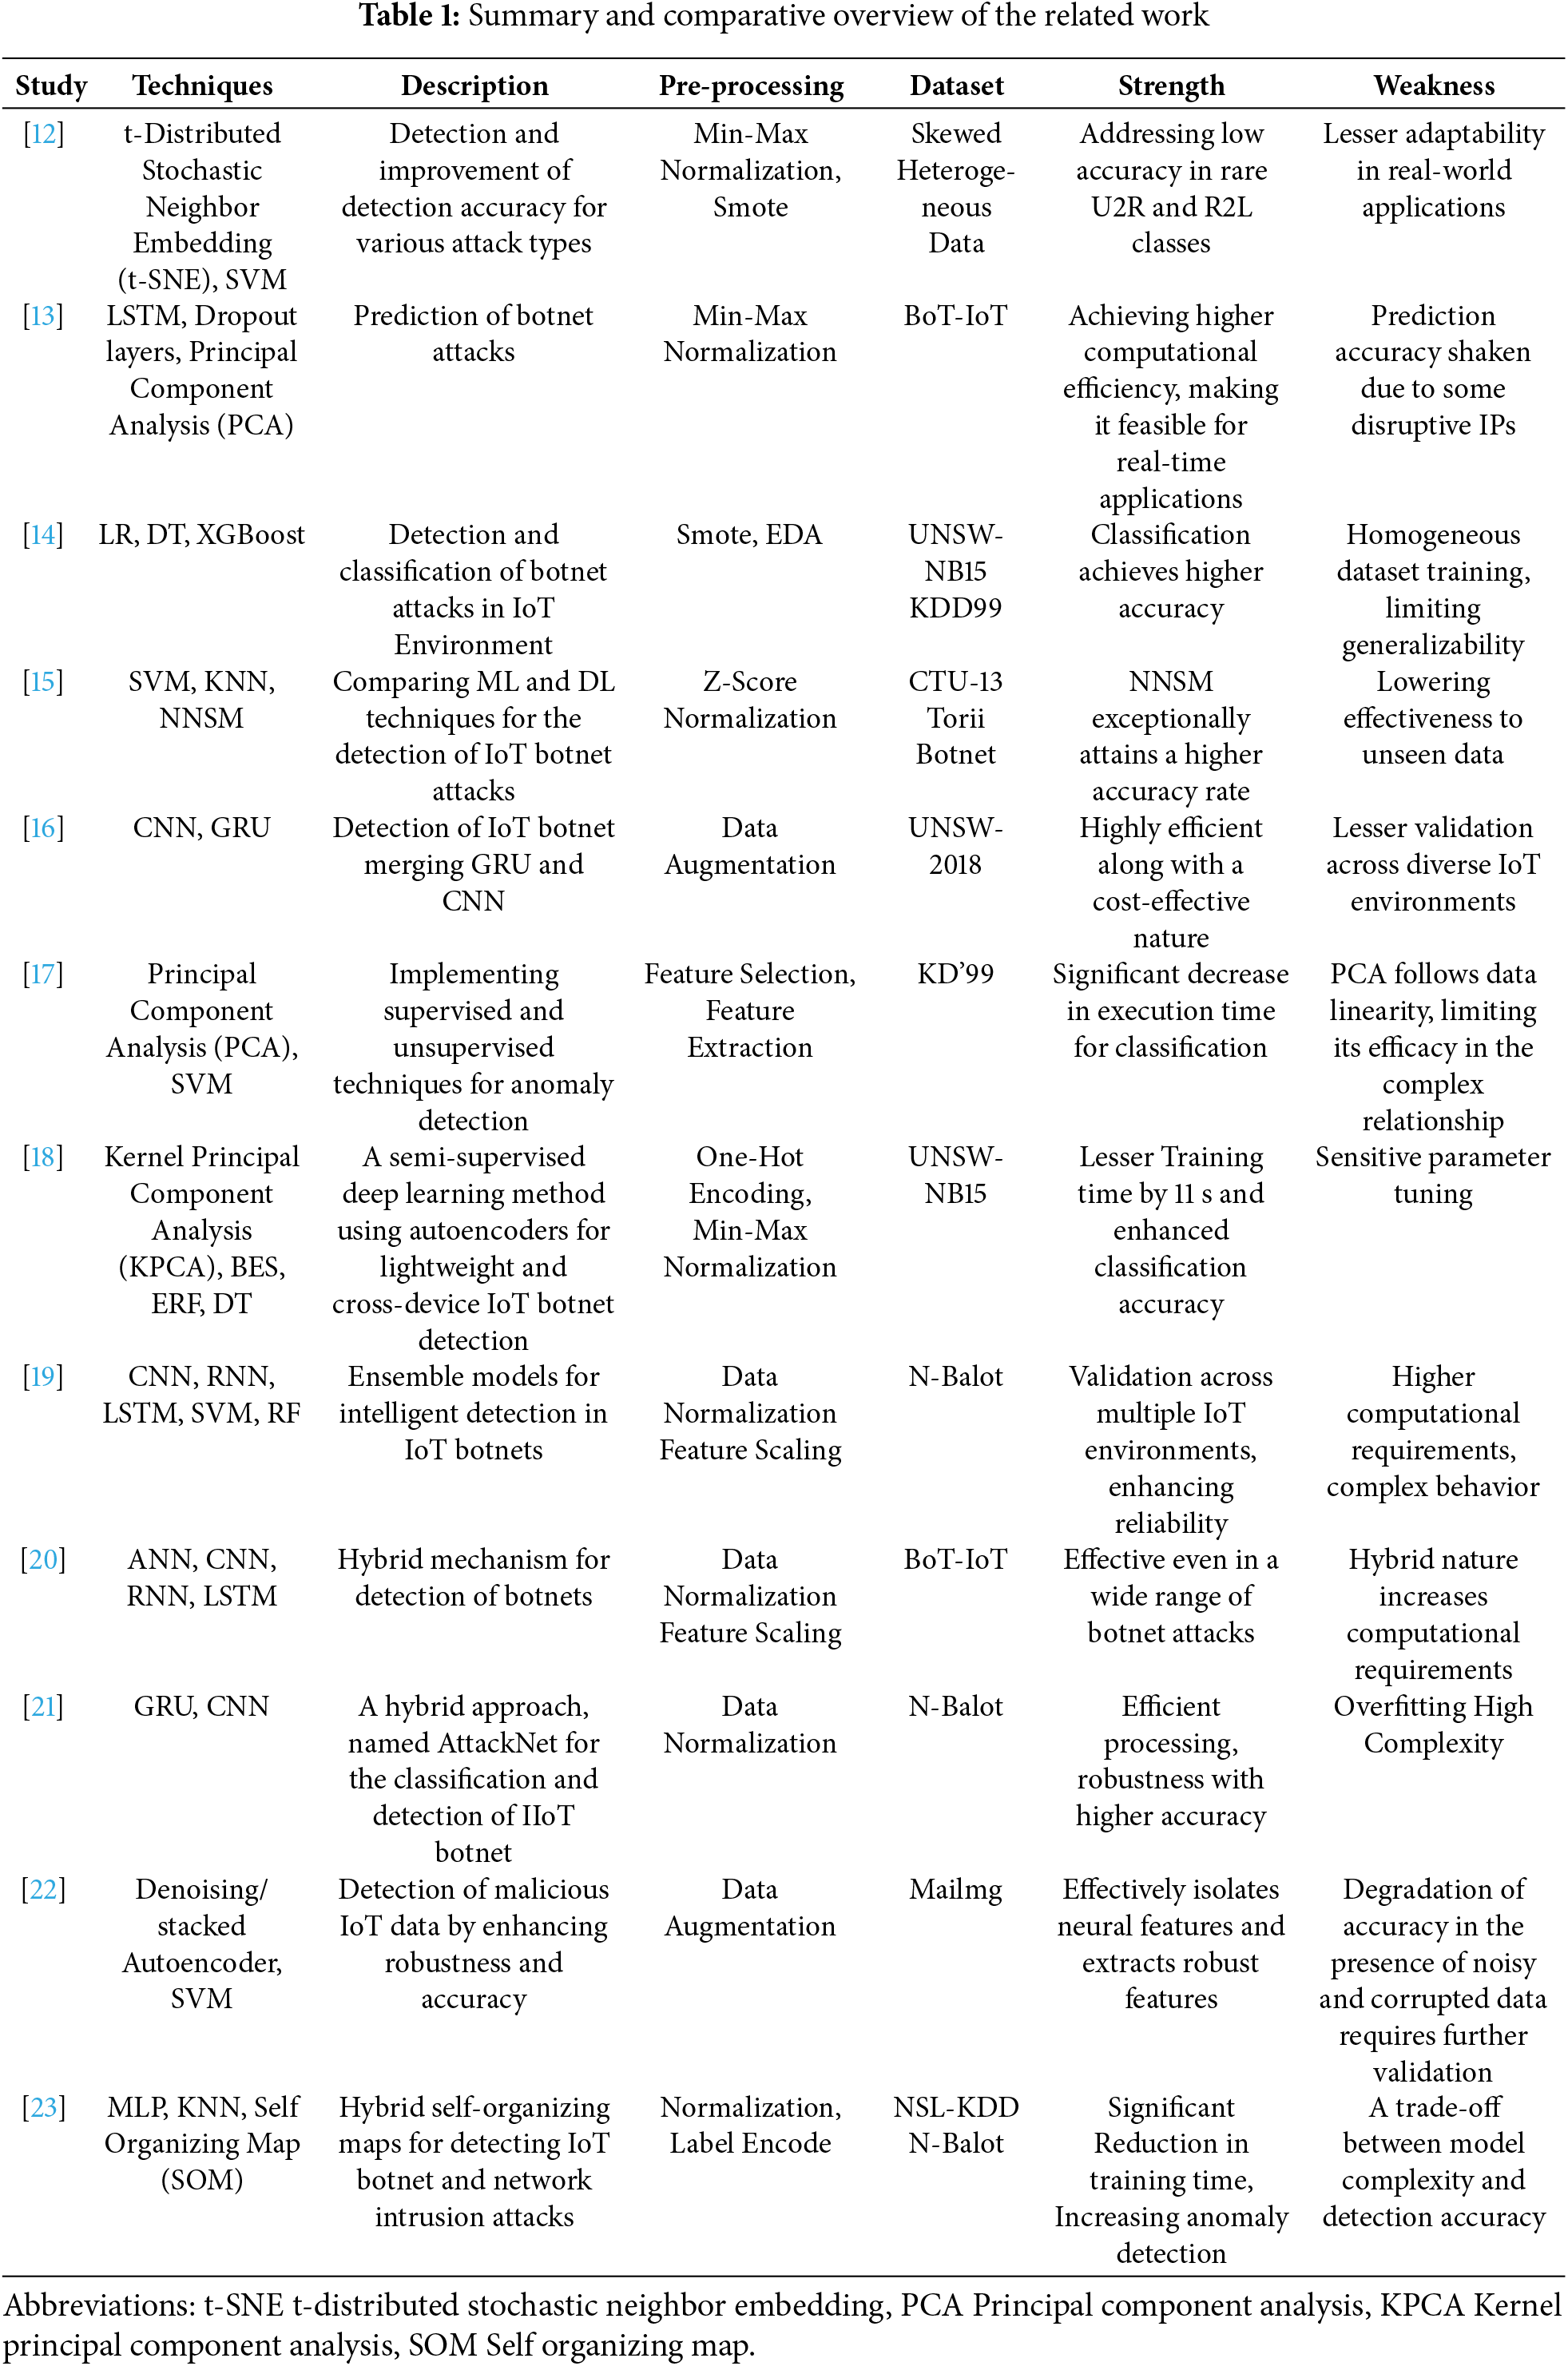
To efficiently detect abnormalities in IoT sensor networks, Khan et al. [23] provides a novel method that combines a Self-Organizing Map with k-nearest neighbors (KNN). The IoT botnet and NSL-KDD were two unique datasets that assessed the hierarchical self-organizing map (HSOM) model’s performance, demonstrating notable gains. The F1-score was significantly improved by 41.87% compared to the benchmark MLP model. The macro averages of precision, recall, and F1-score increased by 27%, while the training time was reduced by 95% by shrinking the number of nodes in the SOM. This study’s excellent detection accuracy and lightweight construction are only two noteworthy advantages. It is also scalable, which makes it perfect for resource-constrained IoT applications. A condensed summary of all the literature is given in Table 1.
This research employed a methodology comprising three stages: preprocessing, training, and testing. The preprocessing phase has significantly revised the dataset before further training and testing phases. This consists of a series of activities aimed at cleaning, transforming, and arranging the data in such a way that it is used for analysis. Effective preprocessing also resolves problems with, among others, missing values, outliers, and non-uniformity in the data structures, thus improving the quality of the training and testing of the models. This core phase of the project, where raw data are shaped into the expected form, reinforces the core scope of the project of developing and testing the machine learning model.
During the pre-processing phase, the dataset is refined, values that are missing or imputed, and a couple of unnecessary features are discarded. Features named ‘outcome’ and ‘extra_feature’ in the original dataset have been removed because the ‘outcome’ feature works as a dependent variable, and it should not be present in both data frames of training and learning. The feature ‘extra_feature’ does not contribute to prediction and may cause noise in the data frame while dealing with categorical features, as values are numeric, and the dataset is normalized. Our model uses two separate datasets for training and testing purposes (KDDTrain+ & KDDTest+). The test dataset file is entirely individual, as the model needs to be assessed based on data it has not seen before.
The training begins with using the SOM algorithm, employed for dimensionality reduction of the preprocessed input due to its ability to project and reduce the dimensionality of data, thereby providing valuable insights about the intrinsic data structure. This is followed by training the XGBoost model, whose parameters are designed to optimize performance in boosting, as indicated by its name. Thereafter, hyperparameter tuning is carried out to enhance accuracy based on the errors from the previous iteration. MLP model is also trained and tested. The primary goal of the proposed methodology is to facilitate a comparison between benchmark models of Artificial Neural Networks and the SOM-KNN model. In this context, another model, following SOM-KNN, is trained and tested to evaluate our model’s performance and determine its relative position.
This final stage of the methodology assesses the already acquired model on the evaluation set, measuring accuracy and its effectiveness by employing performance indicators of recall, F1-score, and precision. The confusion matrix, in addition, assists in examining the prediction’s distribution and where the model is performing better or is slacking. The integration of SOM in data analysis and XGBoost in classification guarantees satisfactory performance of the model where it proves to be a comprehensive approach in addressing classification issues by applying high-end computing approaches.
In addition to performance metrics, evaluating the model’s time complexity and memory usage is crucial in understanding scalability and computational efficiency. The iterative grid-based weight updating SOM’s training process is computationally expensive. It grows in complexity with an increase in size in the input space as well as the dimension of the grid. Likewise, although helpful in classifying, XGBoost’s tree-based gradient boosting method demands even greater memory space and takes longer under large feature spaces and complex datasets. Still, we can also hook up with this issue with specific configurations. We will discuss the impact of these factors in our proposed model. Fig. 2 summarizes all the methodology in a nutshell, how raw data is preprocessed through methods like one-hot encoding, feature scaling, data cleaning, etc. Afterward, the data passes through the training phase using a couple of techniques and is then tested on performance indicators like F1-score, precision, and recall. This illustration helps readers in better understanding quickly.
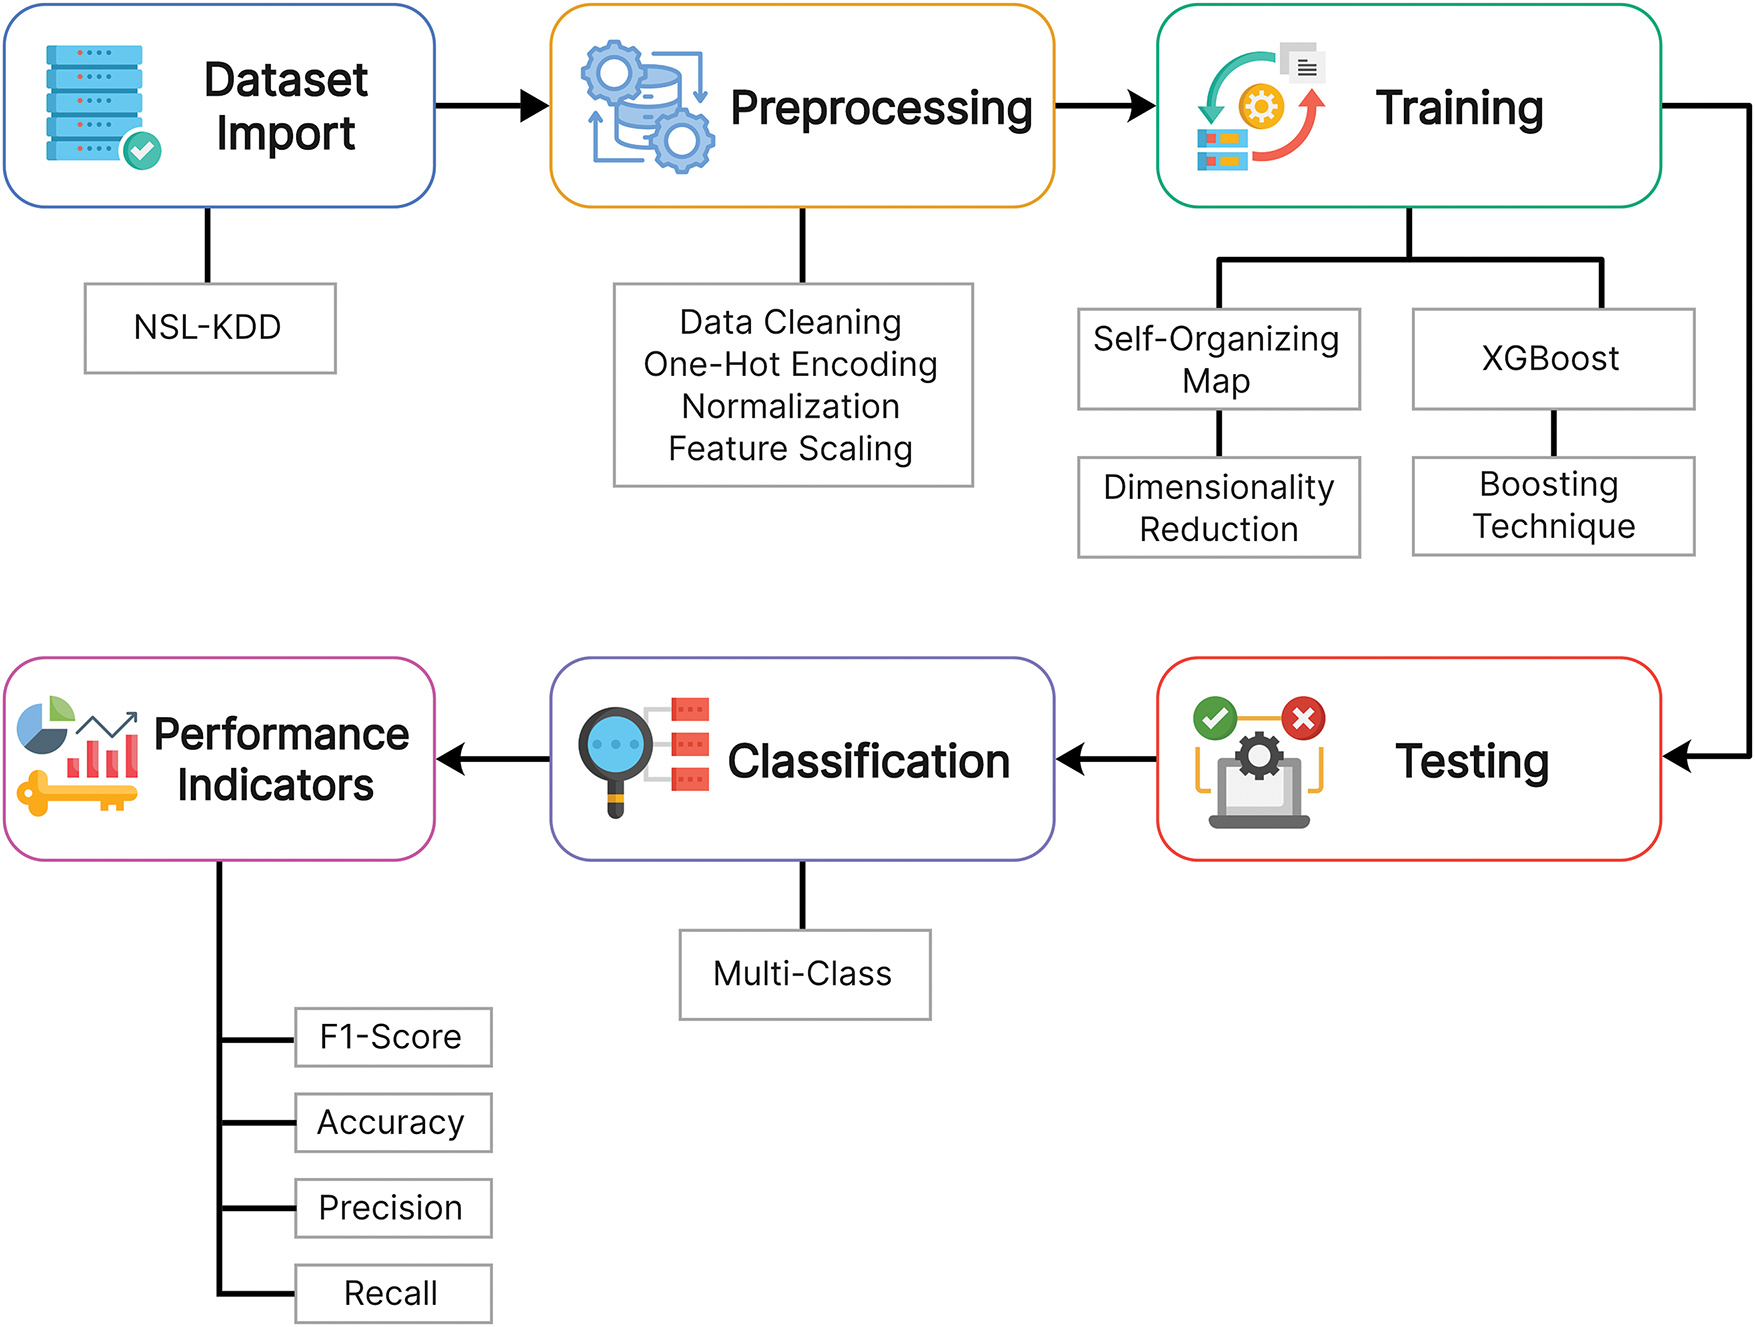
Figure 2: Proposed methodology for multi-class classification in NSL-KDD dataset
Our proposed framework utilizes key libraries such as numpy, panda, sci-kit-learn, and XGBoost for data preprocessing, modeling, and performance assessment. The primary usage of Pandas is to clean the data, while their numerical computations are practically achieved through numpy facilitation. The Scikit-learn presents its development needs by offering methods of execution of cross-validation of the data set and scaling features of the set, as well as evaluations such as recall, F-measure, and precision. XGBoost is the main library for training a classification model based on gradient boosting, and another library—Matplotlib and Seaborn—is responsible for plotting. Python coding and data analysis were performed using Jupyter Notebook, managed through Anaconda Navigator [24]. Models are also saved and loaded when necessary for effective storage utilization and used with specific libraries such as ‘Joblib’. SOM is implemented through the Minisom library, while XGBoost is implemented through the ‘xgboost’ module import.
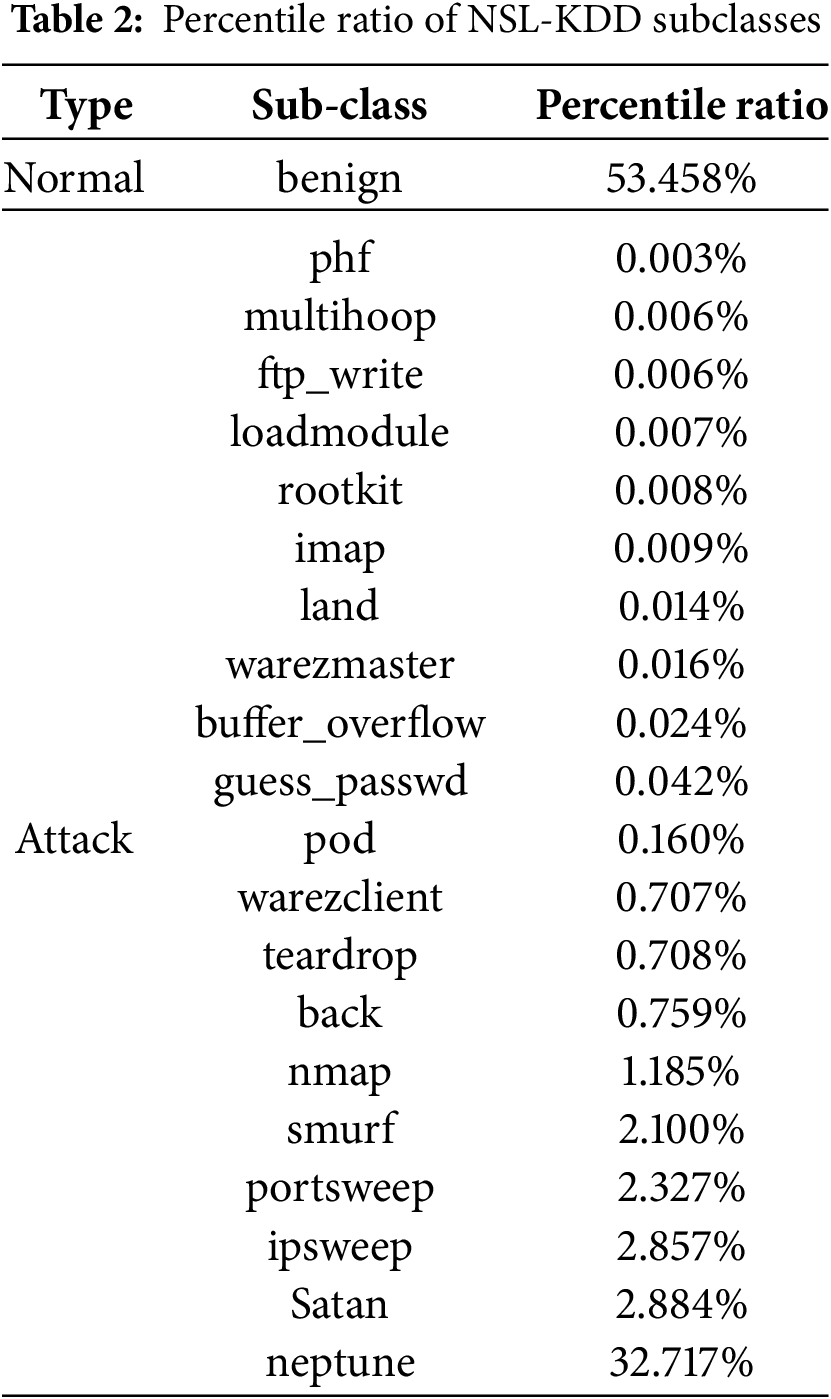
The training set in this paper represents the dataset leveraged for model training. The training dataset incorporates the NSL-KDD dataset. KDD-99 Cup’s enhanced version is NSL-KDD [25], which lacks redundancy in its records. NSL-KDD is used as a training dataset for intrusion detection. The division or distribution of attack and benign traffic is nearly even. Table 2 illustrates the aggregation count of observations in the KDDTrain+ dataset. One major weakness of the NSL-KDD is that it doesn’t incorporate the systems or hosts that are at risk. The total number of records in dataset KDDTrain+ is 125,973 [26], in which benign traffic records are 67,332 (53.45%) and attack traffic records are 58,640 (46.55%). The KDDTest+ dataset comprises 18,794 observations, in which benign records are 9711 (51.67%) and attack records are 9083 (48.33%).
Accuracy: Quantification for which the forecasts made by our models are accurately represented as a percentage [27]. The accuracy score is calculated after training. The model is trained on the training set, generating predictions for the specific test set. Accuracy during multiclass classification is determined by calculating the accuracy of each class individually
Recall: Refers to the ratio of actual positives to the predicted positives classified as true positives, also known as the True Positive Rate (TPR)
Precision: Refers to the model’s accuracy in predicting a targeted class, measured as the proportion of true positives to the total predicted positives after training
F1-score: To better understand how well the model performed, the F1-score is calculated as the harmonic mean of recall and precision. It provides a single metric of recall and precision. Mathematically, it can be expressed as
Enhancement in technologies opens gateways of heaven for researchers. Machine learning, over time, has advanced in a way that has become a significant necessity for all security systems. Complex and large datasets can now be trained and tested with higher success rates. Traditional approaches often find it arduous when dealing with huge or changing environments. In contrast, machine learning techniques, including supervised and unsupervised learning models, tend to be more capable of adaptively recognizing unknown and evolving threats. Specifically, algorithms like Self-Organizing Maps and XGBoost are designed to be good intrusion detection models for isolating anomalies, helping improve cybersecurity, fraud detection, network monitoring, and intrusion detection.
A self-organizing map is the advanced unsupervised ANN technique employed for dimensionality reduction. It also visualizes high-dimensional data commonly divided into two dimensions. This helps to create a topology with lesser dimensions, as discussed above. Conventional neural networks contain hidden layers to solve complex problems. SOM doesn’t employ this type of processing; instead, input nodes are dimensions of the training set. A key attribute of this algorithm is that its output node (each) always possesses coordinates corresponding to the input node. As the SOM algorithm is of a mapping nature, it maps when, according to Euclidean distance [27], the closest distance between the input node and the output node. Moreover, SOM is widely used for dimensionality reduction as well
wi = Output Nodes Weight
xi = Input Nodes
Firstly, the SOM algorithm takes the difference between output and input nodes, sums it up, squares them up, and then takes the square root to calculate the distance as depicted in Eq. (1). The best matching unit (BMU) is determined by the shortest distance of output nodes to input nodes. Updating the weights of output nodes to move closer to nodes containing input values. This method uses neighbor functions that affect nodes adjacent to the best matching unit so that they are forced to converge, this mechanism clusters similar nodes in the two-dimensional map. Fig. 3 gives a visual presentation of SOM architecture in the simplest way.
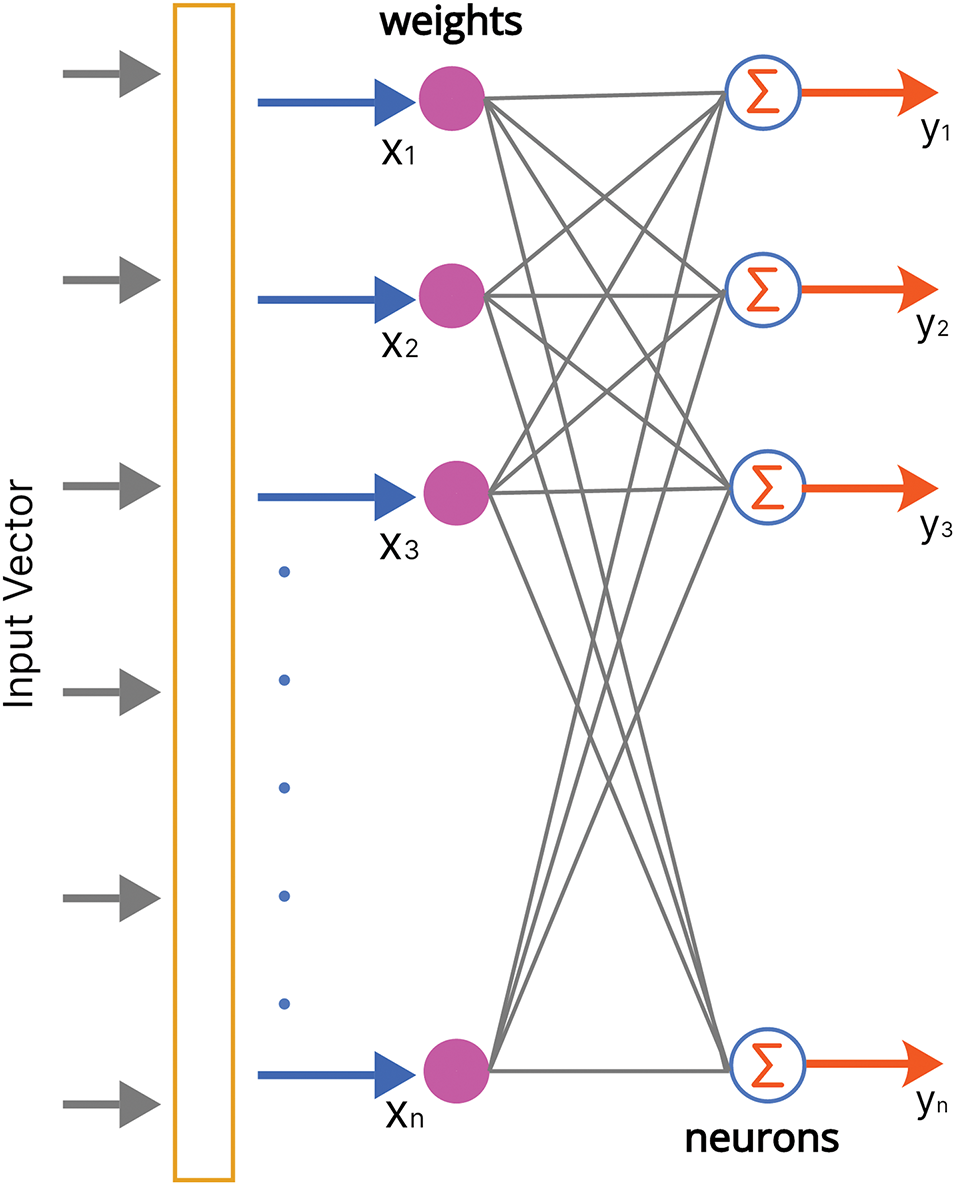
Figure 3: Architecture of self-organizing map
Since the self-organizing map focuses on the visual representation of nodes and their relationships to their neighbor nodes, it is easy to understand. Thus, it presents the algorithm more intuitive than any other machine learning algorithm. The self-organizing map is a robust algorithm for solving modern challenges, such as dimension reduction, pattern recognition, image processing, and other similar fields. In the subsequent subsections, we will see how SOM makes clusters and visualizes our subjective dataset NSL-KDD. This research deals with three cases in which dimensionality gain is achieved to serve our purpose. Fig. 4 shows the implementation of SOM with a 5 × 5 node shape.
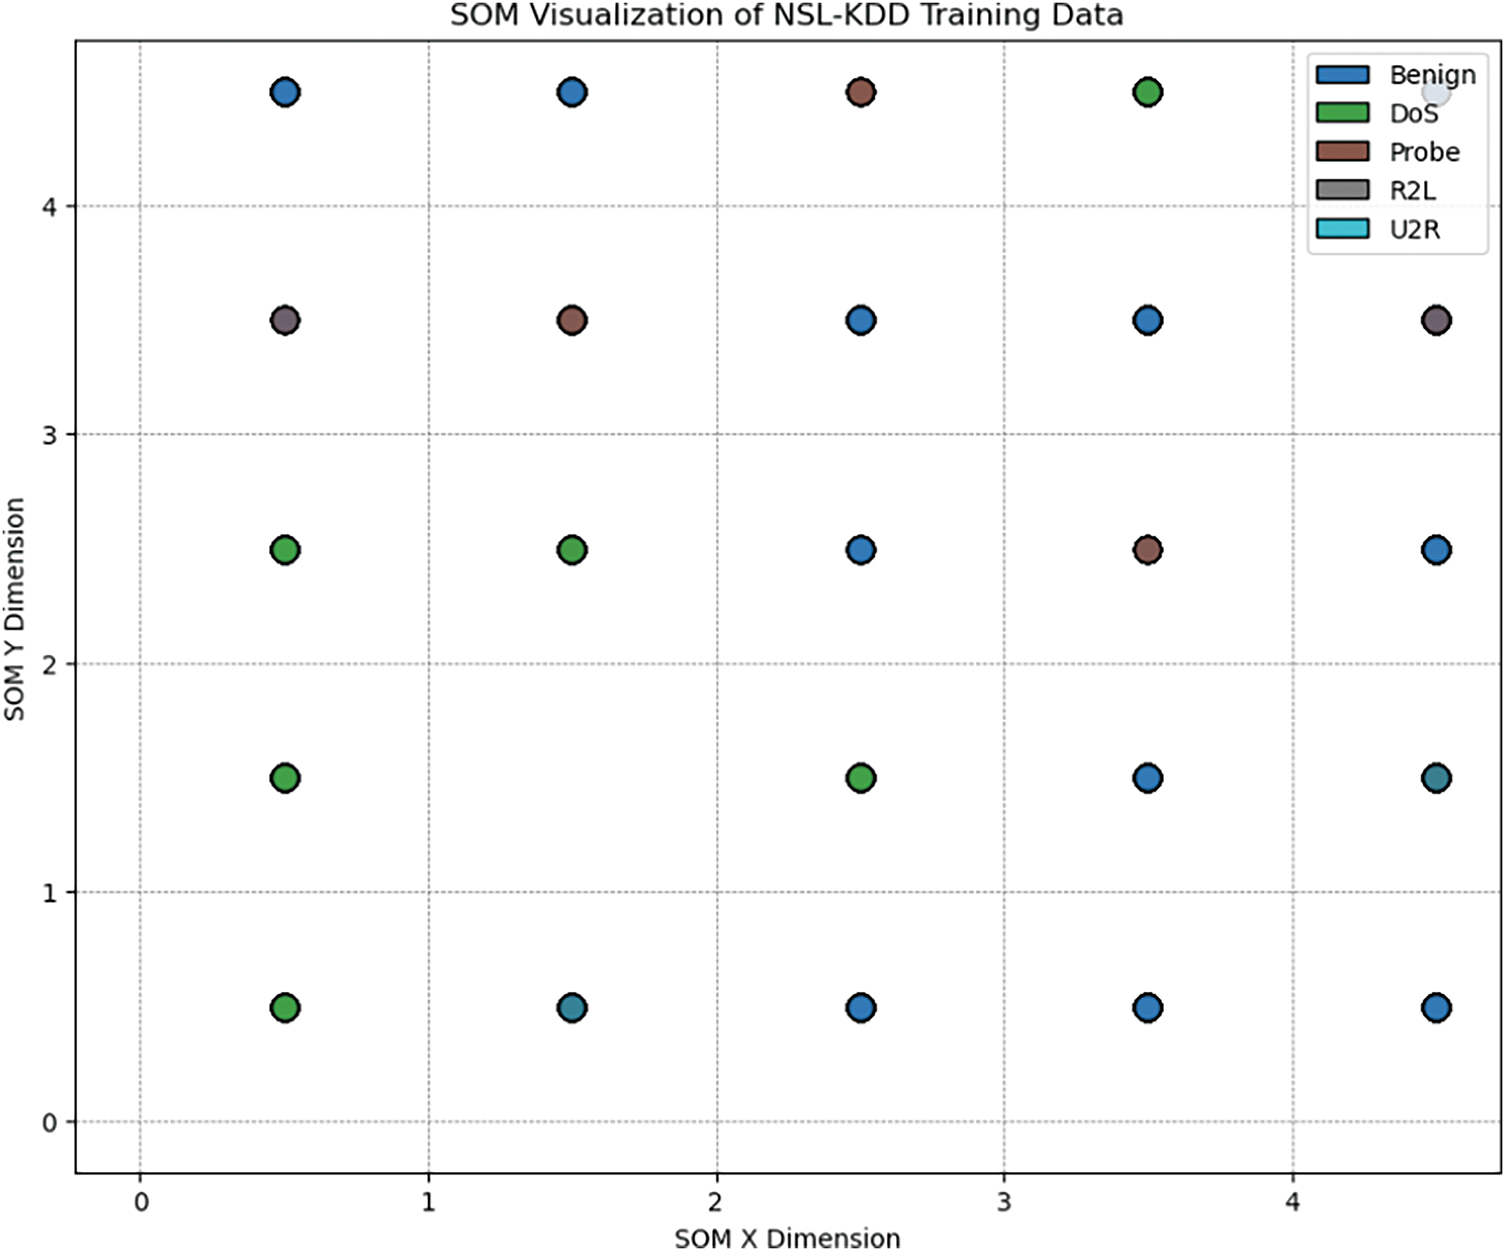
Figure 4: SOM visualization of NSL-KDD with 5 × 5 nodes shape
Fig. 4 represents a 2D projection of high-dimensional data into lower-dimensional space. Each corresponding node contains data points that are mapped to it. Color-coded dots (data points) are clustered based on their similarities. For better understanding, benign attack clusters (blue) are mapped in several locations all over the grid, representing class types, and are accordingly clustered across the grid (based on similar features). The NSL-KDD dataset is visualized (clustered via SOM) in Figs. 4–6. Figs. 5 and 6 show a similar clustering nature with adding more nodes, i.e., 10 × 10 and 15 × 15 nodes shape.
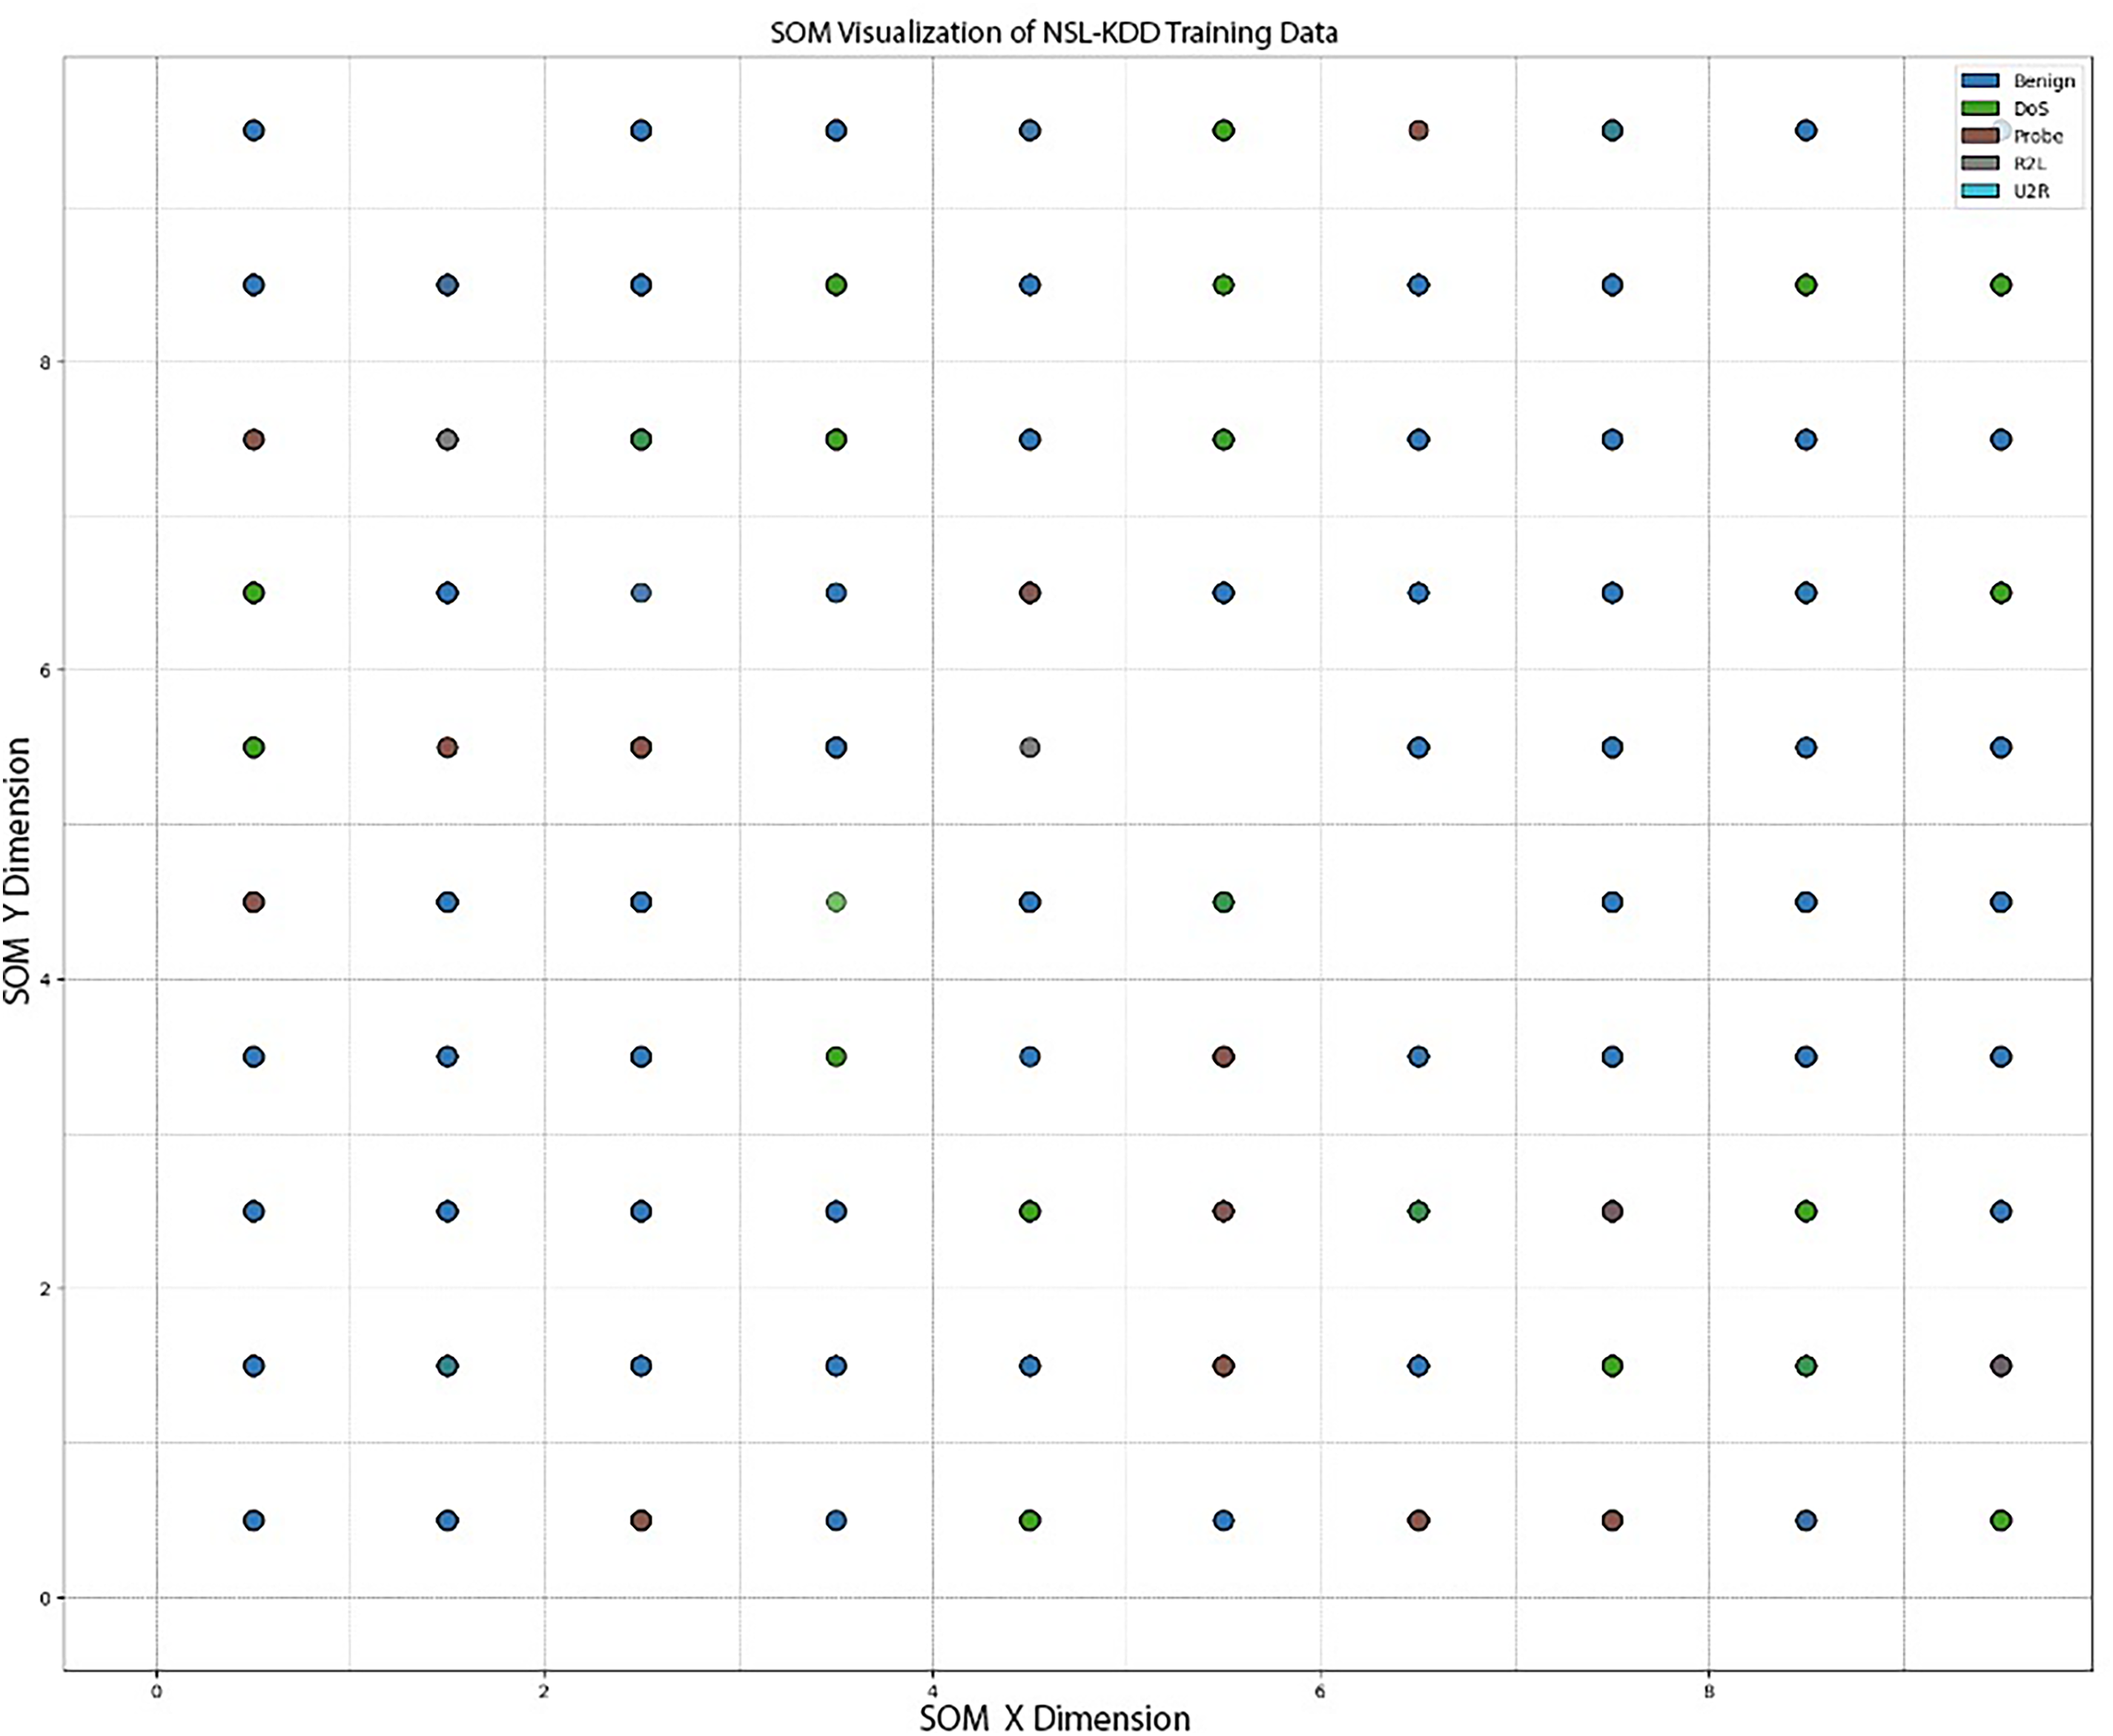
Figure 5: SOM visualization of NSL-KDD with 10 × 10 nodes shape
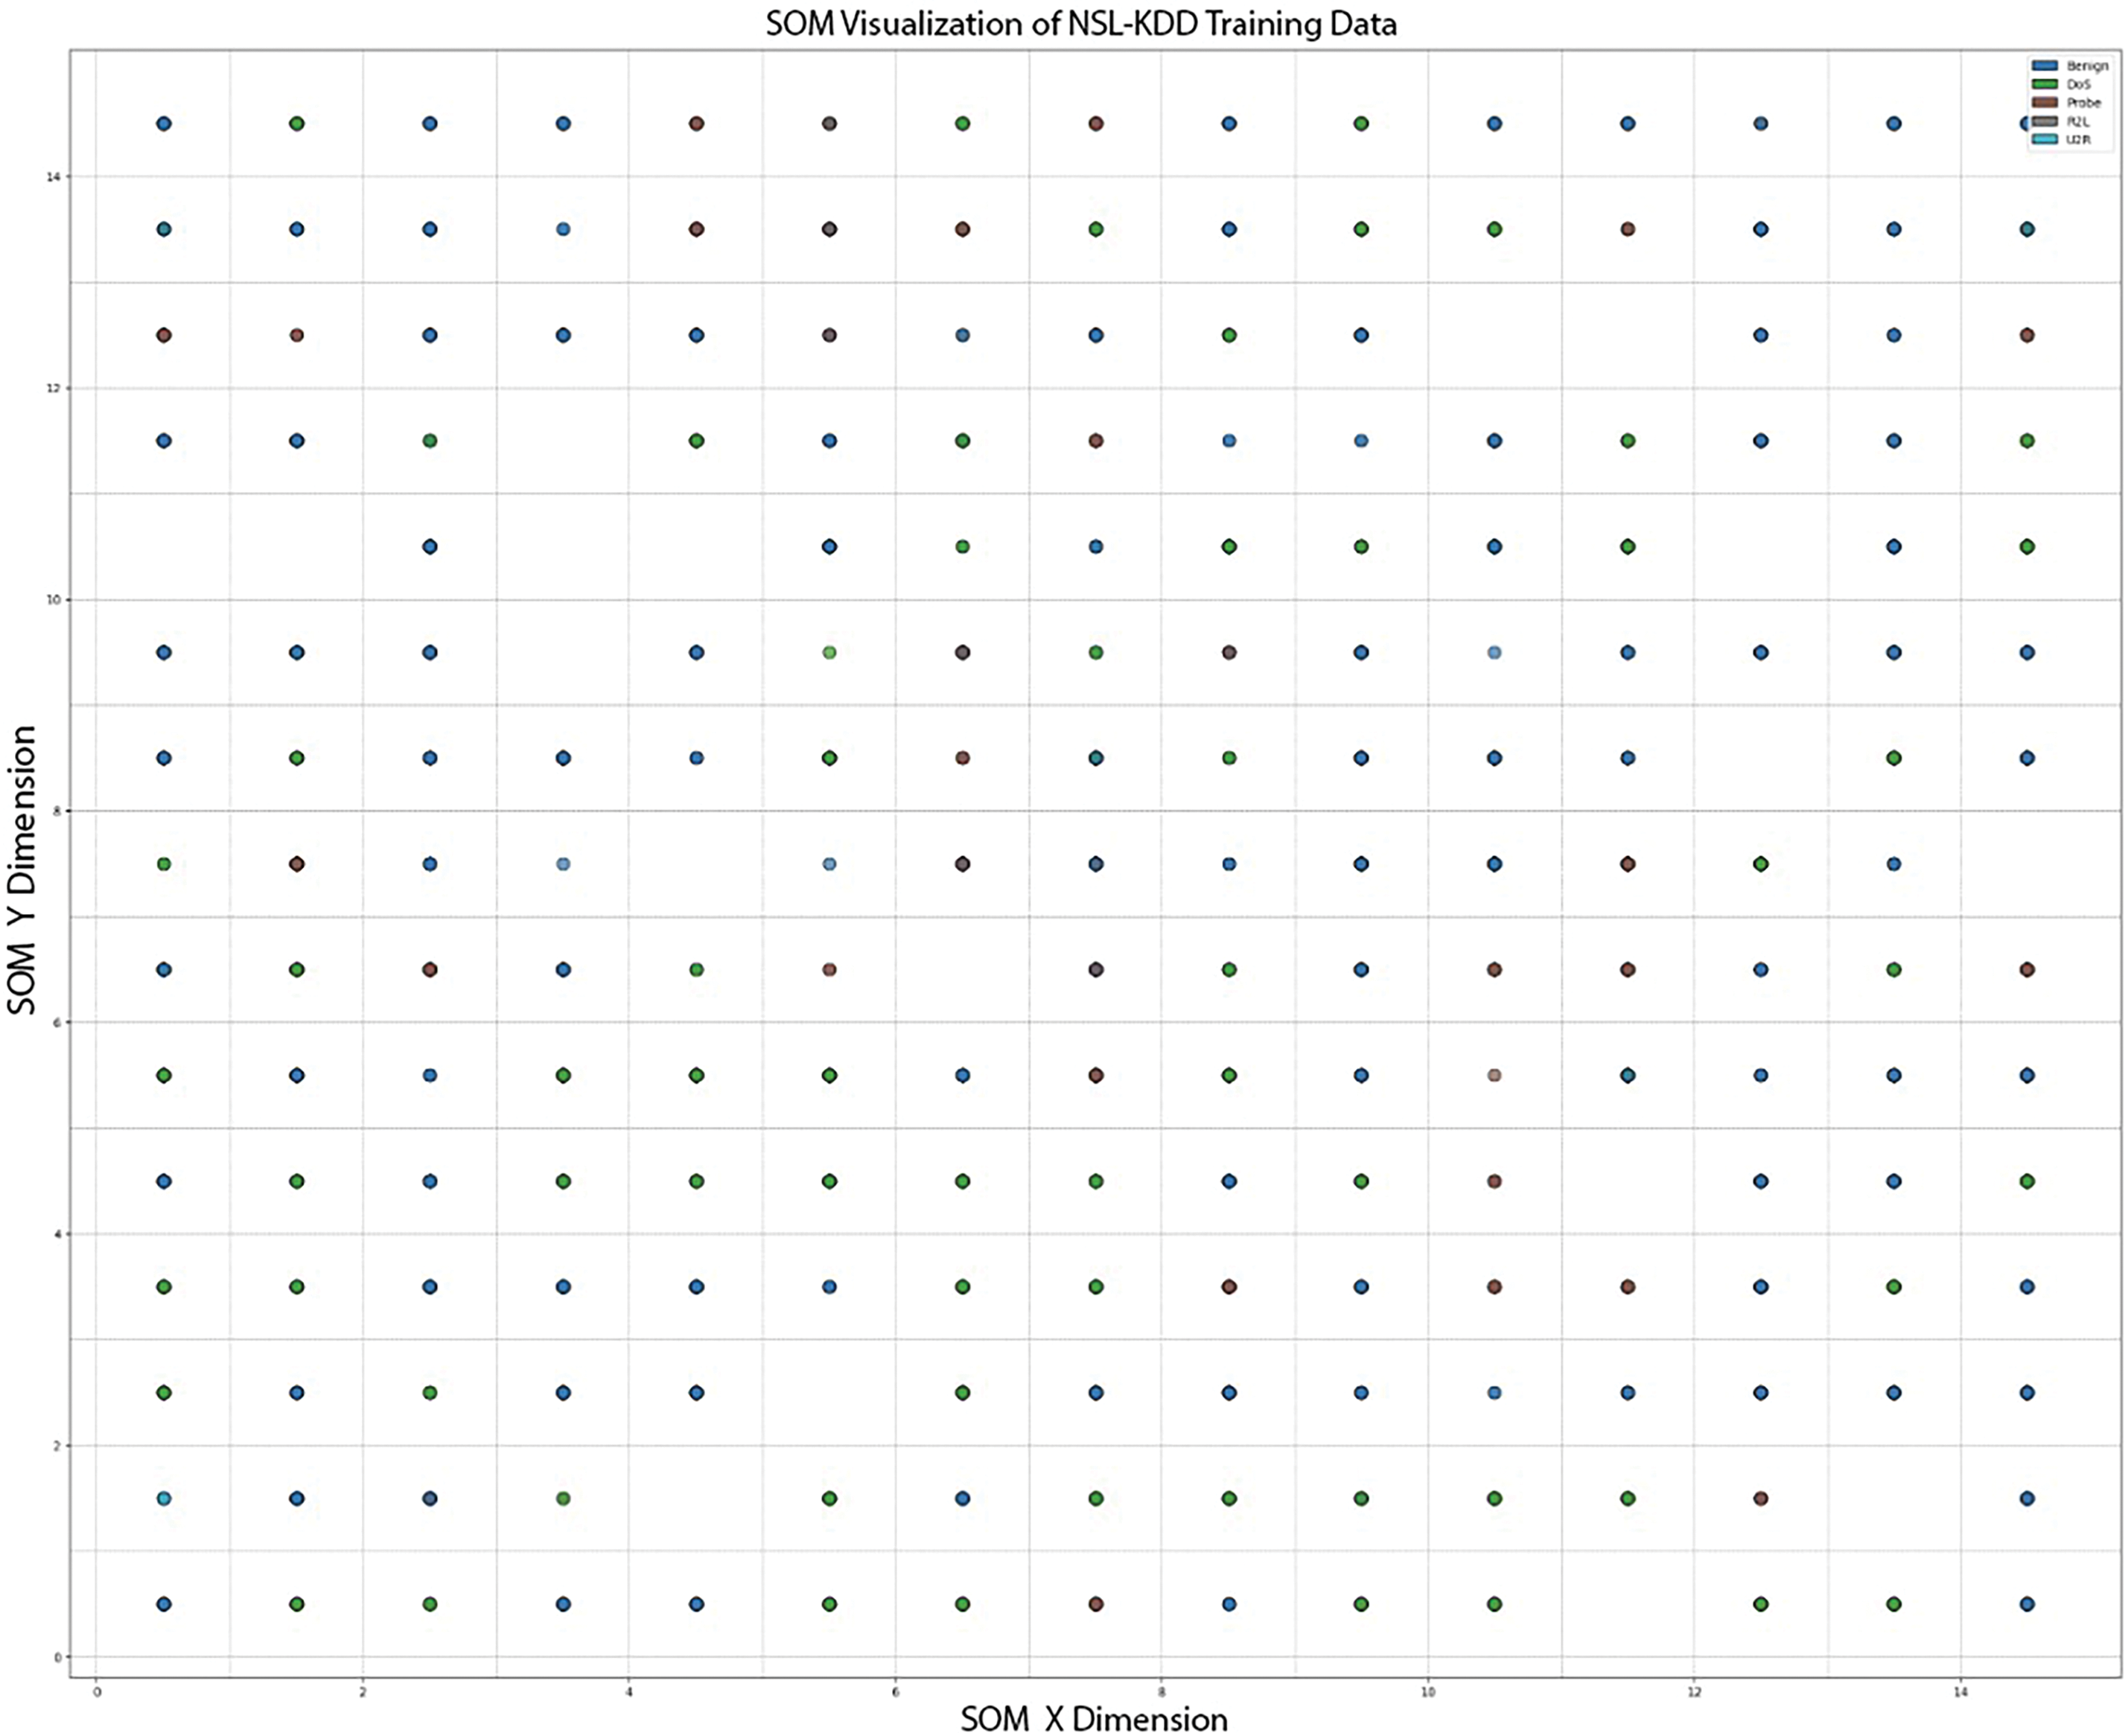
Figure 6: SOM visualization of NSL-KDD with 15 × 15 nodes shape
Changing the grid size is tested to evaluate its impact on the clustering quality, model performance, and computational efficiency. A 5 × 5 grid or node shape employs a faster, simpler, and less resource-intensive configuration, whereas 10 × 10 and 15 × 15 offer more granularity and additional computation costs. This helps us understand the practical aspects of intrusion detection systems.
Unlike other linear methods such as Factor Analysis, Principal Component Analysis (PCA), linear discriminant analysis (LDA), Independent Component Analysis (ICA), and Canonical Correlation Analysis (CCA), Self-Organizing Maps feature nonlinear mapping that is proficient in visualization and projection of higher-dimensional data onto lower dimensions. This nonlinear mapping behavior helps preserve the neighborhood properties and spatial relationships of the given (original) data in the projected dimension. Linear methods imply linear relationships, which lose the data’s topological relationship, neglecting the local proximity relationship between data points. Uniform Manifold Approximation and Projection (UMAP) or t-SNE might excel in visualization but lack clustering capabilities; also, they are deemed for continuous data and, therefore, battle with categorical and mixed datasets. At the same time, SOM, along with dimensionality reduction ability, also transcends the clustering capabilities, making it the perfect choice for problems like intrusion detection. Methods like ICA are sensitive to noise and may struggle with outliers while SOM is more robust to noise and irregular data due to its iterative adjustment process. Autoencoders are a widely used dimensionality reduction technique, but they require extensive training and tuning, which can be computationally expensive for real-time applications in a resource-constrained network environment. SOM achieves a harmonious balance among efficacy, computing efficiency, and interpretability in tasks related to anomaly detection.
XGBoost is a high-performance, supervised machine learning algorithm operating on the gradient boosting framework, directly building an ensemble of decision trees by focusing correction through finding residuals or differences between actual and predicted values. The algorithm iteratively minimizes some loss functions, mean squared error for regression, and log loss for classification in terms of the weights of the trees. The objective here is to achieve an optimized model with regularization so that it does not overfit and can also work with missing data. The latter prediction is a weighted aggregate of all the outputs from trees. Leveraging the speed achieved through parallel computation and tree pruning, XGBoost has become highly popular for processing large datasets. The algorithm has proven to be particularly efficient for intrusion detection due to the ability to detect complex patterns in data. Mathematically, this relationship can be articulated as
As a gradient-boosting framework, XGBoost leverages computational efficiency and scalability. XGBoost has parallel tree boosting and optimized memory features to make it suitable for large-scale datasets commonly used in anomaly detection of IoT networks. XGBoost outperforms many conventional classifiers such as K-NN, Random Forest, SVM, and MLP. It implies regularization techniques that help tackle overfitting and manage linear and nonlinear feature relationships. The inherent interpretability of XGBoost, attributed to its feature importance scores and decision tree architecture, enhances its utilization in essential intrusion detection applications. Classifiers mentioned in the text are computationally expensive, making them unsuitable for real-time applications, prone to overfitting, and require rich computational resources.
8.3 Baseline Methods for Comparison
To evaluate the efficacy of the proposed SOM-XGBoost method, we compare its performance with established Machine Learning (ML) approaches employed in anomaly detection. We employed k-Nearest Neighbors and Multilayer Perceptron models as baseline reference techniques, frequently utilized for classification and intrusion detection purposes. Given the imbalanced nature of the dataset, these models work as a baseline to ensure the wellness of our proposed hybrid model, whether it’s about accuracy, robustness, or computational efficiency.
8.3.1 Multilayer Perceptron (MLP)
MLP is a feedforward subset of an artificial neural network comprising an input, output, and hidden layer. The neural network acquires knowledge via synapses, which are weights modified through activation functions and backpropagation. Based on the weights, the neural network determines which signals to transmit to enhance accuracy in classification tasks. It is commonly used for classification tasks because of its ability to learn complex features. MLP is widely used for intrusion detection, but its hypermeter tuning sensitivity requires prominent computational resources. Fig. 7 shows the basic architecture of MLP.
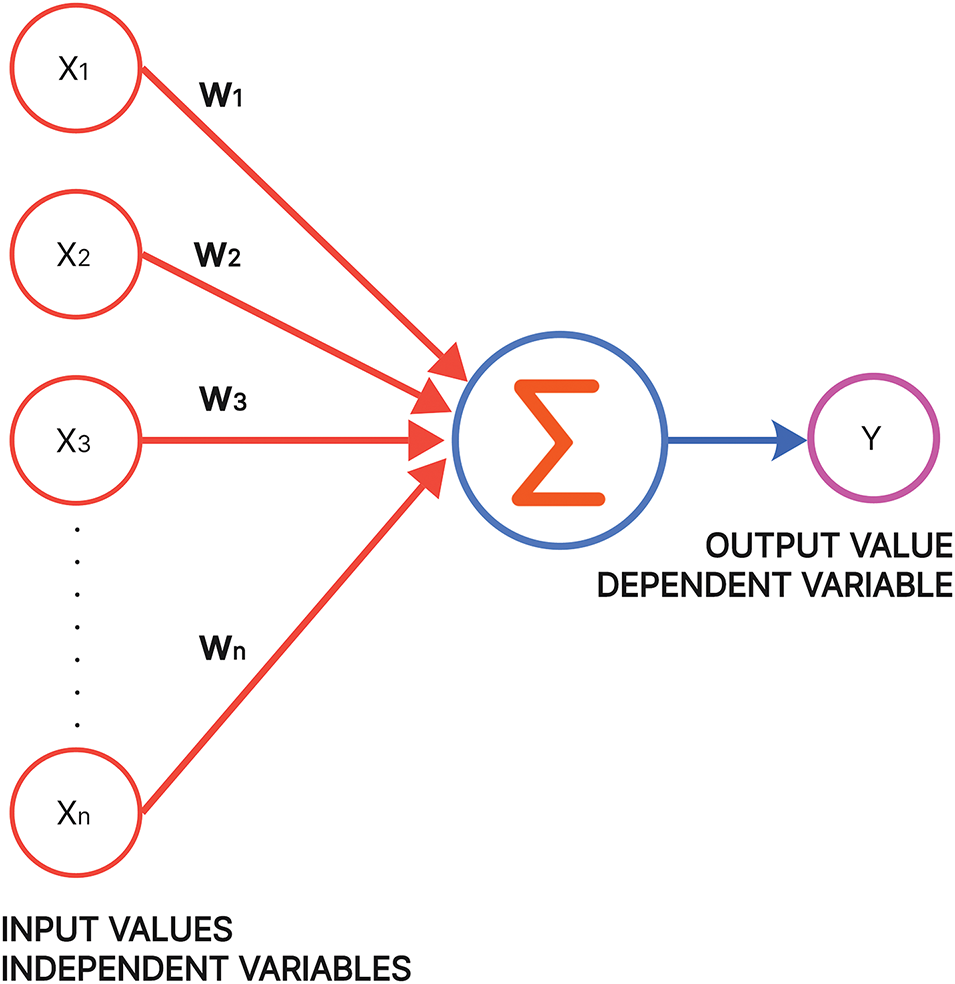
Figure 7: Perceptron model
The K-NN algorithm is a simple yet strong instance-based learning technique that performs classification on a given data point based on the majority vote of its closest neighbors in a given feature space. It uses different types of distances: Euclidean, Manhattan, and cosine similarity. Its non-parametric nature makes it ideal for classification purposes and does not require any extensive training time. In highly dimensional spaces the Euclidean distance metric may lose its efficacy and may lose classification accuracy. Furthermore, class imbalances and outliers affect K-NN abruptly as the decision of boundary making is not up to the mark.
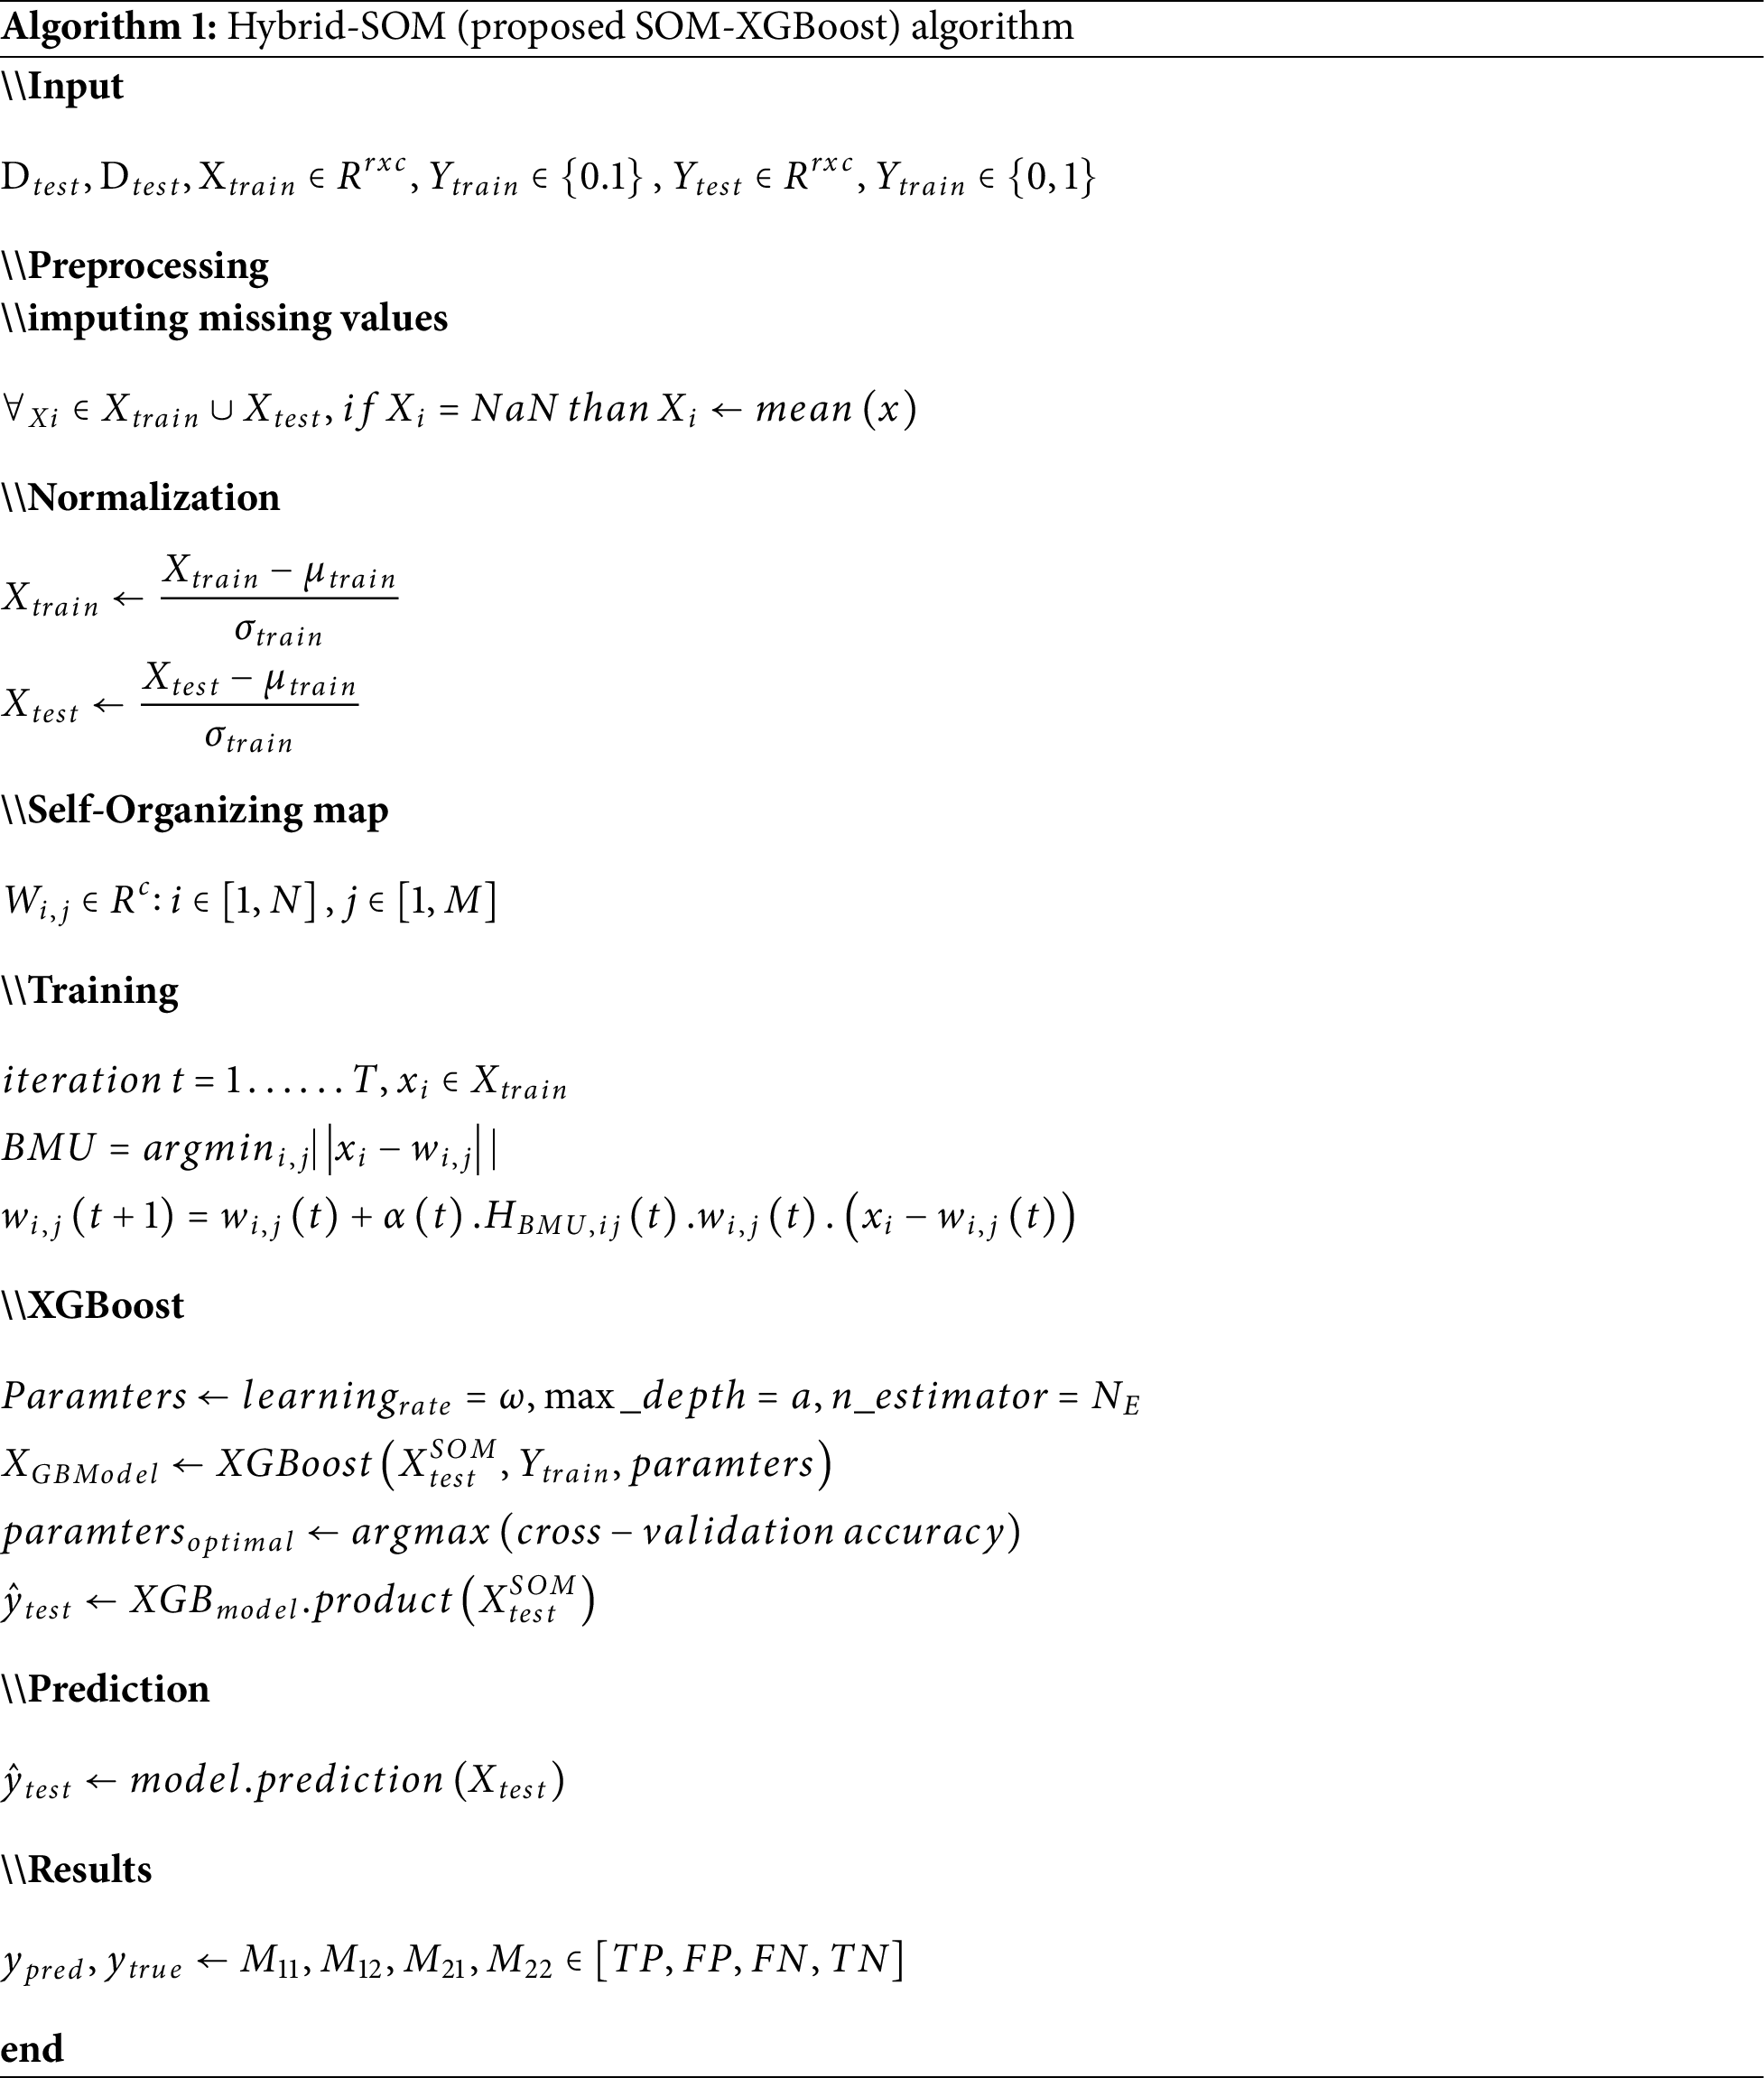
Algorithm 1 shows how SOM is integrated with XGBoost for efficient intrusion detection. It starts with data preprocessing, using the mean, inputting missing values, and using Z-score transformation, features are normalized. SOM is employed afterward for dimensionality reduction, preserving the topological relationships. The XGBoost classifier is now trained in the output provided by SOM, employing hyperparameters via cross-validation to enhance classification accuracy. The rained model then predicts intrusion labels for test data, and performance is measured using metrics like Accuracy, F1-score, Precision, and Recall. The above-mentioned pseudo algorithm sketches how the proposed approach works.
As discussed earlier, our dataset is imbalanced and unlabeled. So, while performing preprocessing, the data frame is label encoded, i.e., the last class in the dataset “outcome” is 0,1,2,3,4. The representation of Benign, probe, dos, r2l, and u2r classes is labeled as 0,1,2,3,4. This helps us do multiclass classification using MLP, a specific type of Artificial neural network. Conversion of categorical variables to dummy variables is essential so the model performance proves effective. Table 3 and Fig. 8 show the classification results.
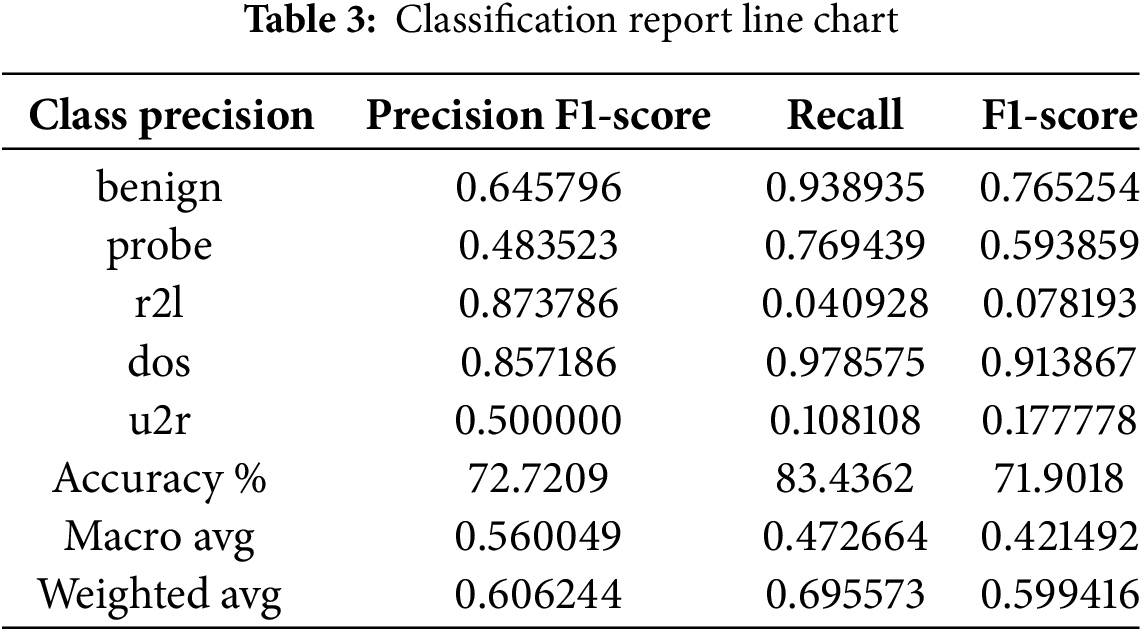
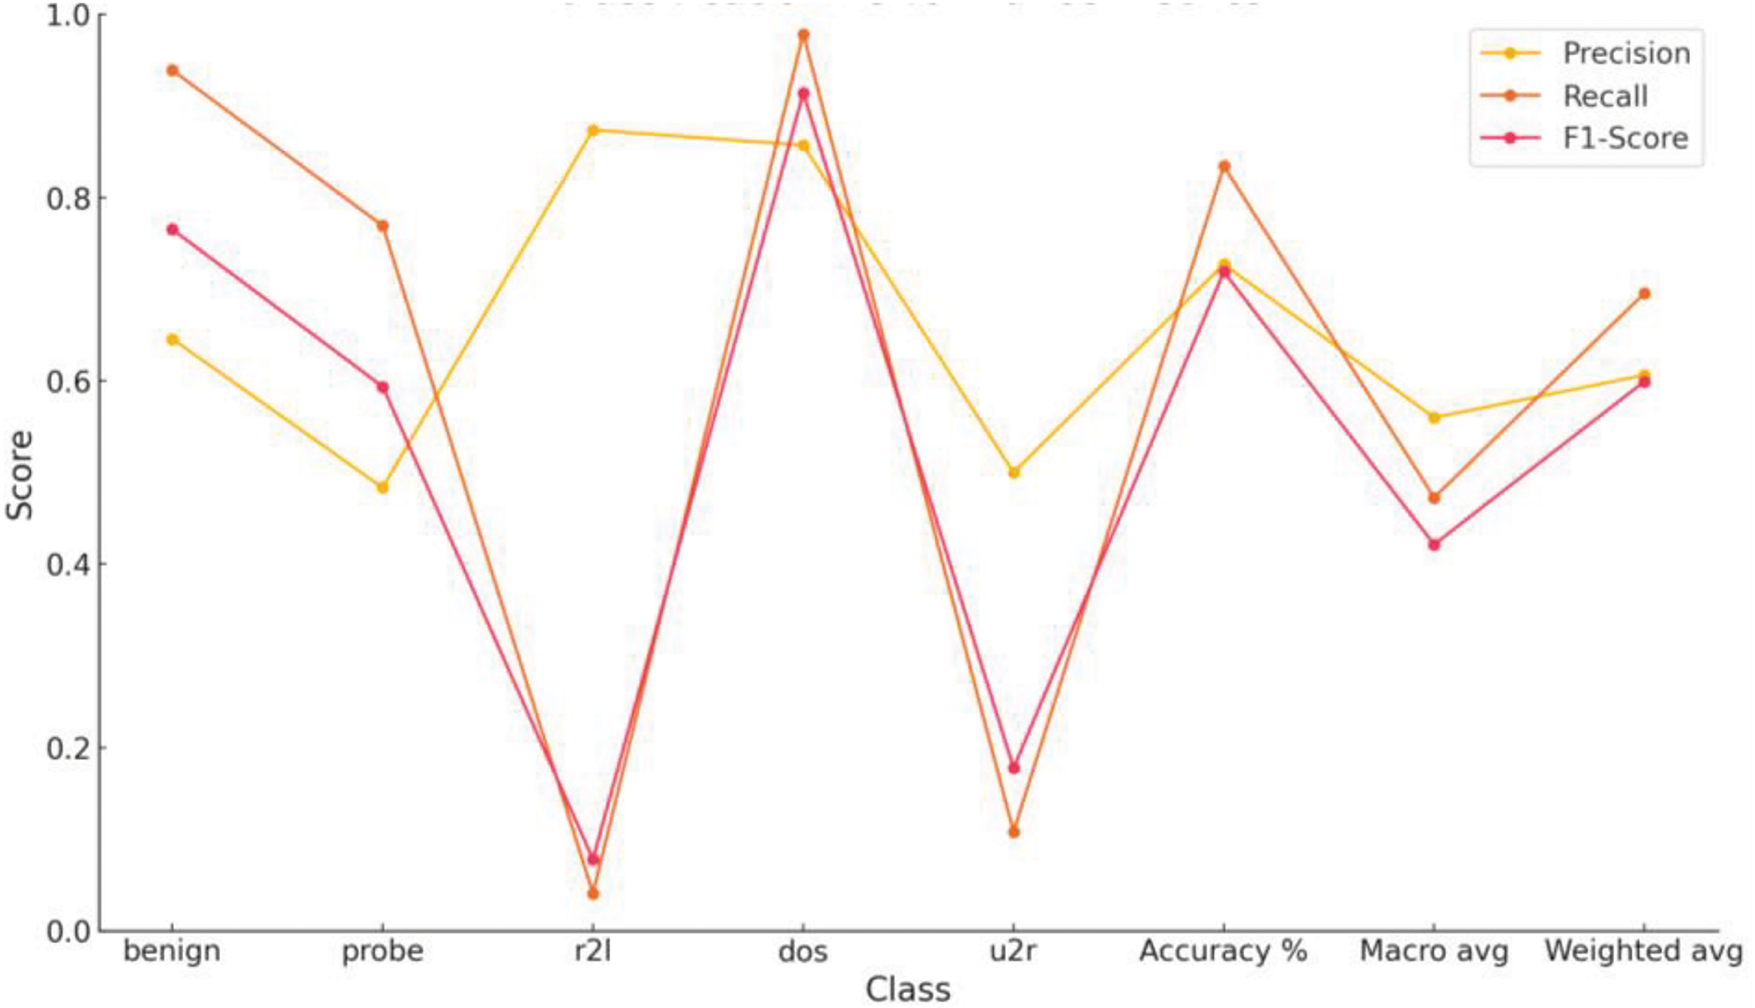
Figure 8: Performance metrics of MLP on NSL-KDD
As mentioned in the algorithmic procedure, hyper-parameters are parameters predefined within a particular machine learning algorithm while developing a model where no training has been done on the model. This contrasts the parameters learned from the data (like weights of neural networks). Hyperparameters need to be set by hand or found using some optimization approaches (grid search, random search, etc.). They relate to the model’s learning process and may affect its results.
While experimenting with the MLP model on the selected dataset, certain parameters are adjusted, as shown in Fig. 9 and the size of hidden layers is set to 50. Exploring the architecture of hidden layers shows one hidden layer with 50 neurons. For training the network, the number of epochs is 1000. Epochs determine how many times the model will run while training the dataset. The seed number is set to 42, which helps us ensure the model gives the same result every time the code is executed. The MLP classifier uses the ‘Adam’ optimizer for weight optimization. Table 3 and Fig. 8 show that r2l and u2r have inferior results other than that of traffic. This is due to fewer observations of these attack types in the dataset. MLP often shows inadequate results on marginalized classes because of biases towards major or larger classes.
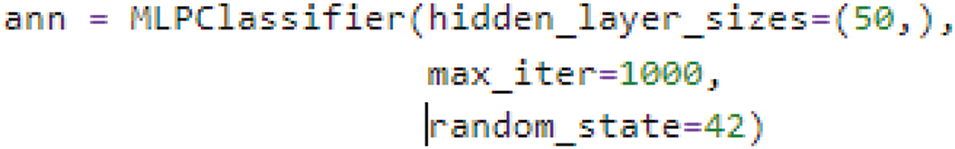
Figure 9: MLP parameters
The Hybrid SOM model is a sophisticated model with a self-organizing map algorithm as a dimensionality reduction with inherited capabilities of clustering tool and XGBoost as a classifier. The critical point for this model is the output or result of self-organizing mapping that becomes the input to the XGBoost algorithm. SOM grid is managed by the shape parameter, which employs the number of rows x and columns y. In the first case, 5 × 5 node shapes are tuned. As shown in Fig. 10, the Self-Organizing Map (SOM) is trained on the preprocessed data to incorporate clustering attributes for each data point.
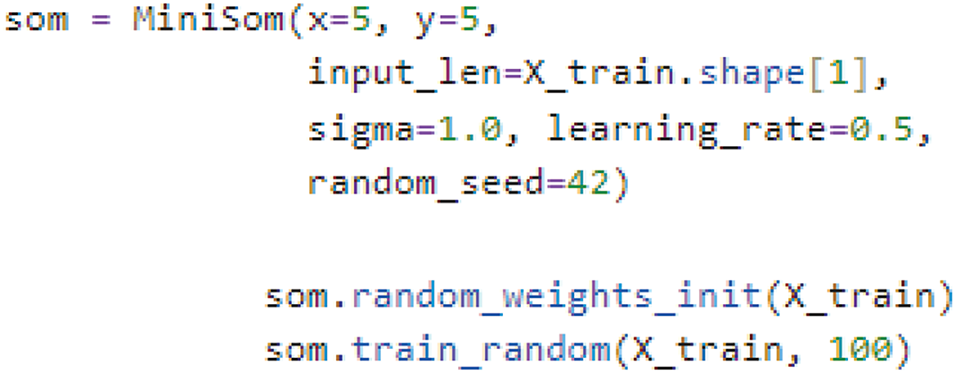
Figure 10: SOM parameters
The XGBoost classifier is trained to employ features derived from the original dataset and the SOM clusters. The smallest distance decides BMU between input nodes and weighted nodes. Table 4 and Fig. 11 shows the proposed hybrid SOM model results for 5 × 5 node configuration.
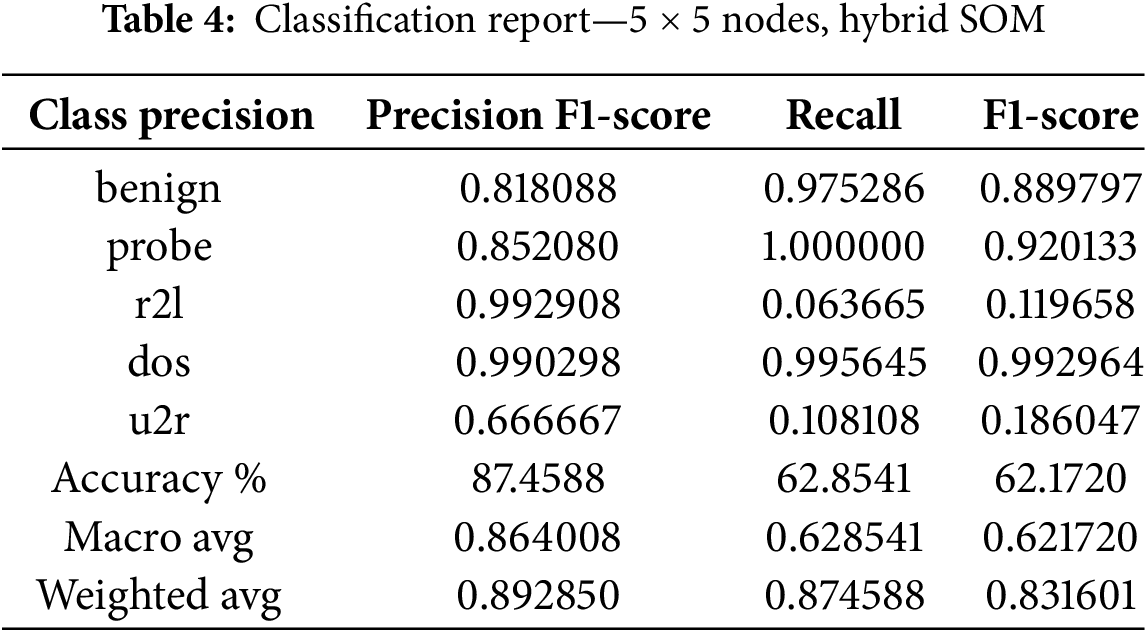
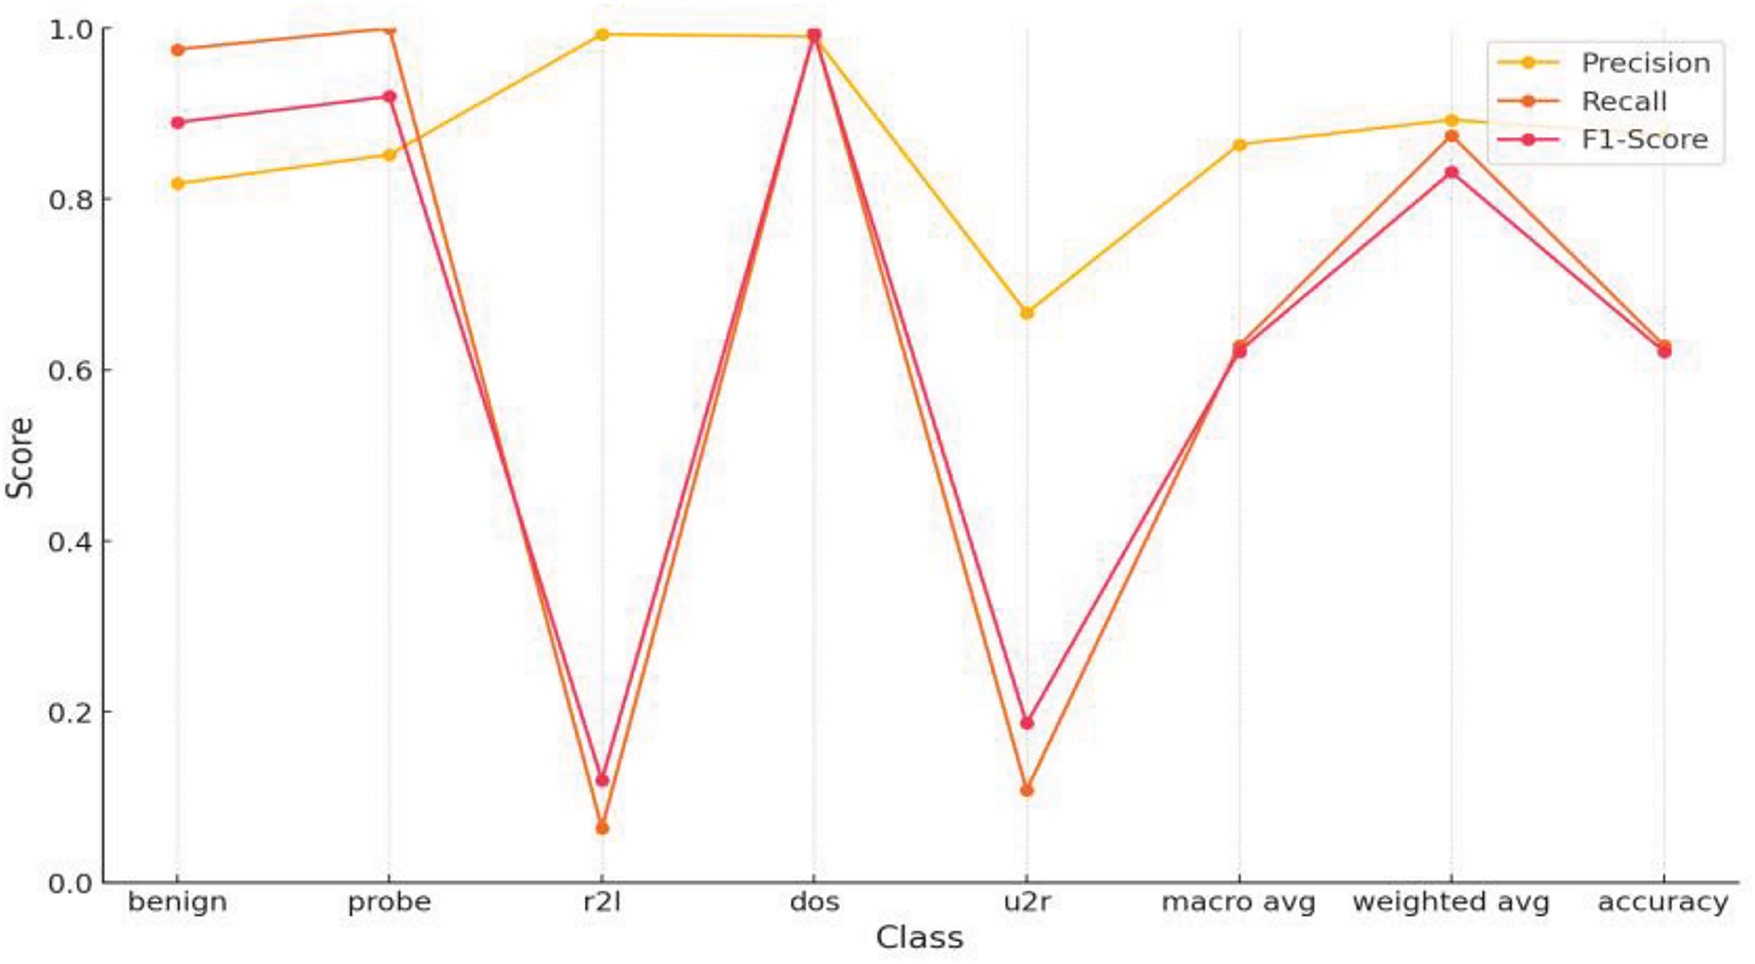
Figure 11: Performance metrics of hybrid SOM, 5 × 5 node shape on NSL-KDD
The second case portrays a 10 × 10 node shape. In this case, all parameters are the same, just the SOM nodes are increased. The learning rate is 0.5, the sigma has a value of 1.0, and the seed value implies 42. We can observe that, with increasing numbers of nodes, light decremental behavior appears. If this behavior persists, it can lead to a significant loss in intrusion detection. The hybrid SOM results are shown in Table 5.
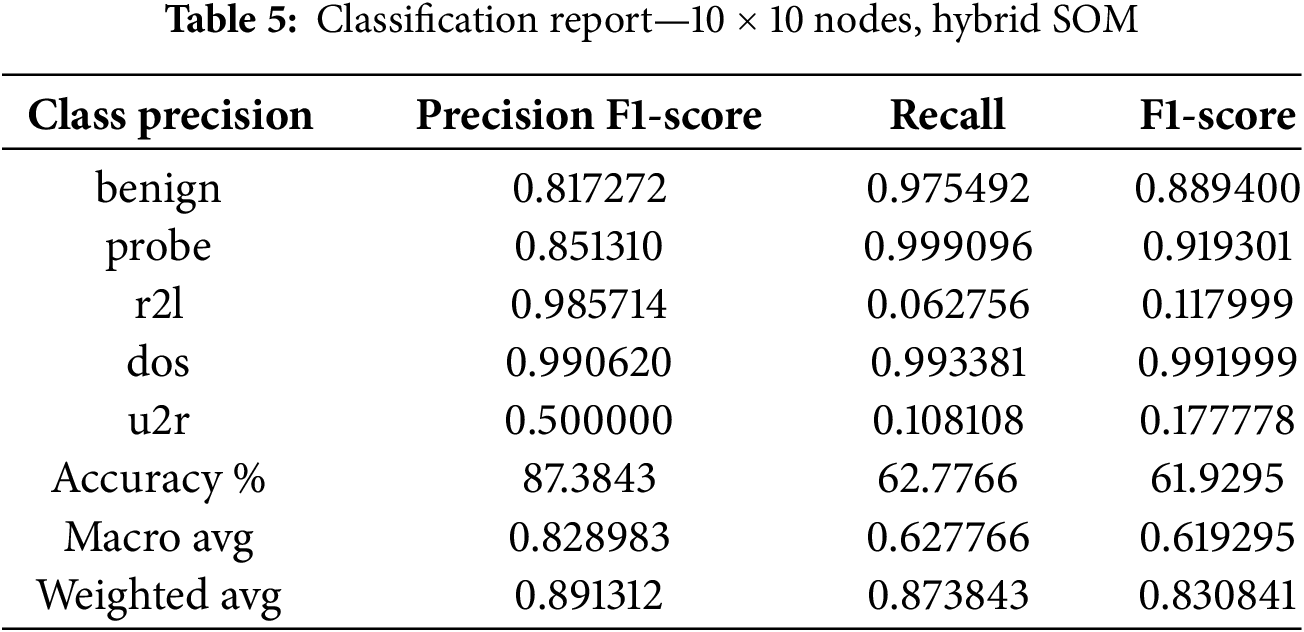
We can see that the results in Table 4 are considerably better than those in Table 3. Across all areas, the Hybrid SOM model is outclassing the MLP Model. It is observable that for benign, probe, and dos class, precision, recall, and F1-scores increase by 10%–30%. Derivatively, the F1-score of dos, probes, and benign classes improved by 7.91%, 32.62%, and 12.45%, respectively. A good margin improves the hybrid SOM model’s overall performance as accuracy increased by 14.74% compared to the MLP model. Taking about the macro average, it is evident that precision increased by 30.40%, while recall and F1-score jumped up by 15.58% and 20.02%. Due to the imbalanced nature of the dataset, the weighted average should also be considered. Under the banner of the weighted average evaluation metric, it shows better results than the MLP Model. Improvement in the F1-score in weighted average symbolizes that the Hybrid SOM model maintains a better balance between recall and precision regarding the number of observations per class.
The recall result of the U2R class established that it is a difficult challenge for both models due to their almost identical values. The point is that Hybrid SOM performs better than the Benchmark MLP Model. However, every technique comes with some hurdles that need to be improved in the future by adjusting and altering the approach. Tables 4 and 5 decrypt the result of the Hybrid SOM model with input-output nodes of 5 × 5 and 10 × 10. Fig. 12 illustrates Table 5 for user convenience that how changing the grid size effects the evaluations. Keeping in mind that increasing the number of node shapes increases complexity. When the number of input-output nodes increases over the desired threshold, it starts capturing minor details and noise that are not desired in training. In intrusion detection architectures, where it is necessary to capture intrusion and atypical traffic patterns, granularity elevation leads to failure. Data mapping to the ideal BMU becomes more complex with an increasing number of SOM nodes. This may cause poor clustering, degrading the model’s overall performance. K-NN provides the results (configuration of 5 × 5 node shape) mentioned in Table 6.
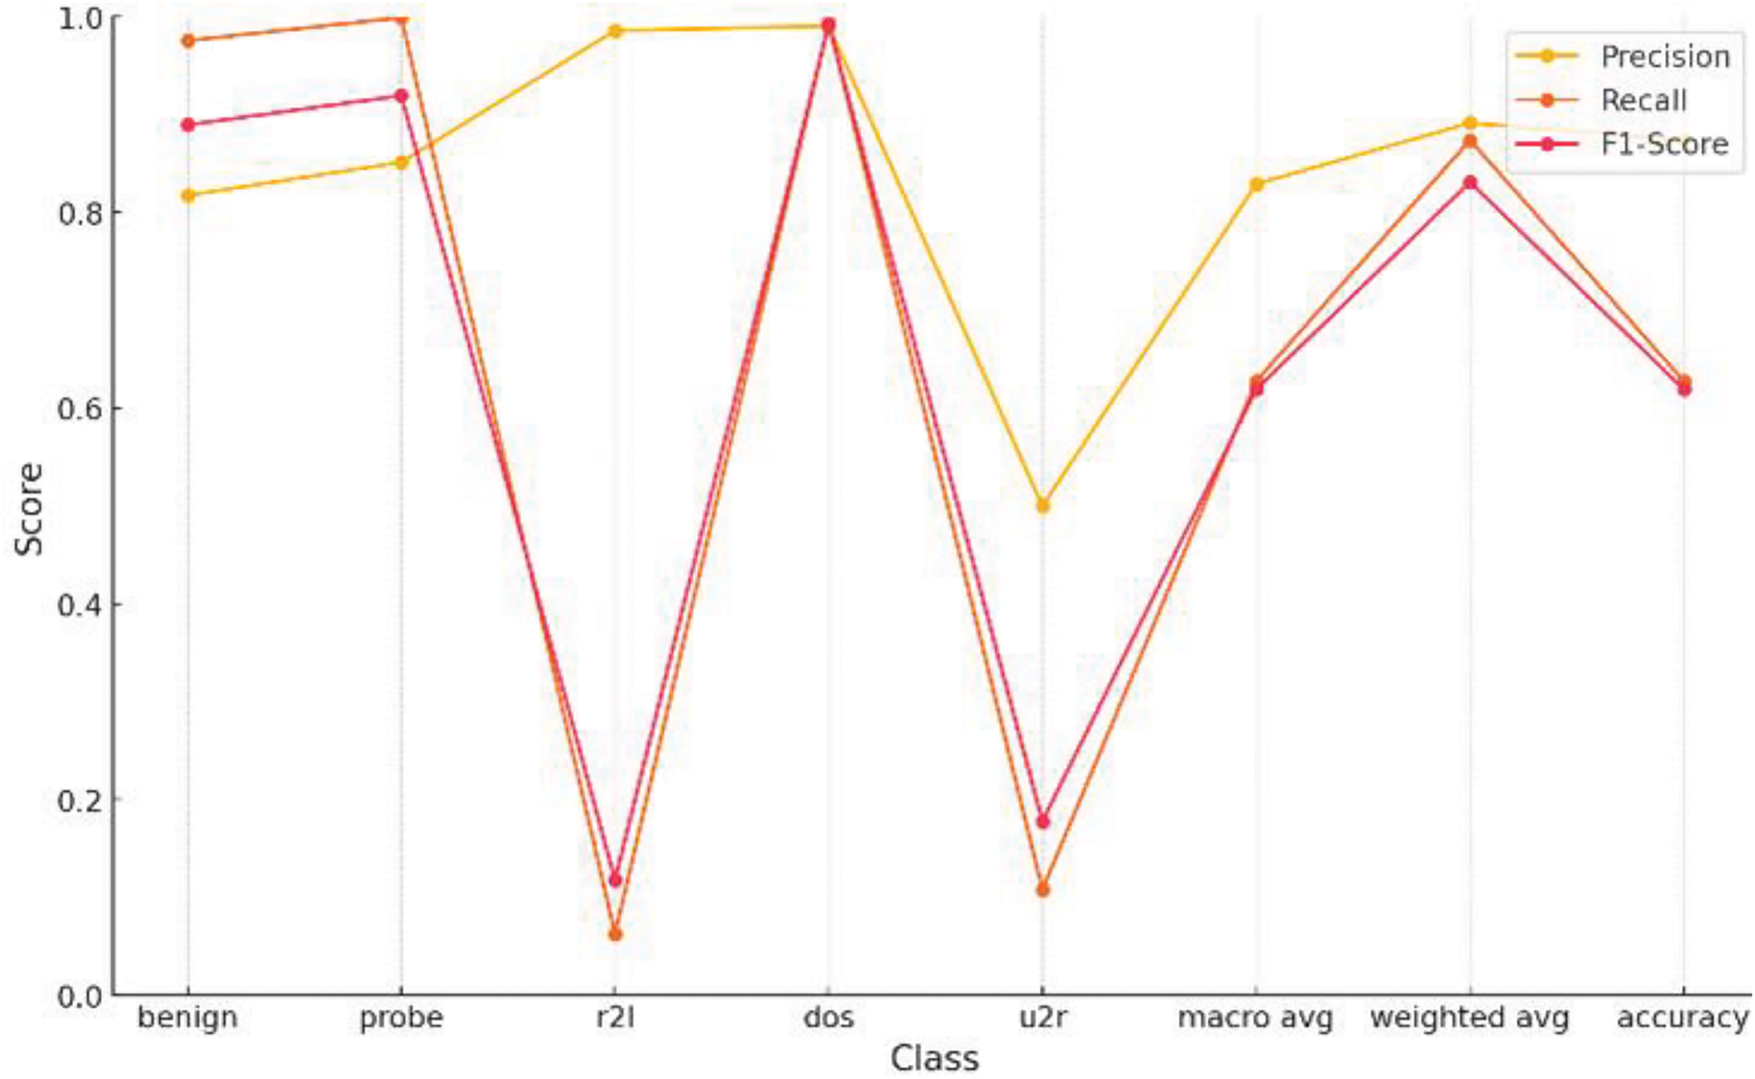
Figure 12: Performance metrics of hybrid SOM, 10 × 10 node shape on NSL-KDD
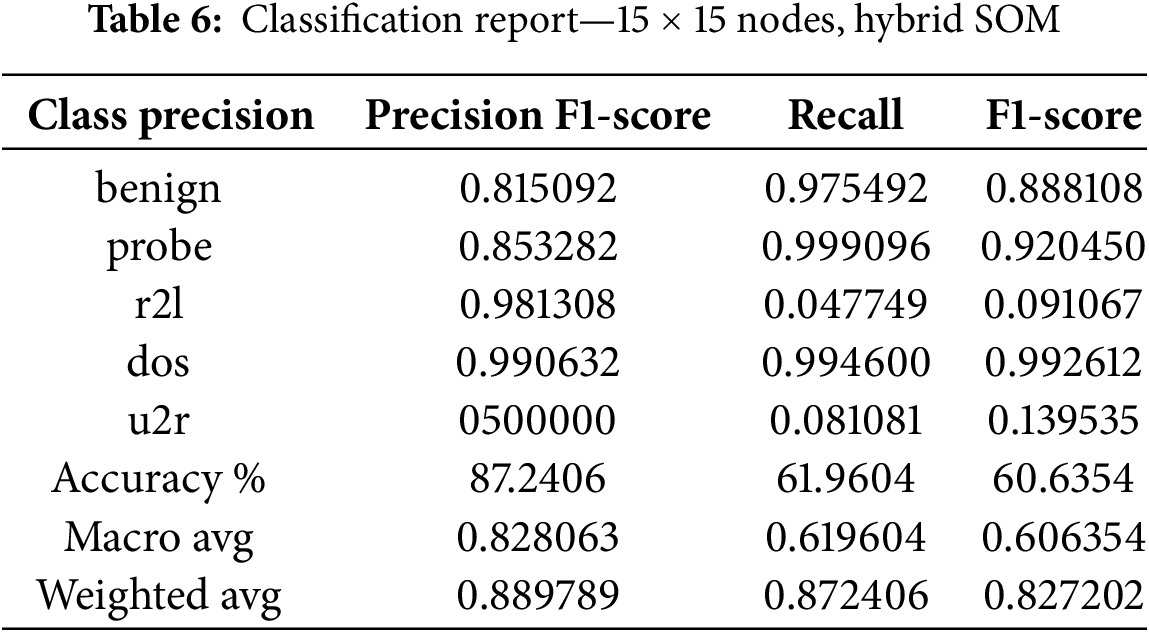
Fig. 13 shows performance metrice for hybrid SOM. The increasing number of SOM nodes shows an observable difference between precision, recall, and F1-score. Hence, implementations with 10 × 10 nodes degrade performance. Precision downgrades by 2.66%, recall downgrades by 0.08%, and F1-score downgrades by 0.22%. Implementing a 5 × 5 node shape in Hybrid SOM and XGBoost is the appropriate way to detect intrusion in network traffic. We have continued to increase the number of nodes to 15. Shifting the nodes to a higher number causes a change in performance. There is a significant loss in rare classes of u2r and r2l. Although we don’t focus much on these classes, the point is to be established here that dimensionality gain causes degradation of performance in our case by 44.34%. The precision of the classes is not high, but it makes a significant difference. Dimensionality gain, in a sense, is just generating more overhead and is more time-consuming.
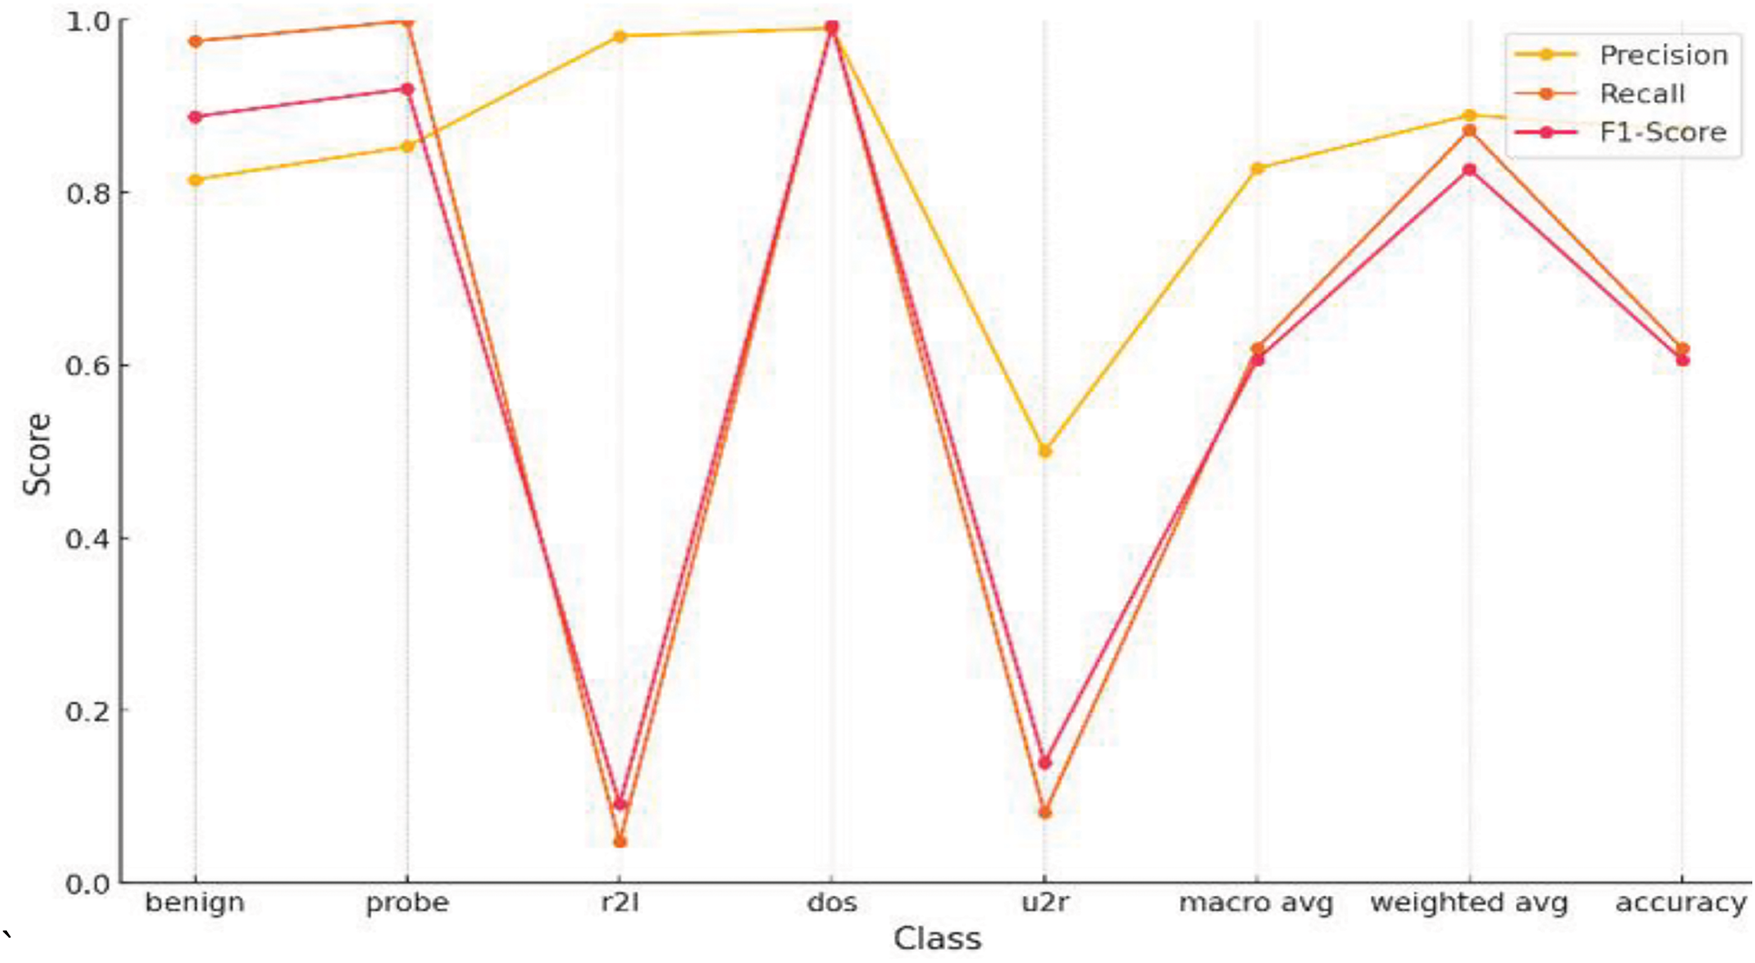
Figure 13: Performance metrics of hybrid SOM, 15 × 15 node shape on NSL-KDD
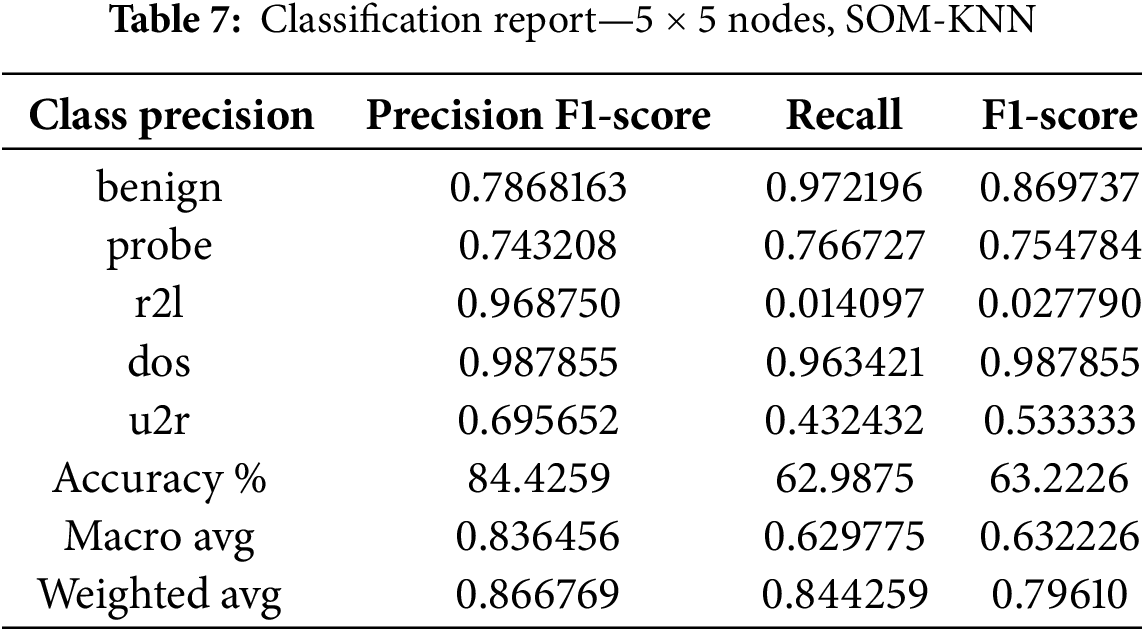
The K-nearest neighbor algorithm is one of the most prominent algorithms for classification purposes. It is also considered for intrusion detection when evaluating an MLP model. Following the same parameters. Figs. 14–16 correspond to the visualization of parameter shifting of SOM (increasing number of nodes) effects on the evaluation metrics when it is integrated with the k-nearest neighbor technique. Table 7 indicates the precision, recall and F1-score with different classes.
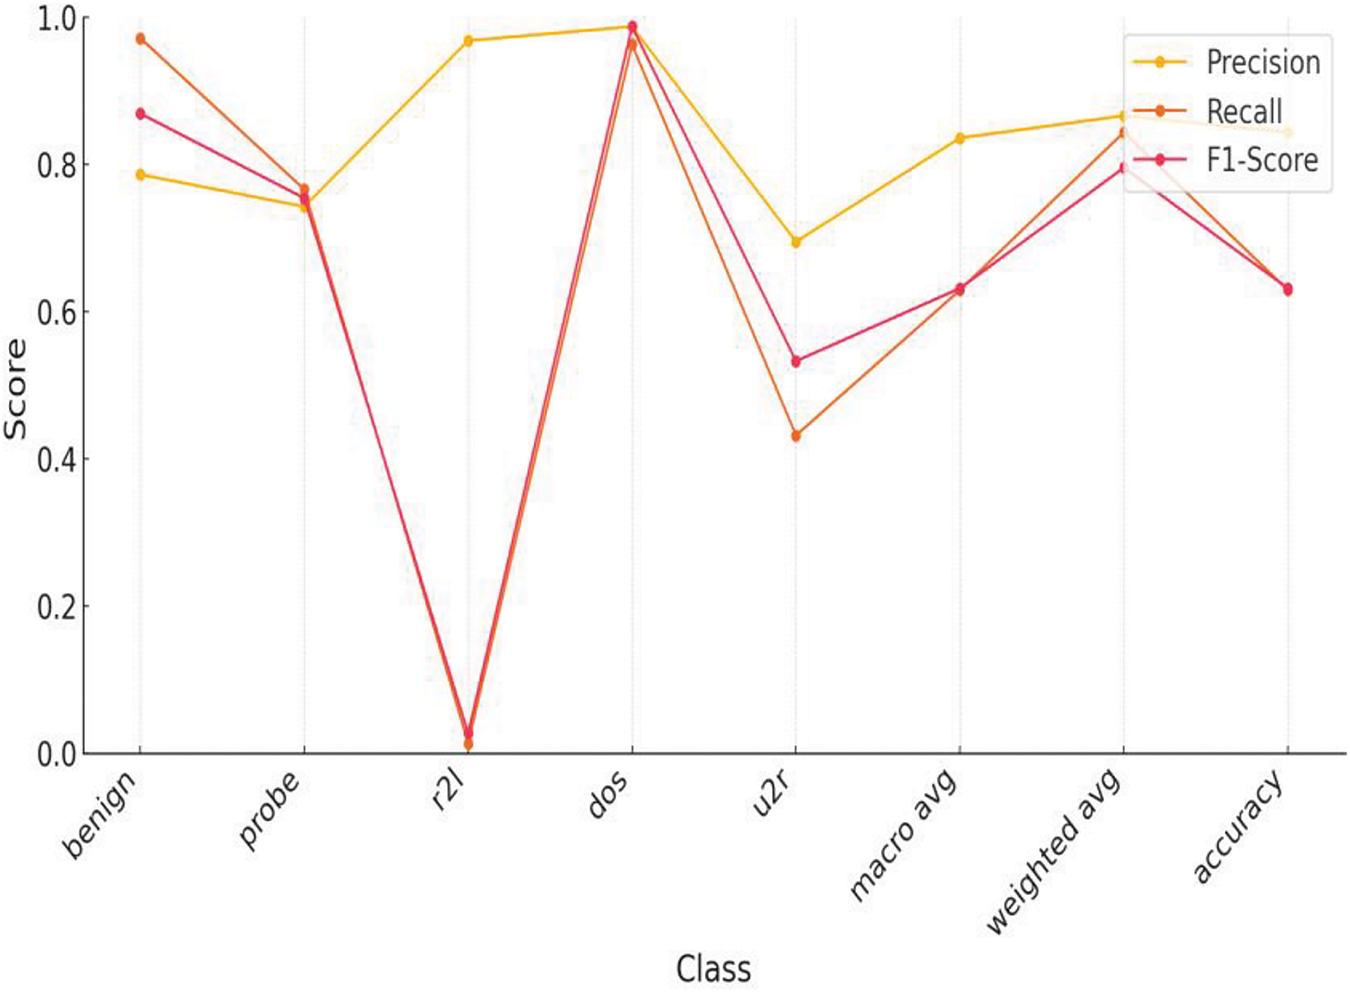
Figure 14: Performance metrics of SOM-KNN, 5 × 5 node shape on NSL-KDD
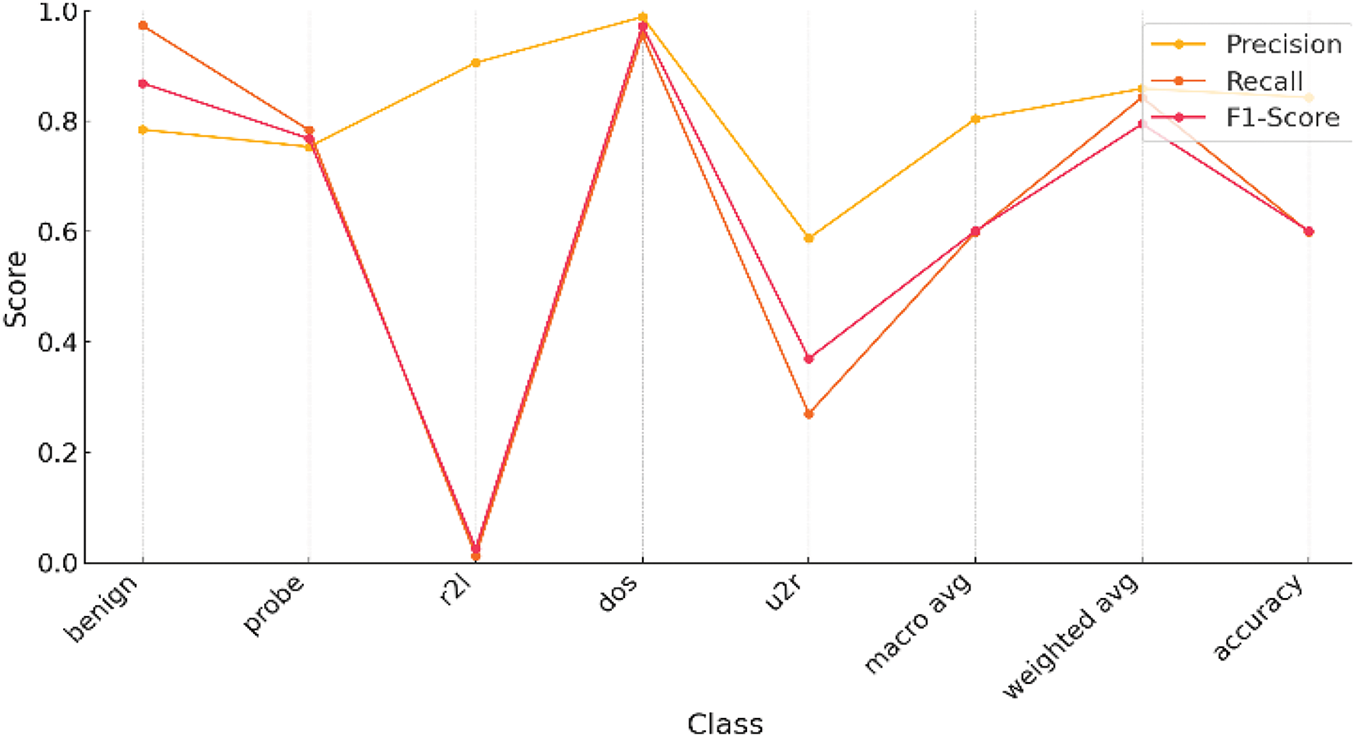
Figure 15: Performance metrics of SOM-KNN, 10 × 10 node shape on NSL-KDD
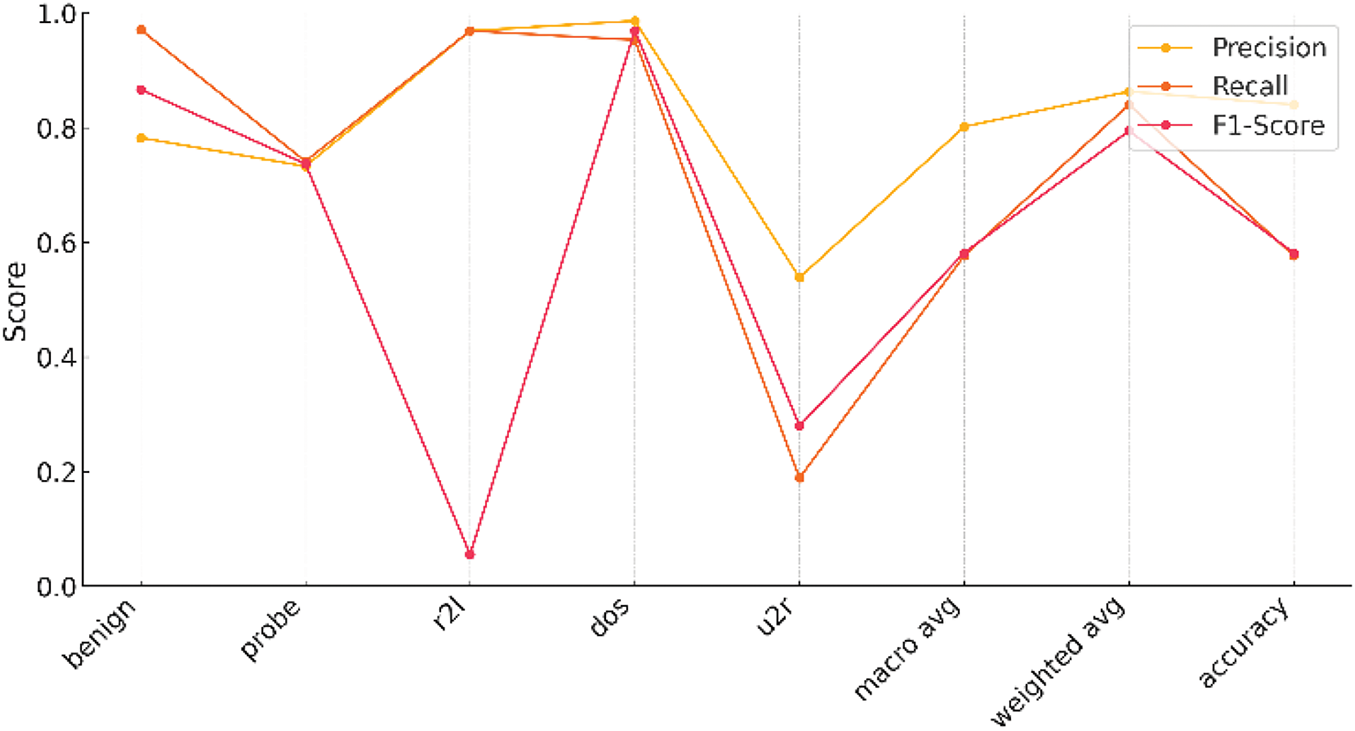
Figure 16: Performance metrics of SOM-KNN, 15 × 15 node shape on NSL-KDD
While comparing the performance of SOM-KNN and SOM-XGBoost models, we notice that the Hybrid SOM (SOM-XGBoost) performs better. We see significant differences in the results of Tables 4 and 6. SOM-KNN model performance is degraded by 6.39%, 52.65%, 157.04%, and 3.99% in benign, probe, r2l, and dos classes, respectively. As we increase the number of nodes to 10 × 10, our proposed Hybrid SOM model persists with better performance. Let’s dive into the comparison by first placing SOM-KNN with 10 × 10 node results.
Table 8 reveals the results with different classes. Table 9 represents the results of the 15 × 15 node shape in the Som-KNN model, as we already know that we are testing our model with three different node shape types for a better understanding of the model behavior.
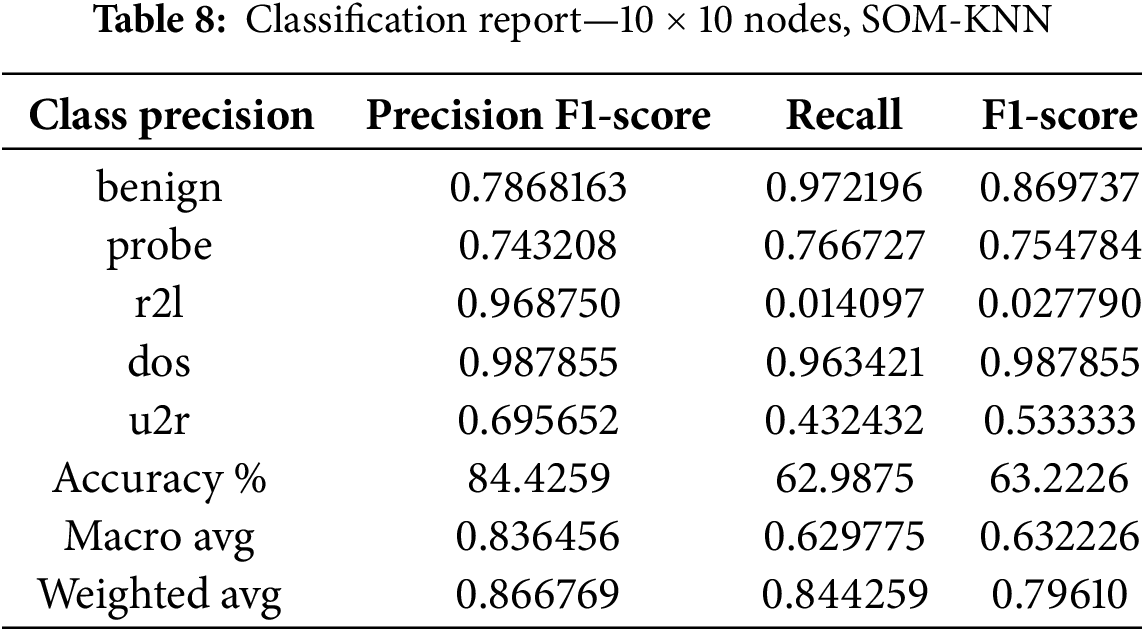
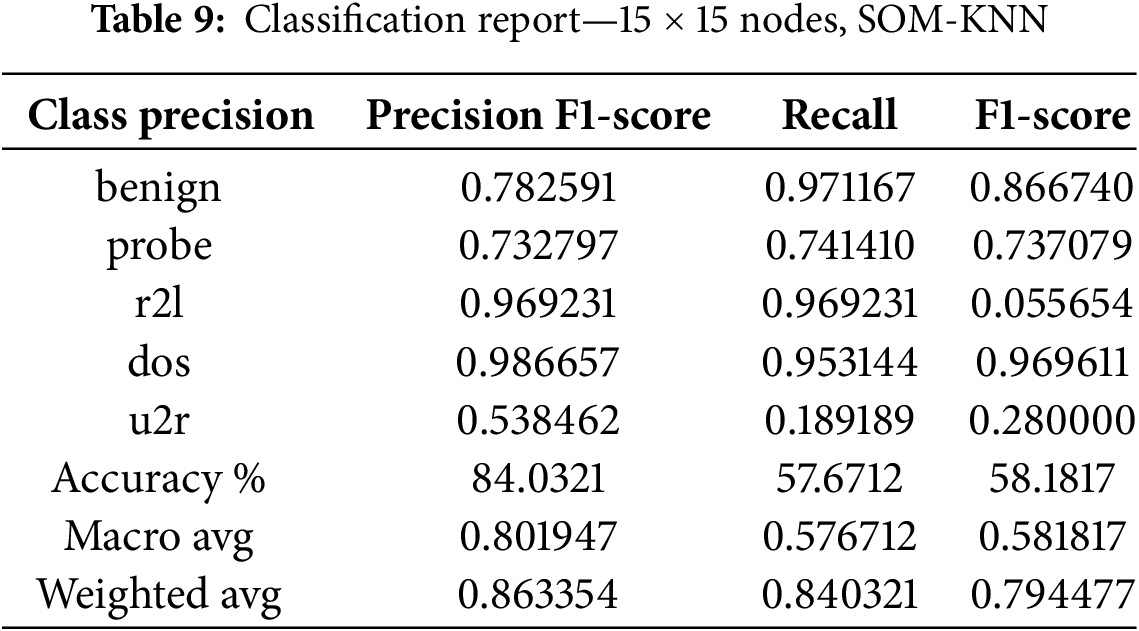
Digging into Tables 5 and 7 results, we see that SOM-XGBoost performs better than SOM-KNN across most classes. The hybrid SOM model leads by 3.6% and establishes robust performance. u2r is the class, as discussed earlier, that is better with SOM-KNN. We establish that reducing the dimensionality of the self-organizing maps leads to better results in anomaly detection. To put a mark on this argument, we increase dimensionality to 15 × 15, and Table 8 decrypts the results.
If we analyze Tables 7 and 8 closely, the 10 × 10 Node shape on NSL-KDD performs better. The 15 × 15 node shape’s accuracy downgrades by 0.37%, whereas other metrics are also degraded.
CPU usage is essential as a performance measure parameter in a multi-tenant environment. As an indicator of system load, it decrypts how much the process is resource intensive, which leads to an assessment of under or over-utilization of the system. Performance optimization is also done by monitoring CPU usage, which helps identify bottlenecks and insufficiencies. Monitoring CPU usage trends can help predict potential system failures or overloads before they occur. Sudden spikes or sustained high usage can be an early warning sign of performance degradation, prompting preemptive action to maintain system stability.
Our proposed Hybrid SOM (SOM-XGBoost) model also improves CPU efficiency. Throughout the building of different cases of nodes, dimensionality reduction leads to the efficient usage of resources. An increase in the dimensionality of SOM causes the process to become more resource-intensive and have higher computational complexity. Fig. 13 compares all cases (Nodes shape with 5 × 5, 10 × 10, and 15 × 15). There is a tradeoff scenario in machine learning that larger SOM grids cause the model’s complexity. The stability in preprocessing and XGBoost processing time shows SOM grid size only affects the SOM processing stage. Fig. 17 shows that 5 × 5 arrangement of our proposed Hybrid SOM model is the fastest and CPU-lightest, making it ideal for fast processing. At the same time, the 15 × 15 configuration gives more comprehensive mapping but uses more resources.
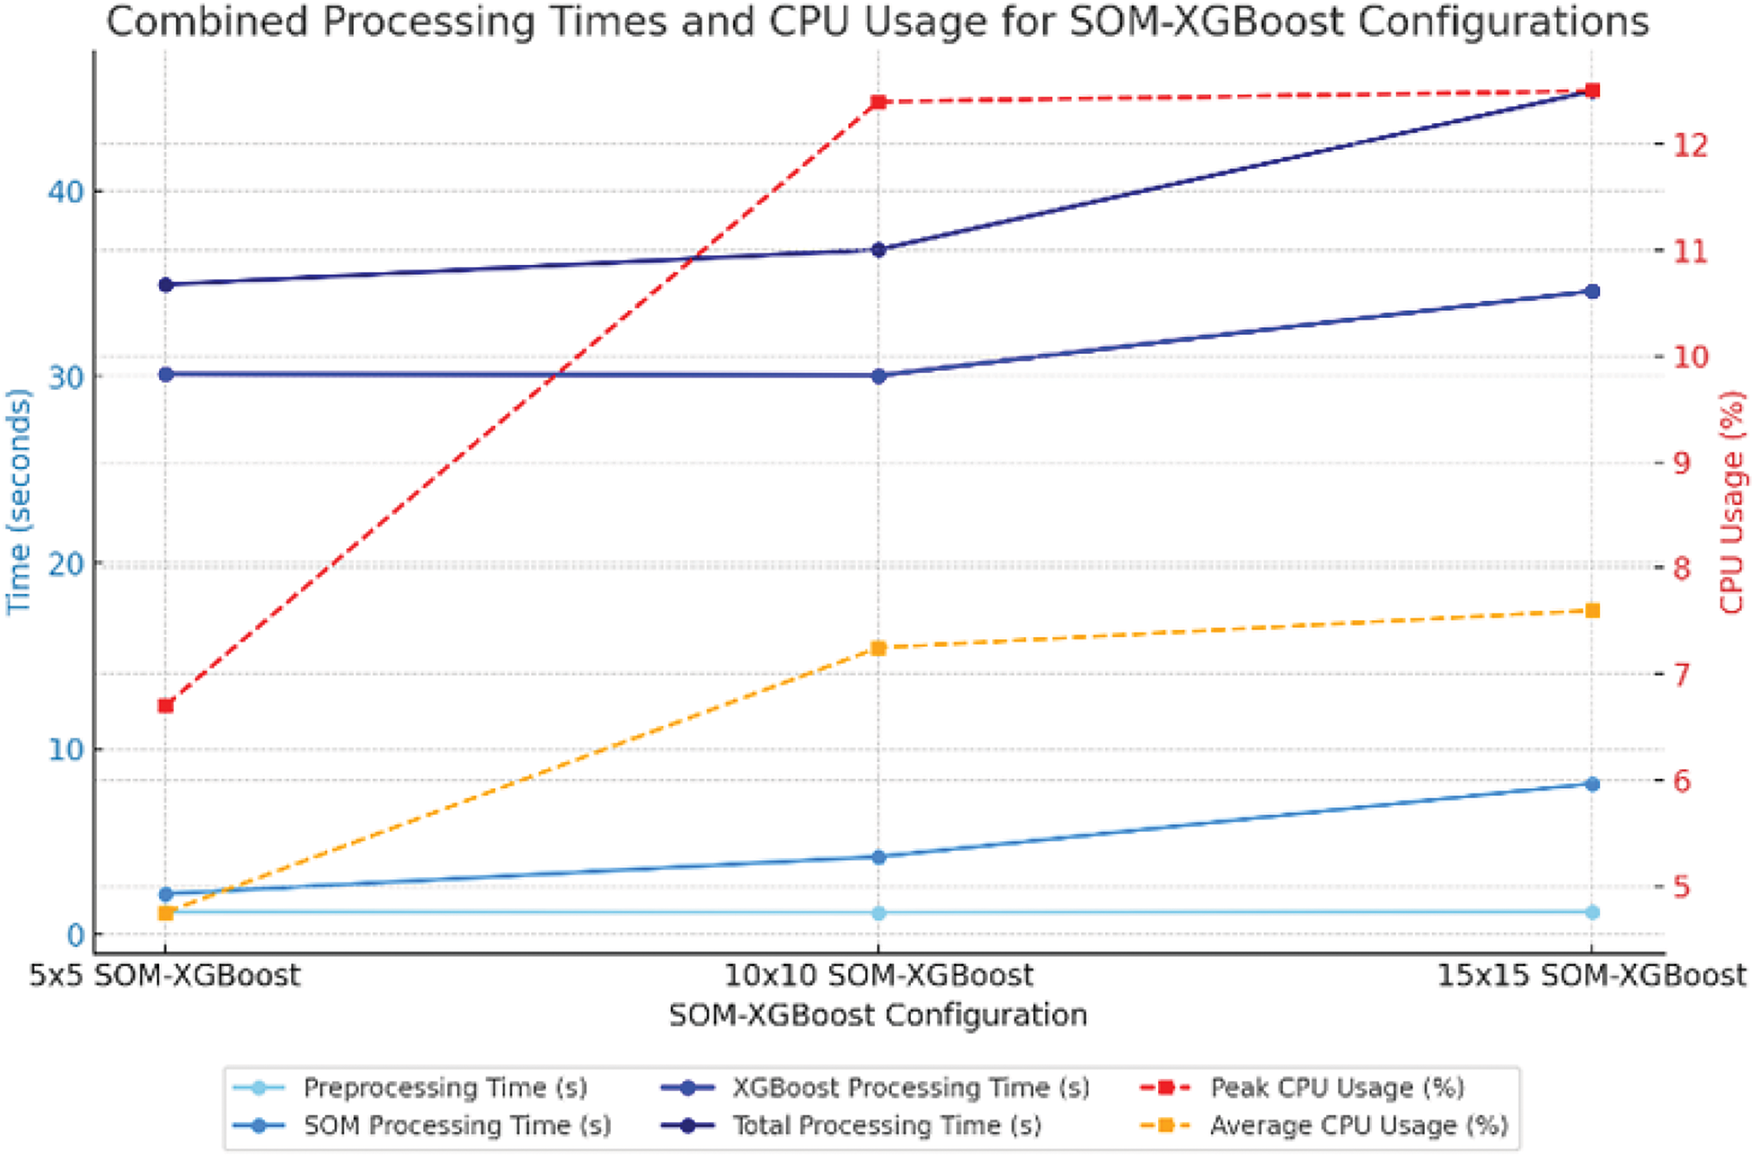
Figure 17: CPU usage and time measurement—hybrid SOM
Moving toward the K-nearest neighbor classifier, there is a difference in the resultant values. Fig. 18 shows how values vary due to classifier changes. When the SOM grid size goes from 5 × 5 to 15 × 15, overall processing time slowly increases, mainly owing to SOM processing time. In contrast, KNN processing time remains nearly constant—the 5 × 5 layout processes fastest at 93.34 s, followed by 10 × 10 at 95.81 and 15 × 15 node shape at 97.14. However, larger SOM grids dramatically reduce CPU use. Peak CPU usage drops from 21.6% in 5 × 5 node shape to 0.4% in 15 × 15, indicating reduced computational intensity with grid size. This illustrates that a larger grid takes longer to process but uses less CPU, which may help systems with limited CPU power.
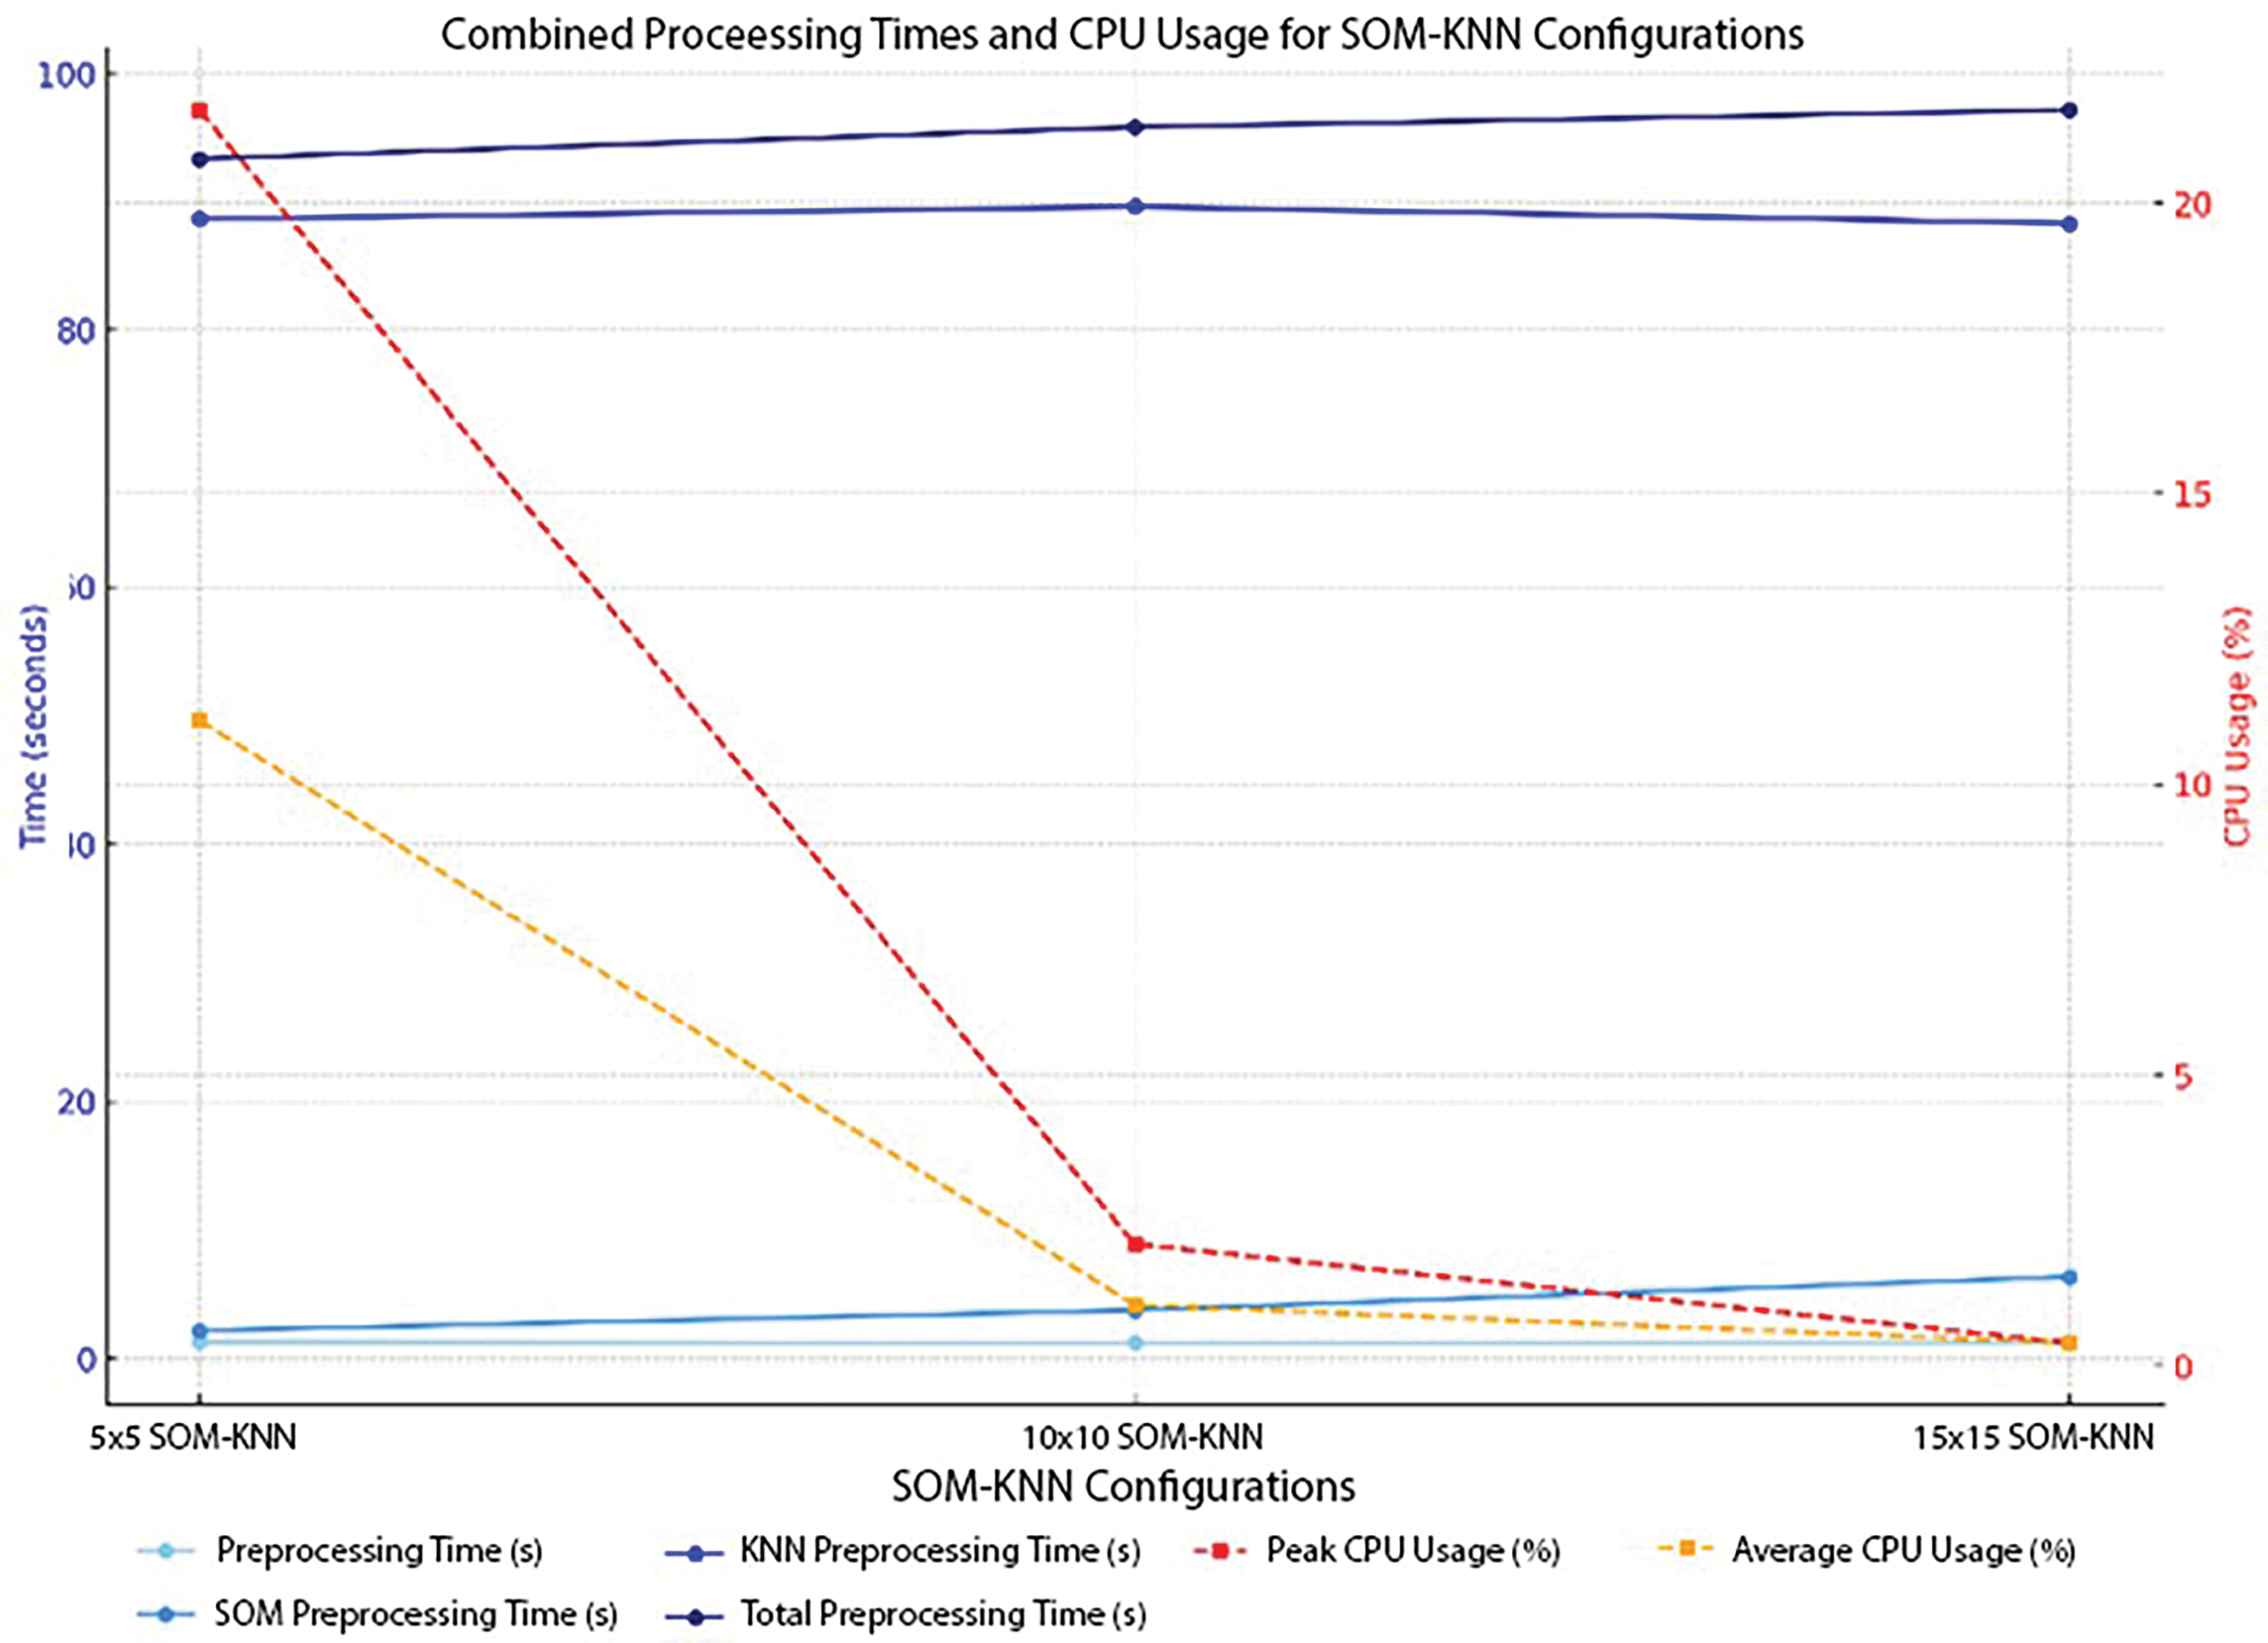
Figure 18: CPU usage and time measurement—SOM-KNN
The Multilayer Perceptron model is used as a benchmark model for intrusion detection. We also calculate CPU usage and time measurements. Fig. 19 shows its CPU usage and time measurement performance values. Fig. 19 shows how the MLP model behaves regarding processing time and CPU utilization on NSL-KDD. The Processing Time (blue line) shows that Training takes 46.32 s and Preprocessing 0.40 s, for a Total Time of 47.51 s. The task’s CPU Usage (orange line) is at a peak and average of 6.0%, indicating a light computational demand. Training is the most time-consuming activity, yet CPU resources are underutilized, indicating capacity for additional activities or processing changes.
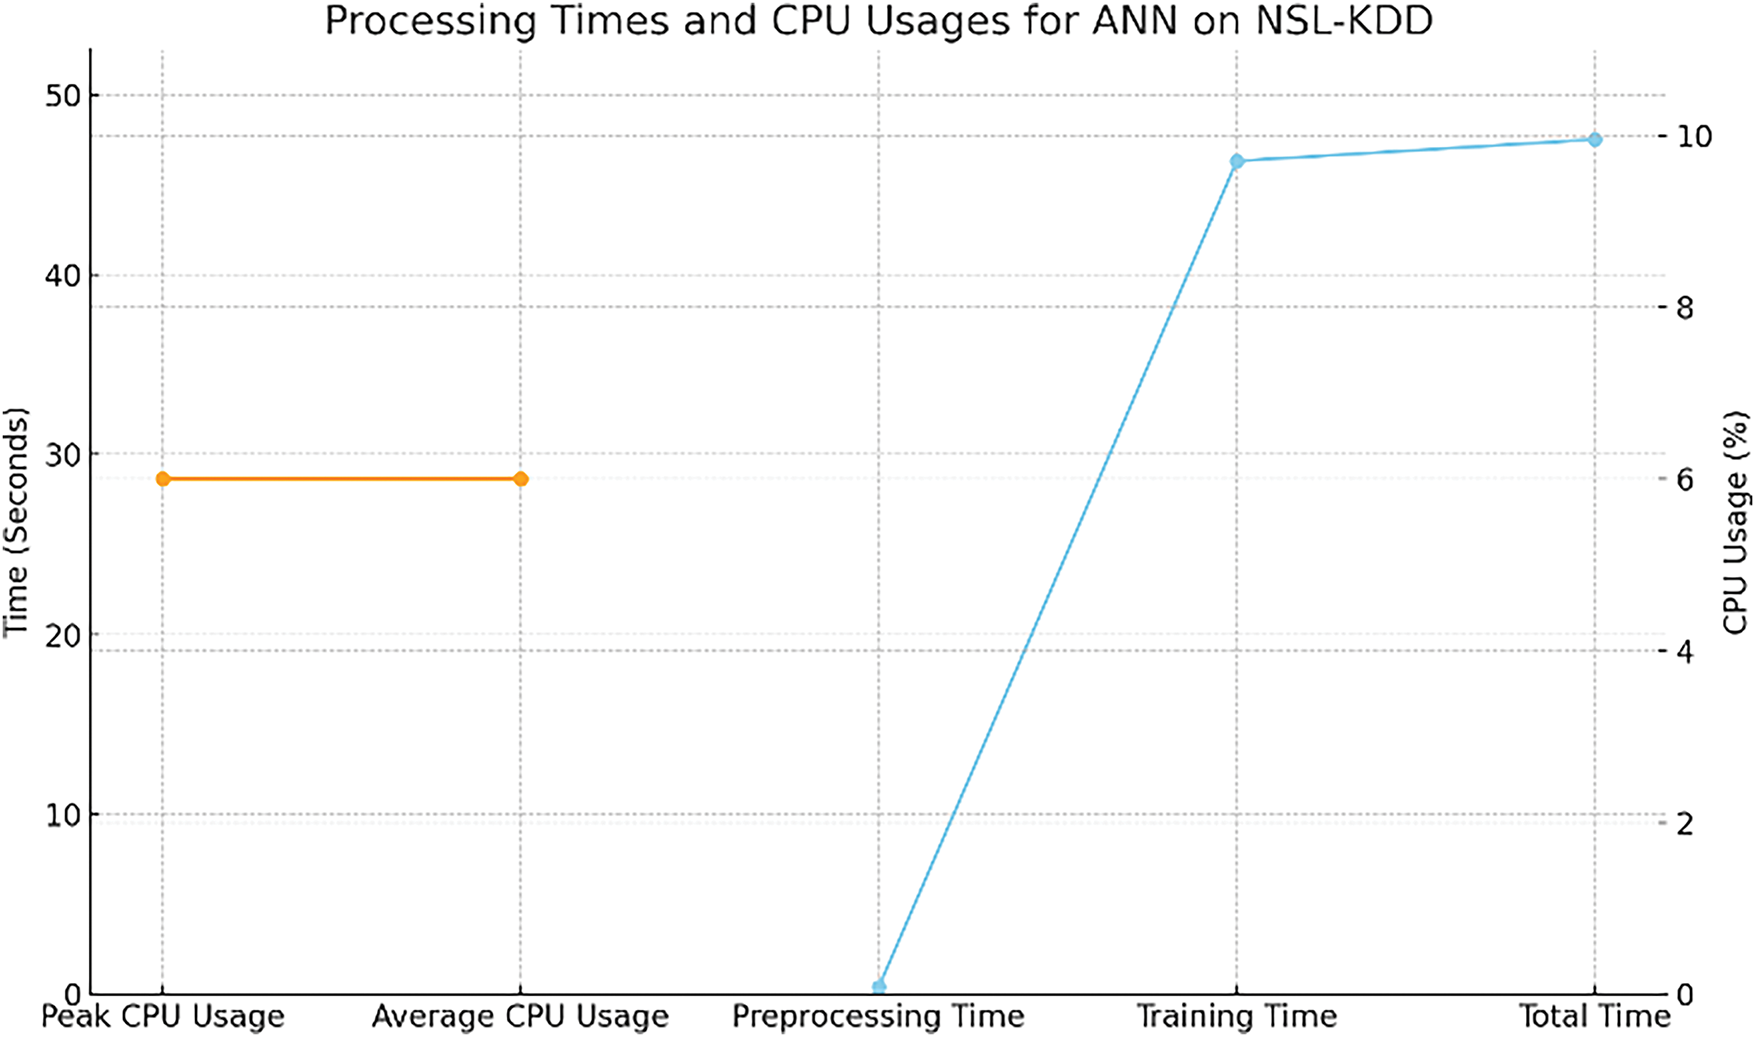
Figure 19: CPU usage and time measurement—MLP
Three distinct models are discussed throughout our paper. Regarding their comparison in terms of visualization, the solid light golden line represents MLP preprocessing time. SOM-KNN shows increasing efficiency with larger configurations (node shapes), reducing both total processing time (from 100 to 80 s) and CPU usage (peak CPU drops from 100% to 10%, average CPU from 40% to 1%). In contrast, MLP on NSL-KDD shows moderate processing time (50 s) with sustained average CPU usage (30%) concentrated in training. On the other hand, SOM-XGBoost loses efficiency as configurations increase; its average CPU consumption increases from 5% to 8%, its peak CPU usage increases from 10% to 12%, and its total processing time increases from 35 to 45 s, suggesting that it requires more resources with larger configurations. This implies that SOM-KNN is the best option for scaling efficiency. At the same time, SOM-XGBoost offers a trade-off between resource consumption and performance, with a rising computational cost as configurations grow.
A drastic change in computational cost with increasing node shapes in the KNN and XGBoost model shows how workload distribution works. This scalability in SOM-KNN means that larger setups enable the algorithm to handle input in optimal chunks or parallel, reducing the amount of time and CPU burden. On the other hand, SOM-XGBoost exhibits a rise in computational cost with more significant configurations because the XGBoost component becomes more sophisticated with increasing configuration size, necessitating more gradient boosting rounds, which increases processing time and CPU consumption. Because more significant SOM-XGBoost configurations seek to improve model accuracy at the expense of higher resource consumption, this increase in complexity results in a more significant computational burden. Fig. 20 decrypts all the above discussion in visual form.
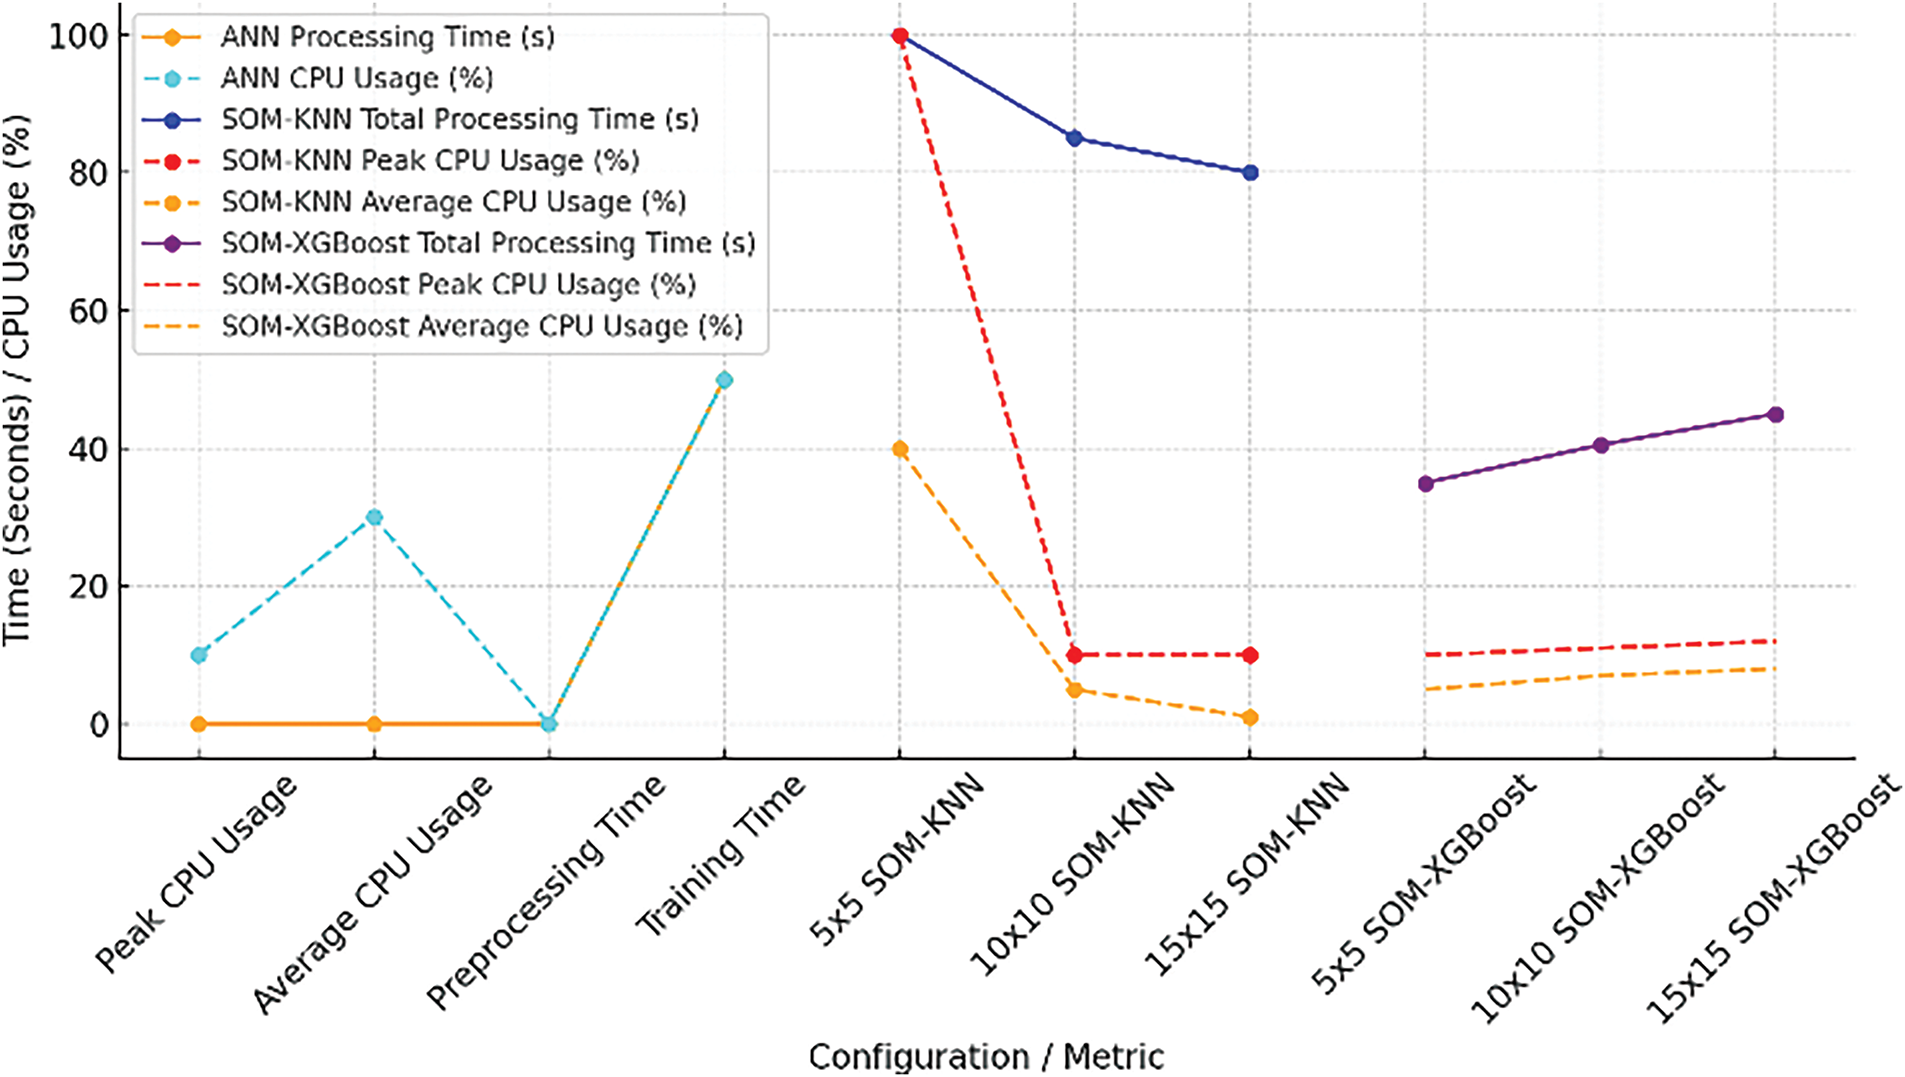
Figure 20: Combined CPU usage and processing times
As we know, when dealing with a dataset of imbalance type, F1-score plays a crucial role in evaluation. Upcoming graphs show how F1-scores relate to different models. Fig. 21 shows that SOM-KNN (5 × 5, 10 × 10, and 15 × 15) performs better in most classes than the MLP model. The SOM-KNN 5 × 5 model’s superiority in anomaly identification is demonstrated by its significantly higher F1-scores in crucial categories like DOS and U2R.
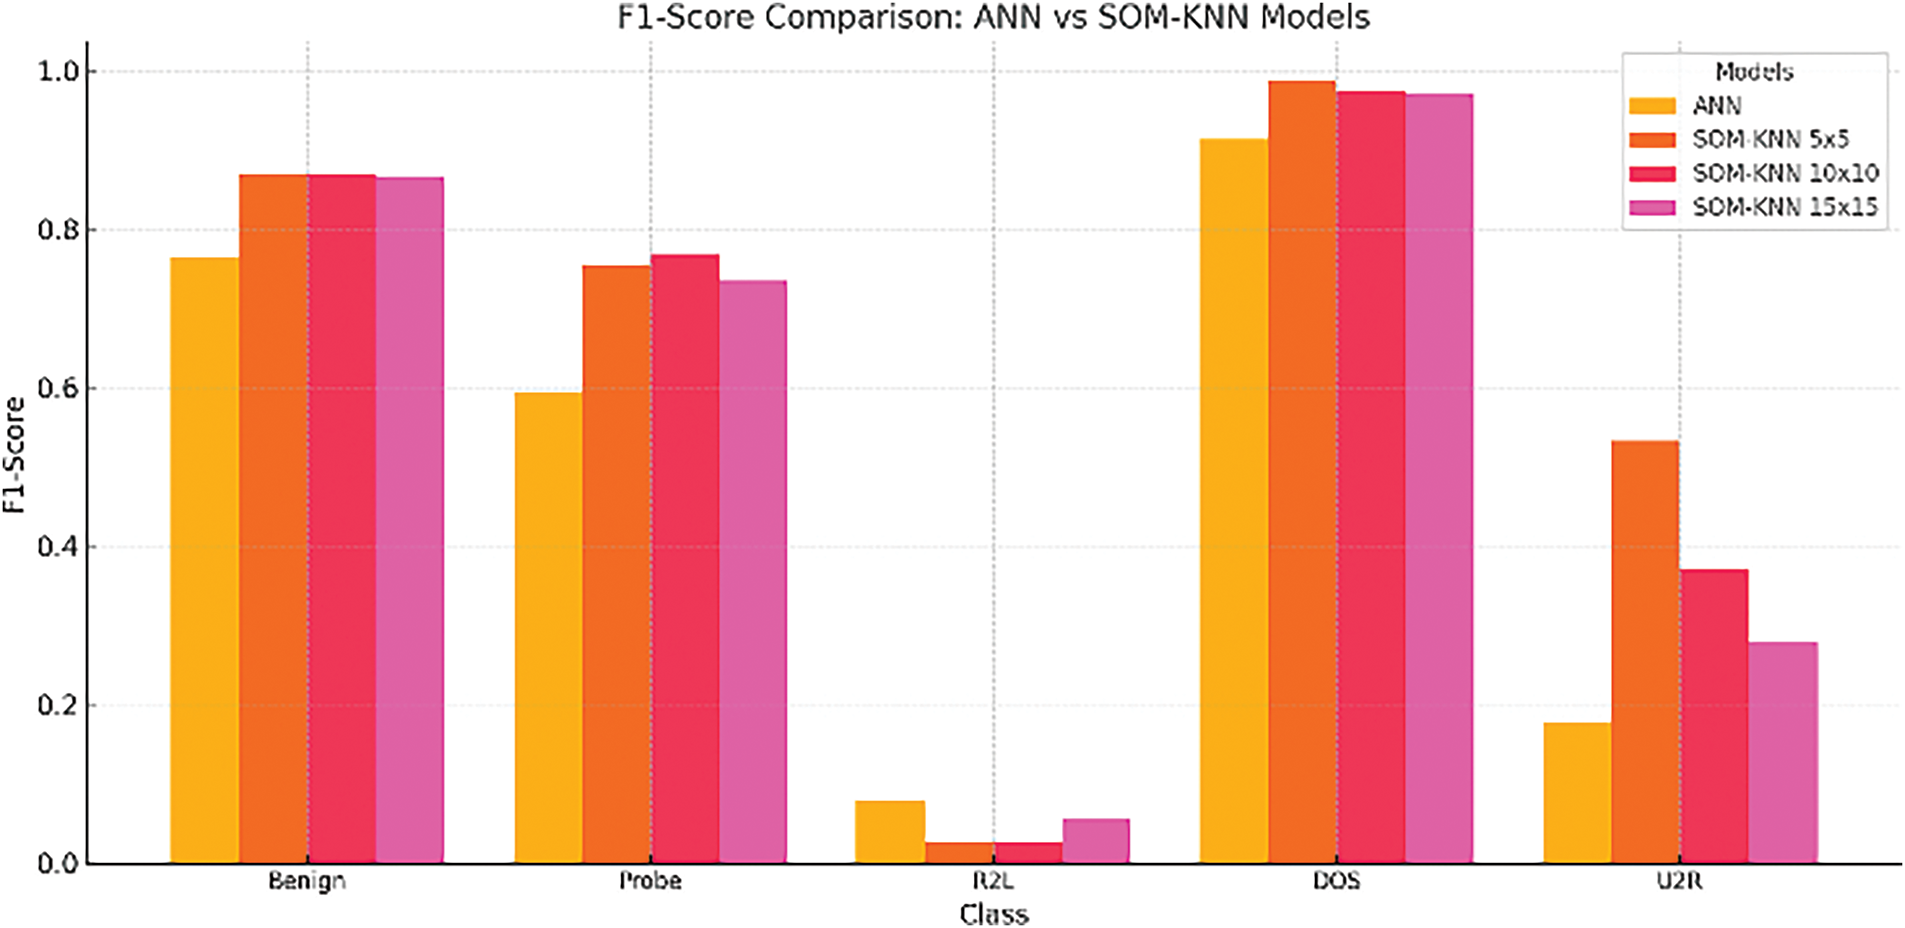
Figure 21: MLP vs. SOM-KNN concerning F1-score
The hybrid-SOM (SOM-XGBoost) model in every assessed class routinely performs better than MLP. The Hybrid-SOM 5 × 5 design demonstrates the best balance between performance and resource efficiency, excelling in key areas like DOS and Benign. Fig. 22 visualizes this in an analytical sense.
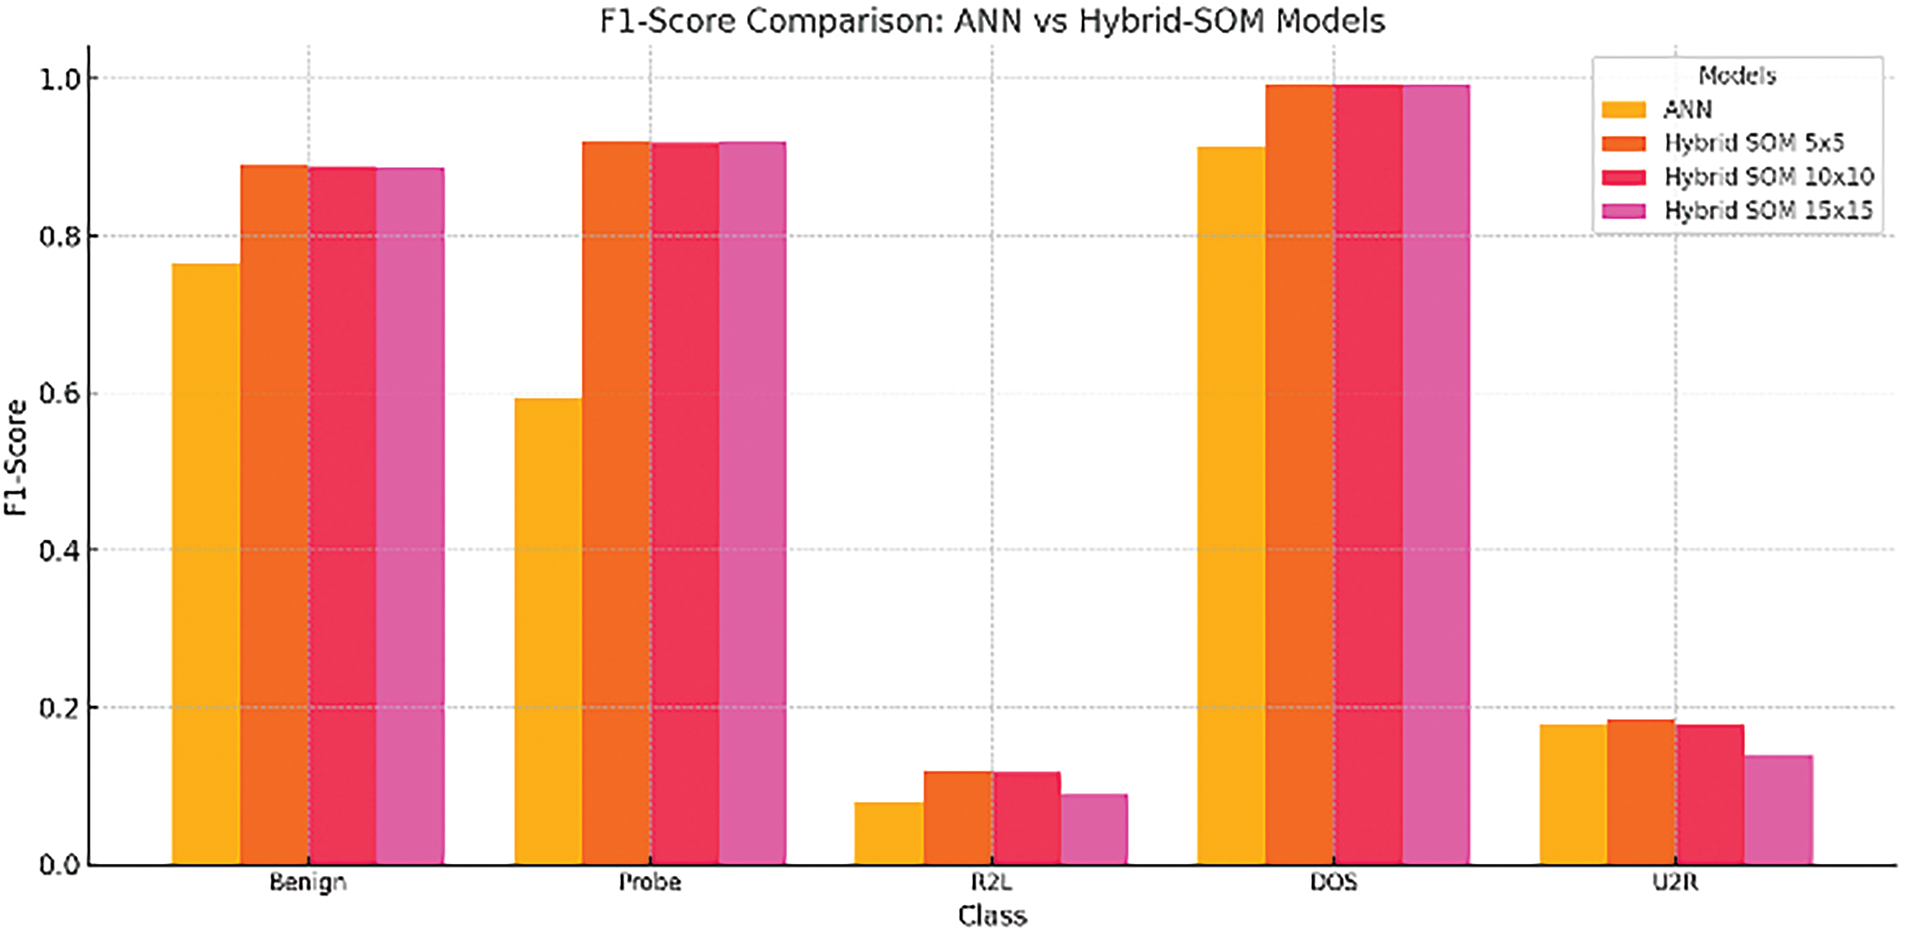
Figure 22: MLP vs. Hybrid SOM concerning F1-score
While comparing the SOM-KNN and Hybrid SOM models, we see that for most classes, hybrid-SOM models (5 × 5, 10 × 10, and 15 × 15) exhibit better F1-scores than their SOM-KNN counterparts. Particularly in crucial areas like Probe and DOS, the hybrid-SOM 5 × 5 configuration dominates performance measurements, demonstrating its efficacy for accurate anomaly identification.
F1-score plays a vital and crucial role in evaluating imbalanced datasets and we are dealing with this kind of imbalanced nature in our respective dataset. So, comparing the F1-scores of the proposed and benchmarked models is necessary. Fig. 23 illustrates a comparison of the F1-score with two models, SOM-KNN and Hybrid SOM. A heat map in Fig. 24 illustrates how well Hybrid SOM, SOM-KNN, and MLP models handle classification problems by summarizing the F1-score of respective classes. The proposed hybrid SOM model results are better in most categories, especially in Benign, Probe, and DOS classes. As mentioned earlier, the Hybrid SOM’s F1-score for most classes is above 0.9. However, the F1-score depreciates regarding classes with significantly fewer instances (r2l, u2r). These results highlight the efficiency of Hybrid SOM for data analysis when it comes to complex intrusion detection scenarios. The necessity of the hour is to optimize further to improve accuracy in detecting less frequent attack types.
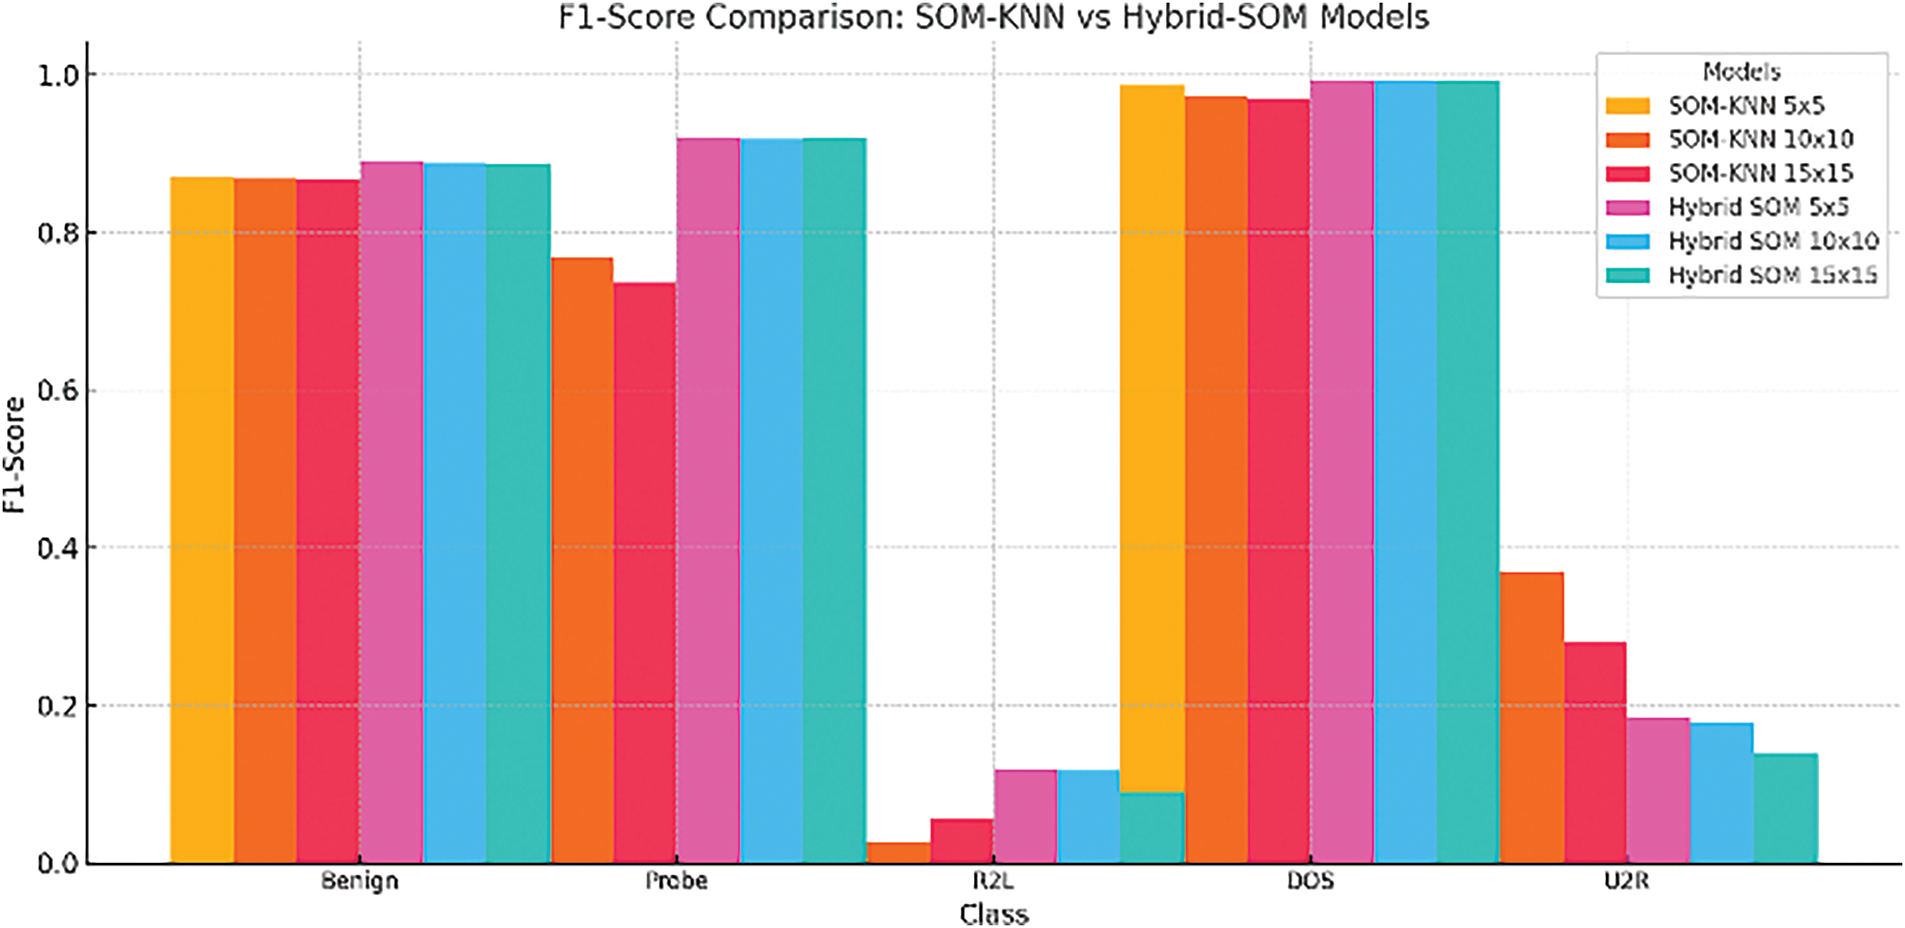
Figure 23: SOM-KNN vs. Hybrid SOM concerning F1-score
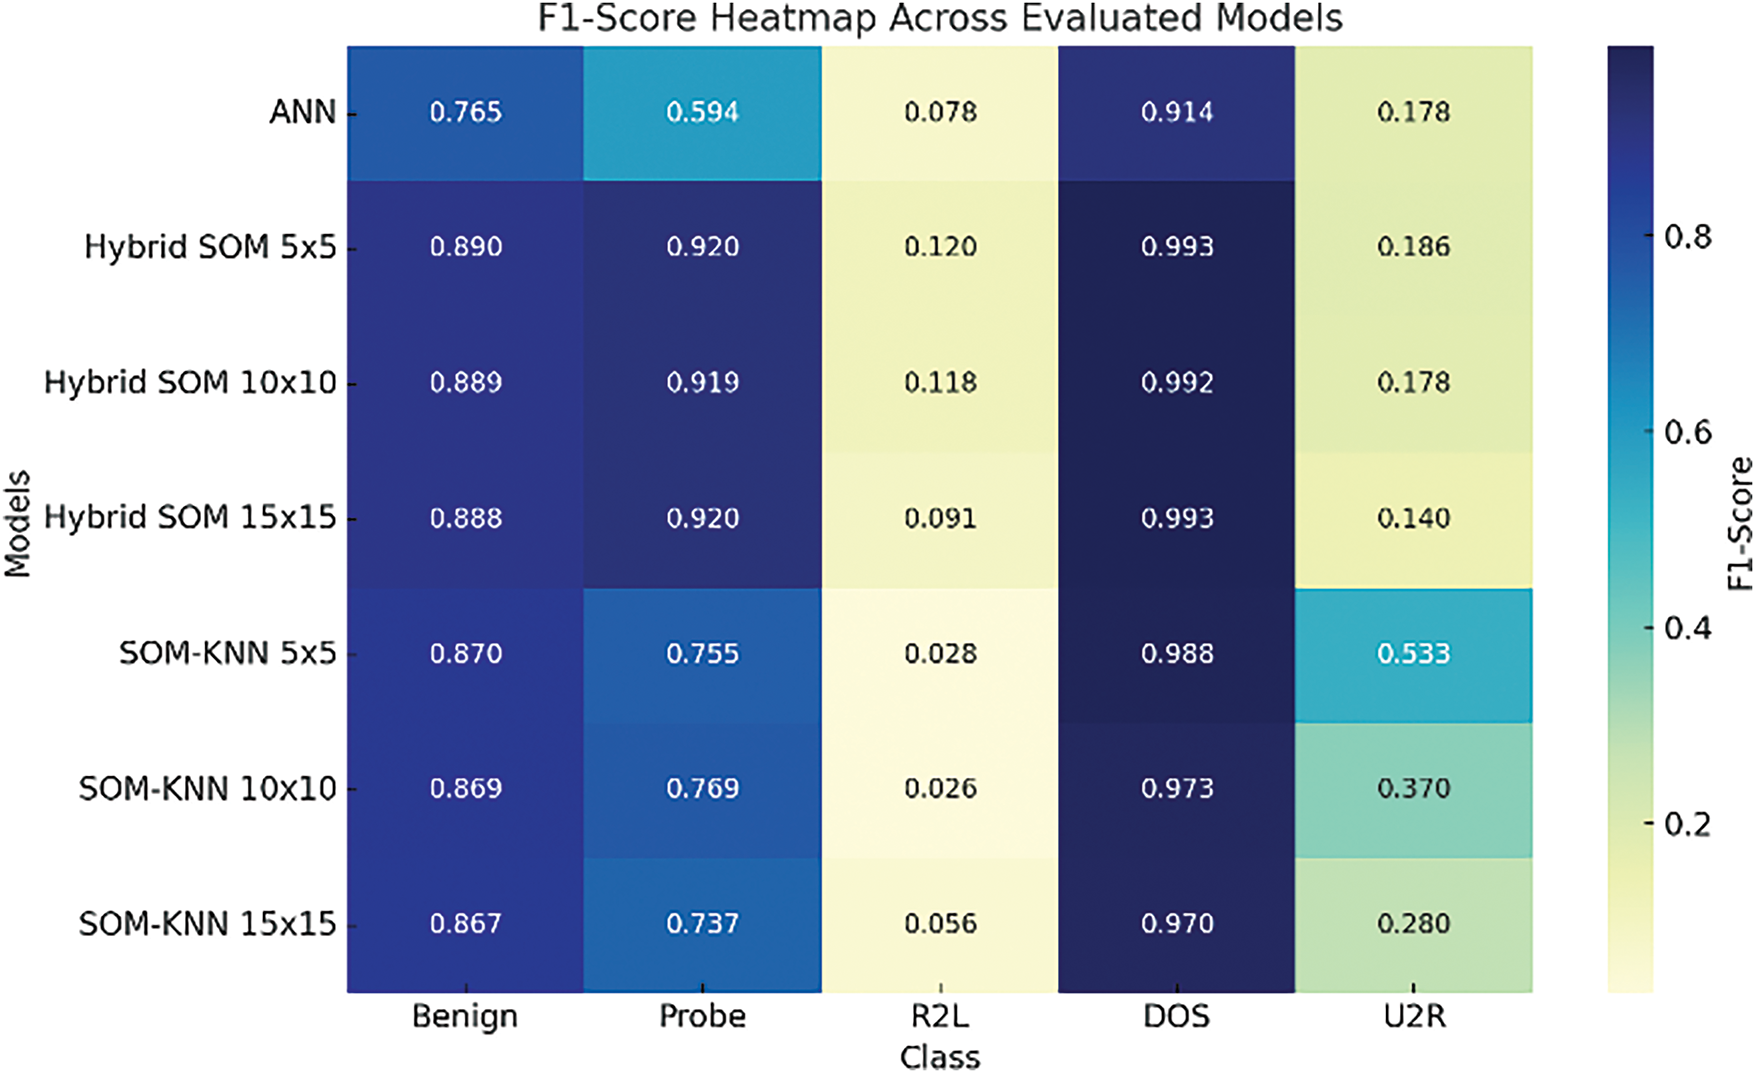
Figure 24: Heatmap of all evaluated models
The experimental results from the evaluated models above show insights into their performance, efficacy, and discrepancies. To gain a deeper understanding, we will discuss the principal features that cause evaluation gaps.
The Hybrid-SOM model’s results indicate it consistently outperforms baseline techniques in accuracy and F1-score. This is due to XGBoost’s gradient-boosting nature, which enhances weak learners and substantially minimizes variance. Dynamic allocation of feature priority allows it to choose the most relevant attributes in the NSL-KDD dataset. In contrast, other classifiers exhibit varying performances due to the struggle in multiclass classification caused by optimal hyperplane separation. It happens more when feature space is highly nonlinear and tends to be less effective.
The imbalanced nature of NSL-KDD causes significant challenges where certain types of classes are underrepresented. This type of dataset causes models to be biased towards classes of higher instances. Cost-sensitive learning or oversampling may resolve this issue, but SOM still struggles with accurately detecting minority classes. Sharing overlapping spaces in some class types with normal traffic complicates the differentiation for a classifier like K-NN. In contrast, XGBoost, through its boosting mechanism, refines the decision boundary, helping in significant detection rates.
Each model evaluated in this research has distinct performance due to innate properties. Multilayer perceptron struggles with convergence and backpropagation issues because it relies on backpropagation phenomena. In artificial neural networks, gradient values tend to vanish or explode, causing weights to become slow or unstable. Also, the non-convex loss function in MLP makes it difficult for an optimal detection rate. K-NN faces the curse of dimensionality; with an increase in the number of features, the data points exhibit sparsity, which complicates the ability of KNN to identify significant nearest neighbors. Data distribution and feature scaling are important in K-NN because improper normalization can cause abrupt distance calculation of features with larger magnitudes, leading to biased classification. Self-organizing Map performs the function of dimensionality reduction and visualization. SOM helps overcome issues of high correlation that normally exist in network traffic datasets. XGBoost whereas iteratively refines weak learners. It addresses class imbalances by allocating larger weights to challenging and complex instances or samples. Furthermore, its L1/L2 regularization helps prevent overfitting, promoting more stable and accurate classification over various network attack types.
The Hybrid SOM-XGBoost model provides a robust approach to intrusion detection in resource-restricted networks, enhancing detection accuracy while managing complexity effectively. The model clusters data using a self-organizing map succeeded by gradient boosting classification provided by the XGBoost algorithm, ultimately boosting detection rates among different classes of network traffic. Considerable enhancements in recall and precision, especially concerning large attack classes, indicate the resourcefulness of the proposed model. Hybrid SOM-XGBoost outclasses the MLP and SOM-KNN benchmark models with notable anomaly detection enhancements. Compared to MLP model results, the F1-score of dos, probes, and benign classes improved by 7.91%, 32.62%, and 12.45%, respectively. Despite this, challenges persist in classifying rare classes such as r2l and u2r because of innate imbalances in the dataset, which are retained even after preprocessing. Due to extensive hyperparameter tuning, substantial computational resources are required, which can cause computational overhead. The dependence of XGBoost on labeled data due to supervised learning may not be ideal in every intrusion detection deployment. SOM lacks incremental learning, this means that once trained, it doesn’t dynamically update on newly provided data.
Future work may include refining the model for these rare classes through thorough investigation and feature engineering methods to improve accuracy. Integrating distributed computing, such as GPU acceleration and parallel processing, can significantly improve scalability. To obtain dynamic adjustments, growing self-organizing maps can play a vital role in improving adaptability. Exploration of online frameworks like federated learning and reinforcement learning can help enhance real-world deployment.
Acknowledgement: Authors are thankful for the support from Project number (RSPD2025R582), King Saud University, Riyadh, Saudi Arabia.
Funding Statement: The authors extend their appreciation to Researcher Supporting Project number (RSPD2025R582), King Saud University, Riyadh, Saudi Arabia.
Author Contributions: Study conception and design: Noveela Iftikhar; Data collection and literature review: Noveela Iftikhar; Interpretation and literature analysis: Noveela Iftikhar, Mohammed J. F. Alenazi; Draft manuscript preparation: Noveela Iftikhar, Mujeeb Ur Rehman, Jehad Ali, Mumtaz Ali Shah; Critical revision of the manuscript: Mujeeb Ur Rehman, Mumtaz Ali Shah. All authors reviewed the results and approved the final version of the manuscript.
Availability of Data and Materials: The data that support the findings of this study are openly available in the University of New Brunswick, “NSL-KDD” dataset at https://www.unb.ca/cic/datasets/nsl.html (accessed on 17 February 2025).
Ethics Approval: Not applicable.
Conflicts of Interest: The authors declare no conflicts of interest to report regarding the present study.
References
1. Chen T, Guestrin C. XGBoost: a scalable tree boosting system. In: Proceedings of the 22nd ACM SIGKDD International Conference on Knowledge Discovery and Data Mining; 2016; San Francisco, CA, USA: ACM. p. 785–94. doi:10.1145/2939672.2939785. [Google Scholar] [CrossRef]
2. Sutton RS, Barto AG. Reinforcement learning: an introduction. IEEE Trans Neural Netw. 1998;9(5):1054. doi:10.1109/TNN.1998.712192. [Google Scholar] [CrossRef]
3. Bin Aftab MU. A hybrid framework for intrusion detection in wireless mesh networks [Ph.D. dissertation]. Karachi, Pakistan: Department of Electrical and Computer Engineering, Nadirshaw Eduljee Dinshaw University of Engineering and Technology; 2015. [Google Scholar]
4. Jeffrey N, Tan Q, Villar JR. A review of anomaly detection strategies to detect threats to cyber-physical systems. Electronics. 2023;12(15):3283. doi:10.3390/electronics12153283. [Google Scholar] [CrossRef]
5. Shaikh A, Gupta P. Advanced signature-based intrusion detection system. In: Intelligent Communication Technologies and Virtual Mobile Networks: Proceedings of ICICV 2022; 2022; Singapore: Springer Nature Singapore. p. 305–21. [Google Scholar]
6. Alsoufi MA, Razak S, Siraj MM, Nafea I, Ghaleb FA, Saeed F, et al. Anomaly-based intrusion detection systems in IoT using deep learning: a systematic literature review. Appl Sci. 2021;11(18):8383. doi:10.3390/app11188383. [Google Scholar] [CrossRef]
7. Khraisat A, Gondal I, Vamplew P, Kamruzzaman J. Survey of intrusion detection systems: techniques, datasets and challenges. Cybersecurity. 2019;2(1):20. doi:10.1186/s42400-019-0038-7. [Google Scholar] [CrossRef]
8. Bacha S, Aljuhani A, Ben Abdellafou K, Taouali O, Liouane N, Alazab M. Anomaly-based intrusion detection system in IoT using kernel extreme learning machine. J Ambient Intell Humaniz Comput. 2024;15(1):231–42. doi:10.1007/s12652-022-03887-w. [Google Scholar] [CrossRef]
9. Zidi S, Mihoub A, Mian Qaisar S, Krichen M, Abu Al-Haija Q. Theft detection dataset for benchmarking and machine learning based classification in a smart grid environment. J King Saud Univ Comput Inf Sci. 2023;35(1):13–25. doi:10.1016/j.jksuci.2022.05.007. [Google Scholar] [CrossRef]
10. Díaz-Verdejo J, Muñoz-Calle J, Estepa Alonso A, Estepa Alonso R, Madinabeitia G. On the detection capabilities of signature-based intrusion detection systems in the context of web attacks. Appl Sci. 2022;12(2):852. doi:10.3390/app12020852. [Google Scholar] [CrossRef]
11. García-Teodoro P, Díaz-Verdejo J, Maciá-Fernández G, Vázquez E. Anomaly-based network intrusion detection: techniques, systems and challenges. Comput Secur. 2009;28(1–2):18–28. doi:10.1016/j.cose.2008.08.003. [Google Scholar] [CrossRef]
12. Hamid Y, Sugumaran M. A t-SNE based non linear dimension reduction for network intrusion detection. Int J Inf Technol. 2020;12(1):125–34. doi:10.1007/s41870-019-00323-9. [Google Scholar] [CrossRef]
13. Haq MA. DBoTPM: a deep neural network-based botnet prediction model. Electronics. 2023;12(5):1159. doi:10.3390/electronics12051159. [Google Scholar] [CrossRef]
14. Aleesa AM, Younis M, Mohammed AA, Sahar NM. Deep-intrusion detection system with enhanced UNSW-NB15 dataset based on deep learning techniques. J Eng Sci Technol. 2021;16(1):711–27. [Google Scholar]
15. Alissa K, Alyas T, Zafar K, Abbas Q, Tabassum N, Sakib S. Botnet attack detection in IoT using machine learning. Comput Intell Neurosci. 2022;2022(2):4515642. doi:10.1155/2022/4515642. [Google Scholar] [PubMed] [CrossRef]
16. Elsayed N, ElSayed Z, Bayoumi M. IoT botnet detection using an economic deep learning model. In: 2023 IEEE World AI IoT Congress (AIIoT); 2023 Jun 7–10. Seattle, WA, USA: IEEE; 2023. p. 134–42. doi:10.1109/AIIoT58121.2023.10174322. [Google Scholar] [CrossRef]
17. Bharadiya J. A tutorial on principal component analysis for dimensionality reduction in machine learning. Int J Innov Sci Res Technol. 2023;8(5):2028–32. [Google Scholar]
18. Lu C, Cao Y, Wang Z. Research on intrusion detection based on an enhanced random forest algorithm. Appl Sci. 2024;14(2):714. doi:10.3390/app14020714. [Google Scholar] [CrossRef]
19. Kim J, Shim M, Hong S, Shin Y, Choi E. Intelligent detection of IoT botnets using machine learning and deep learning. Appl Sci. 2020;10(19):7009. doi:10.3390/app10197009. [Google Scholar] [CrossRef]
20. Sarker IH. Machine learning: algorithms, real-world applications and research directions. SN Comput Sci. 2021;2(3):160. doi:10.1007/s42979-021-00592-x. [Google Scholar] [PubMed] [CrossRef]
21. Nandanwar H, Katarya R. Deep learning enabled intrusion detection system for Industrial IOT environment. Expert Syst Appl. 2024;249(11):123808. doi:10.1016/j.eswa.2024.123808. [Google Scholar] [CrossRef]
22. Abusitta A, de Carvalho GHS, Abdel Wahab O, Halabi T, Fung BCM, Al Mamoori S. Deep learning-enabled anomaly detection for IoT systems. Internet Things. 2023;21(2):100656. doi:10.1016/j.iot.2022.100656. [Google Scholar] [CrossRef]
23. Khan S, Mailewa AB. Discover botnets in IoT sensor networks: a lightweight deep learning framework with hybrid self-organizing maps. Microprocess Microsyst. 2023;97(5):104753. doi:10.1016/j.micpro.2022.104753. [Google Scholar] [CrossRef]
24. Rolon-Mérette D, Ross M, Rolon-Mérette T, Church K. Introduction to Anaconda and Python: installation and setup. Quant Meth Psychol. 2020;16(5):S3–11. doi:10.20982/tqmp.16.5.S003. [Google Scholar] [CrossRef]
25. Sapre S, Ahmadi P, Islam K. A robust comparison of the KDDCup99 and NSL-KDD IoT network intrusion detection datasets through various machine learning algorithms. arXiv:1912.13204. 2019. [Google Scholar]
26. Solekha NA. Analysis of NSL-KDD dataset for classification of attacks based on intrusion detection system using binary logistics and multinomial logistics. Semnasoffstat. 2022;2022(1):507–20. doi:10.34123/semnasoffstat.v2022i1.1138. [Google Scholar] [CrossRef]
27. Glorot X, Bordes A, Bengio Y. Deep sparse rectifier neural networks. Proc Fourteenth Int Conf Artif Intell Statist. 2011;15:315–23. [Google Scholar]
Cite This Article
 Copyright © 2025 The Author(s). Published by Tech Science Press.
This work is licensed under a Creative Commons Attribution 4.0 International License , which permits unrestricted use, distribution, and reproduction in any medium, provided the original work is properly cited.
 Downloads
 Citation Tools