
 Submit a Paper
 Propose a Special lssue
 Open Access
ARTICLE

A 3-Dimensional Cargo Loading Algorithm for the Conveyor-Type Loading System
1 Department of Industrial Management Engineering, Korea University, Seoul, 02841, Republic of Korea
2 Department of Artificial Intelligence, Kyung Hee University, Gyeonggi-do, 17104, Republic of Korea
3 Advanced Logistics System Research Team, Korea Railroad Research Institute, Gyeonggi-do, 16105, Republic of Korea
* Corresponding Authors: Byung Duk Song. Email: ; Sang-Duck Lee. Email:
Computer Modeling in Engineering & Sciences 2025, 142(3), 2739-2769. https://doi.org/10.32604/cmes.2025.061639
Received 29 November 2024; Accepted 09 January 2025; Issue published 03 March 2025
 View Full Text
 Download PDF
Abstract
This paper proposes a novel cargo loading algorithm applicable to automated conveyor-type loading systems. The algorithm offers improvements in computational efficiency and robustness by utilizing the concept of discrete derivatives and introducing logistics-related constraints. Optional consideration of the rotation of the cargoes was made to further enhance the optimality of the solutions, if possible to be physically implemented. Evaluation metrics were developed for accurate evaluation and enhancement of the algorithm’s ability to efficiently utilize the loading space and provide a high level of dynamic stability. Experimental results demonstrate the extensive robustness of the proposed algorithm to the diversity of cargoes present in Business-to-Consumer environments. This study contributes practical advancements in both cargo loading optimization and automation of the logistics industry, with potential applications in last-mile delivery services, warehousing, and supply chain management.Keywords
The impact of the COVID-19 era has shifted the distribution market trends from an offline-centered to an online-centered model, leading to rapid growth of the e-commerce market [1]. The scale and complexity of the logistics industry in South Korea are also showing an increase proportional to the growth of the global logistics sector. A domestic parcel volume statistics study conducted by GenstarMate in 2023 showed that the annual parcel volume in 2022 surpassed 4 billion boxes, marking a growth rate of approximately 200% compared to 2013 [2]. On the contrary, the economically active population trends of South Korea reflected the impacts of low birth rate, social aging, and population decline, emphasizing the necessity of transition to unmanned and automated logistics [3]. Additional institutional factors such as restrictions on working hours and the increase in the minimum wage further highlight the necessity of automation in the logistics sector.
Logistics automation can offer various advantages such as enhanced safety and reduced operation costs to the industry, with optimization of the space utilization being one of the primary effects of logistics automation. While acquirement of logistics facilities and transportation has been the key objective required for the expansion of the logistics industry, recent emphasis has shifted towards efficient utilization of existing facilities and transportation [4]. According to the 2017 annual report conducted by the Ministry of Economy, Trade and Industry in Japan, the average loading rate of trucks utilized in the Japanese logistics industry was only 41%, which required more efficient space utilization methods to compensate for the increasing volume of the logistics sector [5].
Under these circumstances, the government and various domestic logistics companies are actively promoting the development and deployment of automation robots for accurately and rapidly handling small quantities of cargo and for maximizing the space utilization of vehicles. In 2023, the Ministry of Trade, Industry, and Energy (MOTIE) and the Korea Railroad Research Institute (KRRI) developed a conveyor-type cargo-loading robot that could automatically load cargo into the loading spaces of vehicles.
The loading process of the aforementioned conveyor-type cargo loading robot consists of three individual decision-making processes. The first process is cargo information recognition, where the robot utilizes a LiDAR camera, an RGB camera, and a trigger sensor to acquire depth data of the cargo and to determine whether the cargo is accessible. The volume, barcode, and damage information of the cargo are also gathered in this process. The second process is analyzing the condition of the loading space of the vehicle, which involves acquiring depth image-based loading space information via a camera and voxelating the loading space. The presence of preloaded cargo in the loading space is detected. The third process is the calculation of the loading position of individual cargoes. This process requires applications of multiple constraints which are determined upon previously obtained cargo information and the voxelated loading status information. The loading order of the automation robot and the optimal loading coordinates of the cargoes are determined.
This study proposes a cargo loading algorithm that supports the calculation of the loading position during the third phase of the automation process of the conveyor-type cargo loading robot. The proposed algorithm is designed to achieve the following objectives. The first objective is to develop an algorithm that can flexibly respond to any arbitrary loading scenarios that could occur in real delivery sites. The second objective is to minimize the damage taken by the cargo and the third objective is to reduce the calculation time via utilizing heuristic algorithms that could consider multiple real-life variables such as the condition of the loading vehicle, delivery routing order, cargo volume, and fragility. We aim to improve the efficiency, reliability, and robustness of logistics systems by achieving the objectives.
The rest of the paper is organized as follows. Section 2 introduces related works on three-dimensional loading algorithms. Section 3 defines the problem situation addressed in this study. Section 4 presents the three-dimensional cargo loading algorithm developed for the problem situation. Section 5 presents the experimental setup and evaluation metrics for verifying the performance of the algorithm. Section 6 organizes the results of the experiments conducted and Section 7 presents conclusions with further research directions.
2.1 Mathematical Programming Models
This study aims to address the problem of allocating (loading) 3-dimensional cargo into a 3-dimensional rectangular object (container). This problem is commonly referred to as the 3-dimensional Container Loading Problem (3D-CLP). Mathematical programming models for the 3D-CLP have been continuously developed, with their major objectives being narrowing the gap between theoretical and real loading situations. Variables, parameters, and constraints that describe various real-life conditions are utilized, which increases the computational effort required for obtaining optimal solutions. This limits the size of problems that can be solved with mathematical programming models, but mathematical programming models are still powerful methods as they guarantee the optimality of the calculated solution, unlike other approximation methods.
Kilincci et al. [6] proposed a variant of the CLP model for loading stacks of plastic cups into containers. A nonlinear integer programming model was developed, and a decision model for calculating priority and volume expectations was also proposed to aid the mathematical programming model. Filella et al. [7] proposed a mixed-integer linear programming model for the Multi-Drop Container Loading Problem (MDCLP), which could prevent the need for rearranging of cargoes during the unloading process by considering the delivery sequence while loading. The model was configured with relaxed constraints in the form of penalty functions which penalize rearrangement of cargoes and considered the volume and the weight of the cargoes by setting constraints. Rusdiansyah et al. [8] proposed a mathematical programming model for the Refrigerated Container Loading Problem (RCLP) to minimize the cost of loading temperature-sensitive items. The model contained constraints to maintain the freshness of goods effected by temperature changes and considered the weight and stability of the loaded cargoes. The model minimized the combined cost of temperature maintenance, quality degradation, and loading. Palacios et al. [9] proposed a integer linear programming model for the Multi-container Loading Problem (MCLP). Conditions such as cargo stability, weight distribution, and separate loading were formulated into constraints and the model presented the effect of separate loading conditions on delivery costs. Simamora et al. [10] proposed a mixed-integer nonlinear programming model for the Stochastic-Demand Cargo Container Loading Problem (SDCCLP). The proposed nonlinear model put the stochasticity of demand volumes under consideration by setting appropriate penalties.
The high complexity of loading problems limits the capacity of mathematical programming models in real-life large-scale loading scenarios. Furthermore, additional limitations such as the need for commercial optimization software licenses and long solution attainment times exist. The problems of mathematical programming models have led to the development of approximation algorithms for attaining sub-optimal solutions in a reasonable amount of time.
Huang et al. [11] proposed the Ternary Search Tree-Differential Evolution algorithm (TSTDE) by combining a differential evolution algorithm with a ternary search tree model to solve the 3-Dimensional Container Loading Problem (3D-CLP). This approximation algorithm is structured in a dual format, where the Ternary Search Tree model first generates solutions that are used as initial values of the differential evolution algorithm. Safak et al. [12] proposed a method to solve the container Loading Problem (CLP) for a single container using the Large Neighborhood Search (LNS) algorithm. The LNS algorithm can effectively resolve the local optima problem and broaden the exploration by setting a large variation magnitude during the neighborhood search process. This allows the exploration of near-optimal solutions that reflect real-world loading considerations such as load capacity, priorities, and stability. Phongmoo et al. [13] proposed a multi-objective optimization model for the 3-dimensional Single Container Loading Problem (3D-SCLP), which deals with item loading scenarios consisting of a single container, and suggested a variant of the Artificial Bee Colony Algorithm (ABC). The proposed algorithm used the Bottom-Left-Fill (BLF) strategy, which fills items from the bottom and leftmost space, along with the ABC algorithm’s approach. For the multi-objective optimization, the Pareto method was incorporated during the algorithm’s execution. Jiao et al. [14] proposed a novel mathematical programming model and an approximate algorithm for the Container Loading Problem based on Robotic Loader System (CLP-RLS), where automated robots are utilized for the loading process. Robot-related constraints were added to the ordinary loading problem’s formulation, and a search-tree based algorithm was proposed for tackling the problem. Ryu et al. [15] proposed a 3-Dimensional Vehicle Loading Algorithm (3D-VLA) for loading 3-dimensional cargoes onto delivery vehicles, considering the dynamic stability of the loaded structure and the space utilization efficiency. Real-world considerations such as cargo packaging and delivery order were also formulated.
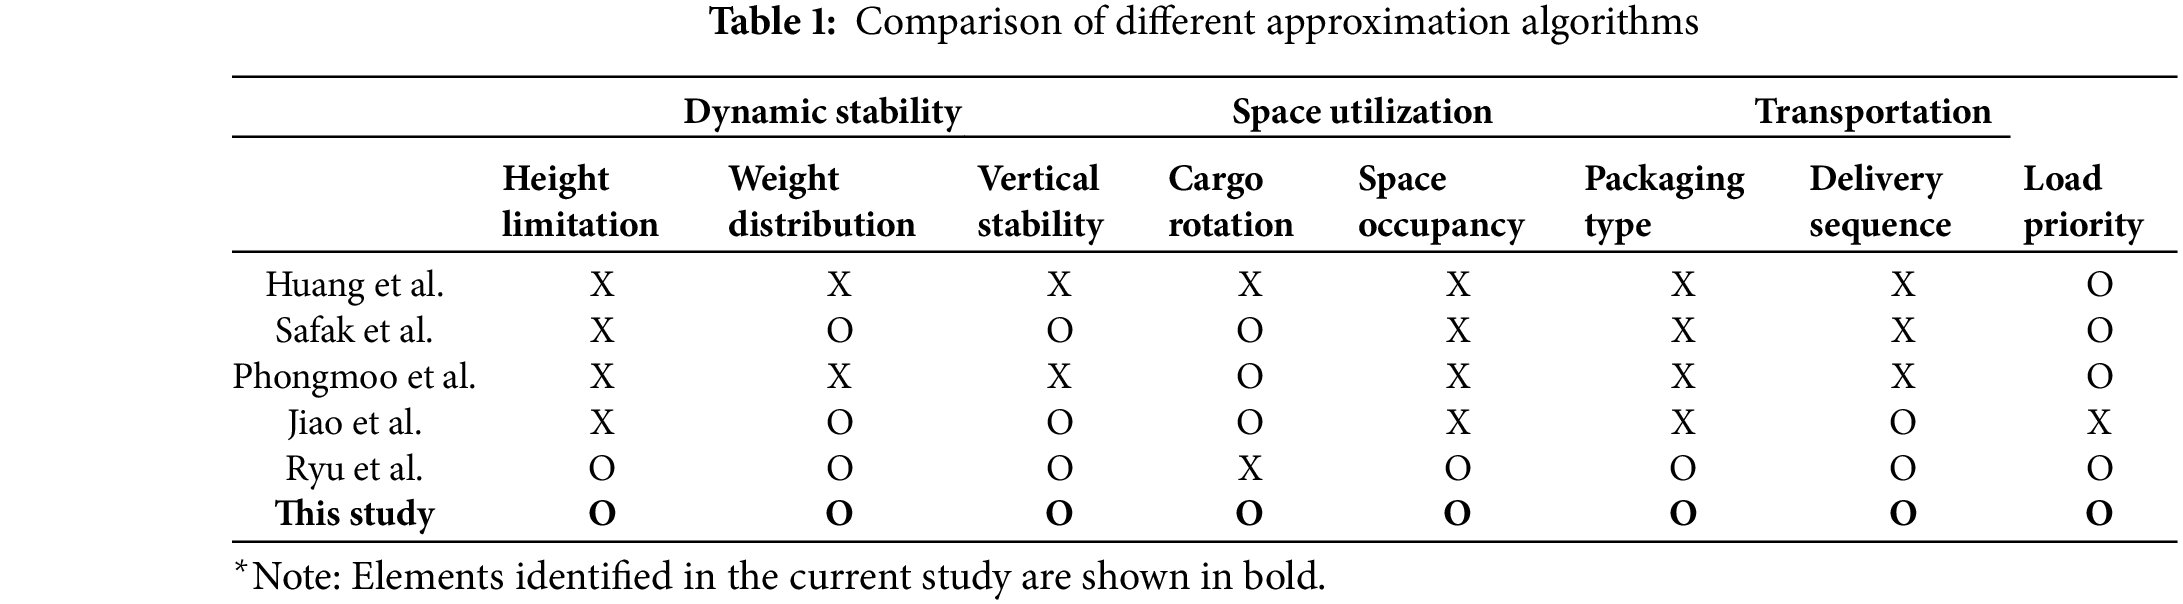
The proposed loading algorithm in this study considers the dynamic stability, space utilization, and real-world transportation constraints, and is able to flexibly deal with dynamic loading scenarios that may arise in the logistics sector.
• Height limitation regarding safety issues, the cargo weight distribution, and the vertical stability are considered and formulated as hard constraints during the decision process. Consideration of these dynamic stability factors allows for minimal cargo damaging during the transportation process and prevents possible safety issues.
• Space utilization was maximized by considering the rotation of the cargo and the preoccupancy state of the loading space. The loading positions of the cargoes are first initialized by the candidate point initialization algorithm and are further processed for feasibility.
• Real-world delivery environments were considered by taking into account loading priorities, multi-drop delivery routing orders, and fragility based on cargo packaging. The characteristics of Business-to-Consumer environments not present in Business-to-Business environments can be considered by the proposed algorithm. Deployment in systems with automated loading processes based on conveyor-type robots is also possible.
Table 1 demonstrates the complete comparison between the approximation algorithms proposed in related works.
This study proposes a cargo-loading algorithm that supports the decision-making process of the conveyor-type cargo-loading robot. The automated system is suitable for small and medium-sized distribution centers, and Fig. 1 visualizes the overall procedure of the conveyor-type automatic cargo loading system. As cargo C1 passes through the cargo information recognizer, cargo information is retrieved, and the stacking order is determined. Cargo C2 is then loaded onto the vehicle via a conveyor loading system, and the proposed algorithm aims to efficiently determine the optimal 3-dimensional stacking position that would maximize the space utilization. The scope of this study covers Business-to-Consumer logistics environment with multiple destinations, where the demands are composed of small quantities of different types of items.
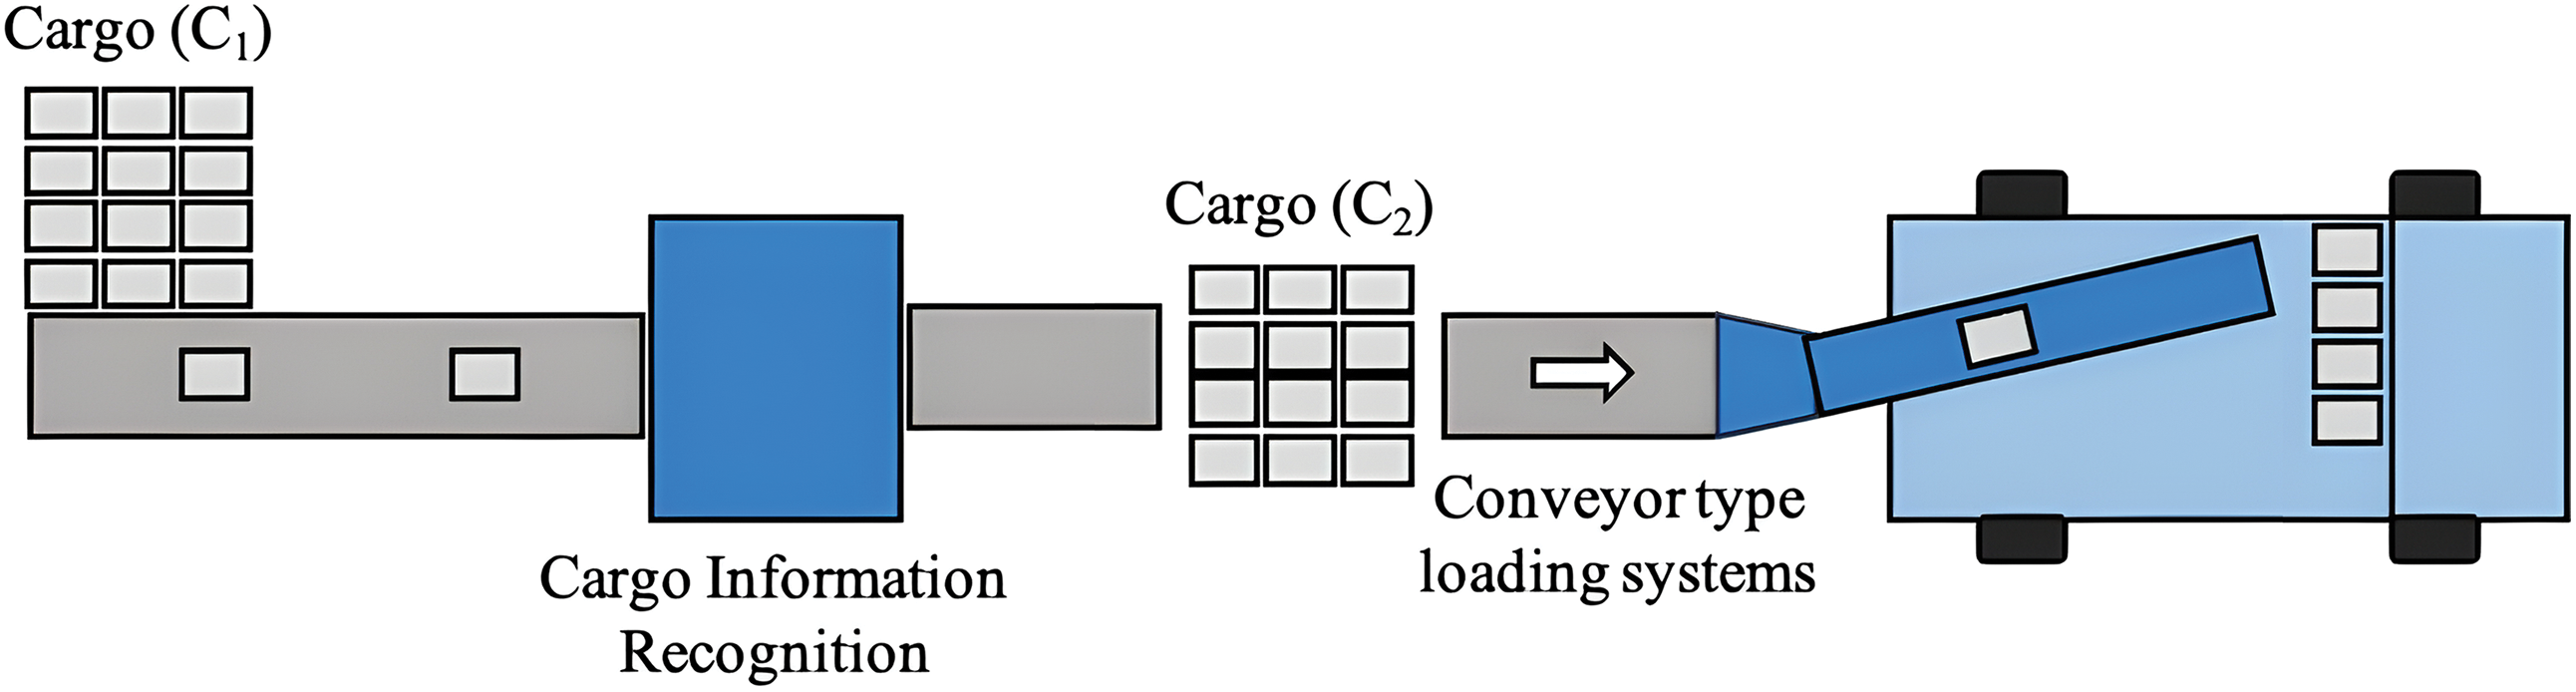
Figure 1: Visualization of the automated cargo loading system
We set several initial assumptions on the proposed loading algorithm. The first assumption is that the cargo data obtained through the cargo information recognition process is available upon execution of the algorithm. The algorithm could determine the delivery routing order based on the cargo’s volume, weight, and destination. The delivery routing order is necessary for the determination of the input sequence of the cargo loading system. The second assumption is that the voxelated loading status of the container is available upon execution of the algorithm. The information is used to formulate a flexible and practical loading plan in arbitrary loading scenarios that may occur in real logistics environments. The third assumption is that the container capacity is sufficiently large so that all cargo can be loaded without exception. The fourth assumption is that the type of packaging material of the cargo only consists of box, styrofoam, and plastic, with plastic being the most vulnerable packaging type. With the four initial assumptions, this study focuses on the optimal use of the loading space and the optimization of the loading sequence.
The proposed loading algorithm uses cargo information and voxelated loading space information to determine the optimal loading position of the cargo that is processed by the conveyor. The Cargo Loading Algorithm for Conveyor-Type Loading System (CLA-CTLS) consists of two phases, each consisting of two sub-processes. The first phase is the determination phase, which is divided into data preprocessing and loading simulation processes. The second phase is the evaluation phase, which is divided into metric evaluation and visualization. Fig. 2 visualizes the CLA-CTLS in the form of a flowchart.
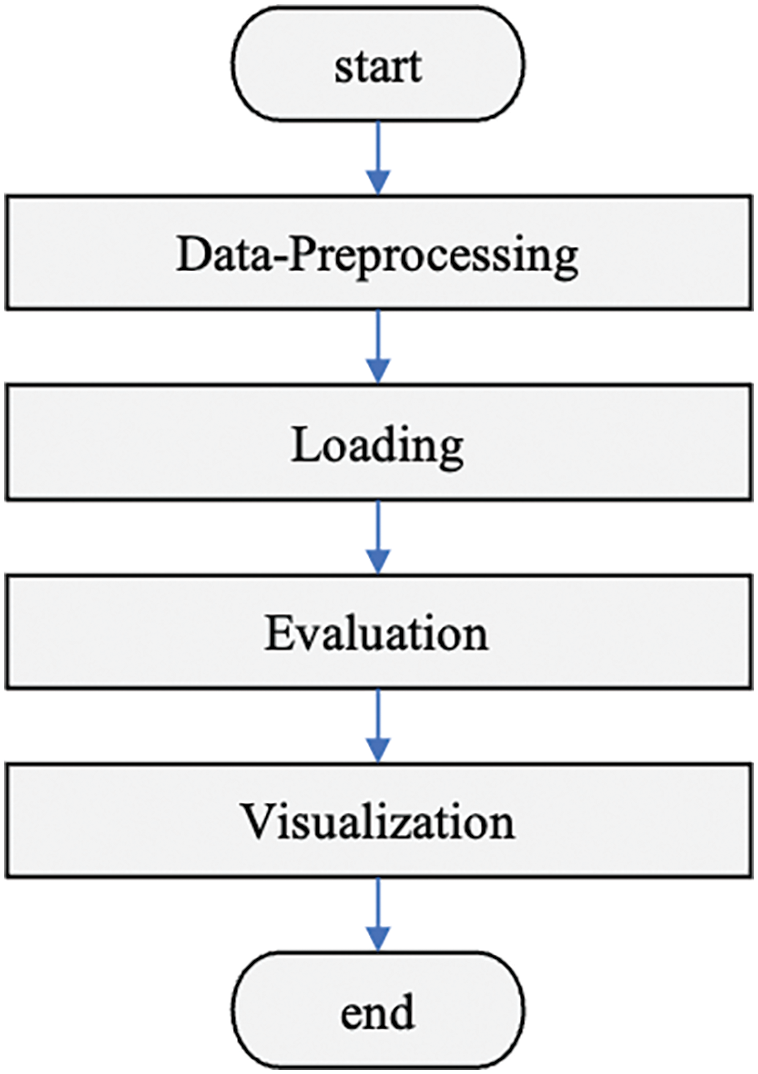
Figure 2: Flowchart of the proposed CLA-CTLS loading algorithm
During the data pre-processing procedure, the loading order of the pending cargo is determined by the delivery routing order and the packaging type. In the loading simulation process, the optimal loading coordinate of the pending cargo is calculated based on the occupancy status of the loading space and the constraints. Upon termination of the simulation process, the quality of the solution is calculated using the predetermined evaluation metrics. Lastly, a visualization of the algorithm solution is provided if required. Through these processes, the proposed CLA-CTLS performs both efficient loading and quality verification, also optionally providing visual results to improve the logistics process.
The Data Preprocessing procedure determines the loading order of the pending cargo through two calculations: First, the delivery routing order is derived from the cargo information. Second, the packaging type of individual cargoes is considered to additionally adjust the determined loading order.
4.1.1 Derivation of the Optimal Routing Order
The delivery efficiency of cargo loading is largely affected by the loading order of the goods. Specifically, the delivery efficiency can be maximized by loading the goods in the reverse order of the optimal delivery sequence, which can be determined in advance.
The CLA-CTLS algorithm presented in this study utilizes optimization techniques for the Vehicle Routing Problem (VRP) to derive the optimal delivery order and arrange the loading sequence of the cargo. The VRP model used in this study involves a single depot, a single vehicle without capacity constraints, and a single tour. This problem setup reflects the characteristics of the well-known Traveling Salesman Problem (TSP), where a single vehicle leaves the origin, visits all locations, and returns to the origin to complete the tour. Removal of some of the assumptions enables the extension of the problem situation to more general scenarios, such as the Single-Depot Vehicle Routing Problem (SDVRP), or the Multiple Capacitated Vehicle Routing Problem (MCVRP).
Fig. 3 visualizes an optimal delivery tour generated by the CLA-CTLS algorithm for eight example delivery locations in the Gangnam district of Seoul, South Korea. The numbered points in the figure represent the delivery locations that need to be visited, and the lines connecting them show the optimal sequence of the tour. The tour begins and ends at the central depot location, marked as “Depot” on the figure.
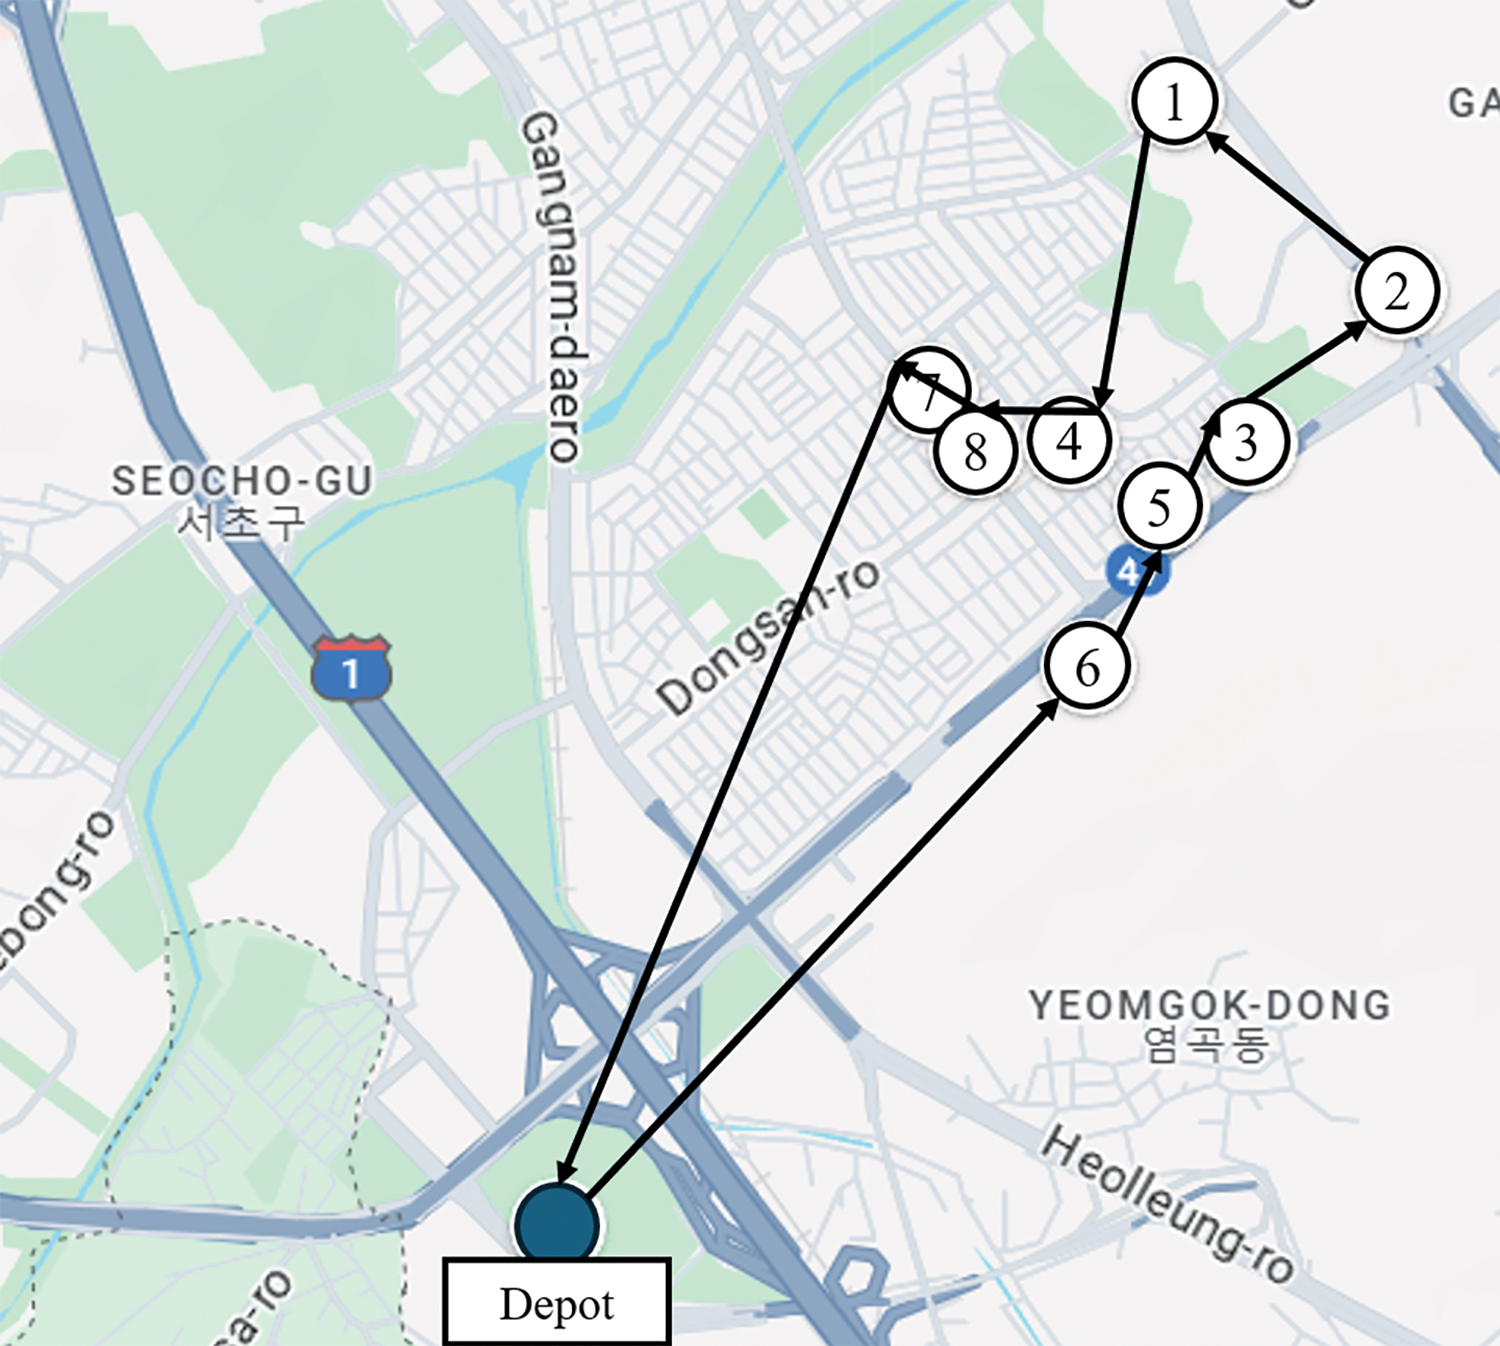
Figure 3: Demonstration of an optimal tour generated by the CLA-CTLS
The optimal delivery order generated by the CLA-CTLS algorithm is as follows: zone 6, zone 5, zone 3, zone 2, zone 1, zone 4, zone 8, and zone 7. The tour is also represented by directed lines in the figure. In Business-to-Consumer logistics environments with multi-drop deliveries, the proposed loading algorithm determines this optimal routing order. Since the cargo loading environment follows a Last-In, First-Out (LIFO) scenario, the cargoes are then loaded in the reverse order of the delivery routing sequence. For the example in Fig. 3, the loading priority would be: zone 7, zone 8, zone 4, zone 1, zone 2, zone 3, zone 5, and zone 6.
This reversed loading order ensures that the cargoes are unloaded in the optimal sequence for delivery, thereby maximizing the efficiency of the overall logistics operation. A detailed description of the Mixed Integer-Linear Programming (MILP) model for the VRP used in the CLA-CTLS algorithm is provided in Appendix A.
4.1.2 Packaging Type Separation
The packaging type of cargo consists of paper boxes, Styrofoam, and plastic vinyl. This study assumes that cargo with vinyl packaging is more fragile than cargo with other types of packaging. There is a high possibility of deformation or damage to vinyl-packed cargo if it is to be loaded under other cargo. Therefore, while maintaining the assigned delivery routing order, the cargo is divided into two groups based on the packaging type: the paper box and Styrofoam group, and the vinyl-packed group. Cargoes belonging to the vinyl-packed group are loaded only if no more paper boxes or Styrofoam group cargoes are pending.
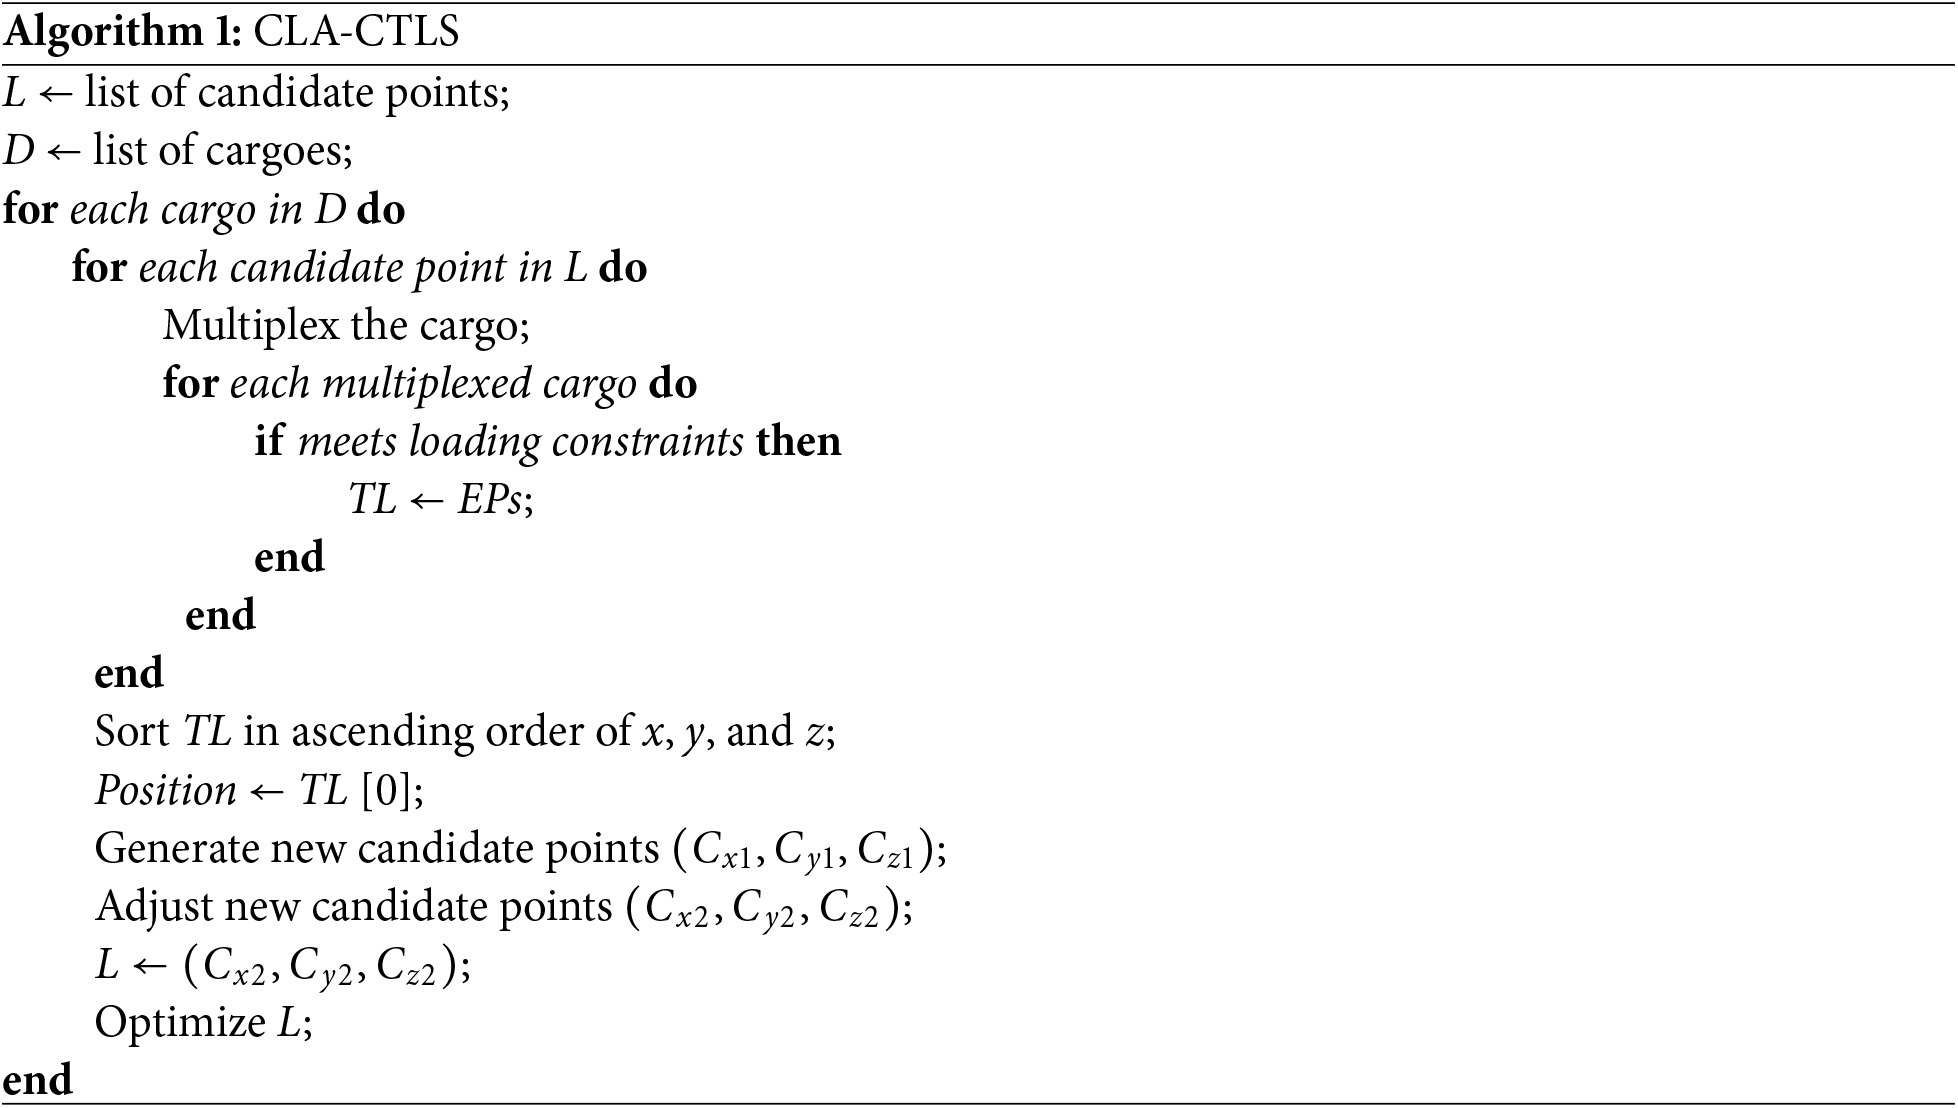
The loading simulation procedure follows the pseudo code presented in Algorithm 1. The initial status of the loading space is analyzed to establish initial loading candidate points. If the loading space is empty, the loading simulation process begins at the left-inner-bottom corner position. If the loading space is preoccupied, the loading simulation process begins upon the calculated initial candidate coordinates.
The cargoes in the input sequence then undergo the loading simulation process where the cargoes are placed at possible candidate points. A complete list of candidate points is referred to as L, and the list of cargoes to be processed by the system is referred to as D. First, the cargoes are multiplexed to enable consideration of rotation. Before the decision process on an individual cargo, a temporary list TL is compromised for storing of feasible loading positions for the cargo. Loading constraints are applied to all the multiplexed cargo dimensions and the points satisfying all the constraints referred to as
Next, new candidate points are generated along each of the three axes, and these points are adjusted considering the current occupancy status of the loading space. After adjustment, the new candidate points are added to the original candidate points list L. Upon adjustment and enlisting of such candidate points, the candidate point list L is further optimized based on the relationships of the candidate points inside the list. Any duplicate coordinates are deleted for the efficiency of the algorithm. The process described above is executed for each cargo in D, and iterated over until the optimal loading position for all the cargoes are determined.
The following section introduces the algorithms for candidate point initialization, cargo multiplexing, application of the loading constraints, and generation/adjustment of new candidate points.
4.2.1 Candidate Point Initialization
In real-world logistic loading and unloading operations, it is common for the loading space of a vehicle to be vacant upon request on delivery. It is also possible that the loading space be preoccupied by necessary items or cargoes. To efficiently deal with both situations, this study utilizes the 3-dimensional spatial recognition technique on the loading space. The 3-dimensional space is recognized in units of 1
Fig. 4 presents a 3-dimensional example to illustrate the candidate point initialization algorithm. The white cuboids represent the previously loaded cargo, and the red cube represents one of the search areas for the generation of initial candidate points.
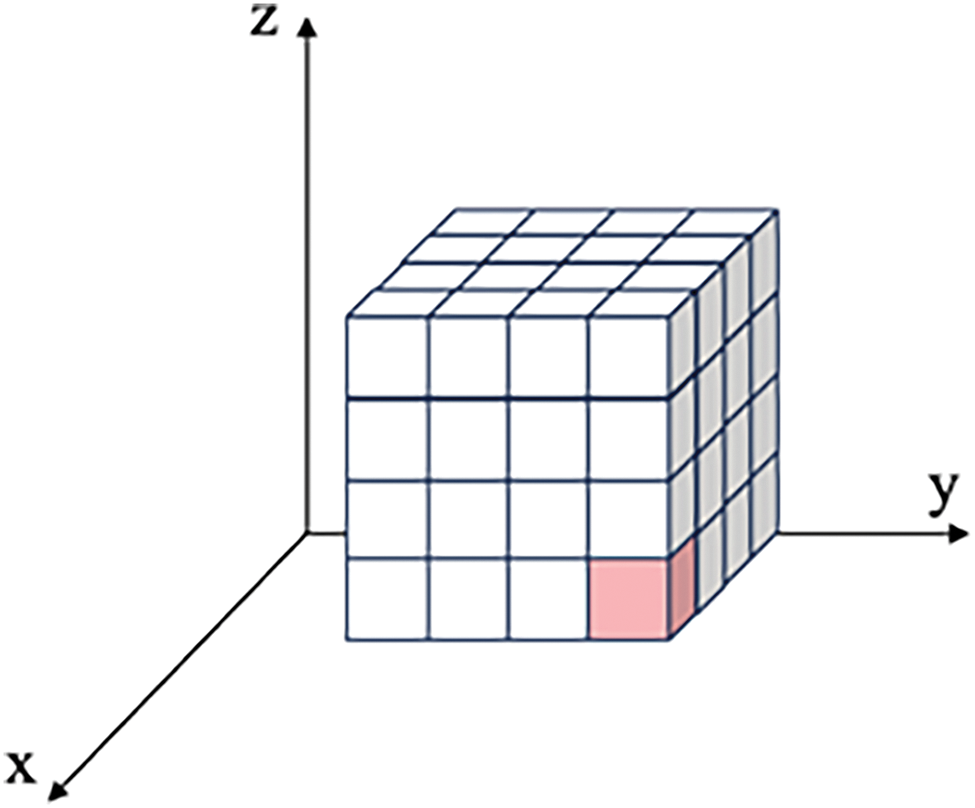
Figure 4: 3-Dimensional example of preloaded cargo
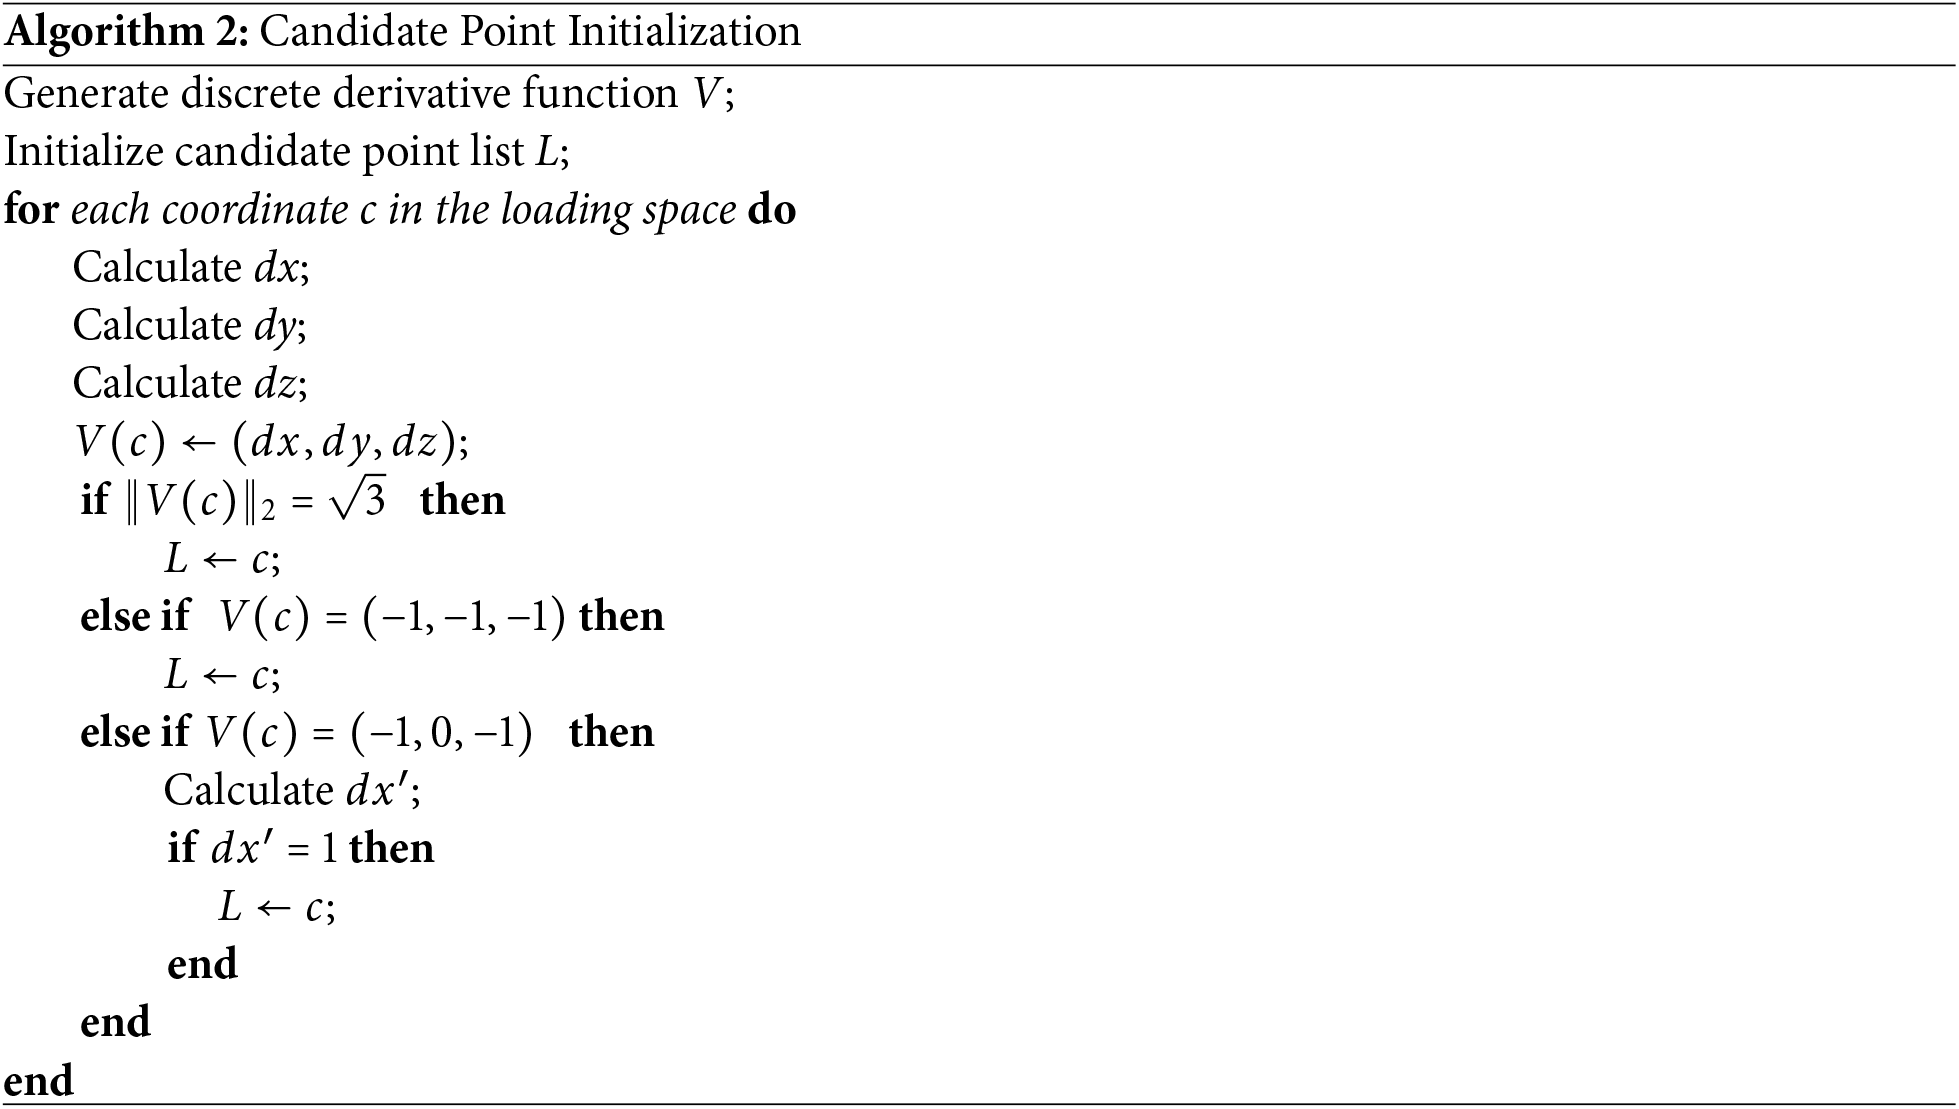
A full description of the candidate point initialization algorithm in the form of a pseudocode is provided in Algorithm 2. The candidate point initialization algorithm utilizes the discrete derivative of the simulated loading space for searching initial candidate points. A list consisting of the candidate points to be considered, L, is declared upon execution of the candidate point initialization algorithm, and a discrete derivative function V is additionally generated to map each candidate points to their discrete derivative vectors. Two determination sub-processes based on vector norms and entry values are utilized in finalizing the initial candidate points list. First, the discrete derivatives in the direction of x, y, and z axes are calculated and stored to
The cargo multiplexing process manipulates the dimensional characteristics of individual cargoes and puts the rotation of the cargo during the loading process under consideration. There exist six types of rotations that keep the cargo orientation orthogonal to the loading space axes. However, the rotation capabilities of different conveyor-type loading systems may differ and can be categorized into three different types: systems not capable of rotating cargoes during the loading process, systems only capable of rotating the cargoes horizontally, and systems fully capable of performing all possible 3-dimensional rotations.
The CLA-CTLS is a robust loading algorithm with one of its primary objectives being the capability to deal with any arbitrary real-world loading scenarios. Precisely, the CLA-CTLS can calculate optimal loading positions of cargoes under different loading systems by adjusting the level of cargo multiplexing. Each cargo may be multiplexed into 1, 2, or 6 candidates, and the multiplexing level can be set in accordance with the capability of the loading system utilized.
Upon multiplexing, each candidate corresponds to a specific placement of the cargo considering the orientation. Loading simulation assessments are made on candidate-level so that the best loading position and the orientation of the cargoes can be determined, further enhancing the loading space utilization.
In 3-dimensional loading algorithms, various loading constraints must be considered to ensure the stability of the loaded cargo. Among the key determinants of loading quality, dynamic stability, static stability, and fragility are utilized as constraints during the loading simulation process of the CLA-CTLS. To ensure dynamic stability, a loading height constraint is considered, and a support area constraint is applied to ensure static stability. Additionally, a weight constraint is applied to consider the durability of the cargo and minimize the possible damage taken by the cargo during actual deliveries. Incorporating these constraints, the CLA-CTLS supports safe loading and transportation.
Height Constraint
The height constraint puts a limit on the maximum possible loading height to ensure the stable loading of cargo and to prevent instability or tipping during actual transportation. The maximum loading height cannot exceed the vehicle’s height specification, and any cargo cannot be loaded beyond this predefined height limitation. In this study, the height limitation was set to 160 cm [16], but the specific value of the height constraint can be adjusted in accordance with the loading sequence and the dimensional characteristics of the loading space. Eq. (1) is the full statement of the equation for calculating the height constraint.
Supported Area Constraint
The supported area constraint ensures that the loaded items receive a minimum level of side support from other vertically adjacent items or the bottom of the loading space. This prevents items from falling onto the floor or other items beneath them upon transportation. Gajda et al. [17] implied that the supported area should be over a certain proportion(r) of the area of the surface area of the box placed above it, and in this study, the value of the proportion parameter r is set to 0.8. Eq. (2) is the full statement of the equation required to calculate the supported area constraint.
Weight Constraint
The term fragility refers to the ability of cargo to support and withstand weight under certain conditions, representing an important characteristic of weight stability. By considering the fragility of the cargoes, the CLA-CTLS can calculate appropriate loading positions that prevent damaging of items during loading and transportation. Specifically, the CLA-CTLS limits the weight of the cargo loaded on top of another cargo so that it does not exceed the Maxload value of the cargo below. The concept of Maxload proposed by Olsson et al. [18] is utilized in this context and Eq. (3) demonstrates the formula for calculating the weight constraint and the Maxload value of an item.
4.2.4 Candidate Point Generation
In the stage of generating new candidate points which occurs after determination of loading position, three new candidate points are formed upon the Extreme Points of the cargo. For a specific item n with dimensions
4.2.5 Candidate Point Adjustment
There are situations where it may be unlikely that the generated candidate points be utilized in further loading simulation iterations. Fig. 5 illustrates various scenarios that can occur during the candidate point generation process. Adjusting the generated candidate points to make them more suitable for cargo loading helps enhance the algorithm’s performance and reduces the solving time while enhancing the solution quality.
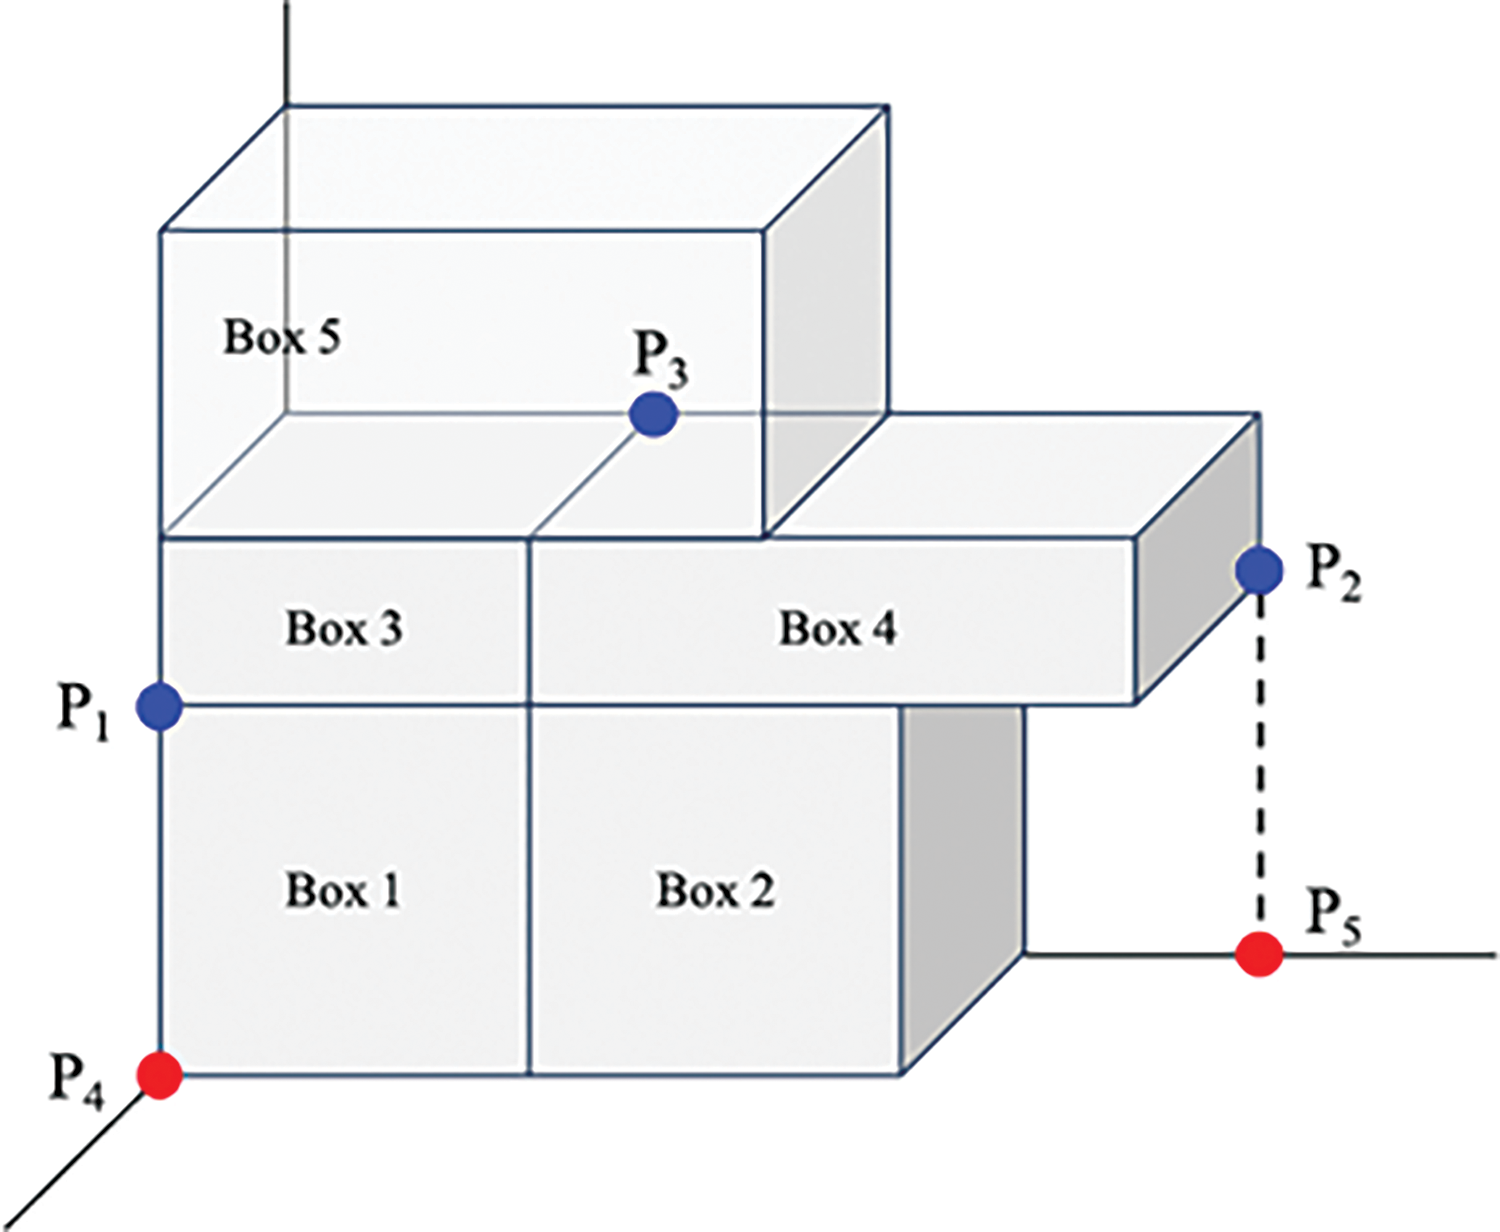
Figure 5: Potential issues regarding candidate point generation
As shown on points P1 and P2 in Fig. 5, some candidate points generated by the candidate point generation process may be infeasible. To adjust these points, it is necessary to verify whether there exists any cargo loaded below the candidate point or if the vehicle floor exists. If there is vacant space present between the candidate point position and the underlying cargo or vehicle floor, the height of the candidate point is adjusted accordingly.
When there is cargo loaded above the generated candidate point or when the height constraint is not met, as illustrated in point P3 of Fig. 5, the candidate point becomes infeasible and has no effect on the result of the next iteration of the loading simulation process. To adjust such points, it needs to be determined whether there exists any cargo above the generated candidate points or whether the height constraint is met. Candidates’ points not satisfying any one of the criteria can be immediately discarded for efficiency.
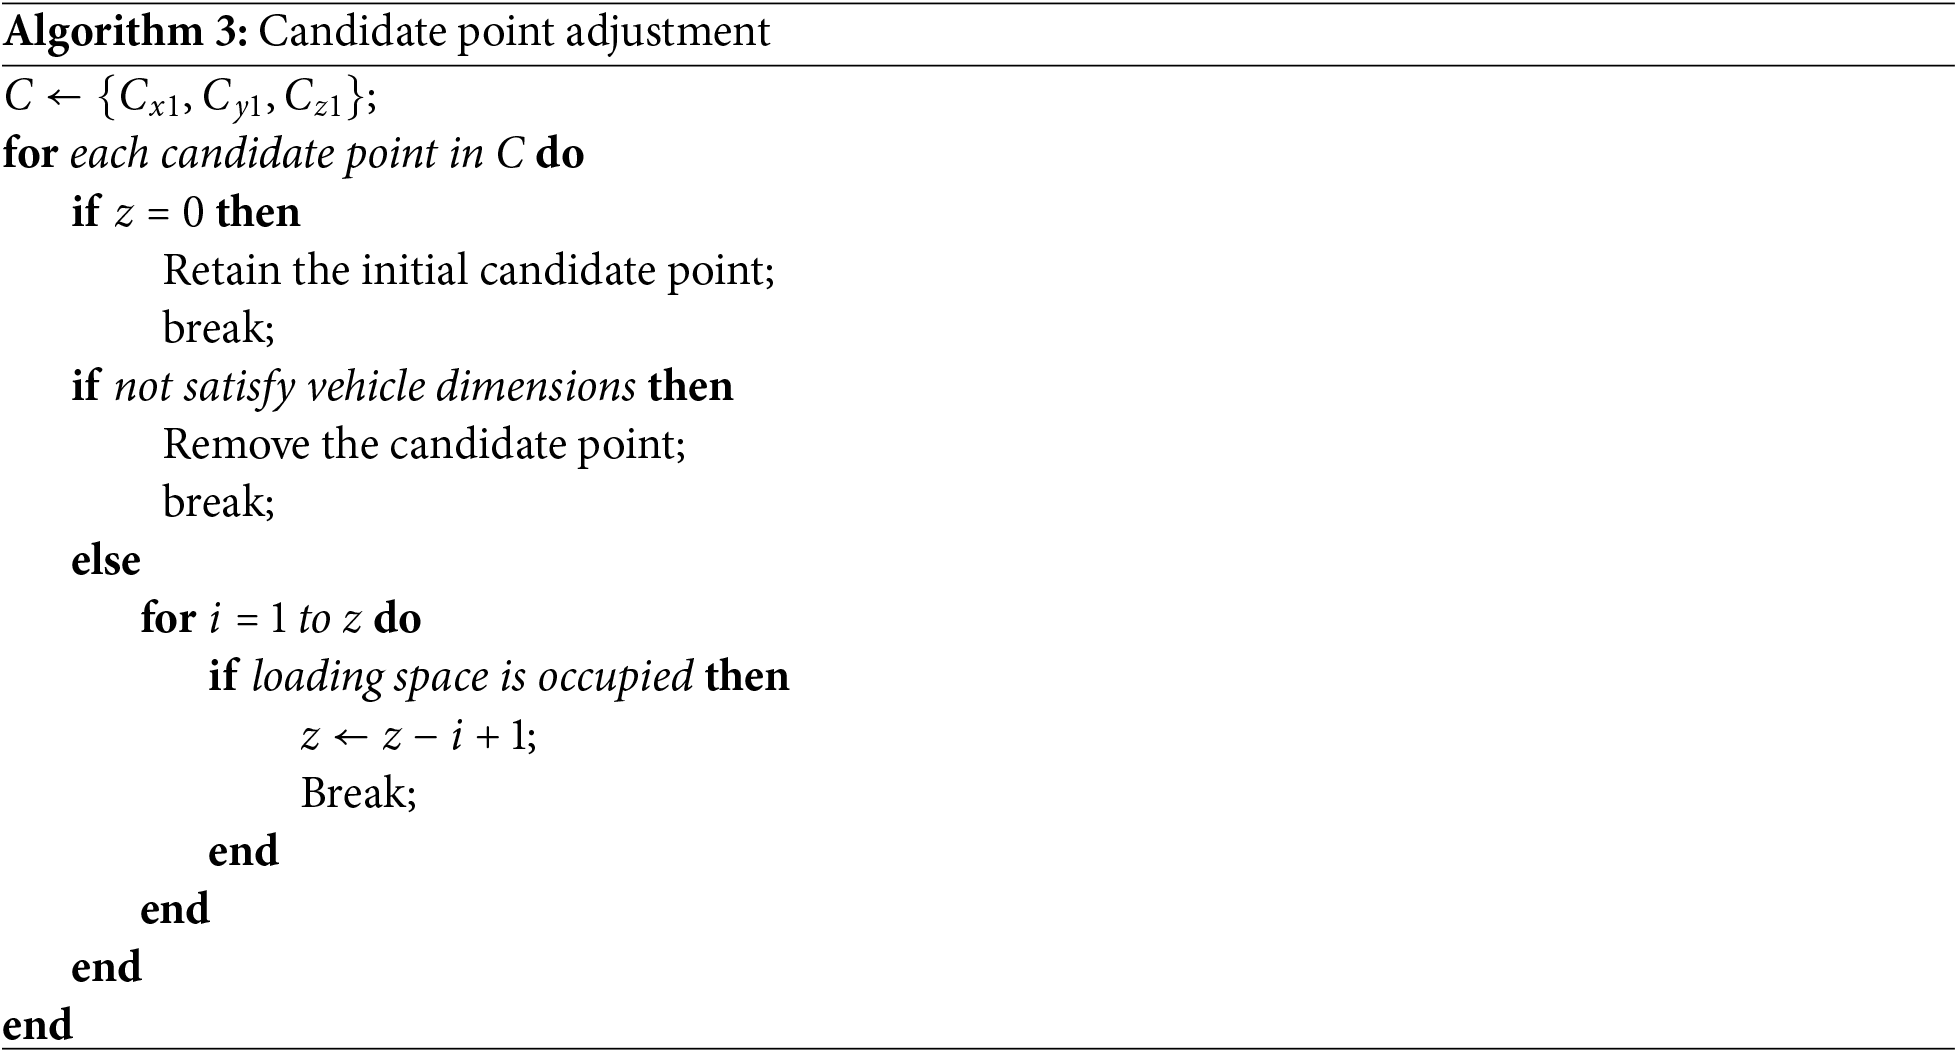
The pseudocode of the adjustment algorithm which consists of both the height adjustment and the elimination sub-process demonstrated via the visual representation is presented in Algorithm 3. The candidate point adjustment algorithm takes a list of 3 candidate points generated upon the decision of the position of the cargo item concerned. If the height of the candidate point,
4.2.6 Candidate List Optimization
After calculation of the optimal loading position of a cargo, the newly generated and previously accumulated candidate points may encounter situations shown in Fig. 6. Point P1 in Fig. 6 is one of the candidate points for Box 2. When Box 4 is additionally loaded on top of Box 3, as shown on the right side, P1 becomes infeasible due to Box 4, necessitating an adjustment to P2. Therefore, a verification and adjustment process are conducted for all the previously accumulated candidate points. Presence of objects above candidate points is recognized and the candidate point’s coordinates are adjusted so that there is no object above it making it infeasible.
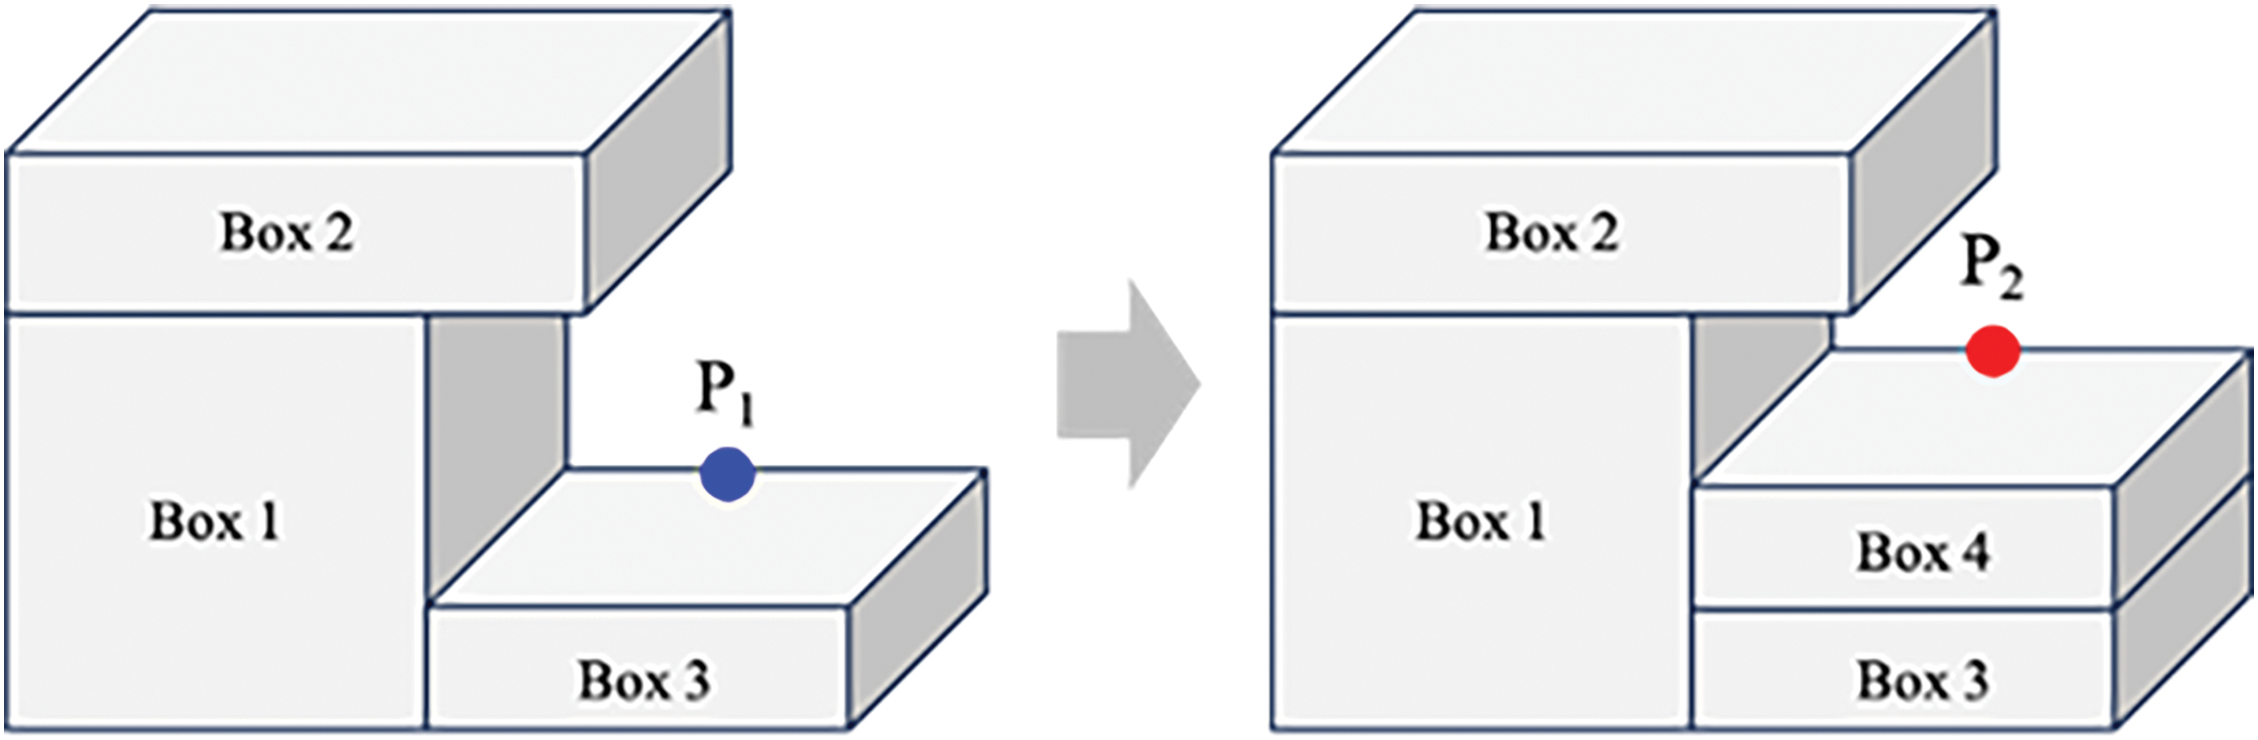
Figure 6: Demonstration of the candidate list optimization process
The pseudocode of the candidate list optimization algorithm is presented in Algorithm 4. For individual points in the updated candidate point list L, the space above the candidate point is examined.

Experiments based on 300 virtually generated cargo items and 6 real-world loading scenarios were conducted for evaluation of the proposed CLA-CTLS. The CLA-CTLS was compared against the 3-Dimensional Vehicle Loading Algorithm [15]. The 3D Vehicle Loading Algorithm is a loading algorithm applicable to conveyor-type loading systems, and proceeds the loading optimization based on logic trees, without the cargo multiplexing and discrete derivative-based candidate initialization features provided in the CLA-CTLS. Mathematical programming models were not implemented in the experiments due to the limitation of their capabilities to deal with real-world, large-scale instances. Different evaluation metrics for both space utilization assessment and dynamic stability assessment were used to quantify the performance of the algorithms under different scenarios.
The algorithm and the experiments were implemented using Python 3.10. The device utilized during the experiment consisted of an AMD Ryzen 7 7800X3D central processing unit and an NVIDIA RTX 3060 12 GB graphic processing unit.
The numerical evaluation process of the CLA-CTLS involves assessment of the quality of the loading solution calculated by the algorithm. The metrics involved evaluate the spatial efficiency and the dynamic stability of the loading solution. Evaluation of the spatial efficiency helps ensure that the loaded cargo utilizes the loading space effectively and minimizes wasted space. Evaluation of the dynamic stability quantifies the stability of the loaded structure of the cargoes during the actual transportation process.
5.2.1 Space Utilization Evaluation
This study introduced three distinct metrics for evaluating space utilization. Among these, the space utilization rate stands out as a crucial indicator of spatial efficiency, playing a vital role in optimizing loading plans within the logistics and transportation sectors. By quantifying how efficiently the available loading space is being used, the space utilization rate allows us to numerically assess the performance of various loading algorithms. This quantitative assessment is essential for identifying areas of improvement and for making meaningful comparisons between different algorithms. Ultimately, enhancing the space utilization rate can lead to more efficient use of resources, cost savings, and improved operational performance in logistics and transportation.
Volume Utilization
The fundamental evaluation metric for assessing the efficiency of a loading solution is Volume Utilization. Volume Utilization is defined as the ratio between the actual volume of the loaded cargo and the total capacity of the loading space. This metric provides a clear and quantitative measure of how effectively the available space is being used, which is crucial for optimizing loading plans and achieving higher operational efficiency. Various studies on loading optimization have adopted volume utilization as a key performance indicator to evaluate the effectiveness of their proposed algorithms. By examining volume utilization, researchers can gain valuable insights into the performance of different loading strategies and identify areas for improvement. In Eq. (4), which is the mathematical expression of volume utilization metrics,
Due to the unique problem situation addressed in this study, modifications were necessary to ensure precise evaluation and comparison of the proposed algorithm under various loading scenarios. The algorithm proposed in this study operates under the assumption that all cargo can be accommodated within the loading space, as it is presumed to have sufficient capacity. As a result, when applying the traditional space utilization metric, the same value will consistently be derived regardless of the actual positions of the loaded cargo. This limitation stems from the assumption that the total volume of the loading space is always fully utilized.
To address the limitations of the volume utilization metric and to provide a more accurate assessment of loading efficiency, a new space utilization metric is introduced. This new metric takes into account the specific arrangement and positioning of the cargo within the loading space, providing a more nuanced evaluation of how effectively the space is being used. By incorporating these modifications, the study aims to offer a more comprehensive and precise evaluation of the proposed algorithm’s performance across different loading scenarios, ultimately leading to more efficient and optimized loading solutions.
EP-Based Volume Utilization
When considering a conveyor belt-type loading system, any empty spaces between different cargoes are regarded as dead space that cannot be utilized. Consequently, a correction process to mark the dead space is required to accurately assess loading efficiency. The modified space utilization rate is defined as the ratio between the space occupied by the cargo plus the dead space volume and the net capacity of the loading space, considering the maximum loading height limit.
As presented in Eq. (5),
This approach ensures a comprehensive evaluation of loading efficiency, enabling better optimization of loading plans and improved utilization of available space. It addresses the limitations of traditional volume utilization metrics by considering the actual spatial arrangement and constraints within the loading environment, thereby offering a more precise and meaningful assessment of loading performance.
Volume Projection Rate
The concept of dead space allows for an efficient quantification of space utilization while taking into account the characteristics of conveyor-type loading systems. However, the net volume of dead space does not always match the volume of the loading space that can be utilized by the loading system. For a more accurate calculation of the actual dead space that cannot be used for loading actions, a novel projection-based volume utilization metric was developed.
The newly developed Volume Projection Rate metric quantifies the dead volume of the loading space based on the projection of the loaded cargo structure onto the yz-plane. Extreme points for the projected area are determined and utilized during the Volume Projection Rate calculation process. Eq. (6) demonstrates the full statement of the formula for calculating the Volume Projection Rate of a target loading solution. Here, the term
This approach enables a more accurate assessment of dead space by considering the actual spatial constraints and characteristics of conveyor-type loading systems. By quantifying the dead space more precisely, the Volume Projection Rate metric provides a better understanding of the space utilization efficiency and helps identify opportunities for optimization in loading plans.
5.2.2 Dynamic Stability Evaluation
Two different types of dynamic stability evaluation metrics were introduced in this study. Dynamic Stability evaluates the stability of the cargoes during the transportation process and ensures that the cargoes are fixed to their positions.
Touching area is the net surface area of a cargo adjacent to other cargoes or the boundaries of the loading space defined. Larger touching area minimizes the movement caused by transportation activities and contributes to prevention of cargo damaging and safety issues. Since the touching area of a cargo is directly correlated to the dynamic stability of a loading system, evaluation metrics based on touching area are developed to properly quantify the level of dynamic stability a loading system can offer.
Previous works on evaluation of the dynamic stability of loading systems directly utilized the touching area of the loaded cargoes. Junqueira et al. [19] formulated the vertical stability and the amount of support present between vertically adjacent cargoes. Zhu et al. [20] proposed a loading algorithm considering the touching area of the cargoes for the 3-dimensional Cargo Loading Problem. The objective of the algorithms was to minimize the transportation cost while maximizing the net touching area. Increased touching area increased the amount of support present between vertically adjacent cargoes and lowered the amount of pressure applied to the top surface of the stacked cargo.
M2
The dynamic stability of a cargo is directly correlated to the number of sides supported by other structure. For prevention of cargo movement during transportation processes, three or more out of four sides of a cargo should be supported by other cargoes or the boundaries of the loading space [21]. The M2 metric quantifies the dynamic stability of a loading system based on the proposed concept of side support.
A mathematical expression of the calculation process of the M2 metric is provided in Eq. (7). Referring to the set of items as I,
Direct Side Contact
Potential issues regarding the implementation of the aforementioned M2 metric under real-world loading scenarios are present. Additional conditions are introduced to further enhance the M2 metric and to develop a dynamic stability metric more suitable to real loading scenarios. The proposed Direct Side Contact evaluation metric considers not only the number of the sides of a cargo being support but also the proportion of the side area being supported by other structures. The ratio of the cargoes receiving sufficient amount of support to the total number of cargoes is given as the quantification value of dynamic stability. In this study, the proportion value of 0.75 was used for calculation of Direct Side Contact.
Eq. (8) represents the formulation of the Direct Side Contact metric. Being similar to the mathematical expression of the M2 metric, the set of items is referred to as I and
The cargo dataset generated for the experiments consists of 300 individual cargoes. 6 separate delivery zones were introduced and the optimal delivery routing order was determined using the mathematical programming model introduced in Appendix A. Specific volumetric information of the cargo dataset are listed in Appendix B.
Six real loading environment-based scenarios were utilized for the experiments, with the first scenario representing a scenario where cargoes are loaded into an empty loading space. The rest of the scenarios consist of preloaded cargoes, and numerical evaluation results of the proposed loading algorithm’s performance on the scenarios were compared against a baseline loading algorithm. The original loading space of the test scenarios are demonstrated in Fig. 7. The state information of the loading space was converted into voxelated data with the conveyor-type cargo loading system. The voxelated information of the original loading space were set as the test scenarios, which were utilized as the input data of the proposed CLA-CTLS.
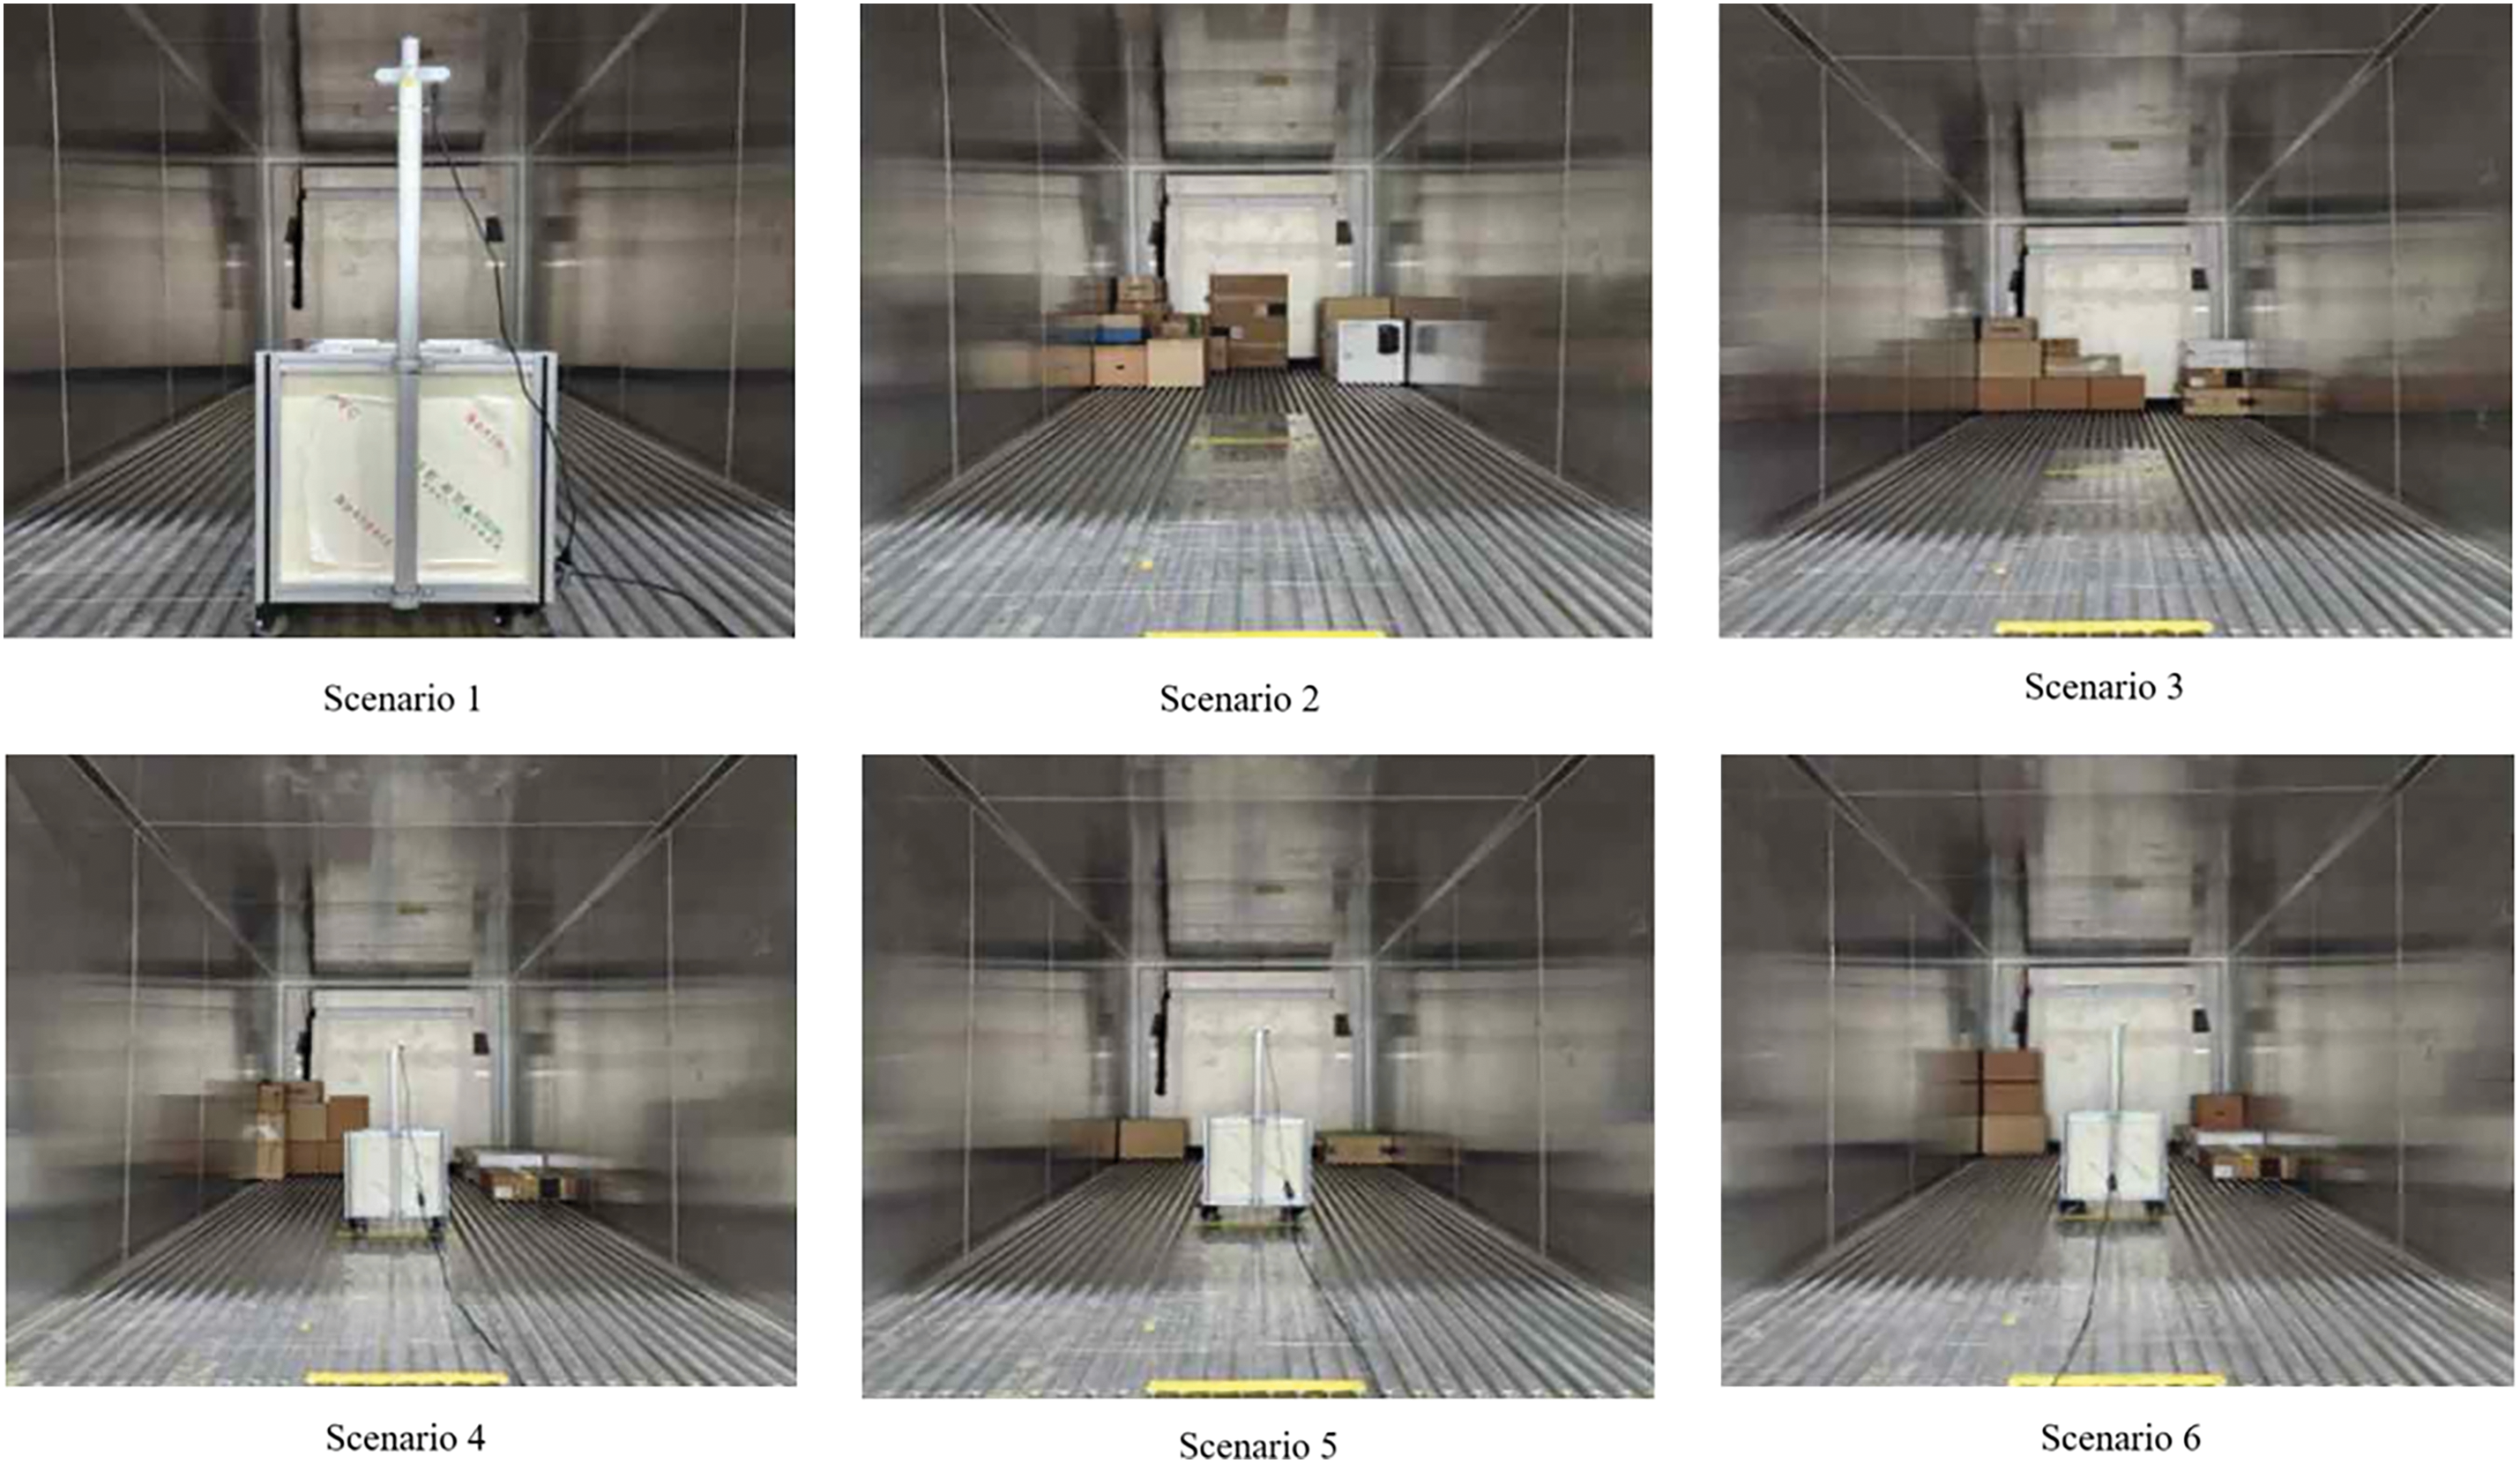
Figure 7: The original loading space of the test scenarios
Numerical evaluation results on the performance of the two loading algorithms are provided. The numerical comparison was conducted with only the 3D-VLA proposed by Ryu et al. [15], due to the limitations of the research scope of related works and their incapability to deal with the automated conveyor-type loading system, or even ordinary multi-drop delivery scenarios. As described in Section 2: Related Works, studies conducted by Huang et al., Safak and Erdogan, Phongmoo et al., and Jiao et al. have not considered the cargo packaging, which may lead to severe damaging of cargoes packed with fragile material [11–14]. The algorithm proposed by Jiao et al. is capable of determining appropriate delivery routing orders required in multi-drop scenarios, but the study assumes that individual cargoes are packed in advanced onto pallets. Consequently, the loading decisions and order determinations made by the algorithm lacks the ability to make decisions on the loading priorities of individual cargoes, not being suitable for Business-to-Consumer logistics environments with small quantities of high variety of items [14]. All the others are capable of making priority decisions during the loading sequence determination process but assumes single drop scenarios only, again making them unsuitable for Business-to-Consumer logistics environments.
The time consumption of a loading algorithm is a critical characteristic that must be considered in the deployment of an algorithmic solution in real-world logistics operations. In high-pressure environments best noted by distribution centers, where efficiency of the logistics operation is paramount, the time complexity of an algorithmic solution may significantly impact the overall performance of the system. Table 2 provides a detailed comparison of the runtime performance of different algorithms across various experiment scenarios.
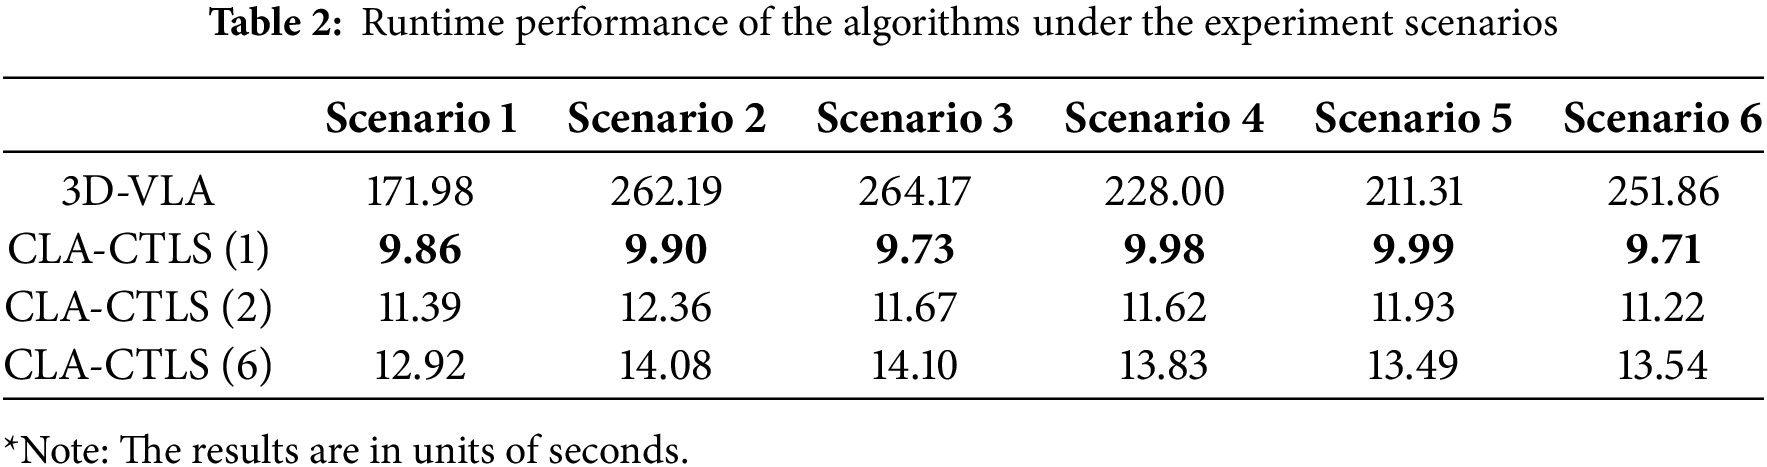
The proposed CLA-CTLS demonstrated a remarkable improvement in time complexity and was able to find the loading solution of the given scenarios in under 15 s, providing a speedup of over 160 s across all scenarios when compared to the 3-Dimensional Vehicle Loading Algorithm (3D-VLA).
The 3D-VLA required over 210 s of computation time for the five scenarios involving preoccupied loading spaces where the complexity of the loading problem is higher. The extended computation time demonstrated in the experiment may introduce intolerable delays in logistics operations, potentially resulting in increased net idle time of the system, delayed deliveries and insufficient exploitation of the available resources.
On the other hand, the computation time of the CLA-CTLS is not limited to the introduced baseline performance. A trade-off between time complexity and multiplexing level exists, and the computation time could further be reduced by adjusting the level of cargo multiplexing applied during the loading simulation process. The flexibility present in the cargo multiplexing process of the CLA-CTLS enables tailoring of the algorithm’s performance to specific needs, allowing for shifts in the focus of the operation between latency and optimality. Compared to the 15 s baseline performance demonstrated under full level of cargo multiplexing, the CLA-CTLS required no more than 10 s of computation time if the multiplexing process was bypassed, loading the cargoes without considering any rotations just as the 3-dimensional Vehicle Loading Algorithm would.
6.2 The Candidate Point Initialization Algorithms
The runtime comparison of the candidate point initialization algorithms employed by the two different loading algorithms is presented in Table 3. The table provides computational performance metrics with two key measurements: (1) the computation time (in seconds) required to identify initial candidate points, and (2) the total number of initial candidate points generated by each algorithm. Both algorithms yielded identical candidate point configurations, underscoring their algorithmic consistency. The primary distinguishing factor is computational efficiency, a critical consideration in logistics operations where time optimization is paramount.
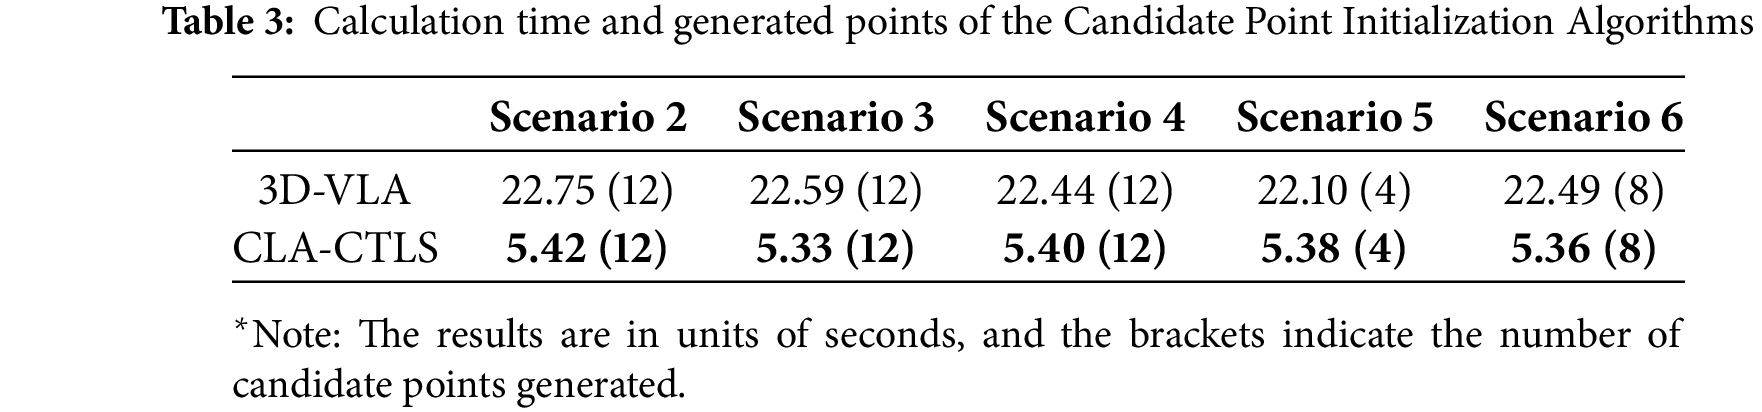
The first scenario was excluded from the experiment as it involved an empty loading space, a trivial case where both algorithms would immediately return the origin coordinate (0, 0, 0) as the sole initial candidate point without requiring complex computational procedures. By omitting this scenario, the analysis focuses on more substantive and informative loading configurations that meaningfully demonstrate the algorithms’ performance characteristics.
In the remaining five experimental scenarios, the logic tree-based candidate point initialization algorithm consistently required more than 20 s to complete its calculations. This extended runtime stems from the algorithm’s structural inefficiency, which mandates executing an identical decision process for every voxelized point present in the loading space. While this approach ensures a comprehensive scanning of the space with no risk of overlooking potential regions, it proves computationally expensive compared to the discrete derivative-based candidate point search method employed in the CLA-CTLS.
In contrast, the proposed discrete derivative-based candidate point search method demonstrated a remarkable improvement in time complexity, completing the search process in less than 6 s across all scenarios. This method leverages the mathematical properties of discrete derivatives to identify spatial characteristics of the loading space, enabling rapid candidate point identification. By strategically utilizing derivative-based calculations, the algorithm drastically reduces the number of logical decision processes required to identify candidate points.
Consequently, the transition from a logic tree-based search to a discrete derivative-based search represents a substantial advancement in candidate point initialization algorithm performance. This methodological shift dramatically reduced the computation time for the initialization process, with a reduction of approximately 70%–75% in processing time. Critically, this performance improvement occurred without any compromise to the accuracy or quality of the algorithmic solutions. The discrete derivative-based search method efficiently identified all candidate points that the logic tree-based search method could detect, ensuring solution equivalence while significantly enhancing computational efficiency.
The notable reduction in algorithm runtime has significant implications for real-world logistics operations. By enabling the candidate point initialization process to be completed in under 6 s, the overall loading algorithm also benefits from the reduced computation time and the perfectly preserved solution quality ensures that the CLA-CTLS does not compromise the ultimate loading quality represented by the dynamic stability and space utilization for faster processing.
6.3 Space Utilization Evaluation
Space Utilization of the loading solutions generated by the two algorithms was evaluated based on the introduced space utilization metrics. Volume Utilization was intentionally discarded in this study due to the specific problem situation. Given the constraints regarding the scenarios considered, the volume utilization metric would not be able to provide any distinction between different algorithmic results under equivalent loading space.
Table 4 presents a detailed comparison of the EP-Based Volume Utilization and Volume Projection Rate achieved by the loading solutions generated by the 3D-VLA and the CLA-CTLS. The comparative analysis between the 3D-VLA and the CLA-CTLS without multiplexing revealed that the solutions generated by the two algorithms produced almost identical space utilization except in Scenario 5, where the CLA-CTLS outperformed the 3D-VLA by an impressive margin of 8 percentage points.
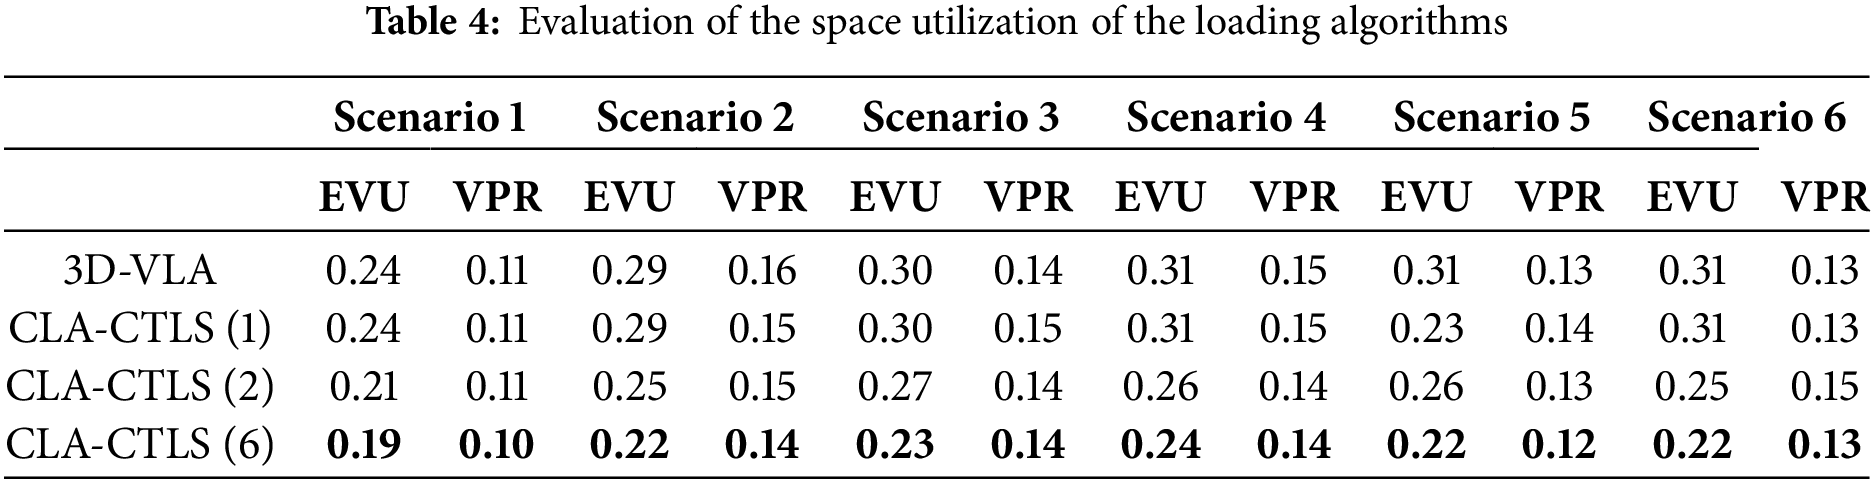
The impact of the multiplexing procedure on the space utilization efficiency of the CLA-CTLS algorithm was further examined. The multiplexing procedure, which involves consideration of multiple orientations and rotations of cargo items during the loading process, was shown to significantly enhance the algorithm’s ability to make better utilization of the available loading space.
The numerical effect of the multiplexing procedure on the space utilization efficiency of the loading algorithm was shown in all experiment scenarios. A higher level of multiplexing, in general, allowed the CLA-CTLS to achieve superior space exploitation by ensuring that each cargo item was optimally oriented and placed within the available space with the least amount of consequent dead space generated. This was evident across all experimental scenarios, where the application of multiplexing generally improved the performance of the CLA-CTLS. The CLA-CTLS with the highest level of multiplexing (6 rotations considered) outperformed all other loading algorithms across all scenarios.
6.4 Dynamic Stability Evaluation
The dynamic stability of the two loading algorithms was compared using the introduced M2 and Direct Side Contact metrics, both of which were introduced to provide a comprehensive evaluation of the algorithm’s performance under dynamic conditions. Validation of the effectiveness of the proposed Direct Side Contact metric in real-world loading scenarios was also an objective. By employing both M2 and Direct Side Contact metrics, this study aimed to numerically express the capabilities of the loading algorithms to keep the cargoes undamaged under stresses and movements encountered during transportation.
Table 5 presents the quantified values of dynamic stability for the loading solutions generated by the algorithms across six distinct experimental scenarios. The comparison includes four types of loading algorithms implemented, evaluating the dynamic stability each can achieve. Algorithms with lower dynamic stability can come with unstable loads which lead to cargo damage, increased safety risks, and higher logistics operational costs.
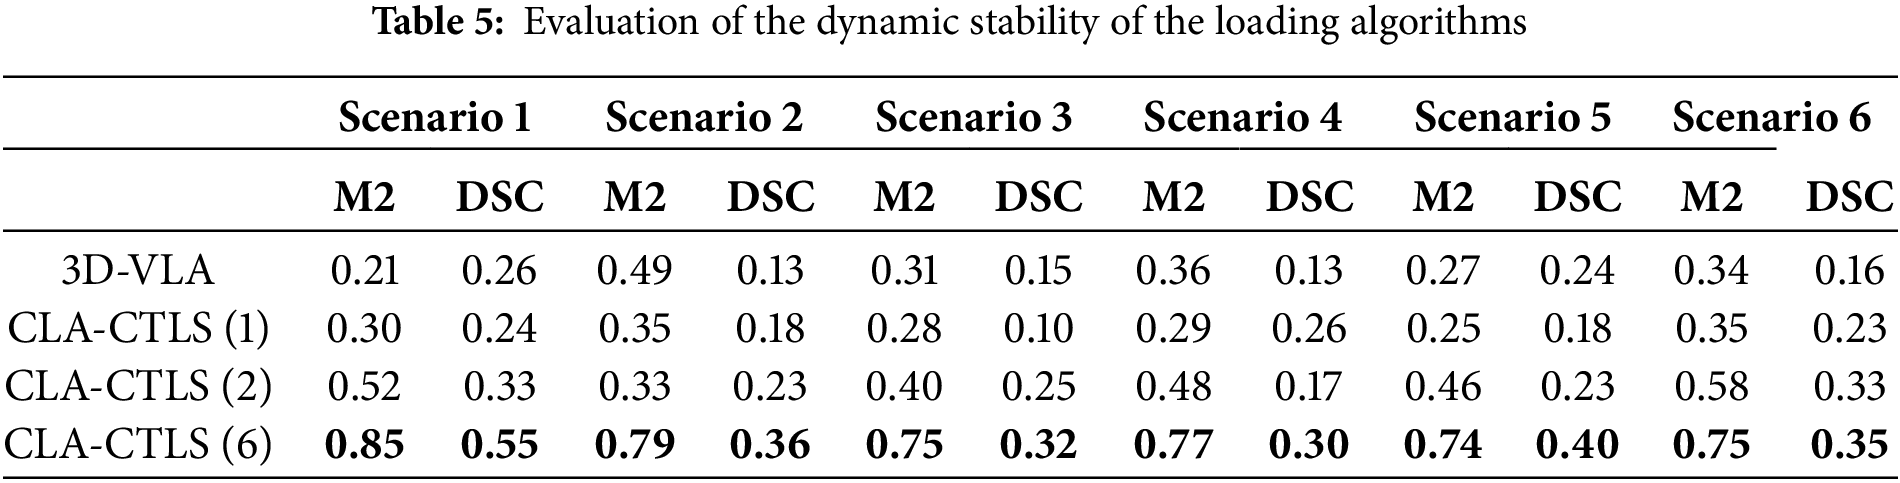
Among the loading algorithms implemented, the loading solutions generated by the CLA-CTLS with the highest level of multiplexing (6 rotations considered) consistently delivered the highest dynamic stability across all experimental scenarios. This superior performance can be attributed to the algorithm’s ability to optimize the loading position of the cargo not only in terms of space utilization efficiency but also in terms of their stability during transportation. By examining multiple orientations and making selections based on the calculation results minimizes the likelihood of movement of cargoes, ensuring that the cargoes are securely positioned throughout the transportation process.
This study proposes a novel automatic loading optimization algorithm to support the unmanned operation of conveyor-type loading systems based on automation robots. Our primary aim was to enhance the adaptability, flexibility, and robustness of the loading optimization method, yielding positive effects in complex and dynamic logistics environments.
The Business-to-Consumer logistics environment, particularly in South Korea, is highly sophisticated compared to Business-to-Business logistics. Small quantities of diverse goods are demanded, with each item varying in type, size, and weight. This variability complicates the problem and limits the capabilities of conventional optimization methods to resolve loading-related issues in a reasonable amount of time. Given that latency is critical in the logistics industry, our proposed algorithm significantly reduces calculation time by utilizing the concept of discrete derivatives. Replacing the decision tree-based search process, the algorithm is capable of processing cargo swiftly while maintaining solution quality.
We introduced variables that represent real-world logistics conditions and formulated constraints to enhance the algorithm’s capability to handle arbitrary, rapidly changing real-world loading scenarios. By considering the uncertainty present in loading scenarios and the occupancy status of the loading space, we ensured a consistent loading process. For dynamic stability, we introduced height constraints and determined the optimal loading order based on cargo packaging types.
We also proposed novel quality evaluation metrics for better assessment of the algorithm’s performance. The Volume Projection rate and Direct Side Contact metrics allow for a quantitative assessment of space utilization efficiency and dynamic stability. Our approach significantly enhances efficiency, stability, and transportation safety in the automated logistics industry.
Moreover, our proposed algorithm addresses a critical challenge in the South Korean Business-to-Consumer logistics sector, which heavily depends on labor expertise for loading processes. This reliance results in high variability in loading quality, increased risk of errors, and potential delays, affecting customer satisfaction. Our automated optimization standardizes the loading process, reducing human error and variability. By providing consistent, scientifically-optimized loading strategies, we can increase overall operational efficiency, achieve more predictable loading performance, reduce training overhead, and realize cost savings through optimized space utilization.
The algorithm offers an automated loading scheme that adapts to diverse scenarios, improving the overall quality and reliability of logistics operations. It serves as a decision support tool that complements human expertise rather than replacing it. Our experiments demonstrate the algorithm’s robustness across varied conditions, indicating its potential for widespread application in dynamic Business-to-Consumer logistics environments.
In conclusion, the loading algorithm developed in this study is capable of flexibly addressing various types of cargo and loading vehicles in real-world logistics systems. Although our algorithm considers mechanical characteristics to enhance solution quality, unforeseen scenarios may still arise. We recommend further studies to include additional considerations for worst-case scenarios and other uncertainties or disturbances to enhance the robustness of the automated loading system.
Acknowledgement: None.
Funding Statement: This research was supported by the BK21 FOUR funded by the Ministry of Education of Korea and National Research Foundation of Korea, a Korea Agency for Infrastructure Technology Advancement (KAIA) grant funded by the Ministry of Land, Infrastructure, and Transport (Grant 1615013176), and IITP (Institute of Information & Coummunications Technology Planning & Evaluation)-ICAN (ICT Challenge and Advanced Network of HRD) grant funded by the Korea government (Ministry of Science and ICT) (RS-2024-00438411).
Author Contributions: The authors confirm contribution to the paper as follows: study conception and design: Byungduk Song, Sang-Duck Lee; Data collection: Young Tae Ryu, Sang-Duck Lee; Analysis and interpretation of results: Hyeonbin Jeong; Draft manuscript preparation: Hyeonbin Jeong and Young Tae Ryu. All authors reviewed the results and approved the final version of the manuscript.
Availability of Data and Materials: The authors confirm that the data supporting the findings of this study are available within the article and its supplementary materials.
Ethics Approval: No human or animal subjects were included in this study.
Conflicts of Interest: The authors declare no conflicts of interest to report regarding the present study.
Appendix A MILP Formulation of the VRP
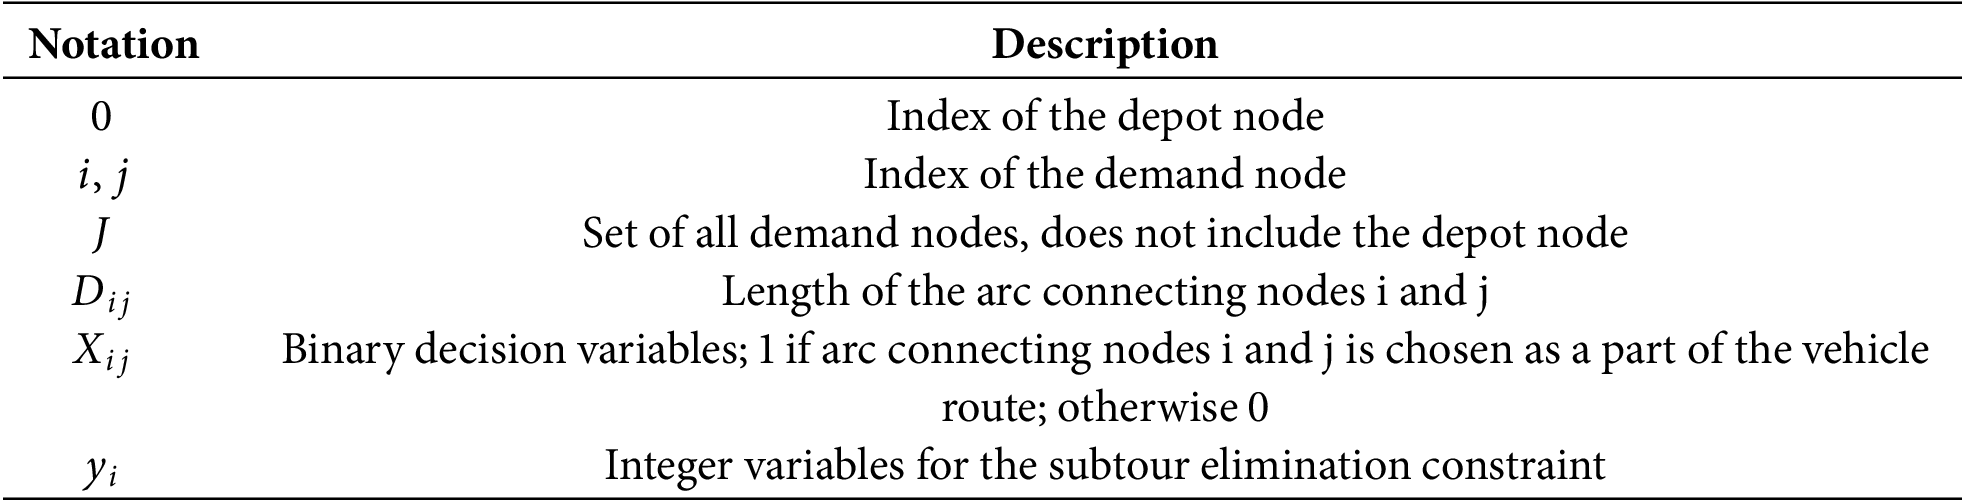
The objective of the MILP model for the vehicle routing problem is to minimize the total distance traveled by the vehicle. Eqs. (A2) and (A3) ensure that every demand node has exactly one incoming arc and one outgoing arc. Eq. (A4) is the flow conservation constraint regarding the vehicle’s tour. Eqs. (A5) and (A6) ensure that the tour of the vehicle begins at the depot and ends at the depot. Eq. (A7) contributes to subtour elimination, and Eqs. (A8) and (A7) restrict the domain of the decision variables.
Appendix B Volumetric Information of the Cargo Dataset
References
1. Administration IT. Impact of COVID pandemic on eCommerce. 2021 [cited 2025 Jan 08]. Available from: https://www.trade.gov/impact-covid-pandemic-ecommerce. [Google Scholar]
2. Korea logistics market review. 2023 [cited 2025 Jan 08]. Available from: https://www.genstarmate.com/kr/sub/research/view.asp?b_idx=6409&page=&stype=&s_keyword=&s_cate=%EB%AC%BC%EB%A5%98. [Google Scholar]
3. Korea S. Economically active population survey | Employment and labour | Survey outline: statistics Korea. 2014 [cited 2025 Jan 08]. Available from: https://kostat.go.kr/menu.es?mid=a20204010000. [Google Scholar]
4. DHL. Delivering insight today, creating value tomorrow. 6.0 DHL trend research [cited 2025 Jan 08]. Available from: https://www.dhl.com/content/dam/dhl/global/csi/documents/pdf/csi-logistics-trend-radar-6-dhl.pdf. [Google Scholar]
5. Ministry of Land T Infrastructure, Tourism. The current situation surrounding logistics in Japan. 2022 [cited 2025 Jan 08]. Available from: https://www.meti.go.jp/shingikai/mono_info_service/sustainable_logistics/pdf/001_02_00.pdf. [Google Scholar]
6. Kilincci O, Medinoglu E. An efficient method for the three-dimensional container loading problem by forming box sizes. Eng Optim. 2021;5:1–16. [Google Scholar]
7. Bonet Filella G, Trivella A, Corman F. Modeling soft unloading constraints in the multi-drop container loading problem. Eur J Oper Res. 2023 Jul;308(1):336–52. doi:10.1016/j.ejor.2022.10.033. [Google Scholar] [CrossRef]
8. Rusdiansyah A, Adetio IR, Dewi RS. The development of the refrigerated-container loading problem model for perishable fishery products considering internal temperature distribution. Int J Syst Sci Oper Logist. 2022;3:1–16. [Google Scholar]
9. Gimenez-Palacios I, Alonso MT, Alvarez-Valdes R, Parreno F. Multi-container loading problems with multidrop and split delivery conditions. Comput Ind Eng. 2022 Dec;175:108844–4. doi:10.1016/j.cie.2022.108844. [Google Scholar] [CrossRef]
10. An optimization model for cargo container loading problems. Inf Sci Lett. 2023 Nov;12:2289–99. [Google Scholar]
11. Huang Y, Lai L, Li W, Wang H. A differential evolution algorithm with ternary search tree for solving the three-dimensional packing problem. Inf Sci. 2022 Aug;606(4):440–52. doi:10.1016/j.ins.2022.05.063. [Google Scholar] [CrossRef]
12. Safak O, Erdogan G. A large neighbourhood search algorithm for solving container loading problems. Comput Oper Res. 2023 Mar;154(2):106199–9. doi:10.1016/j.cor.2023.106199. [Google Scholar] [CrossRef]
13. Phongmoo S, Leksakul K, Charoenchai N, Boonmee C. Artificial bee colony algorithm with pareto-based approach for multi-objective three-dimensional single container loading problems. Appl Sci. 2023 May;13(11):6601–1. doi:10.3390/app13116601. [Google Scholar] [CrossRef]
14. Jiao G, Huang M, Yang S, Li H, Wang X. Container loading problem based on robotic loader system: an optimization approach. Expert Syst Appl. 2024 Feb;236:121222–2. doi:10.1016/j.eswa.2023.121222. [Google Scholar] [CrossRef]
15. Ryu YT, Song BD, Lee SD. Development of 3D loading algorithm for decision support in conveyor-type automated loading robots. Korean J Logist. 2024;32(3):1–17. [Google Scholar]
16. PORTER II [cited 2025 Jan 08]. Available from: https://www.hyundai.com/content/dam/hyundai/kr/ko/data/vehicles/catalog/en/porter2-electric-catalog-eng.pdf. [Google Scholar]
17. Gajda M, Trivella A, Mansini R, Pisinger D. An optimization approach for a complex real-life container loading problem. Omega. 2022 Feb;107(11):102559. doi:10.1016/j.omega.2021.102559. [Google Scholar] [CrossRef]
18. Olsson J, Larsson T, Quttineh NH. Automating the planning of container loading for Atlas Copco: coping with real-life stacking and stability constraints. Eur J Oper Res. 2020 Feb;280(3):1018–34. doi:10.1016/j.ejor.2019.07.057. [Google Scholar] [CrossRef]
19. Junqueira L, Morabito R, Sato Yamashita D. Three-dimensional container loading models with cargo stability and load bearing constraints. Comput Oper Res. 2012 Jan;39(1):74–85. doi:10.1016/j.cor.2010.07.017. [Google Scholar] [CrossRef]
20. Zhu W, Lim A. A new iterative-doubling Greedy-Lookahead algorithm for the single container loading problem. Eur J Oper Res. 2012 Nov;222(3):408–17. doi:10.1016/j.ejor.2012.04.036. [Google Scholar] [CrossRef]
21. Bischoff EE, Ratcliff MSW. Issues in the development of approaches to container loading. Omega. 1995 Aug;23(4):377–90. doi:10.1016/0305-0483(95)00015-G. [Google Scholar] [CrossRef]
Cite This Article
 Copyright © 2025 The Author(s). Published by Tech Science Press.
This work is licensed under a Creative Commons Attribution 4.0 International License , which permits unrestricted use, distribution, and reproduction in any medium, provided the original work is properly cited.
 Downloads
 Citation Tools