
 Submit a Paper
 Propose a Special lssue
 Open Access
ARTICLE

Enhancing Safety in Electric Vehicles: Multi-Tiered Fault Detection for Micro Short Circuits and Aging in Battery Modules
1 Graduate Institute of A.I. Cross-disciplinary Tech, National Taiwan University of Science and Technology, Taipei, 106335, Taiwan
2 Energy and Sustainability Tech, National Taiwan University of Science and Technology, Taipei, 106335, Taiwan
3 Department of Electrical Engineering, National Taiwan University of Science and Technology, Taipei, 106335, Taiwan
* Corresponding Author: Yi-Feng Luo. Email:
(This article belongs to the Special Issue: Advanced Artificial Intelligence and Machine Learning Methods Applied to Energy Systems)
Computer Modeling in Engineering & Sciences 2025, 142(3), 3069-3087. https://doi.org/10.32604/cmes.2025.061180
Received 18 November 2024; Accepted 22 January 2025; Issue published 03 March 2025
 View Full Text
 Download PDF
Abstract
This article proposes a multi-tiered fault detection system for series-connected lithium-ion battery modules. Improper use of batteries can lead to electrolyte decomposition, resulting in the formation of lithium dendrites. These dendrites may pierce the separator, leading to the failure of the insulation layer between electrodes and causing micro short circuits. When a micro short circuit occurs, the electrolyte typically undergoes exothermic reactions, leading to thermal runaway and posing a safety risk to users. Relying solely on temperature-based judgment mechanisms within the battery management system often results in delayed intervention. To address this issue, the article develops a multi-tiered fault detection algorithm for series-connected lithium-ion batteries. This algorithm can effectively diagnose micro short circuits, aging, and normal batteries using minimal battery data, thereby improving diagnostic accuracy and enhancing the flexibility of fault detection. Simulations and experiments conducted under various levels of micro short circuits validate the effectiveness of the algorithm, demonstrating its ability to distinguish between short-circuited, aged, and normal batteries under different conditions. This technology can be applied to electric vehicles and energy storage systems, enabling early warnings to ensure safety and prevent thermal runaway.Keywords
Nomenclature
| BMS | Battery management system |
| MSC | Micro short circuits |
| DBSCAN | Density-based spatial clustering of applications with noise |
| RCC | Remaining charge capacity |
| MDM | Mean difference model |
| Z-score | Standard score |
| ΔSOC | Battery capacity difference |
| OCV | Open-circuit voltage |
| RLS | Recursive least square |
| SOC | State of charge |
| SOH | State of health |
Due to the high energy and power density, long cycle life, and other advantages, lithium-ion batteries are favored by various energy storage devices. Currently, mainstream electric vehicle manufacturers are using lithium-ion batteries with even higher energy and power density as a crucial driving force for expanding the electric vehicle market [1,2]. However, the battery pack of electric vehicles is very large and aims to achieve high energy and power density. As a result, the safety of lithium-ion batteries has become a significant concern, requiring improvement from multiple aspects, such as the use of safe positive electrode materials, improved flame retardant colloidal electrolytes, and solid electrolytes. Despite these efforts, lithium-ion batteries still have safety issues.
In 2016, a well-known smartphone (Samsung Note 7) was recalled and banned only a few months after being released [3]. This was due to design and manufacturing defects in batteries from two different suppliers, which caused the electrodes in the upper right corner of the battery to bend, weakening the separation between the positive and negative electrodes and leading to gradual micro short circuits [4–7]. To address manufacturing defects, insulation tape should be used to cover any battery insulation losses. Thin separators and protrusions inside the battery can cause the positive and negative poles to gradually connect, resulting in battery fires upon electrode contact. Unfortunately, in recent years, there have also been some spontaneous combustion accidents related to electric energy storage equipment worldwide, with most of these accidents attributed to thermal runaway [8,9]. The occurrence of battery micro short circuits within the battery pack is considered the root cause of such thermal runaway [10]. Therefore, to ensure the safety, reliability, and lifespan of the battery, it is essential to prevent micro short circuits. This can be achieved by implementing appropriate design and manufacturing measures, strengthening quality control, and implementing an effective monitoring and safety control system to minimize the occurrence of micro short circuits and ensure the safe operation of batteries.
Currently, the diagnostic method used in electric vehicle battery management systems is the threshold comparative law method with delay time [11–13]. If the battery parameters sensed within the delay time fall within the set fault threshold, a fault can be detected. However, the diagnostic parameters are mostly fixed values, and this presents a challenge in calibrating the threshold comparative law. For instance, setting a long delay time may result in delayed detection of faults, such as load short circuits with a large parameter change slope. Conversely, setting a short delay time may lead to overly sensitive detection of minor abnormalities, affecting the battery’s stability. Additionally, as the number of cycles of the power battery increases, the battery’s characteristics change, and relying on a constant fault diagnosis threshold may lead to untimely diagnosis after battery aging.
Additionally, many studies have proposed methods for detecting battery micro short circuits. For instance, the density-based spatial clustering of applications with noise (DBSCAN) algorithm is a density-based clustering algorithm that offers advantages such as low computational complexity and low judgment quantity, effectively improving diagnostic efficiency [14–17]. The local-outlier detection method identifies faulty batteries by evaluating the resultant force between current data points [18]. The remaining charge capacity (RCC) detection method estimates internal short-circuited batteries based on their remaining charge time, though it is not applicable when the internal short circuit is too severe [19,20]. The mean difference model (MDM) algorithm calculates the difference between battery parameters and average battery parameters to estimate the battery identification parameters and detect internal short-circuited batteries based on equivalent impedance differences [21,22]. The standard score (Z-score) algorithm diagnoses abnormalities by comparing the internal resistance of aging batteries with that of other batteries [23]. The battery capacity difference (ΔSOC) detection method calculates the current internal short-circuit resistance value by assessing the capacity difference and open-circuit voltage (OCV) between batteries [24,25]. However, these algorithms are limited to specific diagnoses within a battery module. For example, the DBSCAN algorithm can only identify faulty batteries; the MDM algorithm can only detect internal short-circuited batteries; the Z-score algorithm can only identify aging batteries; and the ΔSOC detection method requires complete charge-discharge data for calculation and analysis.
Therefore, more effective methods are needed to assist the battery management system in avoiding micro short circuits in batteries. As a solution, this article proposes a multi-tiered fault detection algorithm for detecting faulty batteries, making the diagnosis system more efficient, convenient, and accurate, thus assisting the battery management system effectively. This article utilizes the improved recursive least square (RLS) algorithm [26–29] to compute the parameters of the battery model [30–33] in real-time, integrating the MDM algorithm and the Z-score algorithm to enhance detection limitations. The improved recursive least square_mean difference model (Improved RLS_MDM) is the MDM algorithm based on RLS; the battery capacity difference (Uoc_ΔSOC) is the difference in battery capacity fitted with the open circuit voltage curve ΔSOC detection method; and the improved recursive least square_standard score (Improved RLS_Z-Score) is an RLS-based Z-score algorithm. These algorithms and battery models will be introduced in the following sections.
2 Introduction to Battery Short Circuits
Lithium-ion batteries may face security risks in both external and internal short circuits. External short circuits may be caused by flooding, collision deformation, or leakage and balance failure of voltage measurement connections, which can lead to direct short circuits between electrodes, thereby jeopardizing the safety of the battery. Internal short circuits are caused by impurities in the metal, the penetration of clay crystal membranes, and problems in the manufacturing process. These internal failures can lead to battery overheating, accelerated degradation, and heat out of control, posing a threat to user safety [4,5].
Micro short circuits in batteries are discussed in this article. Internal short circuits can lead to additional current leakage, causing more power to be released during discharge and less to be absorbed during charging. As shown in Fig. 1a, in batteries with internal short circuits, the state of charge rises more slowly during charging and decreases faster during discharge. A more noticeable difference in state of charge (SOC) is observed during multiple charge-discharge cycles. These features help us understand and respond to the impact of internal short circuits on battery module safety. Depending on the characteristics of the internal short circuit, the positive and negative ends of the battery are validated through simulation and experimental verification, as shown in Fig. 1a,b. To simulate the internal short circuits of batteries, the severity is based on the size of the linked impedance.

Figure 1: (a) The SOC of series-connected batteries at charging and discharging, (b) Internal short circuit battery diagram
In practical applications, individual cells within a battery module may be affected by non-uniform temperature fields, and there may be internal resistance differences between cells. These factors can lead to changes in the electrochemical parameters of the batteries, thereby affecting overall charging voltage behavior. Therefore, when designing battery management systems, in addition to considering internal battery short circuits, it is also necessary to consider the challenges posed by these coupling factors. The experiments in this study were conducted in a temperature-controlled chamber, with the ambient temperature maintained under constant conditions to minimize the impact of temperature variations. Furthermore, the battery module used was composed of batteries from the same batch, and the alternating current (AC) impedance differences between individual batteries were minimal. The data collected under these conditions provided a baseline for model construction and was suitable for algorithm verification under ideal conditions. Temperature and internal resistance differences affect electrochemical parameters such as battery reaction rates, and changes in these parameters directly influence voltage behavior during charging.
3 Battery Model of Improved-RLS
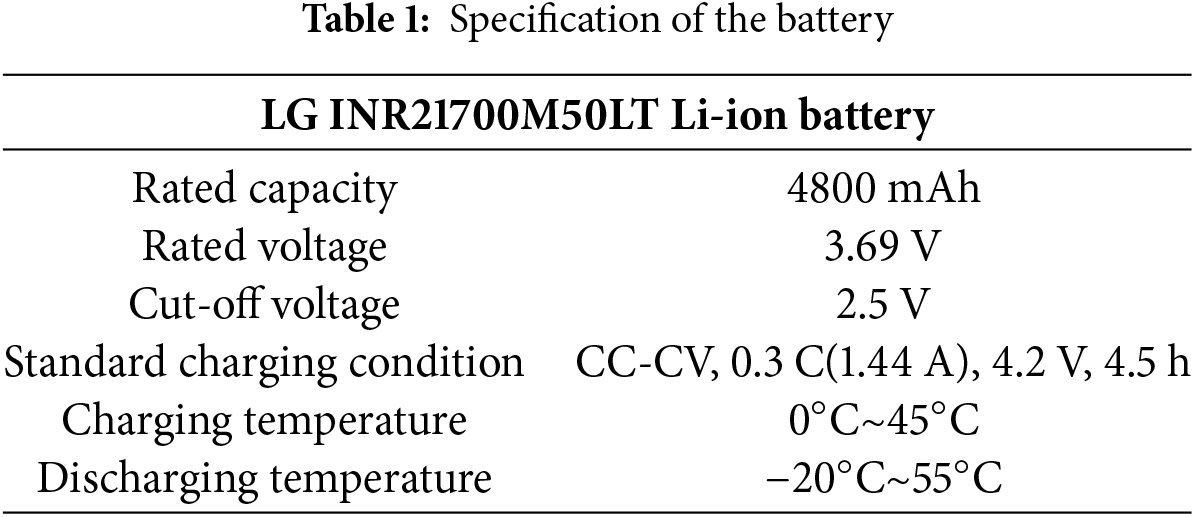
The 3R2C battery model at Fig. 2a is constructed using improved recursive least square (RLS) in this article [30–33]. Uoc represents the open circuit voltage of the battery, R0 represents the ohmic internal resistance of the battery, R1 and R2 represent the electrochemical polarization resistances of the battery, and C1 and C2 represent the electrochemical polarization capacitances of the battery. U1 and U2 are the terminal voltages of capacitors C1 and C2, respectively. I represents the load current, and UL represents the terminal voltage of the battery. The battery used in this article is the INR21700M50LT, manufactured by LG, with specifications as shown in Table 1 [34]. The RLS algorithm uses a recursive approach to find approximate solutions in systems. When equations contain numerous unknowns, the least squares method can be used to easily determine unknown data. The resulting data will have a minimal sum of squared errors compared to actual data [26–29]. RLS parameter recognition algorithm contains the Eqs. (1) to (3).

Figure 2: (a) Battery 3R2C diagram, (b) Charge and discharge experiment flowchart, (c) Curve fitting diagram
where k is the sampling time and also represents the estimated number of vector parameters that the RLS algorithm currently needs to process. At the k sampling moment,
With the electrochemical reaction inside the lithium-ion battery, the parameters of the battery change. In the process of RLS algorithm identification of battery parameters, if only one calibration in formula (2) is performed, the prediction error of the system parameters will be great, thereby affecting the accuracy of the battery parameter. This article employs an improved RLS algorithm that separately identifies parameters of the battery’s fast and slow dynamic response impedance to enhance real-time estimation accuracy. The improved RLS algorithm introduces a multi-timescale RLS scheme to separately process the cost functions of fast dynamic impedance (FDZ) and slow dynamic impedance (SDZ), enabling independent parameter identification through distinct regression functions, termed decoupled RLS (DRLS) [29].
To identify the parameters of a lithium-ion battery, it is necessary to know the open-circuit voltage (Uoc) and the terminal voltage (UL) of the battery. The terminal voltage can be directly measured, while the open-circuit voltage typically needs to be obtained through the relationship between the open-circuit voltage and the SOC, which is nonlinear. The SOC can be calculated using Coulomb counting [35]. In this article, the battery is charged using constant current-constant voltage (CC-CV) charging. After a one-hour rest period, a 0.3 C-rate constant current discharge is performed. After each 1% discharge, the battery rests for one hour, and the open-circuit voltage is recorded. The experimental procedure is shown in Fig. 2b. The recorded data is fitted using MATLAB’s cftool with a 9th-order polynomial curve fitting. The accuracy of the recorded open-circuit voltage values and the rest period determination are based on the definition of open-circuit voltage by Texas Instruments [36,37]. The relationship between the open-circuit voltage and the state of charge can be obtained as shown in Eq. (4), and the curve fitting is shown in Fig. 2c.
According to the above method, the relationship between the OCV and the SOC is obtained and entered into the MATLAB program. By combining this with the improved RLS equivalent circuit parameter identification method, the corresponding terminal voltage value can be obtained by updating the state of charge. This process allows for the identification of the 3R2C parameter model.
4 Multi-Tiered Fault Detection Algorithm
This article to improve the efficiency of detection methods in practical applications, diagnostic methods can be integrated, taking advantage of each detection method and integrating it into a multi-tiered fault detection algorithm. This greatly increases the accuracy of the detection method and reduces the computational complexity during the process. The flowchart of the multi-tiered fault detection algorithm is shown in Fig. 3.

Figure 3: Multi-tiered fault detection algorithm flowchart
The steps of each algorithm are as follows:
Step1. Battery Charging
First, Constant current charge is applied to a series of three batteries. If the terminal voltage of any one battery reaches the upper limit of 4.2 V, the charging process is paused, and the batteries rest for 1 h. During the charging and resting periods, the voltage and current information of each of the three batteries is recorded.
Step2. DBSCAN Algorithm [14–17]
The second step is the DBSCAN algorithm, which groups the per-second data of the battery during the charging and discharging process, such as terminal voltage and charging and discharging current data, using the density algorithm to label the problematic batteries. The problematic batteries include micro-short-circuit batteries and aged batteries.
DBSCAN is a density-based spatial clustering algorithm that accurately identifies clustering points. The basic process involves giving a set of data points in a certain feature space and setting the main parameters: eps and minPts, representing the radius and the minimum number of data points required to form the region. As shown in Fig. 4a, there are nine data points for DBSCAN clustering, where minPts is set to 4.

Figure 4: (a) DBSCAN illustration diagram, (b) Cluster analysis diagram of normal batteries, micro short circuit batteries, and aged batteries
It can be seen that the N point is an obvious outlier. There are no other data points in the neighborhood, and although B and C are located separately in their ε-neighborhoods, there are other data points in the neighborhood, but they do not meet the threshold of minPts 4, so they will not be added to the cluster. Additionally, although point A itself has an ε-neighborhood perspective, it does not meet the threshold of minPts 4, but in other cases where minPts 4 is met, ε-neighborhood has been discovered, so it will also be added to the clustering. In this article, the DBSCAN algorithm is used to utilize the battery terminal voltage obtained every second during the battery charging process as the dataset for the verification method. A DBSCAN calculation program is established using MATLAB, with the input parameter being the terminal voltage value. After setting two basic parameters, eps, and minPts, the clustering program operates and classifies multiple clusters, thereby classifying normal voltage groups and outliers.
Step3. MDM Algorithm Based on the Improved RLS [21,22]
Continuously detect whether the previously marked battery belongs to a micro short circuit battery. Due to the small number of batteries in this experiment, the battery judged as normal in the second step will still be included in the detection in the third step. In the third step, this study combines the improved RLS algorithm to obtain the 3R2C model parameters of the lithium-ion battery. Since the difference model can distinguish whether the battery has a micro short circuit, it can be compared with the data of the battery that was previously marked as normal and the data of the battery that has problems. After the average difference model, two parts can be divided, one is the micro short circuit battery, the other is the aged battery and the normal battery.
The identification of battery changes and balance are important conditions for the safety and efficiency of the battery pack. Due to the inconsistent manufacturing technology and uneven operating environment of the battery, real-time and accurate SOC estimation will determine the accuracy of the equivalent circuit of the battery module. Therefore, the equivalent circuit model with average difference is used, and the difference in battery terminal voltage and SOC is estimated by calculating the difference between battery parameters and average battery parameters to obtain the difference in equivalent impedance.
The battery differences in a battery pack include SOC differences, capacity differences, micro resistance differences, coulomb efficiency differences, and so on. This article estimates the differences in battery terminal voltage and open-circuit voltage by calculating the differences between the battery parameters and the average battery parameters to obtain the differences in equivalent impedance, as shown in Eqs. (5) to (7).
where Ui is the terminal voltage of the i-th battery and Umean is the terminal voltage of the average battery. Ei is the open circuit voltage of the i-th battery and Emean is the open circuit voltage of the average battery. Ri is the equivalent impedance of the i-th battery and Rmean is the equivalent impedance of the average battery.
Due to the presence of leakage current when there is a micro short circuit in the battery, it will continuously deplete the energy stored in the battery, leading to an abnormal decrease in SOC. The reduced SOC will further lead to a lower open circuit voltage. However, the impact of reduced SOC on micro resistance is complex, as there is a non-monotonic correlation between micro resistance and SOC. In this article, the MDM is used in the identification of equivalent circuit parameters based on improved RLS. The change of battery micro resistance caused by abnormal consumption of SOC due to micro short circuits and the impact on the abnormal reduction of open circuit voltage are derived by taking the terminal voltage and charging current of the battery during charging, and the SOC and open circuit voltage values are derived using the improved RLS algorithm. The average value of these parameters and the difference between the average value and the average value are calculated, and then the difference between the calculated average value and the average value is identified using the improved RLS parameters. The equivalent resistance value of the mean difference based on the average difference model can be obtained. By comparing it with other normal batteries, observe the difference in the resistance value, and then accurately identify the inconsistency of the battery SOC and classify whether it is a micro short circuit battery.
Step4. Z-Score Algorithm Based on the Improved RLS [23]
Although the DBSCAN algorithm can identify whether the battery is faulty, if there are aged batteries and micro short circuit batteries in the battery pack at the same time, the above methods cannot be used for detection and analysis in a short time, which may cause safety problems when using the battery. Therefore, if it is necessary to judge whether it is a normal battery or an aged battery, it can be classified through the Z-score algorithm.
Cluster analysis was conducted on healthy batteries, micro short circuit batteries, and aged batteries. Due to the highly abnormal estimated capacity (Ctot) and equivalent resistance (Rtot) of micro short circuit batteries and aged batteries compared to normal batteries, as shown in Fig. 4b, these two parameters can be considered outliers. Fault diagnosis mainly focuses on detecting abnormal batteries that are about to malfunction, such as micro short circuit batteries and aged batteries. This is also more practical in the battery management system (BMS). The calculation of the Z-score standardization method is shown in Eq. (8).
where Z1 and Z2 are the standardized parameters of Ctot and Rtot, respectively, n is the number of cells (n = 1, ⋯, N), where N is the number of cells, avg() is the average value of all cell parameters, std() is the standard deviation of parameters, and the distance-based outlier detection method applies the Euclidean distance between two points, effectively extracting outliers. The outlier value O of a battery is defined as the sum of Euclidean distances between a specific battery n and other batteries (i = 1, ···, N), as shown in Eq. (9).
The larger outliers O(Z1) and O(Z2) indicate that the battery tends to be abnormal compared to other batteries. If the outliers O(Z1) and O(Z2) of a battery are both large, it will be classified as an abnormal aged battery, while the micro short circuit battery will only have a large O(Z1), and the faulty battery will be classified in this way.
The Z-score algorithm requires complete charge and discharge data to determine the type of battery. Therefore, this article uses the battery terminal voltage and current results obtained during the charging process, combined Z-score algorithm based on the improved RLS, to determine the battery parameters Uoc, SOC, and Rtot. This method is used to distinguish between normal and aged batteries.
Step5. Battery Capacity Difference Detection of OCV Curve Fitting (Uoc_ΔSOC) [24,25]
In the fifth step, the battery judged to be a micro short circuit can be used to fit the battery capacity difference with the ΔSOC detection method, calculates the resistance value corresponding to the micro short circuit of the battery, and uses the obtained resistance value to determine the severity of the micro short circuit of the battery.
Due to the leakage of additional electricity caused by micro short circuits in the battery, more electricity is released during the discharge process, but less is absorbed during the charging process. As a result, the state of charge of the battery decreases faster during the discharge process, but increases more slowly during charging. In the case of aged batteries, although they have the same capacity during charging and discharging, their SOC decreases and increases relatively quickly. During the discharge process, both micro short circuited batteries and aged batteries exhibit similar abnormal characteristics. The difference in SOC between faulty batteries and other normal batteries continues to increase. Therefore, when the battery pack undergoes a complete charging and discharging cycle, MSC batteries and aged batteries will display different characteristics.
The detection method described in reference [24] requires a complete charging and discharging process, along with the same SOC interval for calculation and comparison. In this article, modifications have been made to this method, where only battery terminal voltage data from one charging process is required for detection and calculation. The process involves comparing the initial open circuit voltage (Uoc) with the initial state of charge of the battery (SOCini). Then, the battery is charged or discharged for a period of time, followed by a resting period. During this time, the open circuit voltage of the battery is measured to determine the change in its state of charge during the charging or discharging process. If it is a micro short circuit battery, there will be a small change in the state of charge due to the leakage current. The Rmsc is then calculated based on the difference in power between the micro short circuit battery and other normal batteries after each charge or discharge. The charge difference caused by MSC is shown in Eq. (10), the leakage current is shown in Eq. (11), and the internal short circuit impedance is shown in Eq. (12).
Among them, ΔSOCnormal represents the change in the state of charge of the normal battery after charging or discharging, while ΔSOCreal represents the actual state of charge change of the battery after charging or discharging. Cnormal denotes the capacity of the normal battery, QMSC is the charge difference value caused by the MSC during charging or discharging, and T is the charging or discharging time. To obtain the resistance value to the MSC of the battery (Rmsc), divide the average voltage Umean by the leakage current Ileakage.
Finally, by employing the multi-tiered fault detection algorithm proposed in this article, batteries can be classified into three states: normal, aged, and MSC. The corresponding impedance (Rmsc) of MSC can also be determined.
This article uses power simulation (PSIM) software for circuit simulation and algorithm verification [38]. The flowchart of the multi-tiered fault detection algorithm is shown in Fig. 3. The simulation steps of each algorithm are as follows:
Step1. Battery Charging Simulation Result
First, in the battery charging simulation, three series-connected batteries were established using PSIM, as shown in Fig. 5a. The batteries in Fig. 5a are the normal battery, MSC battery, and aged battery, respectively. The MSC battery is connected in parallel with resistors of 2.5 kΩ, 250, and 25 Ω, respectively. The battery specifications are as shown in Table 1. The initial parameters are set as follows: the normal battery has an SOH of 100% and an SOC of 0%; the MSC battery has an SOH of 100% and an SOC of 0%; and the aged battery has an SOH of 98% and an SOC of 0%. During the charging process, the current is set to 1.6 A. If any battery reaches the upper voltage limit of 4.2 V, charging stops and the battery rests. Fig. 5b shows the voltage and current waveforms during the charging process of the three series-connected batteries.

Figure 5: (a) Simulation circuit diagram of three series-connected batteries, (b) Charging simulation waveforms of three series-connected batteries
Step2. DBSCAN Simulation Result
The second step uses PSIM simulation data, with the data of three batteries in series per second as the original data set, and eps and minPts are calculated. A relevant classification program is written using MATLAB, using the terminal voltage values of three batteries in each second of the charging process as the input dataset. After sorting the data accordingly, eps and minPts are defined. Once the program runs, multiple clusters are generated. The classification goal is to make a judgment on the voltage value of each second. After diagnosing all the data, if one battery consistently has a certain number of outliers, it is classified as an outlier battery, while the others are classified as normal batteries.
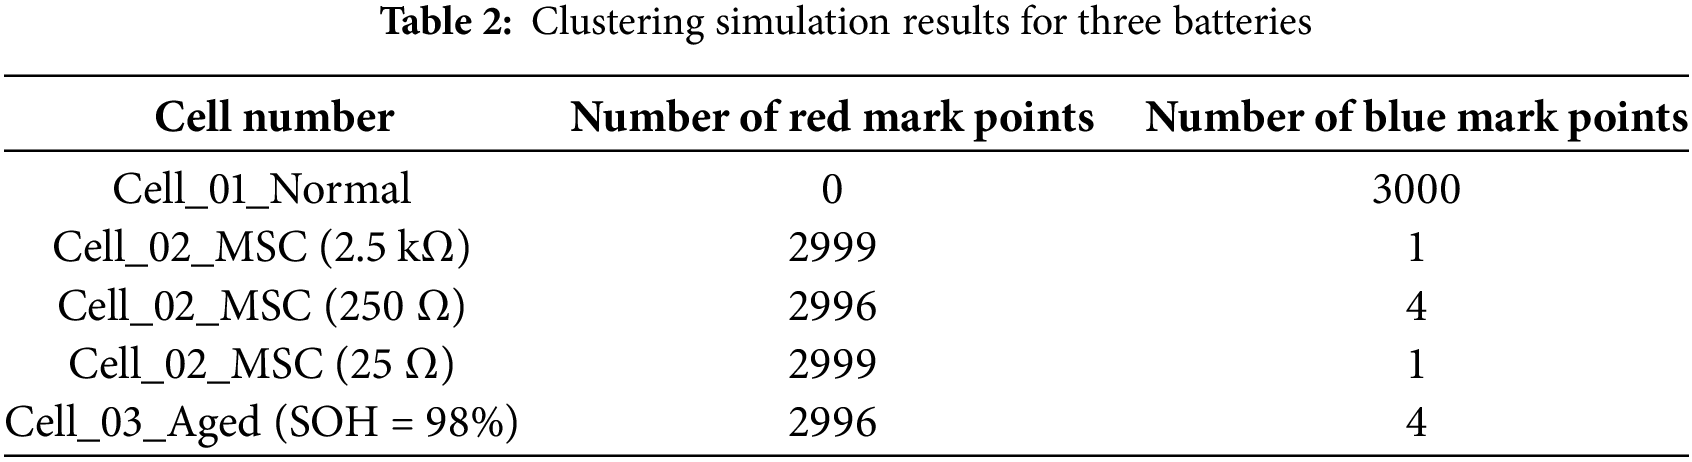
Fig. 6a shows the clustering results of the terminal voltages of three batteries during the charging simulation when the MSC resistance is 250 Ω. It can be seen that the majority of the blue points are classified as normal batteries, while the red points represent outlier batteries (MSC & Aged). Table 2 shows the clustering results for the internal short circuit batteries with parallel resistances of 2.5 kΩ, 250, and 25 Ω, respectively. From Table 2, it can be seen that Cell_01 can be completely identified as a normal battery. For Cell_02, the majority of points are outliers, whether it is paralleled with 2.5 kΩ, 250, or 25 Ω. The same applies to Cell_03. Therefore, both Cell_02 and Cell_03 are identified as outlier batteries.

Figure 6: (a) Clustering simulation results when the MSC resistance is 250 Ω, (b) Improved RLS_MDM simulation result, (c) Improved RLS_Z-Score simulation result
Step3. Improved RLS_MDM Simulation Result
The third step uses the PSIM simulation data, including calculating the average parameters of each battery, subtracting each parameter from its average value, estimating the SOC difference through the difference between each battery parameter and the average battery parameter, and establishing the equivalent circuit model of the average difference. The average difference equivalent circuit model is used in improved RLS-based equivalent circuit parameter identification to achieve real-time and accurate SOC estimation.
After the average difference model algorithm, the equivalent resistance of the mean difference can be obtained as ΔReq, as shown in Fig. 6b. For Cell_01 normal and Cell_03 aged batteries, the model differs from the average value, and the SOC will be updated immediately, fluctuating around 0, such as blue line and green line in Fig. 6b. In contrast, for Cell_02 MSC battery, ΔReq will increase over time due to the accumulation of leakage current and differences in battery state of charge compared to the other batteries. This leads to a sudden increase in ΔReq after a period of time. Moreover, as the internal short circuit becomes more severe, the growing trend of ΔReq can be detected earlier. From the three curves of MSC batteries, it is evident that Cell_02-25Ω MSC, represented by the red line, will be the first to show this trend, followed by Cell_02-250Ω MSC, represented by the light blue line, and Cell_02-2.5kΩ MSC, represented by the purple line. Therefore, the Improved RLS_MDM algorithm can effectively detect MSC batteries.
Step4. Improved RLS_Z-Score Simulation Result
The fourth step involves using PSIM simulation data to obtain the values of Rtot and SOC through the improved RLS algorithm, which serves as an indicator for determining aged batteries. This section utilizes standard deviation to measure the distance between data points and the mean, as shown in Fig. 6c. The purpose of evaluating Rtot is to identify cases where the micro impedance of aged batteries is greater than that of other batteries. The Z-score can differentiate the degree of difference between parameters. From Fig. 6c, it can be observed that the green line representing the Cell_03 aged battery has a noticeably larger Rtot at the beginning of charging compared to the blue line representing the Cell_01 normal battery. Therefore, the Z-score of improved RLS can effectively distinguish between normal and aged batteries.
Step5. Uoc_ΔSOC Simulation Result
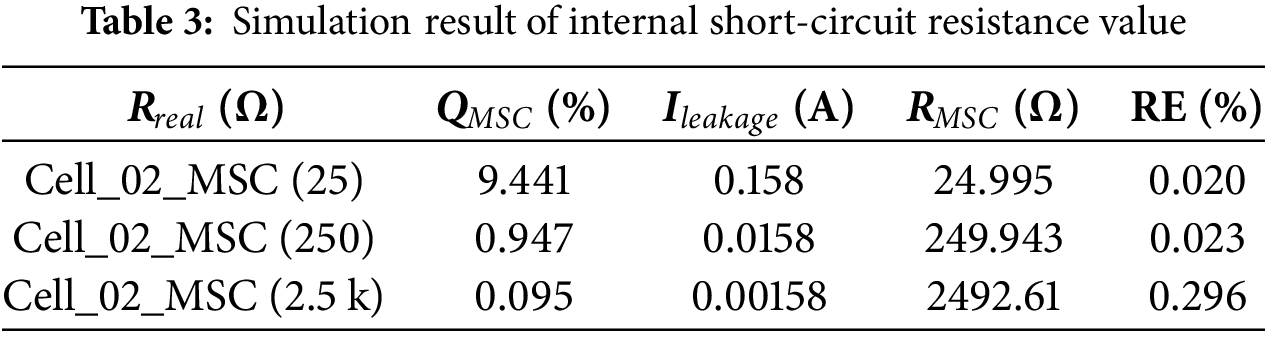
The fifth step involves using PSIM simulation charge data to fit the battery capacity difference by fitting the open-circuit voltage curve and calculating the resistance value of the MSC battery, as shown in Eq. (12). Dividing the average voltage by the leakage current yields the corresponding internal short-circuit resistance value. Table 3 presents the calculated values of battery capacity difference internal resistance, where the MSC resistance values for Cell_02 simulation are 2.5 kΩ, 250, and 25 Ω, respectively. Finally, by using Eq. (13) to calculate the relative error (RE) between the actual and calculated values, it is determined that the relative error of the simulation is within 0.3%.
where Rerror represents the relative error, Rreal is the actual internal impedance value, Rmsc is the calculated value.
6 Experimental Results and Analysis
The multi-tiered fault detection algorithm is used for judgment in this article. Fig. 7a shows the types of batteries used during the actual measurement, with specifications as shown in Table 1. In the practical testing of this article, a total of three INR21700M50LT lithium-ion batteries were used, among which Cell_01 is a new battery, Cell_02 is a micro short circuit battery with a parallel 250 Ω resistor, and Cell_03 is an aged battery with an SOH of 96%. The experimental steps of each algorithm are as follows:

Figure 7: (a) Schematic diagram of the experimental testing process, (b) Charging experimental waveforms of three series-connected batteries
Step1. Battery Charging Experimental Result
First, the PFX2512 charging and discharging controller was used for charging experiments on this battery pack. A constant current of 0.25 C (1.2 A) was used for charging, and the cut-off voltage for charging was 4.2 V. Fig. 7a is a schematic diagram of the experimental testing process. Through the connection between a PC and a charging and discharging controller, the series battery pack is subjected to a charging experiment, where the battery is placed in a chamber and set at 25°C. Fig. 7b shows the measured three battery terminal voltage and current of the charging and rest process, which corresponds to SOC ranges from 25.5% to 92.1% for Cell_01, from 28.5% to 86.05% for Cell_02, and from 22% to 91% for Cell_03. The three battery terminal voltage data obtained during this charging and rest process is used as the diagnostic dataset for the following detection methods.
Step2. DBSCAN Experimental Result
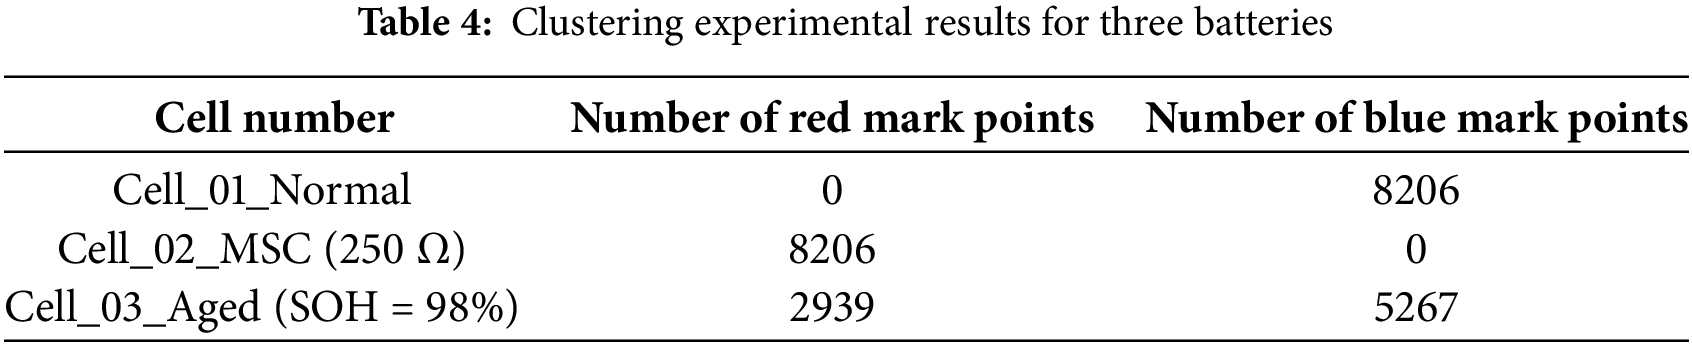
Using the voltage values of the battery terminals in each second of the charging process in Fig. 7b as the dataset, they can be input into the DBSCAN calculation program to sequentially calculate eps and minPts. After density clustering, the same cluster is marked with the same color, as shown in Fig. 8a. It can be observed that the blue part accounts for the majority and is the normal cluster in the classification, while the red part represents the outlier values. The batteries with outlier values are counted, as shown in Table 4, which can be summarized as Cell_02 and Cell_03 as the problematic batteries.

Figure 8: (a) DBSCAN experimental result, (b) Improved RLS_MDM experimental result, (c) Improved RLS_Z-Score experimental result
Step3. Improved RLS_MDM Experimental Result
The third step uses the average difference model (MDM) algorithm based on improved RLS to determine the problematic cell identified in the previous step. Using the measured terminal voltage results of the charging process in Fig. 7b as the dataset, the average parameters of each battery are calculated, and after computation, the equivalent resistance of the mean difference, ΔReq, can be obtained, as shown in Fig. 8b. The red line of Cell_02 at approximately 4010 s suddenly increases, indicating a significant difference in numerical values compared to other batteries. Therefore, it is determined that Cell_02 is an MSC battery. At this point, Cell_03 needs to be verified as an aged battery.
Step4. Improved RLS_Z-Score Experimental Result
The measured results from the previous two steps successfully classified Cells_01 as a normal battery and Cell_02 as an MSC battery. Since this article only uses the information of one charging process for diagnosis, the Z-score algorithm based on improved RLS can only be used to judge the aged battery during the charging process. The algorithm is employed to determine that Cell_03 is an aged battery. The detection parameter Rtot values for each battery are obtained using the improved RLS algorithm, as shown in Fig. 8c. The Rtot resistance standard fraction characteristic curve of the green line of Cell_03 is larger than a normal battery, successfully verifying Cell_03 as an aged battery. At this stage, all three types of batteries have been completely and accurately classified.
Step5. Uoc_ΔSOC Experimental Result
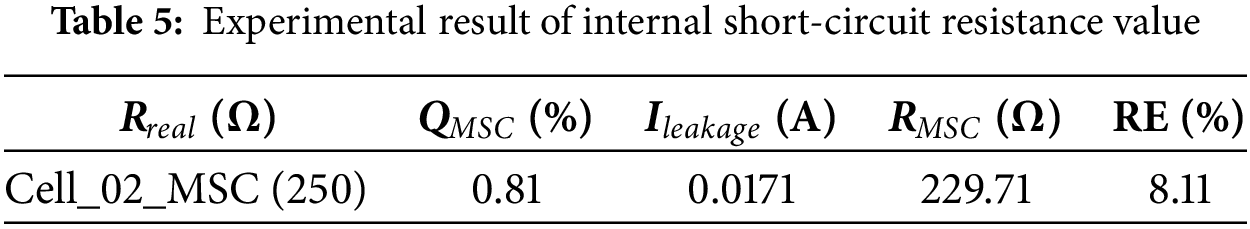
Since the third step has already determined that Cell_03 is an MSC battery, in the fifth step, the ΔSOC detection method, which uses the Uoc curve fitting to determine the battery capacity difference, is applied. Based on the relationship between open-circuit voltage and SOC established in Eq. (4), the result data from Fig. 7b is used to identify Cell_02’s initial SOC and its SOC after charging. This allows for determining the change in Cell_02’s SOC during this charging process. Due to the internal short circuit in Cell_02, its leakage current causes a smaller SOC change. Using the methods described in Eqs. (10) to (12), the corresponding internal short-circuit resistance value of Cell_02 is calculated to be 229.71 Ω. This value is then compared with the actual parallel resistance of 250 Ω, and the relative error is calculated to be 8.11% according to Eq. (13). The detailed parameters are shown in Table 5.
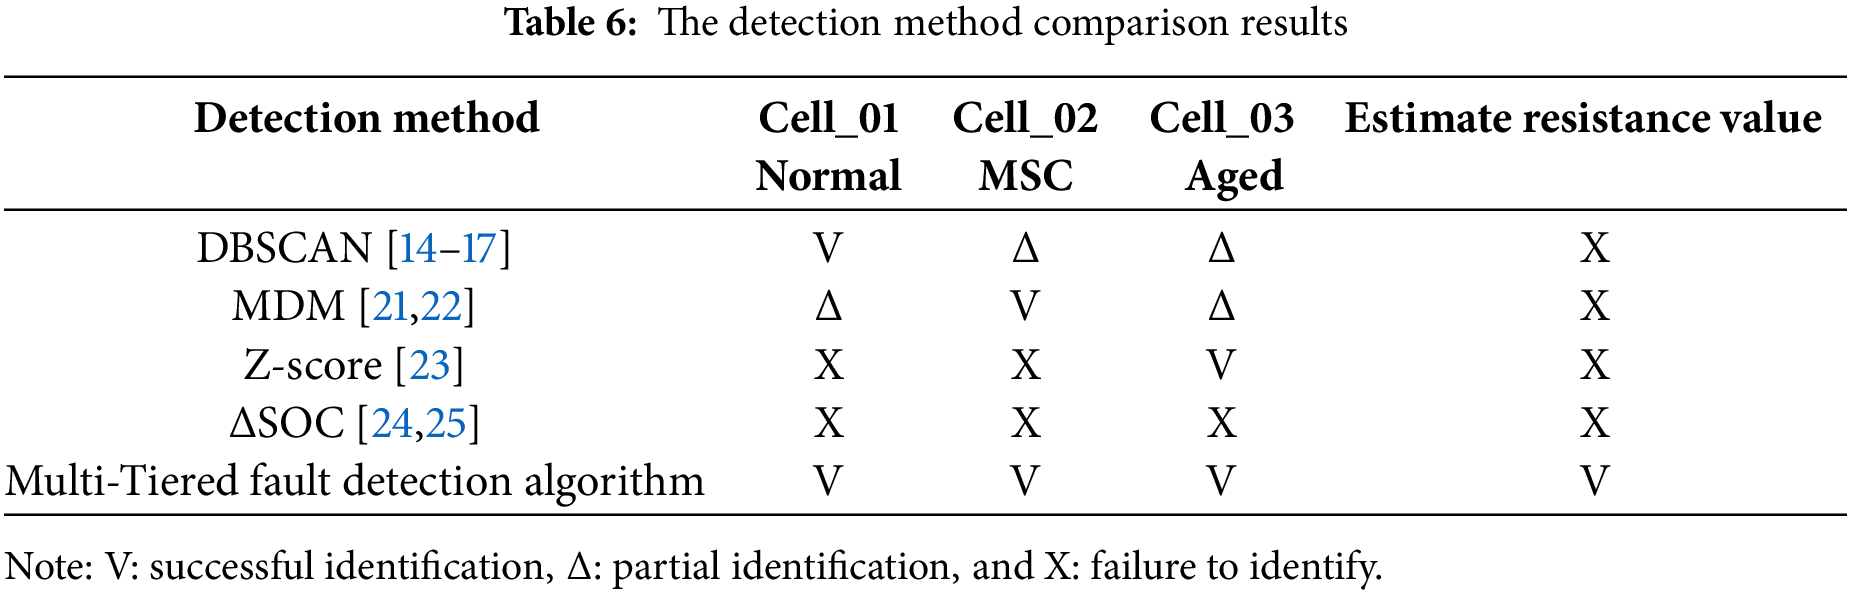
This article uses the terminal voltage data from a single charging process as the basis for judgment. The experimental results show that when this method is applied to references [14,21,23,24], it is unable to completely distinguish battery types and estimate the internal short circuit resistance. However, the multi-tiered fault algorithm proposed in this article can effectively and accurately classify battery types and calculate the internal short circuit resistance. The comparison results are shown in Table 6.
This paper presents a multi-layer fault detection algorithm that can effectively classify micro-short circuits, aging, and normal batteries during the battery module charging process. This algorithm can quickly and effectively detect micro-short circuits, aging, and normal batteries without requiring extensive battery charge-discharge data. Under simulated experimental conditions, this method can effectively classify three different degrees of internal short circuits (2.5 kΩ, 250, and 25 Ω), and accurately determine the corresponding resistance values of micro-short circuits, with relative errors within 0.3%. During actual measurements, Cell_02 in the module was connected in parallel with a 250 Ω cement resistor, and despite a relative error of 8.11%, it was still sufficient to effectively determine the severity of micro-short circuits (kilohm, hundreds of ohms, tens of ohms), enabling the Battery Management System (BMS) to pre-classify batteries as normal, warning, or dangerous. Other algorithms based solely on voltage data from a single charging process cannot fully distinguish battery types and estimate internal short-circuit resistance. Therefore, the multi-layer fault detection algorithm proposed in this paper can effectively assist BMS in improving overall battery safety. However, it is worth noting that this study still has some limitations, such as focusing mainly on battery internal micro-short circuit issues while neglecting temperature fields and internal resistance differences that may exist in practical applications.
Therefore, in addition to considering internal battery micro-short circuit issues, temperature fields and internal resistance differences in practical applications also need to be taken into account to further enhance the safety and reliability of battery management systems. To further improve the applicability of algorithms and models, future research can focus on the following directions:
• Introduce temperature field modeling and internal resistance variation analysis, incorporating temperature distribution and internal resistance changes into the model to study the effects of temperature and internal resistance differences on battery behavior.
• Adopt multi-field coupling modeling methods, combining thermal management and electrochemical models to enhance algorithm applicability under different operating conditions.
• Include non-uniform temperature condition tests in experiments to simulate system behavior under different temperature fields and internal resistance difference scenarios, thereby validating model performance under broader conditions.
Future research can work towards these directions to develop more comprehensive and accurate battery fault detection systems.
Acknowledgement: The authors are grateful to all the editors and anonymous reviewers for their comments and suggestions.
Funding Statement: The authors received no specific funding for this study.
Author Contributions: The authors confirm contribution to the paper as follows: study conception and design: Yi-Feng Luo, Wen-Cheng Su; data collection: Jyuan-Fong Yen, Wen-Cheng Su; analysis and interpretation of results: Yi-Feng Luo, Jyuan-Fong Yen, Wen-Cheng Su; draft manuscript preparation: Yi-Feng Luo, Jyuan-Fong Yen, Wen-Cheng Su. All authors reviewed the results and approved the final version of the manuscript.
Availability of Data and Materials: Not applicable.
Ethics Approval: Not applicable.
Conflicts of Interest: The authors declare no conflicts of interest to report regarding the present study.
References
1. Tran MK, Sherman S, Samadani E, Vrolyk R, Wong D, Lowery M, et al. Environmental and economic benefits of a battery electric vehicle powertrain with a zinc-air range extender in the transition to electric vehicles. Vehicles. 2020;2(3):398–412. doi:10.3390/vehicles2030021. [Google Scholar] [CrossRef]
2. Tran MK, Akinsanya M, Panchal S, Fraser R, Fowler M. Design of a hybrid electric vehicle powertrain for performance optimization considering various powertrain components and configurations. Vehicles. 2020;3(1):20–32. doi:10.3390/vehicles3010002. [Google Scholar] [CrossRef]
3. Wikipedia. Samsung Note 7 [Internet]. [cited 2023 Jun 01]. Available from: https://en.wikipedia.org/wiki/Samsung_Galaxy_Note_7. [Google Scholar]
4. Vora FT. Internal short circuit in lithium-ion battery [master’s thesis]. West Lafayette, IN, USA: Purdue University Graduate School; 2022. [Google Scholar]
5. Tran MK, Fowler M. A review of lithium-ion battery fault diagnostic algorithms: current progress and future challenges. Algorithms. 2020;13(3):62. doi:10.3390/a13030062. [Google Scholar] [CrossRef]
6. Wang H, Simunovic S, Maleki H, Howard JN, Hallmark JA. Internal configuration of prismatic lithium-ion cells at the onset of mechanically induced short circuit. J Power Sources. 2016;306:424–30. doi:10.1016/j.jpowsour.2015.12.026. [Google Scholar] [CrossRef]
7. Abaza A, Ferrari S, Wong HK, Lyness C, Moore A, Weaving J, et al. Experimental study of internal and external short circuits of commercial automotive pouch lithium-ion cells. J Energy Storage. 2018;16:211–7. doi:10.1016/j.est.2018.01.015. [Google Scholar] [CrossRef]
8. Tran MK, Mevawalla A, Aziz A, Panchal S, Xie Y, Fowler M. A review of lithium-ion battery thermal runaway modeling and diagnosis approaches. Processes. 2022;10(6):1192. doi:10.3390/pr10061192. [Google Scholar] [CrossRef]
9. Gao W, Li X, Ma M, Fu Y, Jiang J, Mi C. Case study of an electric vehicle battery thermal runaway and online internal short-circuit detection. IEEE Trans Power Electron. 2020;36(3):2452–5. doi:10.1109/TPEL.2020.3013191. [Google Scholar] [CrossRef]
10. Zhang Z, Kong X, Zheng Y, Zhou L, Lai X. Real-time diagnosis of micro-short circuit for Li-ion batteries utilizing low-pass filters. Energy. 2019;166(9):1013–24. doi:10.1016/j.energy.2018.10.160. [Google Scholar] [CrossRef]
11. Lelie M, Braun T, Knips M, Nordmann H, Ringbeck F, Zappen H, et al. Battery management system hardware concepts: an overview. Appl Sci. 2018;8(4):534. doi:10.3390/app8040534. [Google Scholar] [CrossRef]
12. Xing Y, Ma EW, Tsui KL, Pecht M. Battery management systems in electric and hybrid vehicles. Energies. 2011;4(11):1840–57. doi:10.3390/en4111840. [Google Scholar] [CrossRef]
13. Lipu MH, Hannan MA, Karim TF, Hussain A, Saad MHM, Ayob A, et al. Intelligent algorithms and control strategies for battery management system in electric vehicles: progress, challenges and future outlook. J Clean Prod. 2021;292:126044. doi:10.1016/j.jclepro.2021.126044. [Google Scholar] [CrossRef]
14. Liu P, Wang J, Wang Z, Zhang Z, Wang S, Dorrell D. Cloud platform-oriented electrical vehicle abnormal battery cell detection and pack consistency evaluation with big data: devising an early-warning system for latent risks. IEEE Ind Appl Mag. 2021;28(2):44–55. doi:10.1109/MIAS.2021.3114654. [Google Scholar] [CrossRef]
15. Zhang L, Lin J, Karim R. An angle-based subspace anomaly detection approach to high-dimensional data: with an application to industrial fault detection. Reliab Eng Syst Saf. 2015;142(4):482–97. doi:10.1016/j.ress.2015.05.025. [Google Scholar] [CrossRef]
16. Xue Q, Li G, Zhang Y, Shen S, Chen Z, Liu Y. Fault diagnosis and abnormality detection of lithium-ion battery packs based on statistical distribution. J Power Sources. 2021;482(1):228964. doi:10.1016/j.jpowsour.2020.228964. [Google Scholar] [CrossRef]
17. Liu P, Wang J, Wang Z, Zhang Z, Wang S, Dorrell DG. High-dimensional data abnormity detection based on improved Variance-of-Angle (VOA) algorithm for electric vehicles battery. IEEE Energy Convers Congress Expo. 2019:5072–7. doi:10.1109/ECCE41553.2019. [Google Scholar] [CrossRef]
18. Yuan H, Cui N, Li C, Cui Z, Chang L. Early stage internal short circuit fault diagnosis for lithium-ion batteries based on local-outlier detection. J Energy Storage. 2023;57(3):106196. doi:10.1016/j.est.2022.106196. [Google Scholar] [CrossRef]
19. Kong X, Zheng Y, Ouyang M, Lu L, Li J, Zhang Z. Fault diagnosis and quantitative analysis of micro-short circuits for lithium-ion batteries in battery packs. J Power Sources. 2018;395:358–68. doi:10.1016/j.jpowsour.2018.05.097. [Google Scholar] [CrossRef]
20. Chang C, Zhou X, Jiang J, Gao Y, Jiang Y, Wu T. Electric vehicle battery pack micro-short circuit fault diagnosis based on charging voltage ranking evolution. J Power Sources. 2022;542(10):231733. doi:10.1016/j.jpowsour.2022.231733. [Google Scholar] [CrossRef]
21. Gao W, Zheng Y, Ouyang M, Li J, Lai X, Hu X. Micro-short-circuit diagnosis for series-connected lithium-ion battery packs using mean-difference model. IEEE Trans Ind Electron. 2018;66(3):2132–42. doi:10.1109/TIE.2018.2838109. [Google Scholar] [CrossRef]
22. Ouyang M, Zhang M, Feng X, Lu L, Li J, He X, et al. Internal short circuit detection for battery pack using equivalent parameter and consistency method. J Power Sources. 2015;294(6):272–83. doi:10.1016/j.jpowsour.2015.06.087. [Google Scholar] [CrossRef]
23. Kim T, Adhikaree A, Pandey R, Kang D, Kim M, Oh CY, et al. Outlier mining-based fault diagnosis for multicell lithium-ion batteries using a low-priced microcontroller. In: 2018 IEEE Applied Power Electronics Conference and Exposition (APEC); 2018; San Antonio, TX, USA. p. 3365–9. [Google Scholar]
24. Zheng Y, Luo Q, Cui Y, Dai H, Han X, Feng X. Fault identification and quantitative diagnosis method for series-connected lithium-ion battery packs based on capacity estimation. IEEE Trans Ind Electron. 2021;69(3):3059–67. doi:10.1109/TIE.2021.3068553. [Google Scholar] [CrossRef]
25. Weng C, Sun J, Peng H. A unified open-circuit-voltage model of lithium-ion batteries for state-of-charge estimation and state-of-health monitoring. J Power Sources. 2014;258:228–37. doi:10.1016/j.jpowsour.2014.02.026. [Google Scholar] [CrossRef]
26. Ren B, Xie C, Sun X, Zhang Q, Yan D. Parameter identification of a lithium–ion battery based on the improved recursive least square algorithm. IET Power Electron. 2020;13(12):2531–7. doi:10.1049/iet-pel.2019.1589. [Google Scholar] [CrossRef]
27. Song Q, Mi Y, Lai W. A novel variable forgetting factor recursive least square algorithm to improve the anti-interference ability of battery model parameters identification. IEEE Access. 2019;7:61548–57. doi:10.1109/ACCESS.2019.2903625. [Google Scholar] [CrossRef]
28. Zhang C, Allafi W, Dinh Q, Ascencio P, Marco J. Online estimation of battery equivalent circuit model parameters and state of charge using decoupled least squares technique. Energy. 2018;142(7):678–88. doi:10.1016/j.energy.2017.10.043. [Google Scholar] [CrossRef]
29. Pai HY, Liu YH, Ye SP. Online estimation of lithium-ion battery equivalent circuit model parameters and state of charge using time-domain assisted decoupled recursive least squares technique. J Energy Storage. 2023;62(15):106901. doi:10.1016/j.est.2023.106901. [Google Scholar] [CrossRef]
30. Zhang L, Peng H, Ning Z, Mu Z, Sun C. Comparative research on RC equivalent circuit models for lithium-ion batteries of electric vehicles. Appl Sci. 2017;7(10):1002. doi:10.3390/app7101002. [Google Scholar] [CrossRef]
31. Schönberger J, GmbH P. Modeling a lithium-ion cell using PLECS [Internet]. 2009 [cited 2023 Jun 01]. Available from: https://www.plexim.com/files/plecs_lithium_ion.pdf. [Google Scholar]
32. Zhang X, Zhang W, Lei G. A review of li-ion battery equivalent circuit models. Trans Electr Electron Mater. 2016;17(6):311–6. doi:10.4313/TEEM.2016.17.6.311. [Google Scholar] [CrossRef]
33. Luo Y, Zhao X, Qi P, Liu Z, Deng T, Li P. Second-order RC modeling and parameter identification of electric vehicle power battery. Energy Storage Sci Technol. 2019;8(4):738–44. doi:10.12028/j.issn.2095-4239.2019.0015. [Google Scholar] [CrossRef]
34. LG Energy Solution. Lithium-ion Battery INR21700M50LT [Internet]. [cited 2023 Jun 01]. Available from: https://cdn.shopify.com/s/files/1/1820/0269/files/21700_M50LT_datasheet.pdf?v=1706228421. [Google Scholar]
35. Xu J, Mi CC, Cao B, Deng J, Chen Z, Li S. The state of charge estimation of lithium-ion batteries based on a proportional-integral observer. IEEE Trans Veh Technol. 2013;63(4):1614–21. doi:10.1109/TVT.2013.2287375. [Google Scholar] [CrossRef]
36. Sundaresan S, Devabattini BC, Kumar P, Pattipati KR, Balasingam B. Tabular open circuit voltage modelling of li-ion batteries for robust SOC estimation. Energies. 2022;15(23):9142. doi:10.3390/en15239142. [Google Scholar] [CrossRef]
37. TEXAS INSTRUMENTS. What is OCV [Internet]. [cited 2023 Jun 01]. Available from: https://e2e.ti.com/support/power-management-group/power-management/f/power-management-forum/570445/what-is-ocv. [Google Scholar]
38. Powersim Tech. PSIM User’s Manual [Internet]. [cited 2023 Jun 01]. Available from: https://powersimtech.com/wp-content/uploads/2021/01/PSIM-User-Manual.pdf. [Google Scholar]
Cite This Article
 Copyright © 2025 The Author(s). Published by Tech Science Press.
This work is licensed under a Creative Commons Attribution 4.0 International License , which permits unrestricted use, distribution, and reproduction in any medium, provided the original work is properly cited.
 Downloads
 Citation Tools