
 Submit a Paper
 Propose a Special lssue
 Open Access
ARTICLE

Numerically and Experimentally Establishing Rheology Law for AISI 1045 Steel Based on Uniaxial Hot Compression Tests
Department of Metallurgical Technologies, Faculty of Materials Science and Technology, VSB–Technical University of Ostrava, Ostrava, 70800, Czech Republic
* Corresponding Author: Josef Walek. Email:
Computer Modeling in Engineering & Sciences 2025, 142(3), 3135-3153. https://doi.org/10.32604/cmes.2025.059889
Received 19 October 2024; Accepted 02 February 2025; Issue published 03 March 2025
 View Full Text
 Download PDF
Abstract
Plastometric experiments, supplemented with numerical simulations using the finite element method (FEM), can be advantageously used to characterize the deformation behavior of metallic materials. The accuracy of such simulations predicting deformation behaviors of materials is, however, primarily affected by the applied rheology law. The presented study focuses on the characterization of the deformation behavior of AISI 1045 type carbon steel, widely used e.g., in automotive and power engineering, under extreme conditions (i.e., high temperatures, strain rates). The study consists of two main parts: experimentally analyzing the flow stress development of the steel under different thermomechanical conditions via uniaxial hot compression tests and establishing the rheology law via numerical simulations implementing the experimentally acquired flow stress curves. The numerical simulations then not only serve to establish the rheology law but also to verify the reliability of the selected experimental process. The results of the numerical simulations showed that the established rheology law characterizes the behavior of the investigated steel with sufficient accuracy also at high temperatures and/or strain rates, and can, therefore, be used for practical purposes. Last but not least, supplementary microstructure analyses performed for the samples subjected to the highest deformation temperature provided a deeper insight into the effects of the applied (extreme) thermomechanical conditions on the behavior of the investigated steel.Keywords
Processes of materials forming involve numerous technologies providing the products with required shapes and dimensions. However, forming methods simultaneously influence the resulting microstructures and thus the final mechanical properties [1–5]. Forming technologies, conventional (e.g., rolling, forging, drawing, and extrusion [6–9]), as well as unconventional (e.g., severe plastic deformation methods [10], such as Equal Channel Angular Pressing (ECAP) [11], ECAP with Partial Back Pressure (ECAP-PBP) [12,13], or Twist Channel Angular Pressing (TCAP) [14,15], cumulative and multi-axial forming [16–18], or rotary swaging [19–21]), are used to produce a wide range of components in numerous industrial fields, such as nuclear an power engineering [22], construction of vehicles [23], or bioengineering and medicine [24]. The majority of the forming methods can be applied to process a variety of different materials; however, each material reacts to a forming procedure differently. In other words, different materials typically feature different deformation behaviors, moreover, when formed under different thermomechanical conditions [25,26].
Although the deformation behaviors of metallic materials usually differ, they are not directly related to a specific forming technology. On the other hand, by optimizing the processing conditions of a production technology according to the behavior of a particular material, its final mechanical and utility properties can be tailored [27,28]. This applies to the entire range of metallic materials, from lightweight alloys [29,30], through heavy alloys [31,32] and superalloys [33–35], to various composites [36–38]. Characterizing the deformation behaviors of metallic materials is highly important to make production processes more efficient. The deformation behavior of a specific material can be advantageously characterized with the help of plastometric experiments, such as uniaxial tension, compression, or torsion tests [39–41]. Moreover, uniaxial compression or torsion tests carried out under hot conditions enable mapping of the influences of various processing parameters (i.e., thermomechanical conditions), such as strain, strain rate, and temperature, on flow stress development of the formed material [42–44]. The flow stress of a metallic material is directly related to the acting external forces. In other words, the flow stress affects directly the magnitudes of forces necessary to change the shape and dimensions of a formed workpiece [45–47]. In addition, the shapes of the flow stress curve, i.e., dependences of the flow stress on strain, strain rate, and temperature, can be examined to assess both the kinetics and type of occurring softening processes (recovery, recrystallization) [48–51]. To confirm the estimated beginning (and development) of dynamic recovery (DRV) and recrystallization (DRX), supplementary electron microscopy analyses of micro/substructure can favorably be used [52,53].
The experimentally acquired flow stress curves can also advantageously be used to establish rheological laws, which subsequently enable us to assemble numerical simulations of various forming processes using the finite element method (FEM), and reliably predict the deformation behavior of a given material under a variety of applied thermomechanical conditions [54–56]. A rheology law can take various forms, from a whole series of parametric equations (various forms of which have been developed), to complex structures based on artificial neural networks and other machine learning techniques [57–60]. For example, Ji et al. [61] studied the deformation behavior of TC21 alloy for hot forming, DEFORM software was used to simulate the compression process of the forged alloy, Lv et al. [62] investigated the constitutive equation combined with the Zerilli-Armstrong (ZA) model. Based on the constitutive equation, the influence of the rolling process and its parameters on the deformation behavior by FEM was investigated, Lin et al. [63] optimized the hot deformation behavior for 7005 alloys by investigating the closed die forging processing parameters by integrating 3D processing maps and FEM numerical simulations in QFormUK software for automotive wheel hubs, Wu et al. [64] studied flow stress behavior characterized by Arrhenius constitutive model. The macroscopic compression tests were simulated by the FEM in the DEFORM software and the dynamic recrystallization was described by the critical strain model, González-Castillo et al. [65] used FEM simulations in DEFORM software to study the behavior of medium Mn steel during the hot rolling process. They predict the evolution of temperature and effective deformation during the hot rolling process using numerical simulations, Kim et al. [66] performed hot compression tests to determine the flow behavior during the hot deformation of the forged Ti-6242 alloy. The experimental data were then used to calculate the parameters of the Johnson-Mehl-Avrami-Kolmogorov (JMAK) model, which was implemented in the DEFORM software used for FEM simulations of the hot forging process, and Huo et al. [67] tested the 7Cr7Mo2VSiNi steel with hot compression tests on a plastometer. Based on the flow stress curves was established constitutive model of dynamic recovery and dynamic recrystallization. The flow stress was predicted according to the established Arrhenius model which was imported into the software DEFORM for FEM simulations. A robust rheology law implemented in FEM-based software enables us to perform reliable numerical simulations and thus economize the production process by minimizing experimental time, costs, and waste.
The presented study focuses on the AISI 1045 steel type, which is commonly used to fabricate various axles and couplings, components in the automotive, heat and gas pipes, etc. [68–71]. The primary aim is mapping its deformation behavior under a variety of hot forming conditions and subsequently establishing a respective rheology law suitable to simulate a variety of forming processes when implemented into numerical software. The experimental analysis is carried out using uniaxial compression tests and supplemented with microscopy observations. To establish the Hensel-Spittel type rheology law, non-linear regression analysis is applied to determine the necessary material parameters. Last but not least, numerical simulations of the experimentally realized uniaxial hot compression tests are performed to verify the reliability of the rheology law and perform mapping of the deformation behavior of the studied AISI 1045 steel in a greater depth.
2.1 Uniaxial Hot Compression Testing
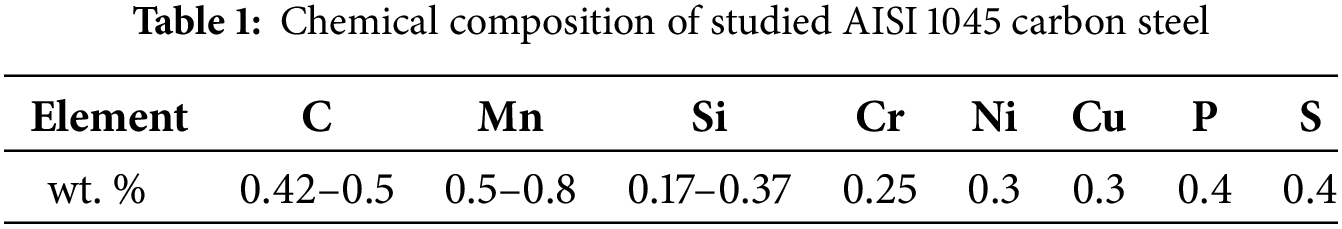
To map the flow stress behavior of the AISI 1045 (its chemical composition is given in Table 1) steel under hot working conditions and thus gain the basis for the subsequent establishment of the rheology law and FEM simulations the studied steel was subjected to a series of uniaxial hot compression tests. The testing procedure was performed using the Gleeble 3800 thermomechanical simulator equipped with a Hydrawedge II testing unit.
The original material was in a conventionally rolled and normalized state. The rolled + normalized steel bar (i.e., initial material state) was cut and machined into the form of cylindrical compression test samples with a diameter of 10 mm and height of 15 mm. The experiments were performed at five temperatures (900°C, 1000°C, 1100°C, 1200°C, and 1280°C) which were combined with four strain rates (0.1, 1, 10, and 100 s−1). The maximum true (logarithmic) strain for the compression test was set to 1 for all experiments. During the testing, direct electric resistance heating with a heating rate of 5°C·s−1 was applied to a specific deformation temperature (900°C, 1000°C, 1100°C, 1200°C, and 1280°C). Each tested sample was immediately after deformation freely cooled by heat transfer to the anvils. The testing chamber was maintained under a high vacuum to prevent oxidation processes. The above-described testing procedure provided in total of twenty flow stress curves mapping the flow stress development of the examined steel in a wide range of thermomechanical conditions. To assemble the nonlinear dependencies of true flow stress on true strain, strain rate, and deformation temperature, load force (acquired by a load cell) and absolute deformation (i.e., anvil displacement measured by a linear variable differential transformer transducer) were recalculated according to the following Eqs. (1) and (2) [20]:
where ε (-) is true strain, h0 (mm) is initial sample height,
The microstructures of selected samples after the uniaxial hot compression test were examined by scanning electron microscopy (SEM). The Tescan FERA 3 was used for SEM. The microstructure evaluation using the electron backscattered diffraction (EBSD) method EDAX DigiView V camera aimed to investigate in a greater depth the correlation of grain sizes and orientations with the occurrence of softening processes, as well as to complement the FEM simulations. Data acquisition was performed using APEX 2.5 software and the acquired EBSD data was evaluated using Orientation Image Map (OIM) 8.6 software by EDAX, Ametek Inc. To prepare samples for the observations, the samples subjected to the uniaxial hot compression tests were cut longitudinally, i.e., the cutting plane corresponded to the axial plane of the greatest horizontal cross-section of the compressed barrel (corresponds Observed Plane) and were prepared by mechanical and polishing using the contemporary method C-35 [72]. SEM and EBSD analyses were performed at the center of such a cross-section for each sample.
3.1 Establishing the Law of Rheology
The basis for numerical simulations is the use of a constitutive model. The experimental data was used to construct a mathematical formulation that describes the relations between the flow stress, σ, and corresponding predictors, ε, ε·, and T [58–60]. The data set was formed by an n × 4 matrix, where the first three columns correspond to the individual independent variables (T-ε·-ε) and the last column corresponds to the dependent variable (i.e., σ). The rows then correspond to individual combinations of thermomechanical conditions (T-ε·-ε), where n corresponds to the number of these combinations. The simulations are performed using the Forge® N × T 3.0 software and the implemented Hensel-Spittel constitutive model was applied to establish the mathematical formulation (Eq. (3)) [73]:
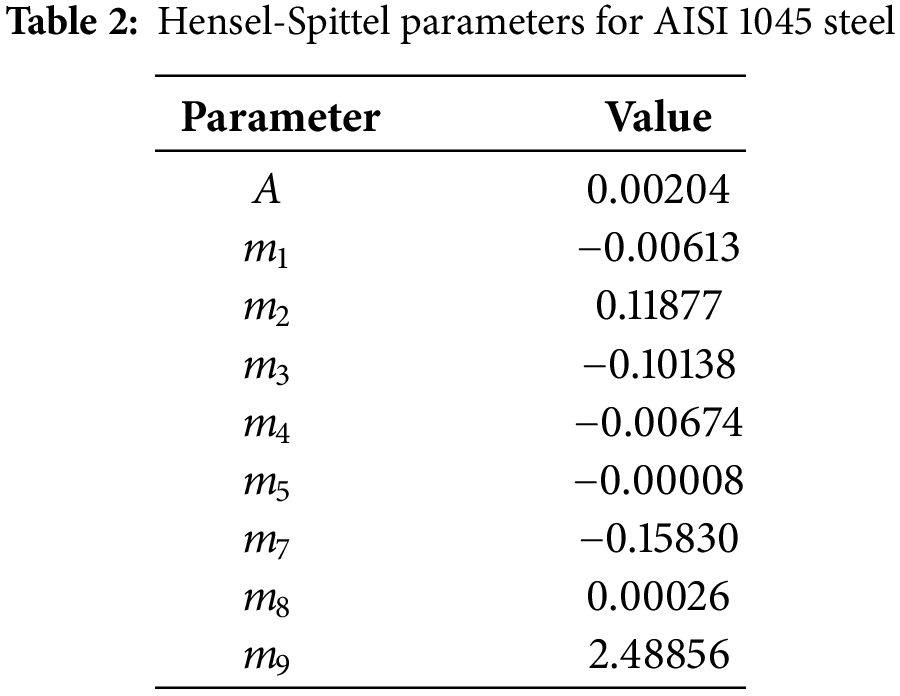
The rough estimate of the material constants in Eq. (3), i.e., A, m1, m2, m3, m4, m5, m7, m8, and m9, was iteratively refined according to the Levenberg-Marquardt method presented in Eq. (4), so that Eq. (3) describes the flow stress of the studied AISI 1045 steel [73].
In Eq. (4), βi is the vector of material constant estimates from the previous iteration step, βi+1 is the vector of material constant estimates from the present iteration step, H is a Hessian matrix containing partial derivates of the critical function, ∇βF is the vector of criteria function gradients, and λ is damping factor [73]. The parameters corresponding to the investigated AISI 1045 steel, refined by the characterized procedure, are summarized in Table 2. Note that the validity domain for the gained parameters is as follows: ε = [0.04, 1] ⊂ ℝ, ε· = [0.1, 100] s−1 ⊂ ℝ, and T = [900, 1280]°C ⊂ ℝ.
To quantify the achieved curve fit accuracy, the root means squared error, RMSE (MPa), and the Pearson’s correlation coefficient, R (-), were applied as follows (Eqs. (5) and (6)), whose values of which are shown in Table 3.
where Ti (MPa) and Ei (MPa) represent the i-th target and corresponding estimated true flow stress value, respectively; i = [1, n] ⊂ ℕ, where n corresponds to the number of observations. Then
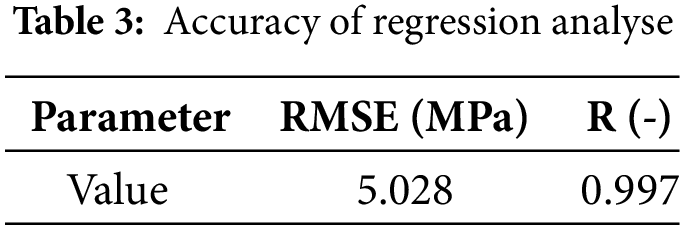
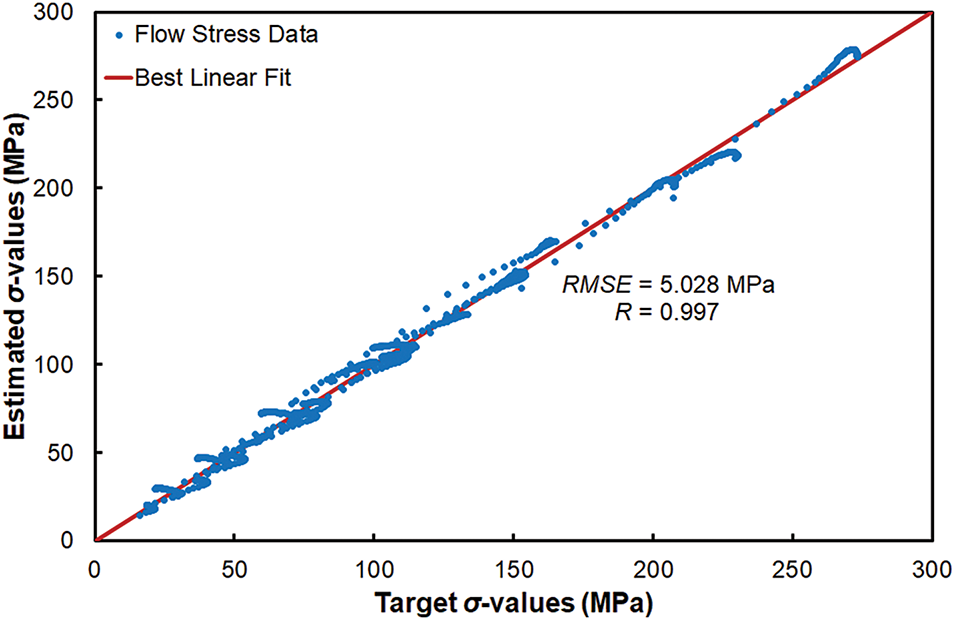
Figure 1: Correlation between target and estimated flow stress data (compression test)
3.2 Specifying the Simulation Procedure
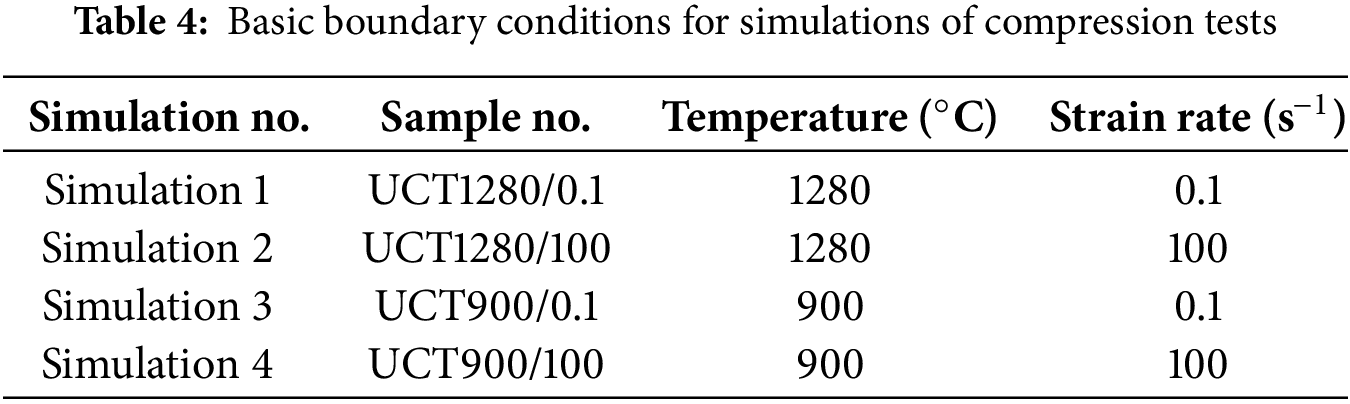
In order to map the deformation behavior of the investigated steel in the given range of thermomechanical conditions in greater detail, numerical simulations of the compression tests were assembled. The simulations were performed for selected tests carried out under the limit conditions, i.e., combinations of maximum and minimum deformation temperature and strain rate. See Table 4 summarizing the boundary conditions corresponding to the real experiments.
The simulations were assembled and computed using the Forge® N × T 3.0 software. The uniaxial compression test (UCT) is generally comparable to the upsetting forging technology. However, unlike upsetting, the UCT procedure has two requirements; first, the tested sample is held at the required temperature during the entire testing procedure, i.e., the heat transfer to the anvils and surroundings has to be compensated, which is performed by a direct electric resistance heating with instantaneous temperature measurement and control on the experimental Gleeble testing machine; therefore, the thermal exchange conditions between the anvils and test sample was set as adiabatic, i.e., zero-value of a heat transfer coefficient. The thermal radiation of the sample with the anvils and surrounding environment was also neglected. Note, specific heat capacity, c, of 778 J·kg−1·K−1 and emissivity, ε, of 0.88 as thermal properties of the studied AISI 1045 steel. Second, the strain rate has to be constant—correspondingly, the anvil feed rate cannot be constant. The Gleeble machine enables to control of the anvil feed rate based on the automatically calculated anvil position–time dependency. However, in the Forge® software, the required anvil movement was set using a table as user-defined anvil kinematics. The initial sample height of 15 mm and true strain value of −1.1 led to a final sample of a height of 5 mm. From the mathematical point of view, the described dependencies can be expressed by an exponential law, as demonstrated in Fig. 2, which can further be generalized as (Eq. (7))
where h (mm), h0 (mm), and t (s) represent the upper anvil position, initial sample height, and load time, respectively. If a modification of the parameter of upper anvil movement velocity v (mm·s−1) is required, Eq. (7) can be modified as follows:
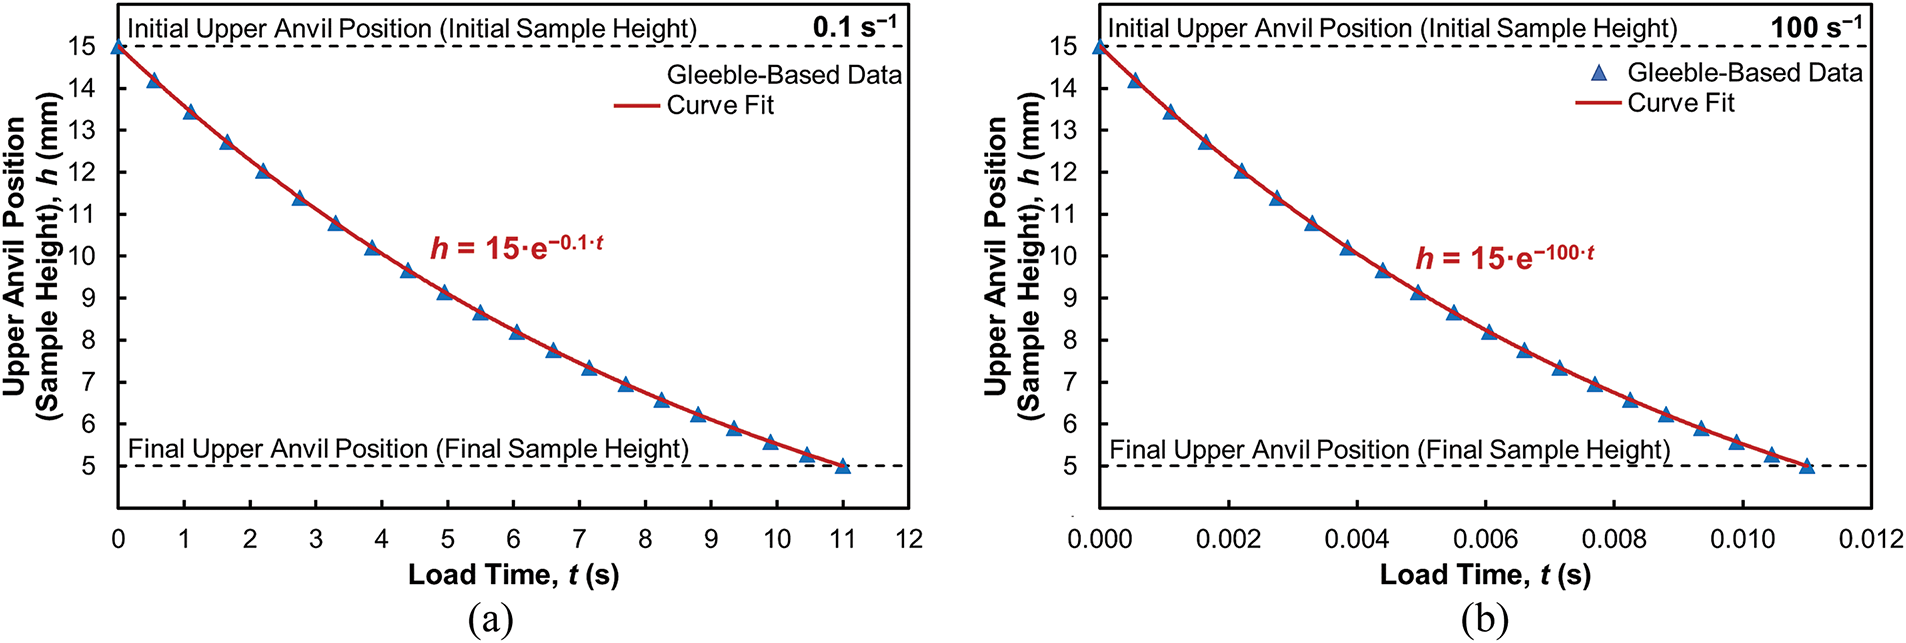
Figure 2: Anvil feed rate control applied to achieve constant strain rate during UCT simulations: 0.1 s−1 (a); 100 s−1 (b)
As for the friction conditions at the anvil-sample interface, a friction coefficient, µ, of 0.15, exactly corresponding to the friction coefficient of the experimentally used nickel-based lubricant, and friction factor, m, of 0.3 were applied (i.e., combined Coulomb-Tresca friction law).
Fig. 3 shows the assembly of anvils and test samples used in all FEM simulations. The dimensions of all components correspond to the real Gleeble assembly. Specifically, the diameter and height of the test sample are 10 and 15 mm, and the diameter and height of the anvils are 19 and 6.4 mm. Note that both anvils were considered to be rigid dies, and the test sample was considered to be a deformable body. The finite element mesh was generated using a generator built directly into the used FEM software. The test sample was meshed in its entire volume with a network consisting of 29,656 elements connected by 6315 nodes, with a mesh size of 0.53 mm. The lower and upper anvil were only surface meshed, with a mesh size of 1 mm in the area of contact with the test sample (need for more accurate calculation) and 2 mm in other areas. Each anvil thus consisted of 2012 elements connected by 1008 nodes.
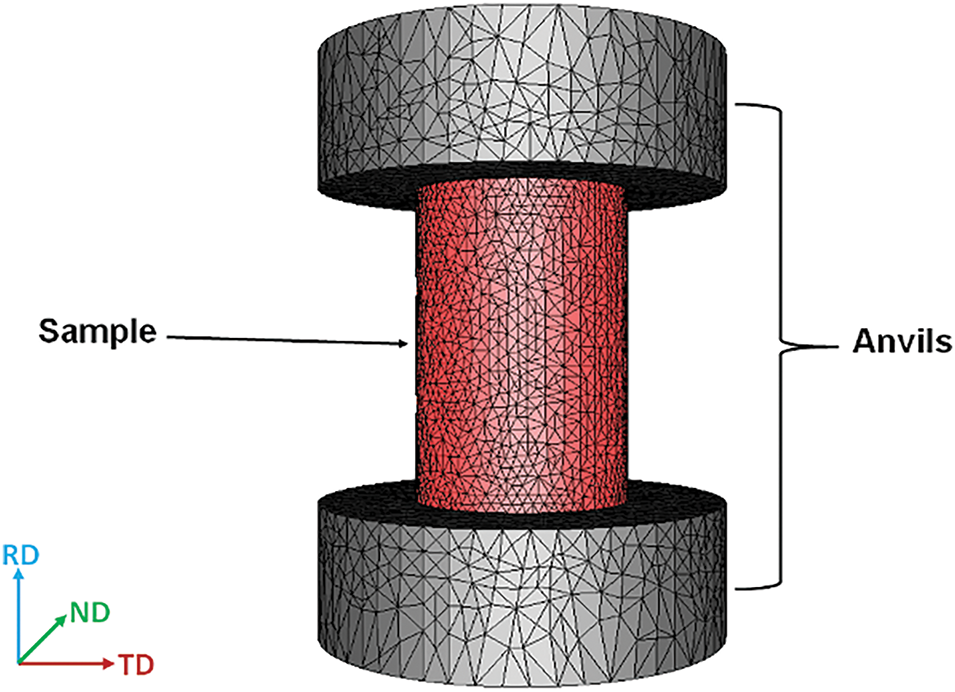
Figure 3: Assembly for uniaxial compression test simulation
Fig. 4a–d graphically depicts the dependencies of flow stress on true strain, acquired for the deformation temperatures of 900°C, 1000°C, 1100°C, 1200°C, and 1280°C, at strain rates of 0.1, 1, 10, 100 s−1, respectively. The figures also depict the flow stress curves predicted for the corresponding conditions using the Hensel-Spittel equation. As can be seen, the predicted curves acquired using the established rheology law correspond to the experimental ones with sufficient accuracy.
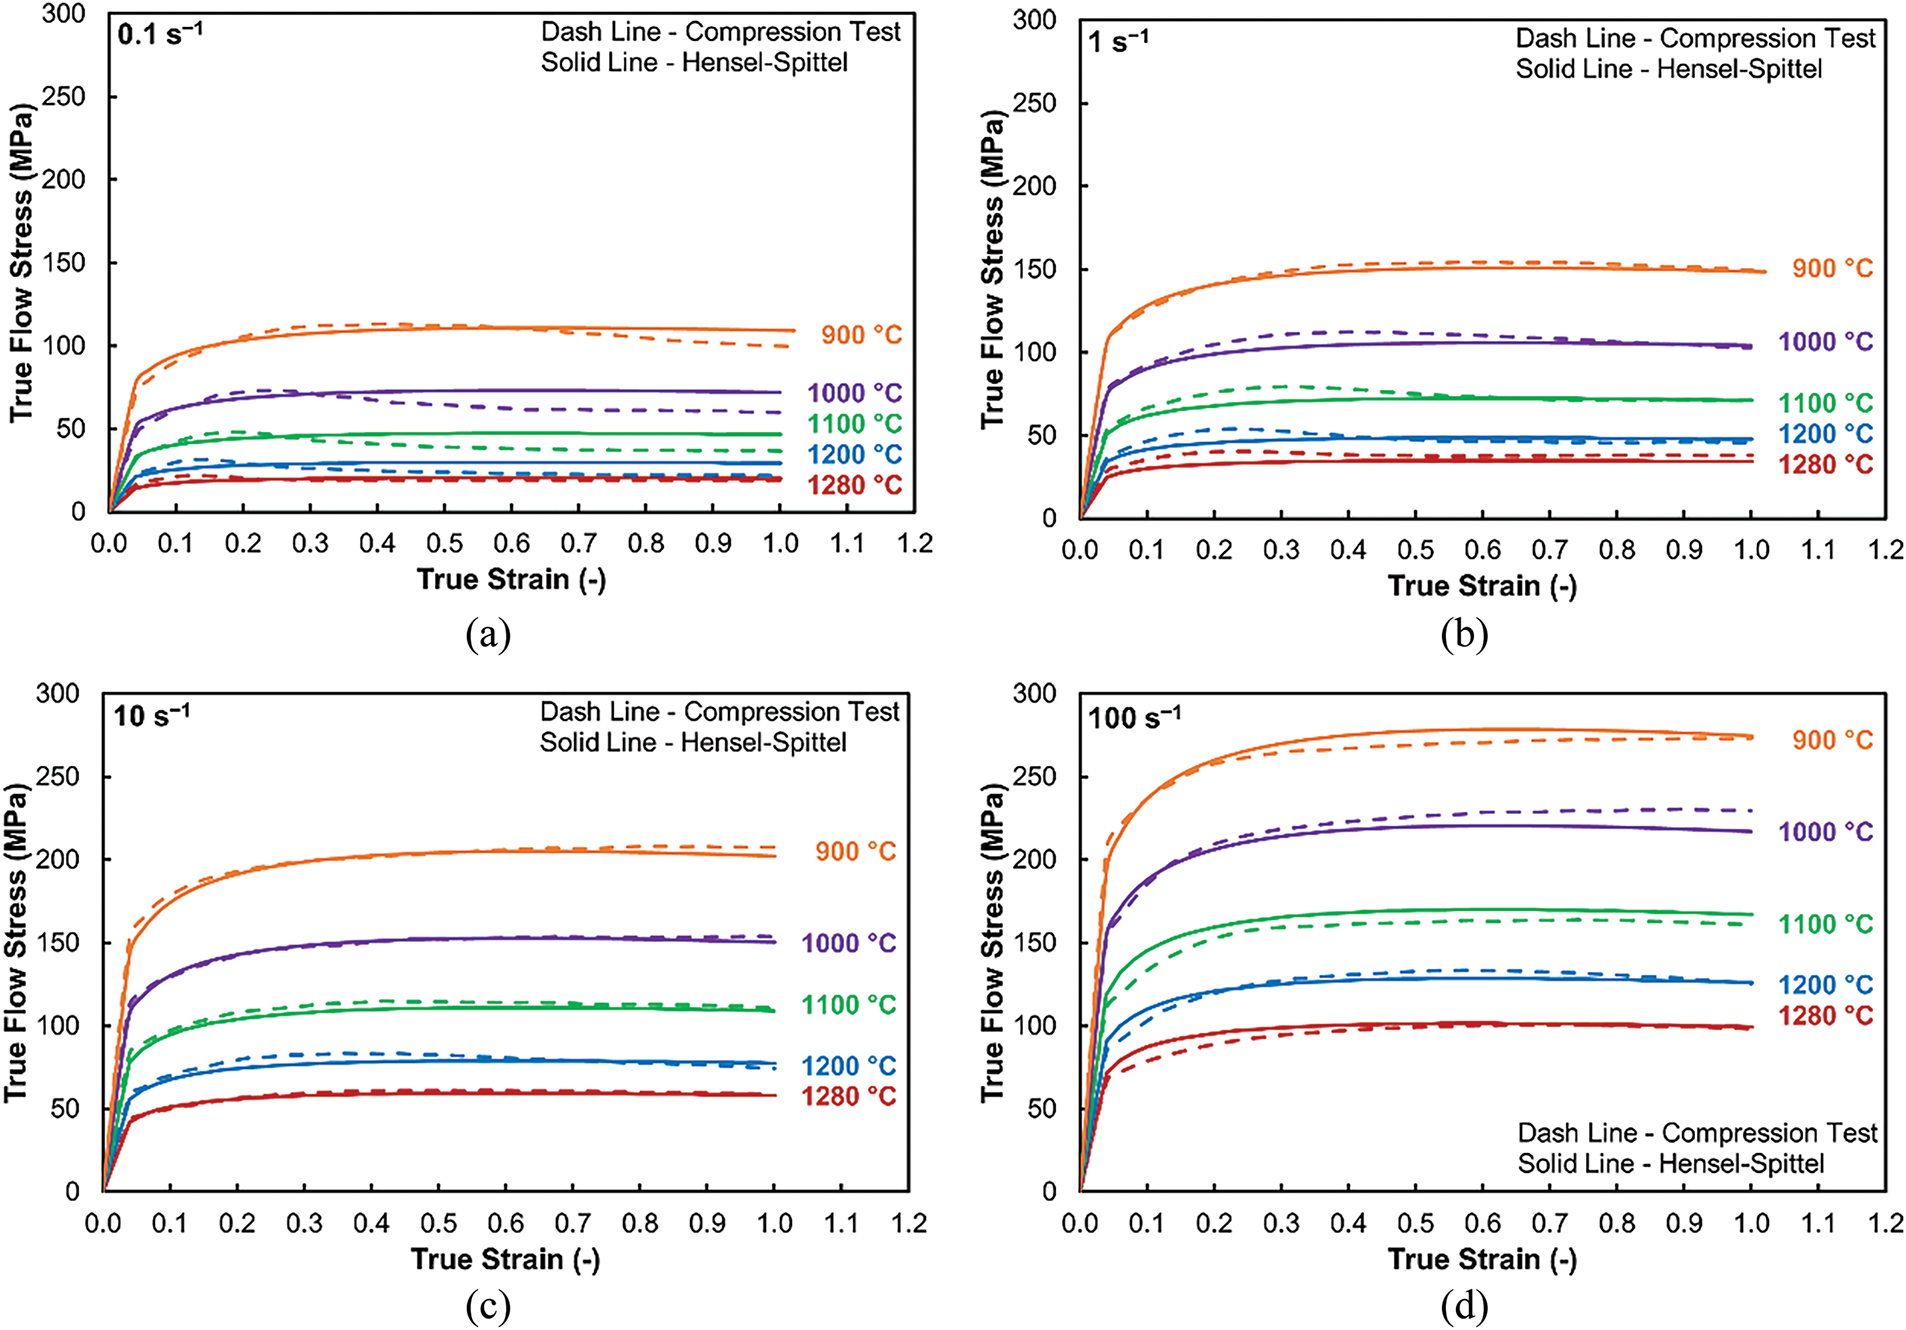
Figure 4: Hot flow stress curves for investigated AISI 1045 steel acquired by compression tests and predicted by Hensel-Spittel rheology law for strain rates: 0.1 s−1 (a); 1 s−1 (b); 10 s−1 (c); 100 s−1 (d)
The experimentally acquired curves also enable us to assume the hot deformation behavior of the investigated AISI 1045 steel from the viewpoint of the kinetics of the occurring softening/hardening processes. As regards the applied strain, the flow of stress generally rapidly increases at the beginning of deformation, which points to intense material strengthening due to rapid generation of dislocations and formation of substructure [74]. After reaching a critical level of accumulated energy (i.e., critical true strain value), the true stress exhibits a gradual transition to a steady-state flow (initiation of dynamic softening processes and gradual establishment of an equilibrium state between dynamic strengthening and softening processes). The comparison of Fig. 4a–d also reveals that the maximum true flow stress values increase with increasing applied strain rate. The figures impart that higher strain rates and lower deformation temperatures generally contribute to higher flow stress. In other words, such (combinations of) thermomechanical conditions support deformation hardening within the processed material. This can directly be related to the recrystallization kinetics. During dynamic recrystallization, new (refined) grains nucleate and grow at the expense of the original (larger) grains. However, this process requires time and thus rapid processing, i.e., deformation at high strain rates (e.g., processing via methods of intensive plastic deformation, such as rotary swaging [75–77], generally supports hardening over softening, which results in high flow stress maxima [78].
The flow stress is directly related to the force necessary to compress the test sample under the given thermomechanical conditions. The forces applied during the experimental compression tests are continuously measured and recorded and subsequently used to determine the true flow of stress values via Eq. (3). Fig. 5a,b shows the experimentally acquired dependences of forces on load times for the four monitored combinations of thermomechanical conditions, as stated in Table 4, together with the corresponding numerically predicted curves. The effects of temperature and strain rate on the load force correspond to the influences of these parameters on the flow stress, as stated above. In other words, decreasing temperature and increasing strain rate led to higher maximum forces. The applied force also evidently increases with increasing time of deformation, i.e., increasing imposed strain. When comparing the experimentally acquired force curves with the predicted ones, a satisfactory match can be seen especially for the samples deformed at the strain rate of 0.1 s−1; the curves acquired for 100 s−1 exhibit visible oscillations caused by the effect of the high strain rate (i.e., the movement of the anvils is responsible for these local increases and decreases). This fact confirms the applicability and reliability of the applied Hensel-Spittel model (Eq. (3), Table 2). However, deviations can be found in the final stages of deformation, when the experimentally measured forces, more or less suddenly, drop. Based on the fact that the final stage of the compression test is characterized by more influences such as barreling effect, different heat transfer than at the beginning stage of the test, and also by the highest imposed strain that could result in restoration process activation or phenomenon such as cracks occurrence. All these factors play their role in compression force development, of course, based on individual temperature and strain rate. As can be seen, a higher strain rate caused the fall of the experimentally measured force curve but only under 1280°C while lower temperature (i.e., 900°C) did not cause this effect. The reason for this behavior is in better condition for restoration process (in particular dynamic recrystallization) activation under higher temperatures. A lower temperature in conjunction with a higher strain rate (100 s−1) resulted in conditions that were not suitable for the same dynamic softening. On the other hand, the same temperature but under a lower strain rate (0.1 s−1) enabled softening of material (the drop of compression force).
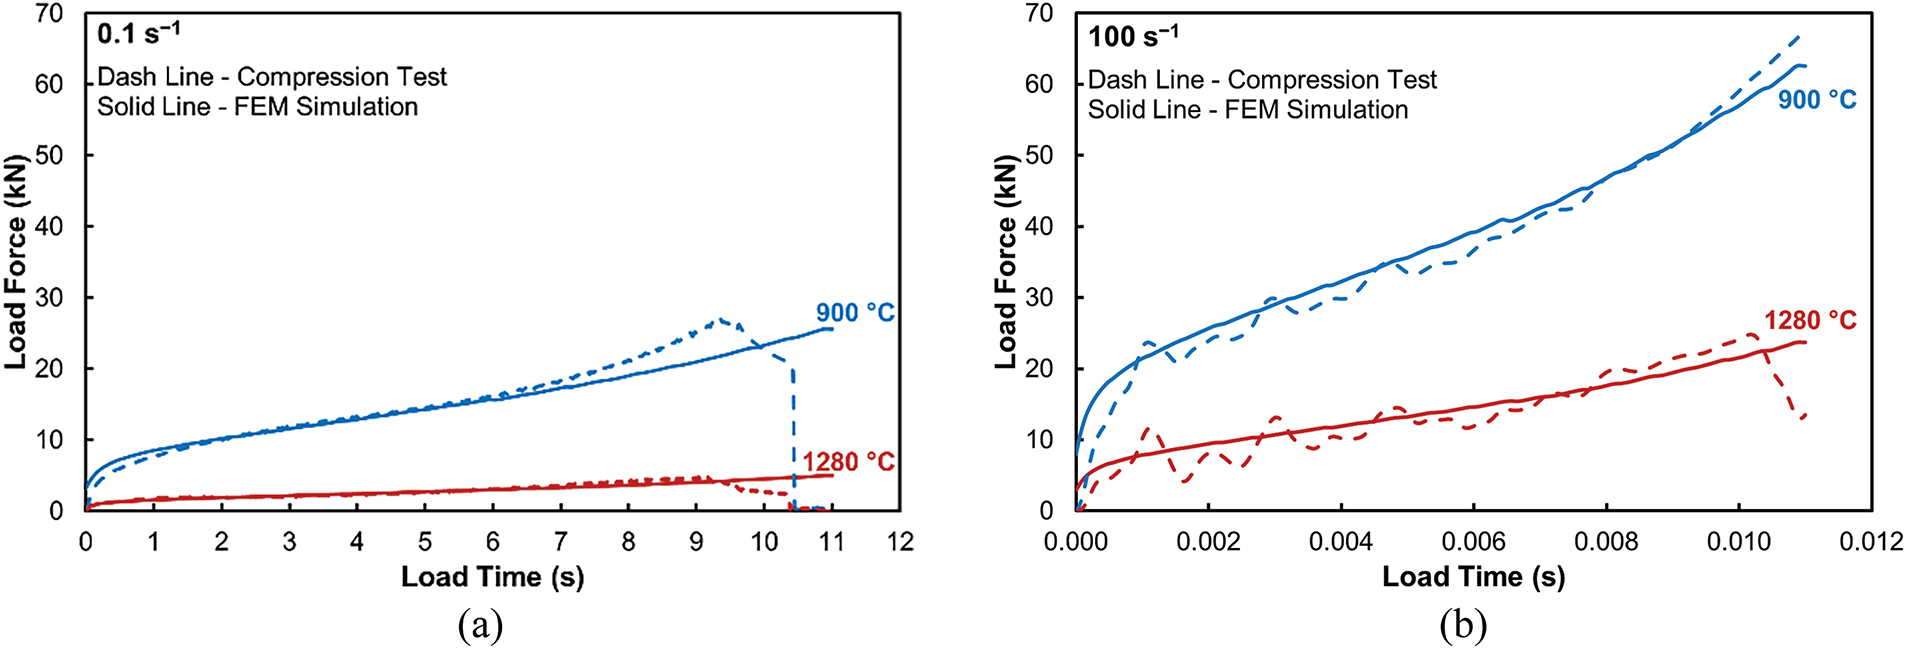
Figure 5: Load forces for AISI 1045 steel samples deformed at limit temperatures and strain rates: 0.1 s−1 (a); 100 s−1 (b)
The simulations were also used to map the distributions of the effectively imposed strain throughout the compressed samples. Fig. 6a–d documents the effective imposed strain distributions for the four assembled simulations, according to Table 4, at the final stage of deformation of a test sample. As can be seen, the distributions of the imposed strain were comparable for all the deformed samples, the maximum effective strain was up to ~2.0 in each case. The figures show that the largest effective strains are predicted to be located at the edges of the sample surfaces being in contact with the anvils—see the figures. This phenomenon is more pronounced the lower is the deformation temperature. Except for these surface locations, the maximum imposed strain is generally observed in the region along the sample axis. On the contrary, the minimum imposed strain is generally predicted along the sample surface being in contact with the anvils. This phenomenon can be attributed to the friction at the sample-anvil interface and explained more in detail by the material plastic flow. During the test, the sample is compressed between two anvils, as a result of which its height decreases, and width increases. The material plastic flow is the most aggravated at the sample surfaces being in contact with the anvils and gradually becomes more pronounced towards the bulk of the sample as the effect of friction diminishes and the free movement of the individual grains facilitates. As a consequence, the imposed effective strain is generally the lowest at the contact surfaces and increases towards the sample axis. The sample also typically exhibits bulging along its horizontal axis, which is also noticeable in Fig. 6a–d. The absolute strain maxima can then be observed at the very edges of the samples, at which the material layers the plastic flow of which is aggravated by the effect of friction, and the highly deformed (bulging) material layers collide. The influence of temperature and strain rate is not negligible, they have a significant effect on flow stress (see Fig. 4). The differences are connected with different material’s plastic flow where in the figure can be seen that under 900°C are contact areas of sample defined by lower imposed strain than in case of 1280°C. In addition, the central areas are characterized by higher values of imposed strain than under higher temperatures. The plastic flow is much more intensive in case of higher temperature whereas the imposed strain is localized in a more homogenous way.
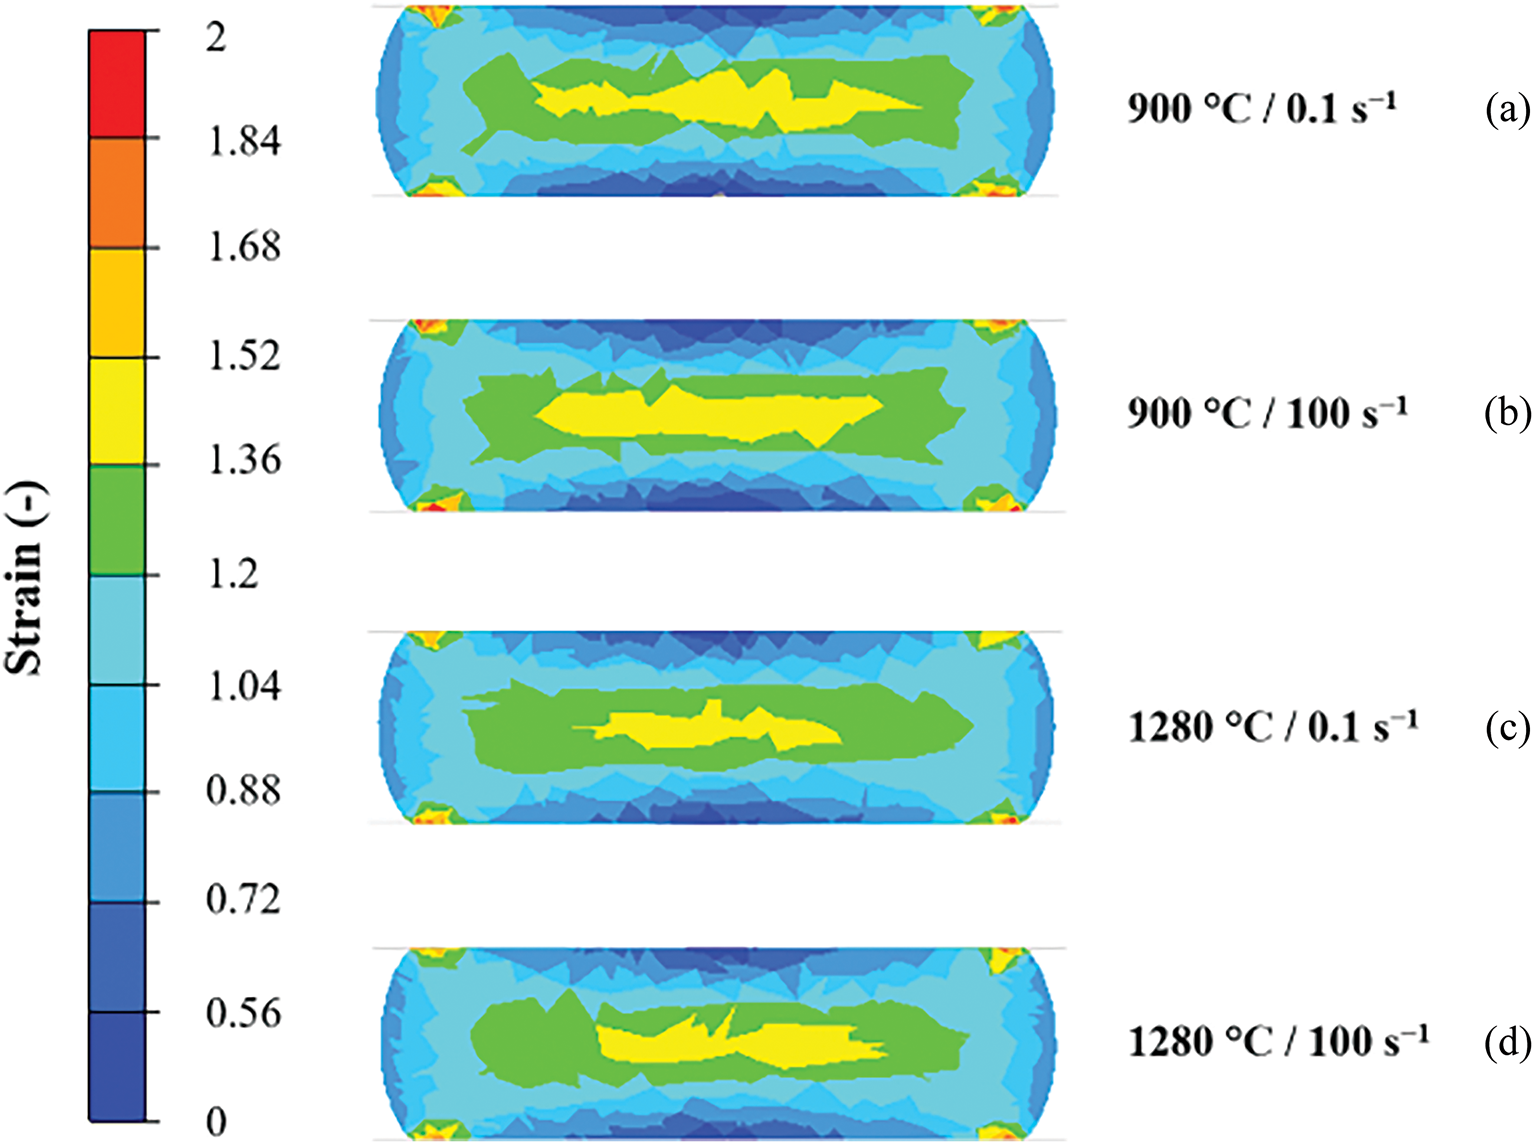
Figure 6: Distribution of imposed strain within deformed samples: UCT900/0.1 (a); UCT900/100 (b); UCT1280/0.1 (c); UCT1280/100 (d)
The inhomogeneity of the effective imposed strain across the compressed samples was further examined with the help of three individual sensors located in selected specific points on the samples, as shown in Fig. 7a. The sensors were located along the sample’s vertical axis, at the very top surface of the sample and in its middle height, as well as at its lateral surface, in the middle height, to provide an overview of the development of strain for the individual samples during the entire compression procedure. Fig. 7b then summarizes the development of the imposed strain in time for the individual monitored sensors. The figure shows that two of the monitored locations (sensors 2 and 3) exhibit comparable behaviors as regards the imposed strain, while the third location (sensor 1) demonstrates a reverse trend. In other words, the strain developments depicted by sensors 2 and 3 points to a lower work hardening rate during testing at the lower temperature and strain rate, while, on the contrary, sensor 1, located at the contact surface area, exhibits a more intense work hardening (for identical testing conditions). The most probable reason for this difference is the influence of friction; the effect of friction on the contact surface tends to be more pronounced at the lower strain rate. On the other hand, a higher strain rate decreases this influence of friction on work hardening, which results in a steeper increase of the strain curve.
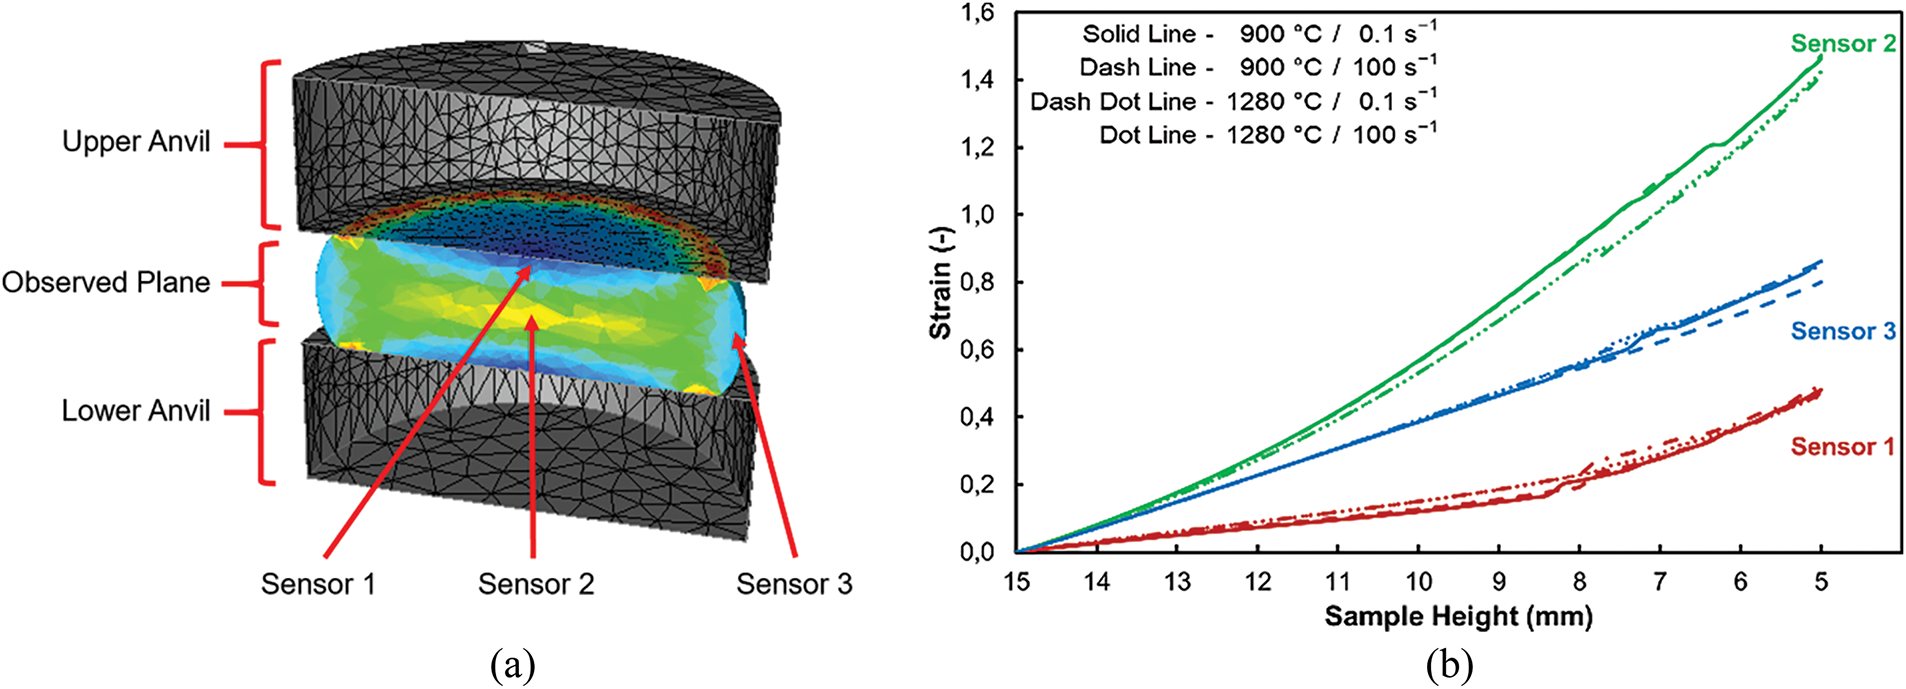
Figure 7: Locations of monitored sensors (a); development of imposed strain in selected monitored locations of compressed samples (b)
4.3 Distribution of Temperature
Last but not least, the sensors are used to monitor the development of temperature during deformation, see Fig. 8a for the samples deformed at 900°C, and Fig. 8b for those deformed at 1280°C. Although the deformation temperature is held constant during the compression test, it is assumed to slightly increase during testing due to the development of deformation heat. This assumption was, therefore, examined (and confirmed) by predicting the deformation temperature in the monitored sensors. While the generation of deformation heat is negligible at the low strain rate of 0.1 s−1, the increase is noticeable at the high strain rate of 100 s−1, especially in the vicinity of the axial region of a test sample, as indicated by the curves for sensor 2 (see Fig. 8a,b). During testing at the temperature of 900°C, the axial regions of the sample heated up to 60°C by the effect of deformation heat, while at the testing temperature of 1280°C, the temperature increase was slightly lower (~20°C). This finding follows the above-discussed distribution of the imposed strain; the largest value is predicted in the axial region of a sample. Nevertheless, the temperature increase is three times (i.e., 63°C, when considering a relative increase) in the case of the lower deformation temperature and higher strain rate, see Fig. 8a,b.
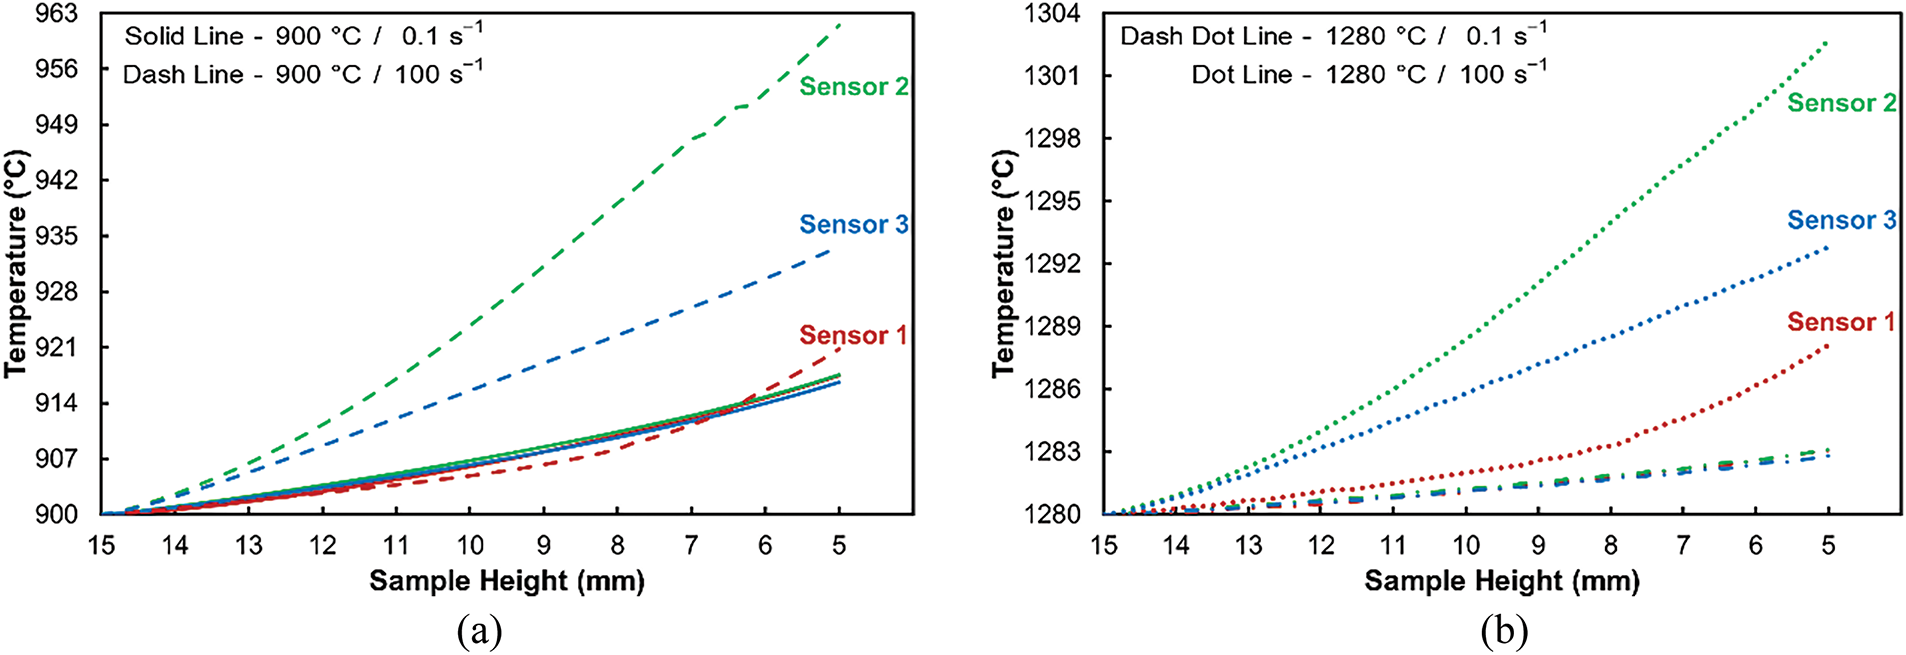
Figure 8: Temperature evolution computed by simulations in selected sample parts for the deformation temperature: 900°C (a); 1280°C (b)
The microstructure analysis was performed for the initial sample, as well as for selected samples subjected to the uniaxial hot compression test (under limited conditions). The detailed EBSD analyses primarily aimed to complement the results of the numerical simulations. Therefore, in addition to the initial sample, deformed samples designated as UCT1280/0.1 and UCT1280/100 were examined. The grains analysis showed that the average grain size (measured as the diameter) within the initial sample was 50.4 µm, while the average grain size after deformation was 47.0 µm in the axial area and 40.1 µm in the (sub) surface area for the UCT1280/0.1 sample, and 40.7 and 37.5 µm for the UCT1280/100 sample, respectively. The results thus document that the grain refinement during the compression at 1280°C is not significant, which can primarily be attributed to the high deformation temperature. However, a slight difference between the grain size values for both the deformed samples can be seen; a smaller average grain size was observed for the sample deformed at the high strain rate of 100 s−1. This phenomenon corresponds to the above-discussed hypothesis that decreasing the strain rate provides more time for the grains to soften and recrystallize. The primary recrystallization was, in the case of the UCT1280/0.1 sample, most probably followed by secondary recrystallization, i.e., grain growth, as the result of which the grain size is slightly larger within this sample than within the UCT1280/100 one. The larger imposed strain is associated with a greater accumulation of energy, which promotes a faster onset of dynamic recrystallization. The axial areas of the deformed sample are always warmer than the surface areas. The axial areas took longer for the dynamically recrystallized grains to grow, so their size is larger in the axial than at the (sub)surface of the deformed sample [78].
Fig. 9a then depicts the OIM of the microstructure in the axial area of the initial sample, while Fig. 9b,c shows the OIM images of the microstructures in the axial areas for the samples after the uniaxial hot compression tests (UCT1280/0.1, and UCT1280/100, respectively). The images confirm that the hot compressive deformation not only introduced grain fragmentation and refinement (to a certain extent), but primarily provoked the development of dynamic restoration processes, as new subgrains were formed, especially within the microstructure of the UCT1280/100 sample. The comparison of the OIM images in Fig. 9b,c also confirms the discussed effects of strain rate on microstructure development.
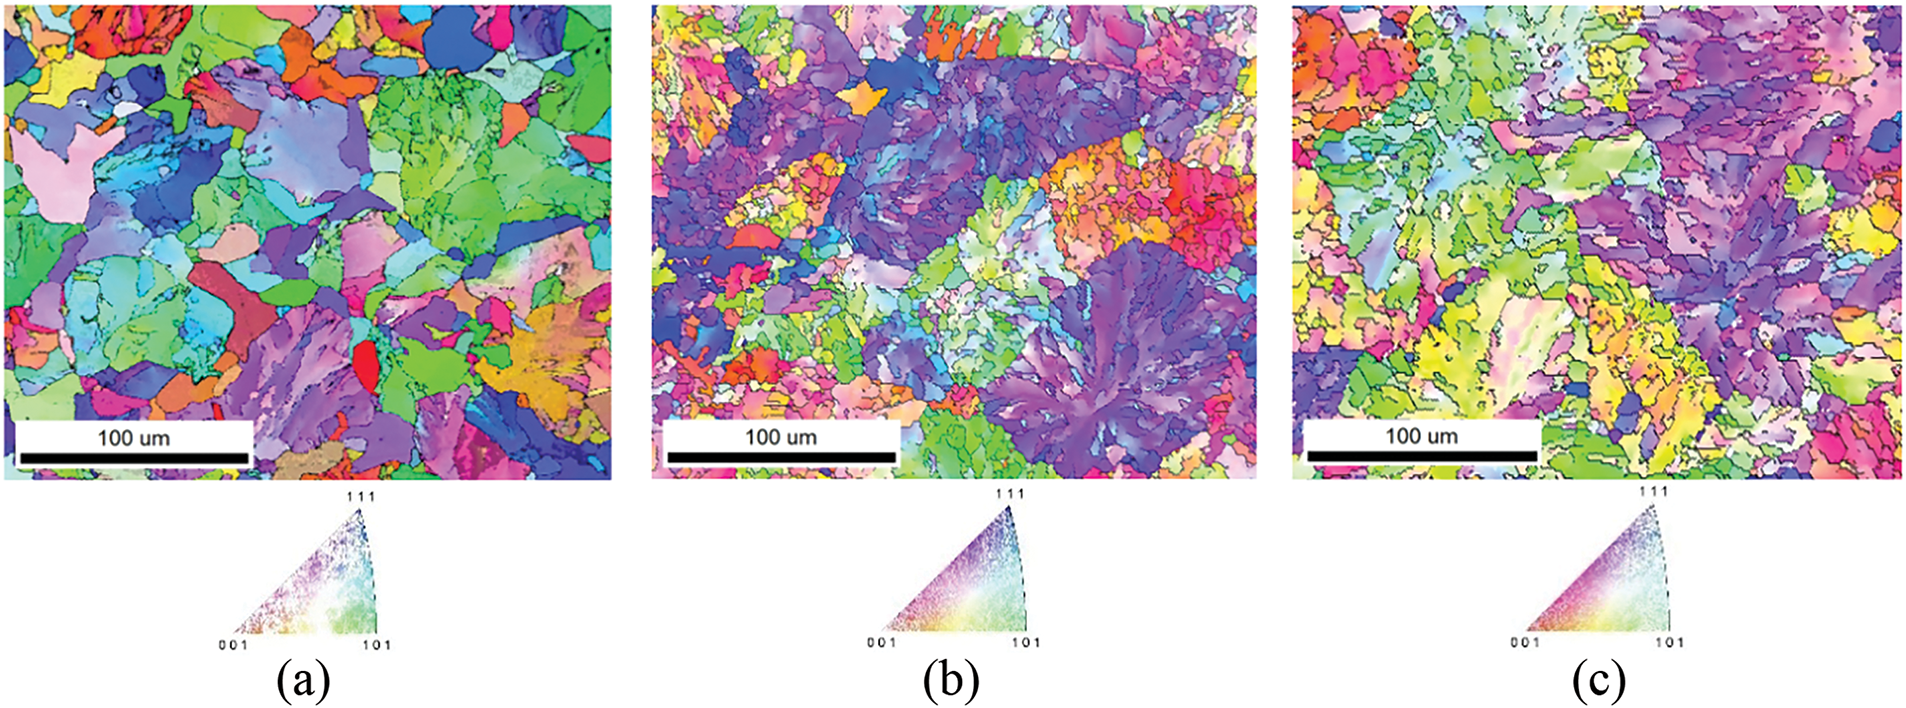
Figure 9: OIM images for microstructures of samples: initial (a); UCT1280/0.1 (b); UCT1280/100 (c)
The EBSD data acquired for the initial, UCT1280/0.1, and UCT1280/100 samples (axial areas) were subsequently used to assess the grains orientations, i.e., texture, via (Inverse) Pole Figures, PF, and IPF. Fig. 10a shows the PFs for the grains within the initial sample, while Fig. 10b,c shows the PFs for the UCT1280/0.1 and UCT1280/100 samples after the hot compression tests. Fig. 11a then shows the set of IPFs for the initial sample, and Fig. 11b,c show the IPFs for the UCT1280/0.1 and UCT1280/100 samples. The PF and IPF images for the initial sample, Figs. 10a and 11a, document a slight tendency of the grains to form the ideal <110>||RD (rolling direction) α fiber texture [79]. However, the ideal orientations are shifted by approx. 10° towards the transverse direction (TD). These findings correspond to the fact that the initial steel was in a rolled and normalized state (Section 2.1). The directions of RD, TD and ND (normal direction) coordinate system correspond to those in Fig. 3. The deformation performed during the compression tests then influenced not only the texture intensity but also the grains’ orientations. The comparison of the texture intensities observed for the initial sample and the deformed ones (compare Figs. 10a and 11a to Figs. 10b, 11b, 10c, and 11c) reveals that the maximum texture intensity decreased slightly after the deformation, which can primarily be attributed to the high deformation temperature of 1280°C supporting the development of dynamic recrystallization. However, it also reveals that the maximum intensity was higher for the sample deformed at the higher strain rate of 100 s−1. This, again, confirms the above-presented hypothesis that lowering the strain rate provides enough time for the grains to relax and recrystallize, which supports texture randomization. As regards the texture orientations, the grains within both the compressed samples tended to acquire randomized orientations. This can especially be seen in Fig. 11b,c, showing that the grains within none of the deformed samples tended to form any intense ideal texture fiber (the texture was more randomized for the UCT1280/0.1 sample, as the maximum intensity was only slightly more than two times random).
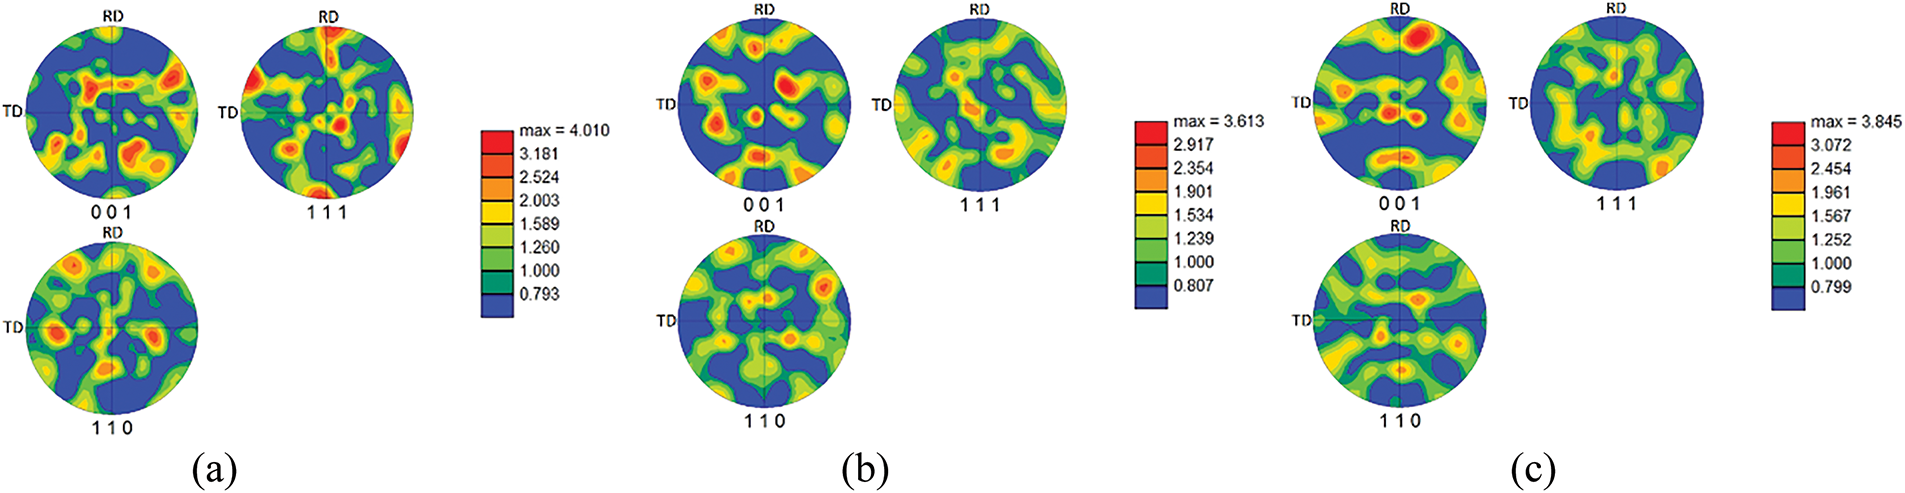
Figure 10: Pole figures depicting grains orientations for samples: initial (a); UCT1280/0.1 (b); UCT1280/100 (c)
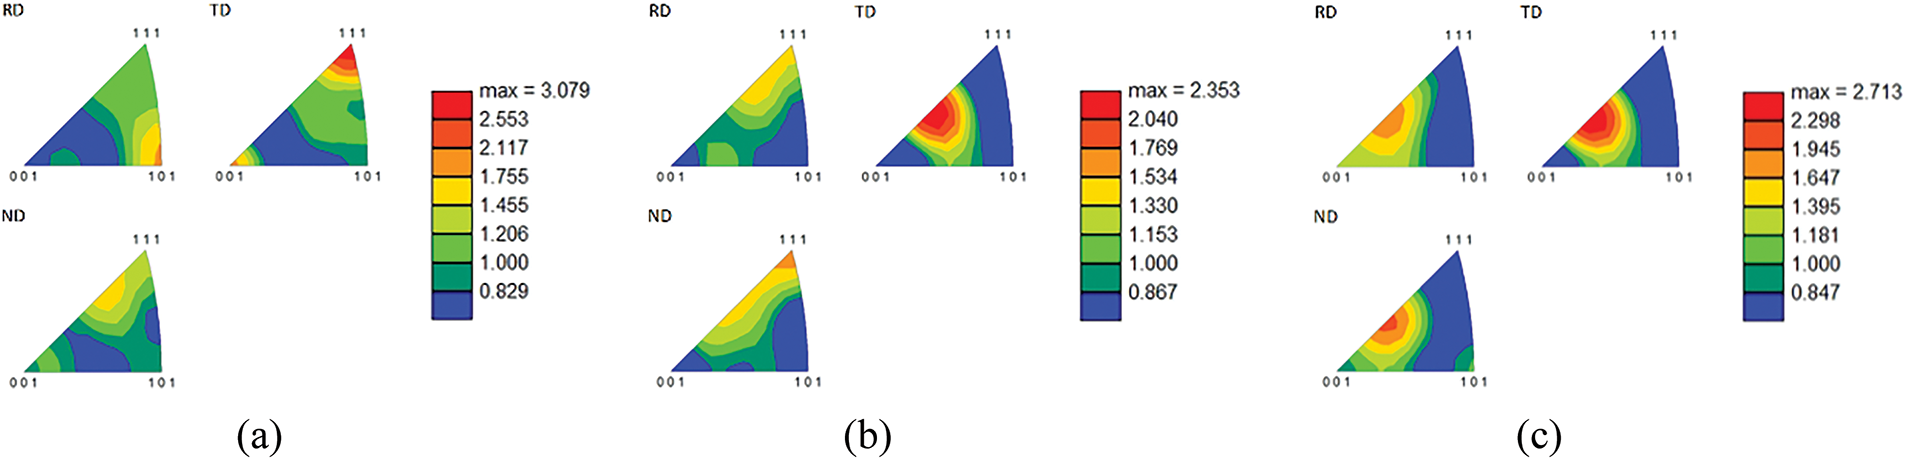
Figure 11: Inverse pole figures depicting grains orientations for samples: initial (a); UCT1280/0.1 (b); UCT1280/100 (c)
The focus of the presented study was to establish a rheology law applicable to numerically predict the deformation behavior of the AISI 1045 steel under a variety of hot forming conditions, and to perform subsequent numerical simulation and supplementary microstructure observations verifying the established model. The main acquired results are the following:
• Numerical simulations confirmed the reliability of the established Hensel-Spittel model.
• Flow stress curves predicted using the established rheology law corresponded to the experimental ones with sufficient accuracy, especially for samples deformed at 0.1 s−1.
• Distributions of the imposed strain, investigated using individual monitoring sensors, were comparable for all the deformed samples, with the maximum effective strain of ~2.0 for each, certain strain inhomogeneity introduced by the (inevitable) effect of friction was observed.
• Samples subjected to the highest testing temperatures (above 1200°C) exhibited relatively low maximum flow stress due to the occurrence of restoration (also supported by the development of deformation heat).
• Deformation conditions during testing influenced also grain orientations and texture intensity.
The limitation of this study, i.e., applicability of the acquired results (established rheology law), is related to the fact that the investigated material was in a hot rolled state, which can feature certain anisotropy in the microstructure, as well as in the mechanical properties.
Acknowledgement: The cooperation of Dr. Petr Opěla, Department of Metallurgical Technologies, Faculty of Materials Science and Technology, VSB–Technical University of Ostrava, and Dr. Jaromír Kopeček, FZU—Institute of Physics of the Czech Academy of Sciences, is greatly appreciated.
Funding Statement: This article was created with the support of the project SP2024/089 of the Specific Research of the VŠB-TUO. This article was also realized within the framework of the Johannes Amos Comenius Program, Materials and Technologies for Sustainable Development-MATUR, No. CZ.02.01.01/00/22_008/0004â31.
Author Contributions: The authors confirm contribution to the paper as follows: study conception and design: Josef Walek; data collection: Josef Walek, Petr Lichý; analysis and interpretation of results: Josef Walek, Petr Lichý; draft manuscript preparation: Josef Walek. All authors reviewed the results and approved the final version of the manuscript.
Availability of Data and Materials: The data that supports the findings of this study is available from the corresponding authors upon request.
Ethics Approval: Not applicable.
Conflicts of Interest: The authors declare no conflicts of interest to report regarding the present study.
References
1. Wu J, Zhou Z, Lin X, Qiao H, Zhao J, Ding W. Improving the wear and corrosion resistance of aeronautical component material by laser shock processing: a review. Materials. 2023;16(11):4124. doi:10.3390/ma16114124. [Google Scholar] [PubMed] [CrossRef]
2. Yadav SD, Kalácska S, Dománková M, Yubero DC, Resel R, Groma I, et al. Evolution of the substructure of a novel 12% Cr steel under creep conditions. Mater Charact. 2016;115:23–31. doi:10.1016/j.matchar.2016.03.015. [Google Scholar] [CrossRef]
3. Kunčická L, Kocich R, Strunz P, Macháčková A. Texture and residual stress within rotary swaged Cu/Al clad composites. Mater Lett. 2018;230:88–91. doi:10.1016/j.matlet.2018.07.085. [Google Scholar] [CrossRef]
4. Kunčická L, Walek J, Kocich R. Microstructure development of powder-based Cu composite during high shear strain processing. Metals. 2024;14(12):1331. doi:10.3390/met14121331. [Google Scholar] [CrossRef]
5. Pustovoytov D, Pesin A, Tandon P. Asymmetric (hot, warm, cold, cryo) rolling of light alloys: a review. Metals. 2021;11(6):956. doi:10.3390/met11060956. [Google Scholar] [CrossRef]
6. Lukáč P, Kocich R, Greger M, Padalka O, Száraz Z. Microstructure of AZ31 and AZ61 Mg alloys prepared by rolling and ECAP. Kov Mater. 2007;45(3):115–20. [Google Scholar]
7. Galiev FF, Saikov IV, Alymov MI, Konovalikhin SV, Sachkova NV, Berbentsev VD. Composite rods by high-temperature gas extrusion of steel cartridges stuffed with reactive Ni-Al powder compacts: influence of process parameters. Intermetallics. 2021;138:107317. doi:10.1016/j.intermet.2021.107317. [Google Scholar] [CrossRef]
8. Demin D, Grebenkin I. Application of ML methods to predict residual stresses and strains after wire drawing process. Int J Adv Manuf Technol. 2024;133(7):3461–73. doi:10.1007/s00170-024-13949-2. [Google Scholar] [CrossRef]
9. Jiang MG, Yan H, Chen RS. Enhanced mechanical properties due to grain refinement and texture modification in an AZ61 Mg alloy processed by small strain impact forging. Mater Sci Eng A. 2015;621:204–11. doi:10.1016/j.msea.2014.10.075. [Google Scholar] [CrossRef]
10. Valiev RZ, Straumal B, Langdon TG. Using severe plastic deformation to produce nanostructured materials with superior properties. Annu Rev Mater Res. 2022;52:357–82. doi:10.1146/annurev-matsci-081720-123248. [Google Scholar] [CrossRef]
11. Kocich R, Szurman I, Kursa M, Fiala J. Investigation of influence of preparation and heat treatment on deformation behaviour of the alloy NiTi after ECAE. Mater Sci Eng A. 2009;512(1–2):100–4. doi:10.1016/j.msea.2009.01.054. [Google Scholar] [CrossRef]
12. Naizabekov AB, Andreyachshenko VA, Kocich R. Study of deformation behavior, structure and mechanical properties of the AlSiMnFe alloy during ECAP-PBP. Micron. 2013;44:210–7. doi:10.1016/j.micron.2012.06.011. [Google Scholar] [PubMed] [CrossRef]
13. Kunčická L, Kocich R, Drápala J, Andreyachshenko VA. FEM simulations and comparison of the ECAP and ECAP-PBP influence on Ti6Al4V alloy’s deformation behaviour. In: METAL 2013: 22nd International Conference on Metallurgy and Materials; 2013 May 15–17; Brno, Czech Republic. p. 391–96. [Google Scholar]
14. Kocich R, Kunčická L, Král P, Macháčková A. Sub-structure and mechanical properties of twist channel angular pressed aluminium. Mater Charact. 2016;119:75–83. doi:10.1016/j.matchar.2016.07.020. [Google Scholar] [CrossRef]
15. Kunčická L, Kocich R, Ryukhtin V, Cullen JCT, Lavery NP. Study of structure of naturally aged aluminium after twist channel angular pressing. Mater Charact. 2019;152:94–100. doi:10.1016/j.matchar.2019.03.045. [Google Scholar] [CrossRef]
16. Manjunath GA, Shivakumar S, Fernandez R, Nikhil R, Sharath PC. A review on effect of multi-directional forging/multi-axial forging on mechanical and microstructural properties of aluminum alloy. Mater Today Proc. 2021;47:2565–9. doi:10.1016/j.matpr.2021.05.056. [Google Scholar] [CrossRef]
17. Kocich R, Kunčická L. Development of structure and properties in bimetallic Al/Cu sandwich composite during cumulative severe plastic deformation. J Sandw Struct Mater. 2021;23(8):4252–75. doi:10.1177/1099636221993886. [Google Scholar] [CrossRef]
18. Gao C, Wang B, Yang C, Zhao Q, Ren Y, Xue P, et al. Effect of multipass submerged friction stir processing on the microstructure, mechanical properties and corrosion resistance of 5383Al alloy. J Mater Process Technol. 2024;328:118416. doi:10.1016/j.jmatprotec.2024.118416. [Google Scholar] [CrossRef]
19. Kocich R, Kursa M, Szurman I, Dlouhý A. The influence of imposed strain on the development of microstructure and transformation characteristics of Ni-Ti shape memory alloys. J Alloys Compd. 2011;509(6):2716–22. doi:10.1016/j.jallcom.2010.12.003. [Google Scholar] [CrossRef]
20. Macháčková A, Krátká L, Petrmichl R, Kunčická L, Kocich R. Affecting structure characteristics of rotary swaged tungsten heavy alloy via variable deformation temperature. Materials. 2019;12(24):4200. doi:10.3390/ma12244200. [Google Scholar] [PubMed] [CrossRef]
21. Wang Z, Chen J, Kocich R, Tardif S, Dolbnya IP, Kunčická L, et al. Grain structure engineering of NiTi shape memory alloys by intensive plastic deformation. ACS Appl Mater Interfaces. 2022;14(27):31396–410. doi:10.1021/acsami.2c05939. [Google Scholar] [PubMed] [CrossRef]
22. Ukai S, Ohtsuka S, Kaito T, Carlan Y, Ribis J, Malaplate J. Oxide dispersion-strengthened/ferrite-martensite steels as core materials for Generation IV nuclear reactors. In: Structural materials for generation IV nuclear reactors. Cambridge: Woodhead Publishing; 2017. p. 357–414. [Google Scholar]
23. Zagarin DA, Dzotsenidze TD, Kozlovskaya MA, Shkel’ AS, Rodchenkov DA, Bugaev AM, et al. Strength of a load-carrying steel frame of a mobile wheeled vehicle cabin. Metallurgist. 2020;64(5):476–82. doi:10.1007/s11015-020-01017-5. [Google Scholar] [CrossRef]
24. Kunčická L, Kocich R, Lowe TC. Advances in metals and alloys for joint replacement. Prog Mater Sci. 2017;88:232–80. doi:10.1016/j.pmatsci.2017.04.002. [Google Scholar] [CrossRef]
25. Li L, Wu H, Guo C, Feng Y. Deformation behavior and softening mechanism in ferrite steel during warm deformation. J Mater Res Technol. 2022;18:3977–90. doi:10.1016/j.jmrt.2022.04.067. [Google Scholar] [CrossRef]
26. He QF, Wang YW, Zhang ZB, Wang Q, Yang Y, Gu JF. The effect of chemical short-range order on incipient plastic behavior in FCC structured high entropy alloys. Mater Charact. 2024;217:114357. doi:10.1016/j.matchar.2024.114357. [Google Scholar] [CrossRef]
27. Walek J, Tkadlečková M, Velička M, Machů M, Cupek J, Huczala T, et al. Physical experiments and numerical simulations of the influence of turbulence inhibitors and the position of ladle shroud on the steel flow in an asymmetric five-strand tundish. Metals. 2023;13(11):1821. doi:10.3390/met13111821. [Google Scholar] [CrossRef]
28. Walek J, Odehnalová A, Kocich R. Analysis of thermophysical properties of electro slag remelting and evaluation of metallographic cleanliness of steel. Materials. 2024;17(18):4613. doi:10.3390/ma17184613. [Google Scholar] [PubMed] [CrossRef]
29. Kunčická L, Kocich R, Král P, Pohludka M, Marek M. Effect of strain path on severely deformed aluminium. Mater Lett. 2016;180:280–3. doi:10.1016/j.matlet.2016.05.163. [Google Scholar] [CrossRef]
30. Liu R, Wang B, Hu S. Damage behaviour and GTN parameter analysis of TC4 powder metallurgy titanium alloy during hot deformation. Arch Civ Mech Eng. 2023;23(3):165. doi:10.1007/s43452-023-00708-5. [Google Scholar] [CrossRef]
31. Strunz P, Kunčická L, Beran P, Kocich R, Hervoches C. Correlating microstrain and activated slip systems with mechanical properties within rotary swaged WNiCo pseudoalloy. Materials. 2020;13(1):208. doi:10.3390/ma13010208. [Google Scholar] [PubMed] [CrossRef]
32. Strunz P, Kocich R, Canelo-Yubero D, Macháčková A, Beran P, Krátká L. Texture and differential stress development in W/Ni-co composite after rotary swaging. Materials. 2020;13(12):2869. doi:10.3390/ma13122869. [Google Scholar] [PubMed] [CrossRef]
33. Qin X, Huang D, Yan X, Zhang X, Qi M, Yue S. Hot deformation behaviors and optimization of processing parameters for Alloy 602 CA. J Alloys Compd. 2019;770:507–16. doi:10.1016/j.jallcom.2018.08.144. [Google Scholar] [CrossRef]
34. Chen XM, Ning MT, Hu HW, Lin YC, Zhou XJ, Zhang J, et al. Characterization of hot deformation behavior and optimization of hot workability for GH4698 superalloy. Mater Charact. 2023;201:112916. doi:10.1016/j.matchar.2023.112916. [Google Scholar] [CrossRef]
35. Jia Z, Sun X, Ji J, Wang Y, Wei B, Yu L. Hot deformation behavior and dynamic recrystallization nucleation mechanisms of inconel 625 during hot compressive deformation. Adv Eng Mater. 2021;23(3):2001048. doi:10.1002/adem.202001048. [Google Scholar] [CrossRef]
36. Kunčická L, Kocich R. Optimizing electric conductivity of innovative Al-Cu laminated composites via thermomechanical treatment. Mater Des. 2022;215:110441. doi:10.1016/j.matdes.2022.110441. [Google Scholar] [CrossRef]
37. Kunčická L, Kocich R. Effect of activated slip systems on dynamic recrystallization during rotary swaging of electro-conductive Al-Cu composites. Mater Lett. 2022;321:132436. doi:10.1016/j.matlet.2022.132436. [Google Scholar] [CrossRef]
38. Kocich R, Kunčická L. Optimizing structure and properties of Al/Cu laminated conductors via severe shear strain. J Alloys Compd. 2023;953:170124. doi:10.1016/j.jallcom.2023.170124. [Google Scholar] [CrossRef]
39. Khoddam S, Solhjoo S, Hodgson PD. State of the art methods to post-process mechanical test data to characterize the hot deformation behavior of metals. Adv Mech Eng. 2021;13(11):16878140211061026. doi:10.1177/16878140211061026. [Google Scholar] [CrossRef]
40. Meng Y, Lin JY, Yanagida A, Yanagimoto J. Modeling static and dynamic kinetics of microstructural evolution in hot deformation of Fe-0.15C-0.2Si-1.4Mn-0.03Nb alloy. Steel Res Int. 2017;88(11):1700036. doi:10.1002/srin.201700036. [Google Scholar] [CrossRef]
41. Kořínek M, Halama R, Fojtík F, Pagáč M, Krček J, Krzikalla D, et al. Monotonic tension-torsion experiments and FE modeling on notched specimens produced by SLM technology from SS316L. Materials. 2020;14(1):33. doi:10.3390/ma14010033. [Google Scholar] [PubMed] [CrossRef]
42. Abbasi-Bani AR, Zarei-Hanzaki A, Shabestari MG, Abedi HR. Flow softening and recrystallization accompanied flow in AZ61 magnesium alloy during thermomechanical processing. Heliyon. 2024;10(18):e37625. doi:10.1016/j.heliyon.2024.e37625. [Google Scholar] [PubMed] [CrossRef]
43. Guan G, Fan J, Zhang Q, Li W, Dong H, Ma C, et al. Hot deformation behavior and processing map of the nanocrystalline pure Mg. Mater Sci Technol. 2024;920:1293. doi:10.1177/02670836241280933. [Google Scholar] [CrossRef]
44. Xu W, Zhang J, Pang Q, Hu ZL. Study on formability and deformation behavior of friction stir welding AA2024-7075 joint. Int J Adv Manuf Technol. 2023;128(5):2689–703. doi:10.1007/s00170-023-12081-x. [Google Scholar] [CrossRef]
45. Kocich R, Opěla P, Marek M. Influence of structure development on performance of copper composites processed via intensive plastic deformation. Materials. 2023;16(13):4780. doi:10.3390/ma16134780. [Google Scholar] [PubMed] [CrossRef]
46. Fu MW, Wang JL, Korsunsky AM. A review of geometrical and microstructural size effects in micro-scale deformation processing of metallic alloy components. Int J Mach Tools Manuf. 2016;109:94–125. doi:10.1016/j.ijmachtools.2016.07.006. [Google Scholar] [CrossRef]
47. Kunčická L, Kocich R, Németh G, Dvořák K, Pagáč M. Effect of post process shear straining on structure and mechanical properties of 316 L stainless steel manufactured via powder bed fusion. Addit Manuf. 2022;59:103128. doi:10.1016/j.addma.2022.103128. [Google Scholar] [CrossRef]
48. Liu R, Wang W, Chen H, Zhang Y, Wan S. Hot deformation and processing maps of B4C/6061Al nanocomposites fabricated by spark plasma sintering. J Mater Eng Perform. 2019;28(10):6287–97. doi:10.1007/s11665-019-04336-0. [Google Scholar] [CrossRef]
49. Alaneme KK, Anaele JU, Bodunrin MO. Hot deformation processing of shape memory alloys: a review of effects on plastic flow behaviour, deformation mechanisms, and functional characteristics. Alex Eng J. 2022;61(12):12759–83. doi:10.1016/j.aej.2022.06.055. [Google Scholar] [CrossRef]
50. Li B, Chu ZJ, Du Y, Zhou W, Zhou X. Hot deformation behavior and dynamic recrystallization kinetics of a novel Sc and Zr modified ultra-high-strength Al-Zn-Mg-Cu alloy. J Mater Eng Perform. 2020;29(12):7774–84. doi:10.1007/s11665-020-05255-1. [Google Scholar] [CrossRef]
51. Varela-Castro G, Cabrera JM, Prado JM. Critical strain for dynamic recrystallisation. The particular case of steels. Metals. 2020;10(1):135. doi:10.3390/met10010135. [Google Scholar] [CrossRef]
52. Řeháčková L, Novák V, Tokarský J, Heger M, Zimný O, Mattfytfsek D, et al. Rheological behaviour of CaO-MgO–SiO2–Al2O3–B2O3 system with varying B2O3 content up to 30 wt% at basicity of 0.4. Ceram Int. 2024;50(1):1389–97. doi:10.1016/j.ceramint.2023.10.228. [Google Scholar] [CrossRef]
53. Kern M, Bernhard M, Bernhard C, Kang YB. Grain boundary mobility of γ-Fe in high-purity iron during isothermal annealing. Scr Mater. 2023;230:115431. doi:10.1016/j.scriptamat.2023.115431. [Google Scholar] [CrossRef]
54. Chen X, Si Y, Bai R, Zhang X, Li Z. Hot formability study of Cr5 alloy steel by integration of FEM and 3D processing maps. Materials. 2022;15(14):4801. doi:10.3390/ma15144801. [Google Scholar] [PubMed] [CrossRef]
55. Chen X, Sun J, Yang Y, Liu B, Si Y, Zhou J. Finite element analysis of dynamic recrystallization model and microstructural evolution for GCr15 bearing steel warm-hot deformation process. Materials. 2023;16(13):4806. doi:10.3390/ma16134806. [Google Scholar] [PubMed] [CrossRef]
56. Singh G, Souza PM. Hot deformation behavior of a novel alpha + beta titanium alloy TIMETAL®407. J Alloys Compd. 2023;935:167970. doi:10.1016/j.jallcom.2022.167970. [Google Scholar] [CrossRef]
57. Macháčková A, Kocich R, Bojko M, Kunčická L, Polko K. Numerical and experimental investigation of flue gases heat recovery via condensing heat exchanger. Int J Heat Mass Transf. 2018;124:1321–33. doi:10.1016/j.ijheatmasstransfer.2018.04.051. [Google Scholar] [CrossRef]
58. Savaedi Z, Motallebi R, Mirzadeh H. A review of hot deformation behavior and constitutive models to predict flow stress of high-entropy alloys. J Alloys Compd. 2022;903:163964. doi:10.1016/j.jallcom.2022.163964. [Google Scholar] [CrossRef]
59. Motallebi R, Savaedi Z, Mirzadeh H. Additive manufacturing—a review of hot deformation behavior and constitutive modeling of flow stress. Curr Opin Solid State Mater Sci. 2022;26(3):100992. doi:10.1016/j.cossms.2022.100992. [Google Scholar] [CrossRef]
60. Aghajani Derazkola H, Garcia E, Murillo-Marrodán A, Conde Fernandez A. Review on modeling and simulation of dynamic recrystallization of martensitic stainless steels during bulk hot deformation. J Mater Res Technol. 2022;18:2993–3025. doi:10.1016/j.jmrt.2022.03.179. [Google Scholar] [CrossRef]
61. Ji X, Tian Q, Tan Y, Huang C, Wan M, Li R. Simulation and experimental study of hot deformation behavior in near β phase region for TC21 alloy with a forged structure. Crystals. 2023;13(10):1524. doi:10.3390/cryst13101524. [Google Scholar] [CrossRef]
62. Lv Y, Zhao S, Liu T, Cheng H, Fan J, Huang Y. Hot deformation behavior and simulation of hot-rolled damage process for fine-grained pure tungsten at elevated temperatures. Materials. 2022;15(22):8246. doi:10.3390/ma15228246. [Google Scholar] [PubMed] [CrossRef]
63. Lin CN, Tzeng YC, Lee SL, Fuh YK, Łukaszek-Sołek A, Lin CY, et al. Optimization of hot deformation processing parameters for as-extruded 7005 alloys through the integration of 3D processing maps and FEM numerical simulation. J Alloys Compd. 2023;948:169804. doi:10.1016/j.jallcom.2023.169804. [Google Scholar] [CrossRef]
64. Wu BY, Wang T, Zhang Y, Tian S, Xiong C, Jiang H. Hot deformation behavior and microstructure evolution of a novel Mn-containing HEA. Intermetallics. 2024;169:108275. doi:10.1016/j.intermet.2024.108275. [Google Scholar] [CrossRef]
65. González-Castillo AC, de Jesús Cruz-Rivera J, Ramos-Azpeitia MO, Garnica-González P, Garay-Reyes CG, Pacheco-Cedeño JS, et al. 3D-FEM simulation of hot rolling process and characterization of the resultant microstructure of a light-weight Mn steel. Crystals. 2021;11(5):569. doi:10.3390/cryst11050569. [Google Scholar] [CrossRef]
66. Kim Y, Jeong HY, Park J, Kim K, Kwon H, Ju G, et al. Optimizing process parameters for hot forging of Ti-6242 alloy: a machine learning and FEM simulation approach. J Mater Res Technol. 2023;27:8228–43. doi:10.1016/j.jmrt.2023.11.193. [Google Scholar] [CrossRef]
67. Huo Q, Zhao N, Zhou W, Chen Z, Wang H. Dynamic recrystallization behavior of 7Cr7Mo2VSiNi tool steel during hot deformation by experiments and numerical simulations. J Mater Eng Perform. 2024;40:124. doi:10.1007/s11665-024-09818-4. [Google Scholar] [CrossRef]
68. Nie D, Chen X, Wu Q. Mixed-mode fracture behaviors of AISI, 1045 and AISI, 5140 steels in compressor crankshafts—part II: Mode II-III. Eng Fail Anal. 2020;110:104407. doi:10.1016/j.engfailanal.2020.104407. [Google Scholar] [CrossRef]
69. Nayak UV, Prabhu KN. Quench cooling performance-hardness correlation for AISI, 1045 and 1090 steels. Mater Perform Charact. 2019;8(1):135–50. doi:10.1520/MPC20180138. [Google Scholar] [CrossRef]
70. Li Y, Liu S, Wang Y, Wei Y, Han L, Zhi H, et al. Effects of process parameters on the microstructure and mechanical properties of AISI, 1045 steel prepared by selective laser melting. Mater Today Commun. 2023;37:107287. doi:10.1016/j.mtcomm.2023.107287. [Google Scholar] [CrossRef]
71. Opěla P, Walek J, Kopeček J. Machine learning techniques in predicting hot deformation behavior of metallic materials. Comput Model Eng Sci. 2025;142(1):713–32. doi:10.32604/cmes.2024.055219. [Google Scholar] [CrossRef]
72. Geels K, Fowler D, Kopp WU, Ruckert M. Metallographic and materialographic specimen preparation, light microscopy, image analysis and hardness testing. West Conshohocken: ASTM International; 2007. [Google Scholar]
73. Němec J, Kunčická L, Opěla P, Dvořák K. Determining hot deformation behavior and rheology laws of selected austenitic stainless steels. Metals. 2023;13(11):1902. doi:10.3390/met13111902. [Google Scholar] [CrossRef]
74. Verlinden B, Driver J, Samajdar I, Doherty RD. Thermo-mechanical processing of metallic materials. 1st ed. Oxford, UK: Elsevier; 2007. [Google Scholar]
75. Kunčická L, Kocich R. High strain rate induced shear banding within additively manufactured AISI 316L. Mater Lett. 2024;363:136342. doi:10.1016/j.matlet.2024.136342. [Google Scholar] [CrossRef]
76. Rybalchenko O, Torganchuk V, Rybalchenko G, Martynenko N, Lukyanova E, Tokar A, et al. Effect of rotary swaging on microstructure and properties of Cr-Ni-Ti austenitic stainless steel. Metals. 2023;13(10):1760. doi:10.3390/met13101760. [Google Scholar] [CrossRef]
77. Kocich R, Kunčická L. Crossing the limits of electric conductivity of copper by inducing nanotwinning via extreme plastic deformation at cryogenic conditions. Mater Charact. 2024;207:113513. doi:10.1016/j.matchar.2023.113513. [Google Scholar] [CrossRef]
78. Humphreys FJ, Hetherly M, Rollett A, Rohrer GS. Recrystallization and related annealing phenomena. 2nd ed. Oxford: Pergamon; 2004. [Google Scholar]
79. Hölscher M, Raabe D, Lücke K. Rolling and recrystallization textures of bcc steels. Steel Res. 1991;62(12):567–75. doi:10.1002/srin.199100451. [Google Scholar] [CrossRef]
Cite This Article
 Copyright © 2025 The Author(s). Published by Tech Science Press.
This work is licensed under a Creative Commons Attribution 4.0 International License , which permits unrestricted use, distribution, and reproduction in any medium, provided the original work is properly cited.
 Downloads
 Citation Tools