
 Submit a Paper
 Propose a Special lssue
 Open Access
ARTICLE

ParMamba: A Parallel Architecture Using CNN and Mamba for Brain Tumor Classification
1 College of Computer and Information Technology, China Three Gorges University, Yichang, 443000, China
2 School of Computer Engineering, Jingchu University of Technology, Jingmen, 448000, China
* Corresponding Author: Hongyang Li. Email:
Computer Modeling in Engineering & Sciences 2025, 142(3), 2527-2545. https://doi.org/10.32604/cmes.2025.059452
Received 08 October 2024; Accepted 31 December 2024; Issue published 03 March 2025
 View Full Text
 Download PDF
Abstract
Brain tumors, one of the most lethal diseases with low survival rates, require early detection and accurate diagnosis to enable effective treatment planning. While deep learning architectures, particularly Convolutional Neural Networks (CNNs), have shown significant performance improvements over traditional methods, they struggle to capture the subtle pathological variations between different brain tumor types. Recent attention-based models have attempted to address this by focusing on global features, but they come with high computational costs. To address these challenges, this paper introduces a novel parallel architecture, ParMamba, which uniquely integrates Convolutional Attention Patch Embedding (CAPE) and the ConvMamba block including CNN, Mamba and the channel enhancement module, marking a significant advancement in the field. The unique design of ConvMamba block enhances the ability of model to capture both local features and long-range dependencies, improving the detection of subtle differences between tumor types. The channel enhancement module refines feature interactions across channels. Additionally, CAPE is employed as a downsampling layer that extracts both local and global features, further improving classification accuracy. Experimental results on two publicly available brain tumor datasets demonstrate that ParMamba achieves classification accuracies of 99.62% and 99.35%, outperforming existing methods. Notably, ParMamba surpasses vision transformers (ViT) by 1.37% in accuracy, with a throughput improvement of over 30%. These results demonstrate that ParMamba delivers superior performance while operating faster than traditional attention-based methods.Keywords
Brain tumor is a mass formed by the uncontrolled proliferation of brain cells, which occurs in males and females of all ages and is one of the most dangerous diseases in the world [1]. Therefore, early identification of brain tumors is particularly crucial to improve the treatment effect and survival rate of patients. Among various imaging techniques, magnetic resonance imaging (MRI) is currently the most popular method for detecting brain tumors [2]. From the perspective of MRI, brain tumors can be further classified into gliomas, meningiomas, and pituitary tumors based on their size, shape, and location [3]. Each type of tumor can be life-threatening. Therefore, it is crucial to classify different types of brain tumors effectively and then conduct targeted treatments for each type. However, due to the small structural differences between different brain tumors, accurately classifying them is challenging. Manual classification by doctors is inevitably prone to misdiagnosis and inefficient, while also increasing the burden on doctors. To overcome these difficulties, machine learning-based techniques have begun to be applied to MRI images for automatic brain tumor classification tasks and have played a crucial role in computer-aided diagnosis (CAD) systems.
So far, the emergence of CNN has revolutionized the field of medical image processing. Traditional machine learning algorithms such as Support Vector Machine (SVM) and Decision Tree often require manual feature design, which relies on domain knowledge and expert experience, and the process is cumbersome. In contrast, CNN can automatically learn feature representations from raw data, reducing the reliance on manual feature engineering. Therefore, CNN have significantly improved the performance of CAD systems. Although CNN have achieved better classification performance compared to traditional machine learning methods, due to the characteristics of local feature extraction, CNNS may ignore some key inherent tumor properties when processing brain tumor classification tasks, such as the contextual information surrounding the tumor region and the size variations of the tumor. The lack of these pieces of information can lead to limitations in the model’s ability to identify tumors. Additionally, the high similarity between brain tumor categories add to additional difficulties for the practical application of CNN. To overcome these challenges, researchers [4–6] have increasingly integrated attention mechanisms into CNN models, By incorporating attention mechanisms, CNNs are able to capture finer-grained details within tumor regions, which are crucial for distinguishing between different types of brain tumors.
The emergence of vision transformer (ViT) [7] has overcome the limitations of CNN, yet it require extensive computational resources during training, limiting the input sequence length and increasing training time. Recently, Mamba [8–10] has not only overcome these difficulties but also possesses the ability to extract global features. The Spatial State Model (SSM) represented by Mamba operates in linear time with respect to sequence length. Benefiting from its linear time complexity, Mamba has a lower computational cost, potentially demonstrating higher computational efficiency in handling complex tasks.
Despite significant advancements in deep learning for medical image classification, existing studies still fall short in capturing subtle distinctions in brain tumors and reducing computational costs. Traditional CNN perform well in local feature extraction but are limited in handling long-range dependencies and global features. Additionally, while ViT overcome the limitations of CNN, they require substantial computational resources. The main objective of this study is to develop an efficient brain tumor classification model that achieves high classification accuracy, with the aim of enhancing the practical applicability of automatic brain tumor detection and diagnosis. To this end, we propose a novel parallel architecture named ParMamba, which utilizes ConvMamba blocks as its backbone and incorporates Convolutional Attention Patch Embedding (CAPE). The ConvMamba block combines the local feature extraction capabilities of CNN with the global feature capturing strengths of the Mamba, resulting in improved computational efficiency and classification accuracy. Furthermore, the channel enhancement module is introduced to enhance cross-channel feature interactions. CAPE captures brain tumor information from multiple perspectives by applying both max pooling and convolutional pooling in two directions, which enriches the feature representation. The main contributions of this paper are summarized as follows:
• This paper propose a parallel architecture called ParMamba, designed for effective multi-class classification of brain tumors in MRI images.
• This paper design a novel module, ConvMamba block, which can extract brain tumor image features from local and global contexts.
• Comprehensive experiments were conducted on two brain tumor datasets, which verified the excellent ability of ParMamba in brain tumor classification.
• Comparing ParMamba with the most advanced brain tumor classification methods demonstrates that ParMamba outperforming existing brain tumor classification methods.
Brain tumors exhibit a variety of types, each with distinct characteristics and manifestations. Furthermore, many brain tumors have indistinct boundaries, making them easily confusable with surrounding normal tissue, which adds to the complexity of classification. In early automated systems, people used machine learning methods to identify tumors of brain tumors from MRI images. El-Dahshan et al. [11] used discrete wavelet transform (DWT) to obtain features related to MRI images and classified them using a k-nearest neighbor-based classifier. Shim et al. [12] combined finite element analysis and machine learning methods for detecting brain injuries. Das et al. [13] adopted Ripplet Transform Type-I (RT) to represent significant features of brain MRI images and used least squares support vector machines to classify brain MRI images. Zhang et al. [14] compared traditional training methods such as Scaled Chaotic Artificial Bee Colony (SCABC), momentum BP, genetic algorithms, and simulated annealing, indicating that the SCABC method is better. Shim et al. [15] developed an efficient computational pipeline to generate finite element models of brain injury for specific individuals, predicting structural damage following trauma. However, traditional machine learning still poses challenges due to its reliance on manual intervention and the requirement for extensive domain knowledge and expertise.
CNN can automatically learn feature representations from raw data, reducing the reliance on manual feature engineering. Therefore, CNN has been widely used in CAD methods for medical images and has revolutionized the field of medical image analysis. Ayadi et al. [16] proposed a deep CNN model, utilizing ten different convolutional layers to extract features from brain tumor images, aiming to enhance the ability to capture brain tumor features. Atha et al. [17] employed CNN as the base architecture and incorporated the idea of semi-supervised learning, combining the training process of labeled and unlabeled brain tumor data, enabling the network to learn from both types of data simultaneously. Rizwan et al. [18] used Gaussian convolution kernels to extract local features of brain tumors, enhancing the accuracy of brain tumor feature extraction. Zhu et al. [19] adopted DenseNets as the base network structure and introduced a biologically inspired evolutionary algorithm to optimize the network structure of DenseNets, adapting it to the characteristics of medical image data. Aamir et al. [20] used two pre-trained CNN networks, EfficientNet and ResNet50, to extract features from brain tumor images separately. Then, they employed partial least squares (PLS) to fuse the feature vectors extracted from the two models, forming a hybrid feature vector. Kumar et al. [21] proposed a multi-class brain tumor classification method based on ResNet-50 and global average pooling, which performs well in addressing gradient disappearance and overfitting issues in deep networks. Gursoy et al. [22] integrated graph neural networks (GNNs) to capture relational dependencies between image regions and CNN to extract spatial features, enhancing the detection of brain tumors.
However, when using CNN models for brain tumor classification, limited data can lead to the over-fitting problem. Therefore, to address the issue of small brain tumor image samples, data augmentation techniques have been applied to enlarge the dataset in some works. Yaqub et al. [23] utilized generative adversarial networks (GANs) for data augmentation. Ghassemi et al. [24] employed GANs for preprocessing brain tumor images, in addition to data augmentation methods such as image rotation and mirroring. Li et al. [25] adopted data augmentation techniques including rotation, horizontal flipping, and vertical flipping, as well as salt-and-pepper noise as a data augmentation method.
In recent years, with the introduction of attention mechanism into the field of computer vision, researchers have also combined attention mechanism with CNN and applied it to medical images. Dutta et al. [26] adopted CNN as the base architecture and introduced a lightweight global attention mechanism after the CNN layers, enhancing the model’s ability to extract more salient features from brain tumor images. Wang et al. [27] utilized a pre-trained vision transformer as the base architecture, and combined with token merging techniques, to extract key information from brain tumor images. Isunuri et al. [28] employed a pre-trained efficientNetB4 to extract brain tumor features and then used multi-path convolution and multi-head attention for feature enhancement.
More recently, Mamba based on state-space models (SSM) has emerged in people’s vision. Mamba not only has the ability of global feature extraction, but also exhibits linear complexity related to the size of the input image. Yue et al. [29] combined the local feature extraction capability of CNN with the ability of SSM to capture long-range dependencies, thereby modeling medical images in different modes. Ma et al. [30] have utilized the integration of CNN’s local pattern recognition capabilities with Mamba’s global context understanding, enabling automatic adaptation to various datasets and applicability in segmentation tasks across diverse biomedical imaging fields. Ruan et al. [31] have proposed a medical image segmentation model based on SSM. By leveraging Visual State Space (VSS) blocks to capture extensive contextual information, they have constructed an asymmetric encoder-decoder architecture, marking it as the first medical image segmentation model purely built upon SSM.
The architecture of the proposed ParMamba adopts four units for brain tumor classification, which is similar to numerous prior studies [29,32,33]. As shown in Fig. 1, Each unit incorporates a patch embedding layer, succeeded by multiple sequentially arranged ConvMamba blocks. Specifically, the patch embedding layer adopts convolutional attention patch embedding layer [32], while each ConvMamba block consists of a ConvBlock, a MambaBlock, and a channel enhancement module.

Figure 1: The overall architecture of the proposed ParMamba
In the first unit, The channel dimension of the input image
3.1 Convolutional Attention Patch Embedding
Convolutional Attention Patch Embedding (CAPE) [32] is a downsampling method, as shonw in Fig. 2. CAPE combines convolutional patch embedding and channel attention module (CAM). CAPE processes the input image or the feature map

Figure 2: Convolutional attention patch embedding
The input
In CAM, Overlap MaxPool captures global spatial information and downsamples the input, followed by a
As depicted in Fig. 3, using a parallel architecture with two separate branches for feature extraction enhances the model’s ability to capture crucial features through feature fusion. This approach allows the model to leverage the complementary strengths of the individual branches, thereby bolstering its overall performance in identifying and extracting salient features [29,32]. Therefore, the proposed ConvMamba block also adopts a parallel structure, consisting of a ConvBlock, a MambaBlock and a channel enhancement module. The ConvBlock, comprised of multiple convolutional layers and activation functions extracts brain tumor characteristics. Prior work [29] has validated the feasibility of the MambaBlock. As a state-space model (SSM) [8], Mamba possesses the characteristic of linear time complexity, ensuring efficient feature extraction and model training when processing brain tumor images. Additionally, Mamba’s ability to comprehend global context is particularly significant for identifying complex structures in brain tumor images, as brain tumors often exhibit diverse shapes, sizes, and locations. Therefore, the proposed ConvMamba block utilizes the MambaBlock to extract global features of brain tumors, allowing for better attention to the lesion locations.

Figure 3: The parallel architecture of ConvMamba block
In the ConvMamba block, the feature maps
where,
This section describes each component of the ConvMamba block in detail.
Traditional convolutions typically employ
Inspired by ConvNeXt [33], the ConvBlock employs an inverted bottleneck layer structure, where the middle is large and the ends are small. The inverted bottleneck layer structure, by expanding and contracting the number of channels, increases the nonlinearity of the network, enabling the model to have better generalization capabilities and effectively avoid information loss. This means that the model can better adapt to new data and improve performance on unseen data. Additionally, the ConvBlock incorporates layer normalization and the GELU activation function after the depthwise separable convolution and the first
First, a review of Structured State Space Sequence Models (S4) [35] is presented. S4 is based on the concept of hidden states, where an internal state variable
where,
Next, this system is discretized by introducing a time scale parameter
The Eq. (8) can then be expressed with discrete parameters as:
Additionally, for an input sequence of length T, a global convolution with kernel
The Selective State Space Model (S6) [8] is an extension of the S4 model. S6 dynamically adjusts certain parameters (such as
The core of MambaBlock is the 2D selective scanning (SS2D), which was proposed by Vmamba [10]. As shown in the Fig. 4, SS2D comprises three components: scan expanding, S6 block, and scan merging. Firstly, scan expanding generates multiple sequences by extending the input image along four directions (upper left to the lower right, lower right to the upper left, upper right to the lower left, and lower left to the upper right). These sequences are then fed into the S6 block to extract and integrate detailed features from each direction. Finally, scan merging sums and merges the sequences from these four directions to restore an output image with the same size as the input image. This process aims to enable the model to distinguish and retain key information while filtering out irrelevant information, thereby enhancing the model’s performance.

Figure 4: Illustration of 2D-Selective-Scan (SS2D). The input patches undergo scan expanding in four different directions, and each sequence is processed independently by distinct S6 blocks. Subsequently, the results are merged through scan merging to construct the final output
It is noteworthy that there are two residual connections in MambaBlock. In the first residual connection, the input is first normalized, then passes through a linear layer, a depthwise separable convolution, and a SiLU activation function to extract features. These features are then fed into the SS2D, followed by further feature extraction through normalization and a linear layer. In the second residual connection, the feature map obtained from the previous residual connection is normalized, and then a linear layer is applied for feature fusion. This yields the output of the MambaBlock branch. Furthermore, the normalization method utilized in MambaBlock is layer normalization.
3.2.3 Channel Enhancement Module
After merging parallel tokens, some previous methods [32] employed Multi-Layer Perceptrons (MLP) to facilitate information exchange between different channels, often resulting in a substantial computational burden. To reduce computational costs while maintaining classification performance, this paper proposes a lightweight channel enhancement module, as shown in Fig. 3. The channel enhancement module consists of a
This section provides a detailed description of the experiments conducted in this paper, including the experimental details, and the datasets used in the experiments. Comparisons are also made with existing brain tumor classification methods. Furthermore, ablation studies were performed to investigate the effectiveness of CAPE, MambaBlock, and the channel enhancement module.
To train and evaluate the proposed ParMamba in this paper, two publicly available brain tumor MRI datasets are utilized.
The first dataset (dataset 1) is available on the Kaggle website1. Dataset 1 contains four different types of MRI images, including glioma, meningioma, pituitary, and no tumor, with 1621, 1645, 1757, and 2000 images respectively, totaling 7023 images. Among them, 5712 images are used for training, and 1311 images are used for testing. Some sample images are shown in Fig. 5a.

Figure 5: Images in dataset 1 and dataset 2
The second dataset (dataset 2) is available on the Figshare website2. Dataset 2 contains 3064 T1-weighted magnetic resonance imaging (MRI) images from 233 patients with different types of brain tumors. The images in dataset 2 are classified into three categories: 708 meningioma, 1462 glioma, and 930 pituitary tumors. In this paper, the dataset is split into training and testing sets with a ratio of 8:2. Some sample images are shown in Fig. 5b.
Before the experiments, the datasets were first preprocessed. All images were resized to 224224 pixels and normalized for each dataset, scaling all pixel values to the range of [0, 1] by dividing by 255. Additionally, due to the limited data in dataset 2, two simple strategies for data augmentation were employed, including mirroring and rotation operations. Through data augmentation, dataset 2 was expanded to three times its original size, totaling 9192 images.
All experiments in this paper were conducted in a Python 3.8 environment with the deep learning framework PyTorch 1.13.0. The CPU model is 96 Intel(R) Xeon(R) Platinum 8255C CPU, and the GPU model is RTX 3090 with 24 GB of video memory. The operating system is Ubuntu 20.04.01.
During the training process, an AdamW optimizer with a learning rate of 1e−3 and momentum of 0.9 was utilized. A cross-entropy loss function with a weight decay of 0.05 was employed to optimize the model parameters. For training the model, the epoch was set to 500, with a batch size of 32. The channel dimensions of the four units [

Based on the characteristics of brain tumor images, this paper uses accuracy, precision, sensitivity, and F1 score as the evaluation metrics for the proposed model. These four metrics can directly reflect the effectiveness of the model. The expressions for calculating these metrics are as follows:
where, TP represents the number of true positive samples, FP is the number of false positive samples in the confusion matrix. TN stands for the number of true negatives, and FN represents the false negative samples in the confusion matrix.
This section introduces the classification performance of the proposed ConvMemba on dataset 1 and dataset 2, and compares its results with the brain tumor classification models. It is noteworthy that the ablation study in this section is conducted on dataset 1.
This section compares Mamba with the attention mechanism by replacing the MambaBlock in ConvMamba block with a vanilla ViT [7]. As shown in Table 2, the accuracy of Mamba increased by 1.37% compared with ViT, while the parameters decreased by 1.7 M, FLOPs decreased by 55%, and throughput rate also increased by more than 30% compared with ViT. Therefore, it is demonstrated that Mamba not only outperforms ViT in terms of speed but also achieves a higher accuracy.

Furthermore, an ablation study was conducted to investigate the overall impact of CAPE, MambaBlock, and the proposed channel enhancement module. As indicated in Table 3, without using CAPE and instead employing a single-branch convolutional patch embedding, the accuracy decreased by 1.22%, with only a 0.1 M reduction in parameters. This suggests that CAPE is crucial for this model. Disabling the channel enhancement module after combining the parallel branches of ParMamba resulted in a 0.62% decrease in accuracy, with only a 0.83 M reduction in parameters. This proves that the channel enhancement module effectively enhances the merged channels. Therefore, this paper adopts the channel enhancement module to improve the model’s accuracy with a minimal increase in parameters. Removing MambaBlock and adopting a single-branch CNN structure led to a 0.31% drop in accuracy, while the number of parameters increased by 3.42 M. This demonstrates that the proposed parallel architecture of ParMamba is feasible, validating the effectiveness of MambaBlock’s global context comprehension ability in handling complex brain tumor MRI images. At the same time, it reduces the number of parameters, making the model more lightweight.

4.4.2 Classification Performance On Dataset 1
The test loss and accuracy curves of the proposed ParMamba on dataset 1 are illustrated in Fig. 6. It can be observed that ParMamba converges within 500 epochs and achieves perfect classification results in the classification test on dataset 1. The confusion matrix is shown in Fig. 7. As seen from the confusion matrix, among the 1311 test images, only 5 images were misclassified, with 2 gliomas being wrongly labeled as meningiomas and pituitary tumors, 1 meningioma being misclassified as a pituitary tumor, and 2 pituitary tumors being mislabeled as gliomas and meningiomas. The classification performance of the four categories are listed in Table 4. For the non-tumor category, it achieved 100% precision, sensitivity, and F1 score, indicating that the proposed ParMamba can accurately determine whether a tumor has developed in the brain. As shown in Table 4, the overall precision, sensitivity, F1 score, and accuracy for the four categories are 99.59%, 99.58%, 99.59%, and 99.62%, respectively. In summary, the proposed ParMamba can effectively learn the characteristics of brain tumor images, resulting in excellent classification performance on dataset 1.

Figure 6: Test loss and test accuracy on dataset 1
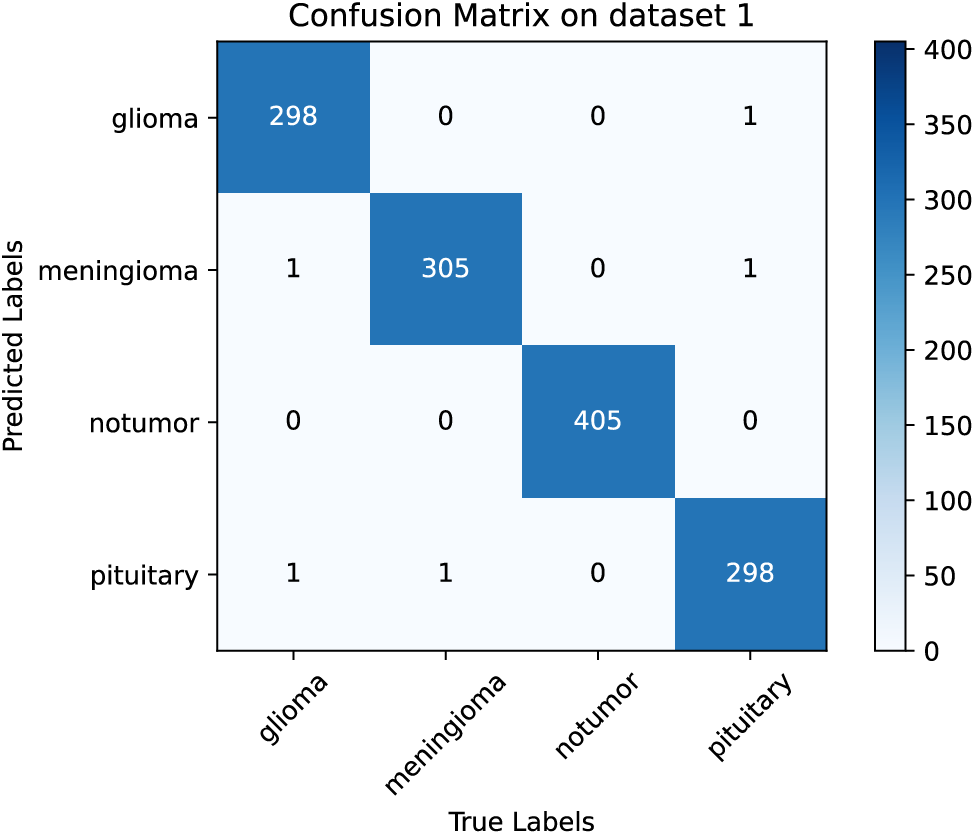
Figure 7: Confusion matrix on dataset 1

4.4.3 Classification Performance on Dataset 2
The test loss and accuracy curves of the proposed ParMamba on dataset 2 are depicted in Fig. 8, and ParMamba converges within 500 epochs. It is evident that ParMamba achieved perfect classification results in the classification test on dataset 2. The confusion matrix is shown in Fig. 9. As seen from the confusion matrix, out of 1837 test images, only 12 images were misclassified. Among the 855 glioma images, 5 were identified as meningiomas, and 2 were identified as pituitary tumors. In the 424 meningioma images, only 1 was misclassified as a glioma, and 3 were identified as pituitary tumors. Among the 558 pituitary tumor images, only 1 was misclassified as a glioma. The classification performance of the three categories are listed in Table 5. Combined with the performance on dataset 1, the proposed ParMamba demonstrates excellent precision, sensitivity, and F1 score in the classification of meningiomas and pituitary tumors. As shown in Table 5, the overall precision, sensitivity, F1 score, and accuracy for the three categories are 99.19%, 99.35%, 99.27%, and 99.35%, respectively. This indicates that the proposed ParMamba can effectively determine the type of tumor present in the brain.
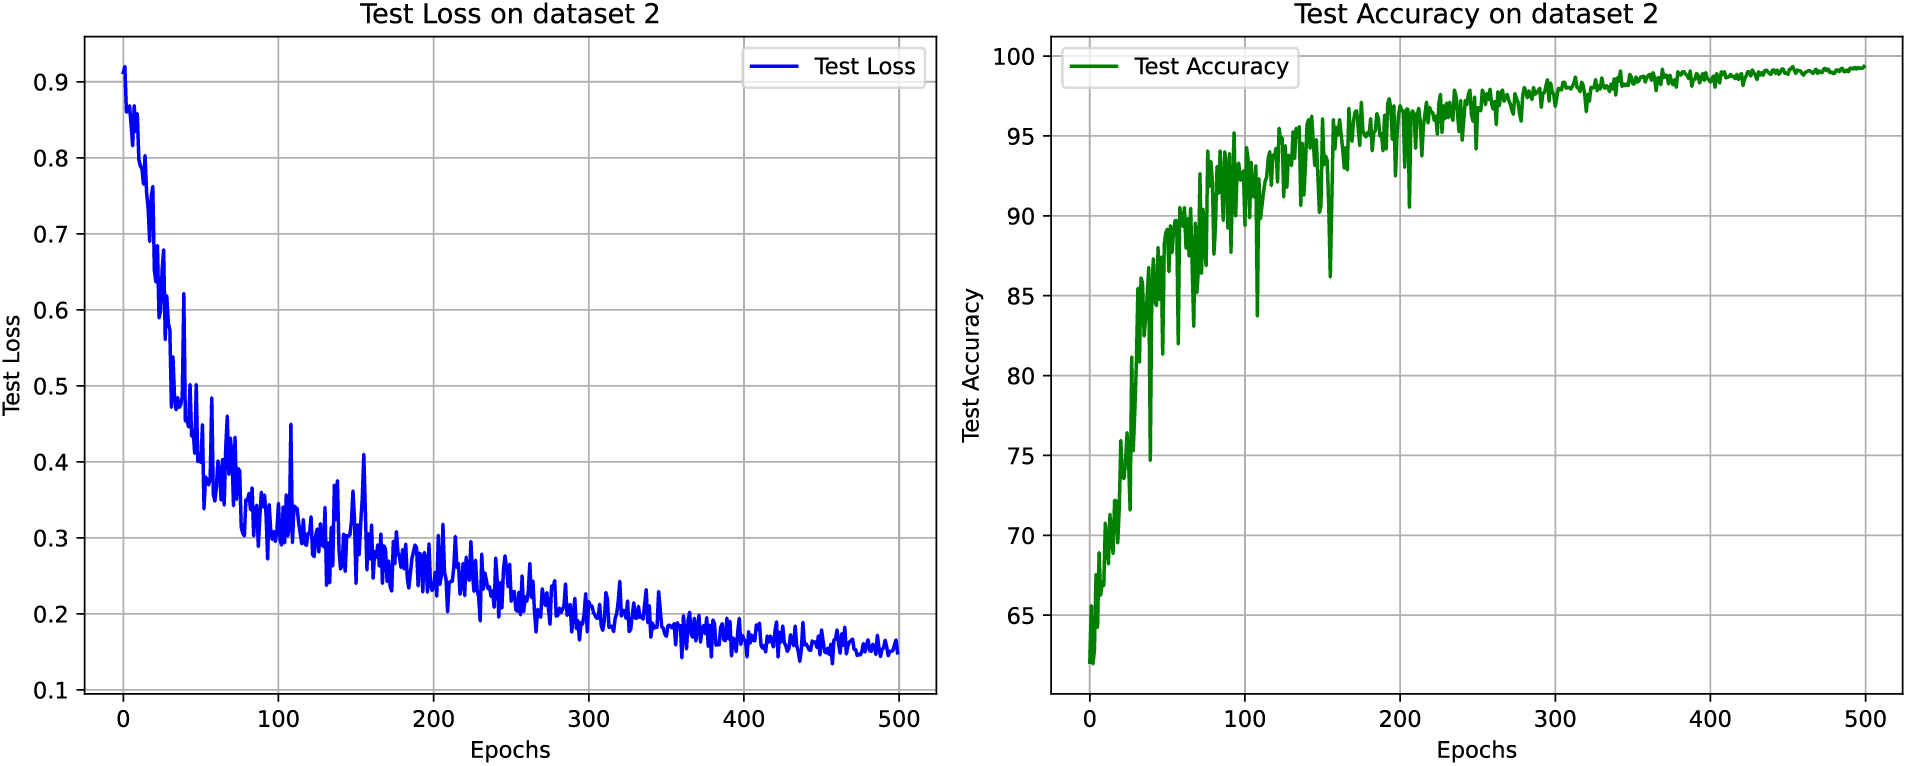
Figure 8: Test loss and test accuracy on dataset 2

Figure 9: Confusion matrix on dataset 2

4.4.4 Comparison with Existing Brain Tumor Classification Methods
To validate the performance of the proposed ParMamba, this section compares it with existing brain tumor classification methods, including those based on CNN and attention mechanisms. These methods were all conducted on either dataset 1 or dataset 2, as specifically shown in Table 6. ParMamba outperforms Dense CNN Architecture [36], SSBTCNet [17], InceptionV3 [37], radimagenet pre-trained CNN [38], and DCST + SVM [39] by 4.62%, 3.12%, 2.49%, 1.91%, and 1.91% in accuracy on dataset 1. Similarly, on dataset 2, it outperforms Deep CNN [16], BTSCNet [40], AP-CNN [41], MEEDNets [19], and RanMerFormer [27] by 4.61%, 2.68%, 1.93%, 0.72%, and 0.49% in accuracy, and also surpasses these brain tumor classification models in other metrics. Hese excellent results are closely related to the collaboration of ParMamba and CAPE which extracts local and global features of brain tumors, followed by the utilization of a channel enhancement module to enhance the merged channels. Additionally, the performance of the compared methods was directly obtained from their respective papers.

To further validate ParMamba, this section conducts significance analyses of ParMamba and other models on dataset 1 and dataset 2. Nemenyi test is first conducted, with the results presented in Tables 7 and 8. On dataset 1, the p-values between ParMamba and both Dense CNN and SSBTCNet are less than 0.05, indicating significant differences. Similarly, on dataset 2, the p-values between ParMamba and both DeepCNN and BTSCNets are also less than 0.05, confirming significant differences. In addition, t-test are performed to explore the significance of the differences between ParMamba and other models further, as shown in Tables 9 and 10. For both dataset 1 and dataset 2, the normality p-values for the differences between ParMamba and other models, except for SSBTCNet, are greater than 0.05, suggesting that these differences follow a normal distribution. The t-test p-values are all less than 0.05, demonstrating that ParMamba exhibits statistically significant differences compared to other models. These results indicate that ParMamba significantly outperforms other models across both datasets.


This paper proposes a novel parallel architecture named ParMamba for brain tumor classification. The ParMamba consists of four components: ConvBlock, MambaBlock, channel enhancement module, and CAPE. Among them, ConvBlock and MambaBlock extract local and global features respectively, channel enhancement module implements cross-channel communication, and CAPE is used for downsampling, effectively extracting fine-grained features of brain tumors from local and global contexts. Extensive experiments are conducted on two publicly available brain tumor datasets. Dataset 1 contains four categories of images: glioma, meningioma, pituitary, and non-tumor, while dataset 2 comprises three categories: glioma, meningioma, and pituitary. The experimental results demonstrate that the proposed ParMamba achieves outstanding classification performance, with accuracies of 99.62% and 99.35% on dataset 1 and dataset 2, respectively. This indicates that the model is capable of achieving excellent classification performance on both datasets. Compared to existing brain tumor classification methods, ParMamba marks a significant advancement in the field. Moreover, the accuracy of Mamba increased by 1.37% compared with ViT, while FLOPs decreased by 55%, and throughput rate also increased by more than 30% compared with ViT. This indicates that the proposed ParMamba is not only faster but also more accurate than attention mechanisms. Furthermore, ablation studies are conducted to validate the effectiveness of CAPE, MambaBlock, and channel enhancement module individually. The results reveal that the combination of CAPE, MambaBlock, and channel enhancement module effectively extracts brain tumor features, leading to excellent classification results.
While the proposed ParMamba model demonstrates strong overall performance, its recognition of meningioma remains relatively limited. Therefore, future efforts could focus on refining the model to better capture meningioma features. Moreover, future research could extend the application scope of ParMamba by testing its generalization performance on large-scale brain tumor datasets. Further potential directions include developing lightweight network designs for efficient deployment on resource-constrained devices.
Acknowledgement: The authors wish to express their appreciation to the reviewers for their helpful suggestions which greatly improved the presentation of this paper.
Funding Statement: This work was supported by the Outstanding Youth Science and Technology Innovation Team Project of Colleges and Universities in Hubei Province (Grant no. T201923), Key Science and Technology Project of Jingmen (Grant nos. 2021ZDYF024, 2022ZDYF019), and Cultivation Project of Jingchu University of Technology (Grant no. PY201904).
Author Contributions: Study conception and design: Gaoshuai Su, Hongyang Li; data collection: Gaoshuai Su; analysis and interpretation of results: Gaoshuai Su, Hongyang Li; draft manuscript preparation: Gaoshuai Su, Huafeng Chen. All authors reviewed the results and approved the final version of the manuscript.
Availability of Data and Materials: The data that support the findings of this study are openly available at https://www.kaggle.com/datasets/masoudnickparvar/brain-tumor-mri-dataset, https://figshare.com/articles/dataset/brain_tumor_dataset/1512427/5 (accessed on 16 November 2024).
Ethics Approval: Not applicable.
Conflicts of Interest: The authors declare no conflicts of interest to report regarding the present study.
1https://www.kaggle.com/datasets/masoudnickparvar/brain-tumor-mri-dataset, accessed on 08 January 2024
2https://figshare.com/articles/dataset/brain_tumor_dataset/1512427/5, accessed on 08 January 2024
References
1. Muhammad K, Khan S, Ser JD, Albuquerque VH. Deep learning for multigrade brain tumor classification in smart healthcare systems: a prospective survey. IEEE Trans Neural Netw Learn Syst. 2020;32(2):507–22. doi:10.1109/TNNLS.2020.2995800. [Google Scholar] [PubMed] [CrossRef]
2. Tiwari A, Srivastava S, Pant M. Brain tumor segmentation and classification from magnetic resonance images: review of selected methods from 2014 to 2019. Pattern Recognit Lett. 2020;131(9):244–60. doi:10.1016/j.patrec.2019.11.020. [Google Scholar] [CrossRef]
3. Rajesh T, Mani Malar RS, Geetha MR. Brain tumor detection using optimization classification based on rough set theory. Cluster Comput. 2019;22(Suppl 6):13853–9. doi:10.1007/s10586-018-2111-5. [Google Scholar] [CrossRef]
4. Saurav S, Sharma A, Saini R, Singh S. An attention-guided convolutional neural network for auto-mated classification of brain tumor from MRI. Neural Comput Appl. 2023;35(3):2541–60. doi:10.1007/s00521-022-07742-z. [Google Scholar] [CrossRef]
5. Shaik NS, Cherukuri TK. Multi-level attention network: application to brain tumor classification. Signal Image Video Process. 2022;16(3):817–24. doi:10.1007/s11760-021-02022-0. [Google Scholar] [CrossRef]
6. Apostolopoulos ID, Aznaouridis S, Tzani M. An attention-based deep convolutional neural network for brain tumor and disorder classification and grading in magnetic resonance imaging. Information. 2023;14(3):174. doi:10.3390/info14030174. [Google Scholar] [CrossRef]
7. Dosovitskiy A, Beyer L, Kolesnikov A, Weissenborn D, Zhai X. An image is worth 16x16 words: transformers for image recognition at scale. In: ICLR 2021 Conference; 2020. p. 1–18. [Google Scholar]
8. Gu A, Dao T. Mamba: Linear-time sequence modeling with selective state spaces. arXiv:2312.00752. 2023. [Google Scholar]
9. Zhu L, Liao B, Zhang Q, Wang X, Liu W, Wang X. Vision mamba: efficient visual representation learning with bidirectional state space model. arXiv:2401.09417. 2024. [Google Scholar]
10. Liu Y, Tian Y, Zhao Y, Yu H, Xie L, Wang Y, et al. Vmamba: visual state space model. arXiv:2401.10166. 2024. [Google Scholar]
11. El-Dahshan EA, Hosny T, Salem ABM. Hybrid intelligent techniques for MRI brain images classification. Digit Signal Process. 2010;20(2):433–41. doi:10.1016/j.dsp.2009.07.002. [Google Scholar] [CrossRef]
12. Shim VB, Holdsworth S, Champagne AA, Coverdale NS, Cook DJ, Lee TR. Rapid prediction of brain injury pattern in mTBI by combining FE analysis with a machine-learning based approach. IEEE Access. 2020;8:179457–65. doi:10.1109/ACCESS.2020.3026350. [Google Scholar] [CrossRef]
13. Das S, Chowdhury M, Kundu MK. Brain MR image classification using multiscale geometric analysis of ripplet. Prog Electromagn Res. 2013;137:1–17. doi:10.2528/PIER13010105. [Google Scholar] [CrossRef]
14. Zhang YD, Wu L, Wang S. Magnetic resonance brain image classification by an improved artificial bee colony algorithm. Prog Electromagn Res. 2011;116:65–79. doi:10.2528/PIER11031709. [Google Scholar] [CrossRef]
15. Shim V, Tayebi M, Kwon E, Guild SJ, Scadeng M, Dubowitz D, et al. Combining advanced magnetic resonance imaging (MRI) with finite element (FE) analysis for characterising subject-specific injury patterns in the brain after traumatic brain injury. Eng Comput. 2022;38(5):3925–37. doi:10.1007/s00366-022-01697-4. [Google Scholar] [CrossRef]
16. Ayadi W, Elhamzi W, Charfi I. Deep CNN for brain tumor classification. Neural Process Lett. 2021;53(1):671–700. doi:10.1007/s11063-020-10398-2. [Google Scholar] [CrossRef]
17. Atha Z, Chaki J. SSBTCNet: semi-supervised brain tumor classification network. IEEE Access. 2023;11:141485–99. doi:10.1109/ACCESS.2023.3343126. [Google Scholar] [CrossRef]
18. Rizwan M, Javed AR, Shabbir A, Baker T, Obe DA. Brain tumor and glioma grade classification using Gaussian convolutional neural network. IEEE Access. 2022;10:29731–40. doi:10.1109/ACCESS.2022.3153108. [Google Scholar] [CrossRef]
19. Zhu H, Wang W, Ulidowski I, Zhou Q, Wang S, Chen H, et al. MEEDNets: medical image classification via ensemble bio-inspired evolutionary DenseNets. Knowl-Based Syst. 2023;280(6):111035. doi:10.1016/j.knosys.2023.111035. [Google Scholar] [CrossRef]
20. Aamir M, Rahman Z, Dayo ZA, Abro WA, Uddin MI, Khan I, et al. A deep learning approach for brain tumor classification using MRI images. Comput Electr Eng. 2022;101(5):108105. doi:10.1016/j.compeleceng.2022.108105. [Google Scholar] [CrossRef]
21. Kumar RL, Kakarla J, Isunuri BV, Singh M. Multi-class brain tumor classification using residual network and global average pooling. Multimed Tools Appl. 2021;80(9):13429–38. doi:10.1007/s11042-020-10335-4. [Google Scholar] [CrossRef]
22. Grsoy E, Kaya Y. Brain-GCN-Net: graph-convolutional neural network for brain tumor identification. Comput Biol Med. 2024;180(1):108971. doi:10.1016/j.compbiomed.2024.108971. [Google Scholar] [PubMed] [CrossRef]
23. Yaqub M, Jinchao F, Ahmed S, Mehmood A, Chuhan IS, Manan MA, et al. DeepLabV3, IBCO-based ALCResNet: a fully automated classification, and grading system for brain tumor. Alexandria Eng J. 2023;76(6):609–27. doi:10.1016/j.aej.2023.06.062. [Google Scholar] [CrossRef]
24. Ghassemi N, Shoeibi A, Rouhani M. Deep neural network with generative adversarial networks pre-training for brain tumor classification based on MR images. Biomed Signal Process Control. 2020;57(2):101678. doi:10.1016/j.bspc.2019.101678. [Google Scholar] [CrossRef]
25. Li L, Li S, Su J. A multi-category brain tumor classification method based on improved ResNet50. Comput Mater Contin. 2021;69(2):2355–66. doi:10.32604/cmc.2021.019409. [Google Scholar] [CrossRef]
26. Dutta TK, Nayak DR, Zhang YD. ARM-Net: attention-guided residual multiscale CNN for multiclass brain tumor classification using MR images. Biomed Signal Process Control. 2024;87(2):105421. doi:10.1016/j.bspc.2023.105421. [Google Scholar] [CrossRef]
27. Wang J, Lu SY, Wang SH, Zhang YD. RanMerFormer: randomized vision transformer with token merging for brain tumor classification. Neurocomputing. 2024;573(20):127216. doi:10.1016/j.neucom.2023.127216. [Google Scholar] [CrossRef]
28. Isunuri BV, Kakarla J. EfficientNet and multi-path convolution with multi-head attention network for brain tumor grade classification. Comput Electr Eng. 2023;108(11):108700. doi:10.1016/j.compeleceng.2023.108700. [Google Scholar] [CrossRef]
29. Yue Y, Li Z. Medmamba: vision mamba for medical image classification. arXiv:2403.03849. 2024. [Google Scholar]
30. Ma J, Li F, Wang B. U-mamba: enhancing long-range dependency for biomedical image segmentation. arXiv:2401.04722. 2024. [Google Scholar]
31. Ruan J, Xiang S. Vm-unet: vision mamba unet for medical image segmentation. arXiv:2402.02491. 2024. [Google Scholar]
32. Setyawan N, Kurniawan GW, Sun CC, Hsieh JW, Su HK, Kuo WK, et al. ParFormer: vision Transformer baseline with parallel local global token mixer and convolution attention patch embedding. arXiv:2403.15004. 2024. [Google Scholar]
33. Liu Z, Mao H, Wu CY, Feichtenhofer C, Darrell T, Xie S, et al. A convnet for the 2020s. Proc IEEE/CVF Conf Comput Vis Pattern Recognit, 2022:11976–86. doi:10.1109/CVPR52688.2022.01167. [Google Scholar] [CrossRef]
34. Howard AG, Zhu M, Chen B, Kalenichenko D, Wang W, Weyand T, et al. Mobilenets: efficient convolutional neural networks for mobile vision applications. arXiv:1704.04861. 2017. [Google Scholar]
35. Gu A, Goel K, R. C. Efficiently modeling long sequences with structured state spaces. arXiv:2111.00396. 2021. [Google Scholar]
36. Özkaraca O, Bağrıaçık O, Gürüler H, Khan F, Hussain J, Khan J, et al. Multiple brain tumor classification with dense CNN architecture using brain MRI images. Life. 2023;13(2):349. doi:10.3390/life13020349. [Google Scholar] [PubMed] [CrossRef]
37. Gómez-Guzmán MA, Jiménez-Beristaín L, García-Guerrero EE, López-Bonilla OR, Tamayo-Perez UJ, Esqueda-Elizondo JJ, et al. Classifying brain tumors on magnetic resonance imaging by using convolutional neural networks. Electronics. 2023;12(4):955. doi:10.3390/electronics12040955. [Google Scholar] [CrossRef]
38. Remzan N, Tahiry K, Farchi A. Advancing brain tumor classification accuracy through deep learning: harnessing radimagenet pre-trained convolutional neural networks, ensemble learning, and machine learning classifiers on MRI brain images. Multimed Tools Appl. 2024;1–29. doi:10.1007/s11042-024-18780-1. [Google Scholar] [CrossRef]
39. Raouf MH, Fallah A, Rashidi S. Use of discrete cosine-based stockwell transform in the binary classification of magnetic resonance images of brain tumor. In: 2022 29th National and 7th International Iranian Conference on Biomedical Engineering (ICBME); 2022 Dec; Tehran, Iran: IEEE; p. 293–8, 2022 [Google Scholar]
40. Chaki J, Woniak M. A deep learning based four-fold approach to classify brain MRI: bTSCNet. Biomed Signal Process Control. 2023;85(2):104902. doi:10.1016/j.bspc.2023.104902. [Google Scholar] [CrossRef]
41. Kakarla J, Isunuri BV, Doppalapudi KS, Bylapudi KSR. Three-class classification of brain magnetic resonance images using average-pooling convolutional neural network. Int J Imaging Syst Technol. 2021;31(3):1731–40. doi:10.1002/ima.22554. [Google Scholar] [CrossRef]
Cite This Article
 Copyright © 2025 The Author(s). Published by Tech Science Press.
This work is licensed under a Creative Commons Attribution 4.0 International License , which permits unrestricted use, distribution, and reproduction in any medium, provided the original work is properly cited.
 Downloads
 Citation Tools