 Open Access
ARTICLE
Medical Diagnosis Based on Multi-Attribute Group Decision-Making Using Extension Fuzzy Sets, Aggregation Operators and Basic Uncertainty Information Granule
Department of Biomedical Engineering, Egaleo Park Campus, University of West Attica, Athens, 12243, Greece
* Corresponding Author: Anastasios Dounis. Email:
(This article belongs to the Special Issue: Advanced Computational Intelligence Techniques, Uncertain Knowledge Processing and Multi-Attribute Group Decision-Making Methods Applied in Modeling of Medical Diagnosis and Prognosis)
Computer Modeling in Engineering & Sciences 2025, 142(1), 759-811. https://doi.org/10.32604/cmes.2024.057888
Received 30 August 2024; Accepted 24 October 2024; Issue published 17 December 2024
Abstract
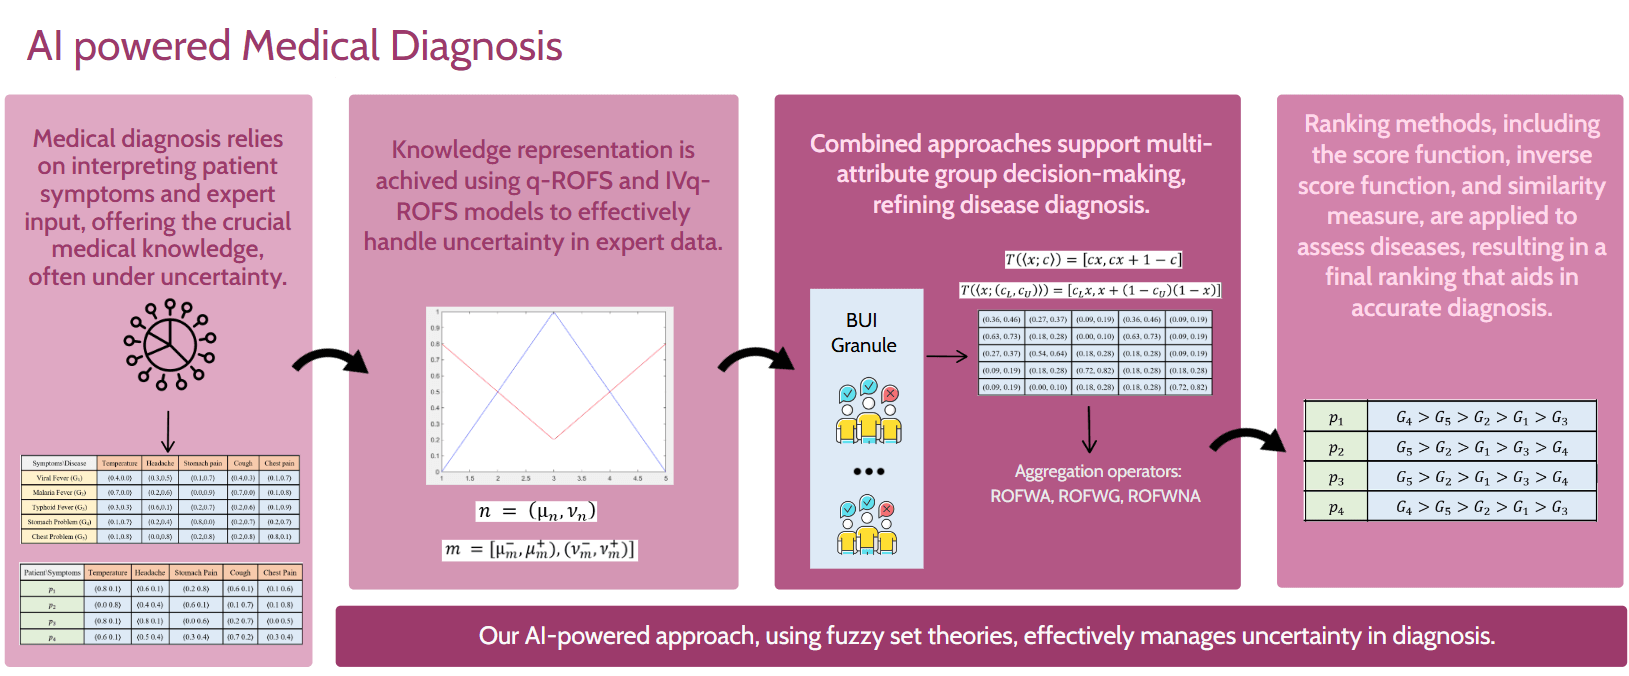
Accurate medical diagnosis, which involves identifying diseases based on patient symptoms, is often hindered by uncertainties in data interpretation and retrieval. Advanced fuzzy set theories have emerged as effective tools to address these challenges. In this paper, new mathematical approaches for handling uncertainty in medical diagnosis are introduced using q-rung orthopair fuzzy sets (q-ROFS) and interval-valued q-rung orthopair fuzzy sets (IVq-ROFS). Three aggregation operators are proposed in our methodologies: the q-ROF weighted averaging (q-ROFWA), the q-ROF weighted geometric (q-ROFWG), and the q-ROF weighted neutrality averaging (q-ROFWNA), which enhance decision-making under uncertainty. These operators are paired with ranking methods such as the similarity measure, score function, and inverse score function to improve the accuracy of disease identification. Additionally, the impact of varying q-rung values is explored through a sensitivity analysis, extending the analysis beyond the typical maximum value of 3. The Basic Uncertain Information (BUI) method is employed to simulate expert opinions, and aggregation operators are used to combine these opinions in a group decision-making context. Our results provide a comprehensive comparison of methodologies, highlighting their strengths and limitations in diagnosing diseases based on uncertain patient data.Graphic Abstract
Keywords
Medical diagnosis, the process of identifying diseases from patient symptoms, grapples with inherent uncertainties in medical data retrieval and interpretation. The intricate interplay between symptoms and diseases introduces further uncertainty, complicating the diagnostic process. In addressing these challenges, Zadeh’s fuzzy sets [1] have emerged as a versatile tool in medical applications, offering a framework to navigate imprecision, both in our understanding of the nature of the underlying problems and from incomplete data [2]. Fuzzy logic, with its broad applicability in the decision-making process, holds promise for achieving expert-like diagnostic outcomes, particularly in early disease detection [3]. However, Zadeh’s fuzzy set theory, primarily reliant on membership degrees, encounters limitations in capturing the full spectrum of the uncertainty [4].
This limitation prompted the development of advanced fuzzy sets which encompass a broader range of the uncertainty spectrum. Atanassov [5] presented another fuzzy set type for fuzzy sets generalization and a more consistent study of ambiguities in the information. These sets are called intuitionistic fuzzy sets (IFSs) [6,7]. However, it can be said that IFSs are limited to a very narrow information system. Hence, the IFSs have been Pythagorean fuzzy sets (PFSs) [4,7]. In paper [8], Pythagorean fuzzy sets have been used to help doctors identify the most likely type of cancer in children at an early stage by considering the symptoms of different kinds of cancer and in paper [9], they have been applied in a numerical case study related to determining the optimal agricultural field. Recently in papers [10,11], Intuitionistic Fuzzy Sets, Pythagorean Fuzzy Sets, and Fermatean Fuzzy Sets [12] have been applied to digital mammogram images to enhance image quality and improve the accuracy of mass segmentation, aiding in better detection and diagnosis of breast cancer. In paper [13], T-spherical fuzzy sets (T-SFSs), a novel extension of fuzzy sets that can fully convey ambiguous and complicated information, have been used in a multiple attribute group decision-making (MAGDM) problem about the selection of a supplier for emergency medical supplies during disasters. These fuzzy set extensions handle the inherent uncertainty and imprecision in mammographic images more effectively than traditional methods, leading to clearer visualization and more precise identification of potential abnormalities. These methods can be generalized even further with newer types of fuzzy sets. These extensions, including q-rung orthopair fuzzy sets (q-ROFS) [14,15] and the interval-valued q-rung orthopair fuzzy sets (IVq-ROFS), provide more nuanced tools for grappling with imprecision and vagueness in medical data. To enhance the representation of uncertainty Yager pioneered the concept of q-ROFS which incorporates the degree of non-membership alongside the membership degree [14]. In addition, they also utilize the concept of hesitation degree (π), that is, the degree of uncertainty or hesitation [16]. The most appealing feature of q-ROFSs is that they provide a wider range of reasonable membership grades and offer decision-makers (DMs) more leeway in expressing their legitimate perceptions. The q-rung orthopair fuzzy numbers (q-ROFNs) play a vital role in computational intelligence, machine learning, neural network, and artificial intelligence. While this marks progress, it remains an incomplete solution. Addressing these limitations, Joshi et al. [17] introduced interval-valued q-rung orthopair fuzzy sets (IVq-ROFSs) in 2018. IVq-ROFSs delineate the membership degree µ and the non-membership degree ν within the subset of [0, 1], providing decision-makers with a more adaptable means of expressing their opinions. Despite some exploration of operational principles, significant advancements are still needed to meet practical demands [18].
It is important to clarify that the type of uncertainty addressed in our work is primarily fuzziness uncertainty, which arises from imprecise or vague information. This is consistent with the application of fuzzy set theory, commonly used in medical data representation studies, where fuzzy classifiers are employed to manage uncertainty in patient data. For example, the first referenced study [19] introduces a new classification method that processes multiple types of medical data simultaneously using a fuzzy decision tree, improving diagnostic accuracy by effectively addressing data uncertainty and outperforming traditional crisp classifiers. This second study [20] focuses on determining the most influential attributes in classification outcomes through a sensitivity analysis based on structural importance. By leveraging fuzzy classifiers, this method accounts for uncertainty in the input data, resulting in more reliable classification results. Both studies underscore the critical role of fuzzy logic in managing uncertainty in medical decision-making processes.
Our knowledge base could be transformed to broaden the spectrum of uncertainty contained in the data by converting a q-ROFS into an IVq-ROFS. This process is called Basic Uncertain Information [21]. BUI is a newly introduced uncertain concept that can quantify the uncertainty/certainty involved in a piece of given data information by using a real number in the unit interval [0, 1] [21,22]. The basic uncertain information can measure the quality of the datum by using the degree of certainty. BUI [21,23] provides an effective and simple way to describe assessments or observations with a certainty degree, thereby measuring the quality of the data. This certainty degree provides insight into the level of confidence a decision-maker holds regarding a particular value, indicating the precision or accuracy with which the value is measured or collected. For example, a large certainty degree may indicate that decision maker has large confidence over the obtained value a. In different decisional scenarios, the certainty degree can hold varying interpretations, reflecting the extent of confidence or precision attributed to the data.
1.1 Multi-Attribute Group Decision-Making
The challenge of medical diagnosis can be framed as a multiple attribute group decision-making problem, wherein the goal is to identify the most suitable solution from a range of alternatives, guided by evaluation data supplied by multiple experts across various assessment attributes [24]. In this context, the alternatives correspond to potential diseases, while the attributes encapsulate the symptoms associated with or indicative of these diseases. By integrating collective expertise and input from multiple experts, decision-makers can navigate the complex web of symptoms and diseases more effectively, leveraging diverse perspectives to arrive at a comprehensive and accurate diagnosis. This approach not only enhances the diagnostic process by considering a multitude of factors but also promotes collaborative decision-making, harnessing the collective wisdom and insights of multiple stakeholders to optimize patient care and outcomes. Artificial intelligence has emerged as a promising approach to solving complex multi-criteria group decision-making problems and deep learning stands as one of the most advanced AI frameworks. While machine learning can achieve outstanding performance, its lack of transparency in how conclusions are reached may render it unsuitable for many applications, particularly in the medical domain. This paper [25] explores different AI models and frameworks within the medical field, examining their strengths and limitations. Fuzzy logic theory has been previously used for the problem of medical diagnosis in a plethora of articles [26–30] and particularly in addressing challenges related to Multi-Criteria Group Decision-Making [8,31,32]. The MCGDM process when incorporating uncertainty and fuzzy logic theory, can be explained in two steps [24].
The initial phase of the medical decision-making process involves the articulation and handling of decision-related information. Fuzzy sets have emerged as a valuable tool in addressing numerous medical applications, offering versatile solutions to complex problems. In the realm of medical diagnosis, one prominent application involves determining the disease most likely affecting a patient based on fuzzy relations. This entails representing the relationships between symptoms and diseases, as well as between patients and symptoms, within a fuzzy medical knowledge base. These relationships are often depicted as fuzzy sets, and in the context of this article, as advanced fuzzy sets, specifically q-ROFS or IVq-ROFS. Such representations enable a nuanced understanding of the interconnectedness between symptoms and diseases, facilitating more accurate and insightful medical decision-making processes. By leveraging fuzzy sets, decision-makers can navigate the inherent uncertainty and ambiguity in medical data, thereby enhancing diagnostic accuracy and patient care.
In the group decision-making process, gathering the opinions of all decision-makers is essential, followed by employing an appropriate method to aggregate these opinions [18]. Aggregation operators serve as indispensable tools in this regard, allowing the combination of multiple fuzzy sets into a single fuzzy set [3,33]. Specifically, in the context of medical diagnosis, these operators are utilized to aggregate the q-ROFSs associated with each criterion or symptom for every disease or patient outlined in the medical knowledge and patient symptom matrices. Scholars have extensively explored various aggregation operators, including fuzzy aggregation operators. IF aggregation operators, PF aggregation operators, and q-ROF aggregation operators [18]. With the continuous advancement of IVq-ROFSs, the aggregation of IVq-ROF information gains increasing significance.
Recent studies by Wang et al. [34] have delved into four forms of IVq-ROF aggregation operators, investigating their applications in multiple-attribute group decision-making scenarios. Similarly, Ju et al. [35] have explored IVq-ROF weighted averaging aggregation operators [35]. Another type of aggregation operator is the Heronian mean and its generalized form, which considers the interdependent phenomena among the aggregated arguments [36–38]. However, while averaging aggregation operators exert a notable influence on overall data, they may lack the ability to effectively characterize individual data points [18]. On the other hand, geometric aggregation operators are more discernible in their impact on specific data points. Nonetheless, due to their operational constraints, geometric aggregation operators may introduce significant distortion to the evaluation information. Thus, selecting an appropriate aggregation operator necessitates a careful consideration of the specific context and objectives of the decision-making process to ensure accurate and meaningful results.
A critical precursor to the aggregation process in medical diagnosis is the determination of symptom weights, which holds paramount importance in ensuring an accurate and comprehensive diagnostic assessment. Employing the entropy method provides a structured and objective approach to assigning these weights, thereby guaranteeing a fair and balanced consideration of each symptom’s relevance [39]. Through the entropy method, decision-makers analyze the variability and uncertainty inherent in each symptom, enabling the identification of key factors pivotal to the diagnostic process. This systematic approach not only aids in prioritizing symptoms based on their informational contributions but also enhances the transparency and objectivity of the decision-making process [39]. Ultimately, by leveraging the entropy method to calculate weights, professionals can optimize diagnostic accuracy, leading to more precise and effective patient care and outcomes.
In the second stage of the decision-making process, the challenge lies in effectively ranking decision schemes amidst the inherent fuzziness of human cognition and the complexity of the decision-making environment [24]. Given the difficulty in completely and accurately describing decision-making information, the form of information expression directly influences the precision of evaluation. Moreover, the weight of experts cannot be disregarded during the processing of evaluation information, encompassing both the significance of the experts themselves and the rationalization of their evaluation results.
Fuzzy logic augments its diagnostic capabilities by employing similarity measures to aid in disease detection [40]. These measures, integral across various disciplines, quantify the similarity or distance between objects, facilitating comparisons based on their attributes. Developed using fuzzy sets and extended fuzzy sets like q-ROFS, similarity measures typically utilize distances and are expressed as numerical values [41]. As the similarity between data samples increases, the numerical value of the measure rises, ranging between zero and one, where zero signifies low similarity and one denotes high similarity. For example, [16], Chen [42] proposed a similarity function F to measure the degree of similarity between fuzzy sets. Wang [43] proposed new fuzzy similarity measures on fuzzy sets and elements. Later from the continuation of research of fuzzy sets Atanasov [44] presented intuitionistic fuzzy sets. That step promoted the development of similarity measures that utilize advanced fuzzy sets. Wei et al. [45,46] proposed similarity measures based on a cosine function using advanced fuzzy sets for making a medical decision. Muthukumar et al. [47] used weighted similarity measures in medical diagnosis, while Iancu [48] used similarity measures based on the Frank t-norms family.
Scores and accuracy offer an additional avenue for deriving results, incorporating degrees of membership and non-membership. Scores are particularly useful for comparing two q-ROFS, with the highest score indicating a patient’s affliction with a particular disease. In cases of equal scores, accuracy serves as the deciding factor. This article introduces a novel approach to this method termed the inverse score [49], where the lowest score designates the patient’s disease. Again, in instances of tied scores, accuracy determines the ultimate outcome, providing a comprehensive framework for decision-making in medical diagnosis.
In this work, three aggregation operators are proposed: q-ROFWA, q-ROFWG, and the q-ROFWNA paired with three ranking methods: the similarity measure, the score function, and the inverse score function. These methodologies were applied with various q-rung values, performing a sensitivity analysis to understand how the methodologies behave as q changes. While recent literature typically employs a maximum q value of 3, our analysis is extended to larger q-rung values, allowing for a broader spectrum of uncertain possibilities and providing a clearer picture of each methodology’s behavior. Additionally, a multiple criteria group decision-making analysis is conducted using the BUI granule technique. This approach generated new medical data tables with different uncertainty values, effectively simulating the diverse opinions of various experts.
Previous articles have studied the aggregation operators that are applied in our methodologies, but all of them focused on group decision-making using pre-existing decision matrices. In contrast, the BUI methodology is used to create these matrices. Another novel aspect of our approach was the use of the inverse score function, which helped overcome the unique limitations associated with the standard score function.
The organization of this paper is as follows:
In Section 2, the foundational knowledge necessary to understand the methods applied later is analyzed. The operation of q-Rung Orthopair Fuzzy Sets is explained, along with how they differ from Interval-Valued q-Rung Orthopair Fuzzy Sets. The application of the BUI rule is discussed, depending on the data form used. Additionally, the three ranking methods employed in the sensitivity analysis are examined. The specific data utilized in this paper are then described, followed by an introduction to the multiple criteria decision-making process. This section also includes an analysis of the three criteria aggregation operators and the entropy method used to calculate the criteria weights required for the MAGDM process.
In Section 3, the results produced by each methodology discussed earlier are presented. Firstly, ranking tables for the similarity measure and score function are provided using all the aggregation operators, and bar diagrams are included to graphically illustrate ranking differences. Secondly, the BUI method is applied to the medical data tables, creating various tables with different certainty values. The decision-makers are evaluated, and the optimal q-rung value is determined using the similarity measure and score function ranking methods. Lastly, a sensitivity analysis is conducted with different q-rung values across all aggregation operators and decision-making methods, ranking the diseases for each patient. To better explain the results of the sensitivity analysis, they are presented using a spider plot.
2.1 q-Rung Orthopair Fuzzy Sets
Let X be a universe of discourse. A q-ROFS A in X is given by [14,50]:
where
q-ROFS Mathematical Operations
Considering that
•
•
•
•
•
•
2.2 Interval-Valued q-Rung Orthopair Fuzzy Sets
IVq-ROFSs offer a more flexible way of articulating opinions compared to q-ROFSs [17]. This occurs because, in IVq-ROFSs the membership degree µ and non-membership degree ν are differentiated through subsets within the [0, 1] range, rather than relying solely on crisp numbers within that interval.
Let’s consider a universe of discourse, denoted by
where
To simplify the lower and upper bounds of
with the condition that
IVq-ROFS Mathematical Operations
Considering that
•
•
•
•
•
2.3 Modeling of Uncertainty with Basic Uncertain Information
BUI in the form
Definition: A BUI granule is a pair
where B: BUI and I: Integral
which might be more suitable in different decisional scenarios where the length of an interval often can be recognized as the amount of the involved uncertainty. It can be easily observed that the length of
2.3.1 Transformation q-ROFN to IVq-ROFN
Let q-ROFN:
To calculate the lower bound, we apply the relation:
Let R a q-ROFS on P:
After the BUI the
A granule of unsymmetrical basic uncertain information (UBUI) is expressed by the form
The set of all UBUI granules is denoted by UB.
With any obtained UBUI granule we use the following formula to transform it into an interval which sometime can be much easier to handle in decision making.
where
where
The score and accuracy are a way to compare and rank two fuzzy numbers, while both concepts include the degrees of membership and non-membership. They can be used on q-ROFNs and IVq-ROFNs alike.
2.4.1 Score and Accuracy between q-ROFNs
The score function is a widely used ranking method in decision-making processes. By assigning a numerical score to each alternative q-ROFN, the score function enables a straightforward comparison, making it easier to identify the most suitable option. However, when two or more alternatives yield the same score, the accuracy function is employed as a supplementary criterion to further differentiate between them, ensuring a more precise and reliable ranking outcome. This dual approach helps to resolve ties and enhances the decision-making process [16].
The equation’s score and accuracy are defined as:
For any two q-ROFNs
(1)
(2)
(3)
a.
b.
c.
2.4.2 Score and Accuracy between IVq-ROFNs
If the decision matrix consists of IVq-ROFNs instead of q-ROFNs, the ranking process still relies on the score function, but with necessary adjustments to accommodate the interval nature of the data. Despite the increased complexity, the core principle remains the same: alternatives are ranked based on their score, and when scores are identical, the accuracy function is applied to break ties [18].
Considering that
Then the same ranking method as before can be applied to compare two IVq-ROFNs.
2.4.3 Inverse Score Function Ranking
Many authors have proposed various improved score formulas and ranking criteria for q-ROFNs. While these advancements address specific flaws in the original methods, they often introduce new drawbacks or complexities [53].
A new ranking method utilizes the inverse score function, offering an alternative approach to decision-making. In this method, a lower inverse score indicates a more favorable option, making it preferable. When two or more alternatives have the same inverse score, tie-breaking is achieved using the degree of indeterminacy. In this context, less indeterminacy is considered better [53].
The equation of the inverse score is:
In cases where the two inverse score values are equal, the ranking algorithm employs the degree of indeterminacy instead of accuracy:
For any two q-ROFNs
(1)
(2)
(3)
a.
b.
c.
Another approach to decision-making involves similarity measures, a tool for comparing q-ROFSs that may exhibit varying degrees of overlap or similarity [54–56].
where n is the total number of items for each fuzzy set, and q is the q-rung.
For n = 1 and two q-ROFNs A, B where
The similarity measure of two IVq-ROFNs,
where:
2.6 q-ROFN Fuzzy Decision Matrix
The decision matrix outlines how a decision-maker’s evaluations of various alternatives are influenced by the occurrence of different, mutually exclusive states of the world, with known probabilities. Thus, these evaluations are treated as discrete random variables. Alternatives are typically assessed based on the expected values and variances of these evaluations, with the decision-maker aiming to either maximize the expected evaluation or both maximize the expected evaluation and minimize the variance [57].
In practical applications, the states of the world and the evaluations of alternatives may be imprecisely defined. It can be challenging to precisely express these evaluations due to a lack of sufficient information [57].
A decision matrix with the fuzzy states of the world and the fuzzy evaluations of the alternatives under the particular fuzzy states of the world is called a fuzzy decision matrix [58].
The following notations are used to present the q-rung orthopair decision matrix
Let
A group decision-makers
A q-ROFN is symbolized by
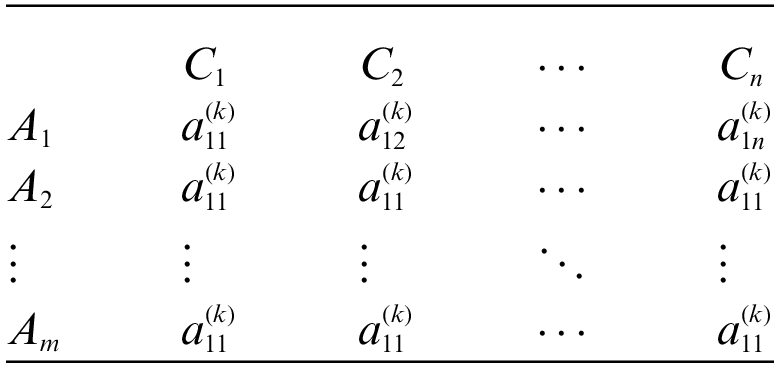
Therefore, a q-ROFN fuzzy decision matrix can be taken as follows:
In the diagnostic process, assigning weights to each symptom is crucial as it reflects their respective importance in determining the underlying condition. These weights signify the relative significance of symptoms. Thus, the weighting scheme facilitates a more nuanced and informed diagnostic approach.
Distance is one of the most important tools used to measure the deviation between variables or sets, and the weighted distance measure is the most widely used approach in various fields. Thus far, many extensions of weighted distance measures have been presented [49]. These measures can be used in the MCGDM process and the fact they utilize the concept of attribute weights allows them to account for the relative importance of different criteria. This enables more nuanced and accurate decision-making by appropriately emphasizing critical factors and reducing the impact of less significant ones.
Also, for the application of the aggregation operators, as will be analyzed later, it is essential to compute the weights vector ω. These weights will be determined using the entropy method [59], which involves the steps analyzed below.
In general, evaluation criteria can be categorized into two types: benefit criteria and cost criteria. Benefit criterion means that a bigger value is more valuable whereas cost criteria are just the opposite [39]. According to [60], “The Entropy method is a generic form of Monte Carlo simulation which is applied in complicated estimation and optimization problems for minimizing the error”.
In this article, two entropy methods are analyzed through which the weighting of criteria can be achieved. Below, the steps of each of these methods are explained outlining their respective processes.
• Weighting Entropy Method 1 [39]
(1) Calculation of the score values of each element of the decision matrix
1.1. If the decision matrix consists of IVq-ROFSs the below score function could be used:
1.2. If the decision matrix consists of q-ROFSs below score function could be used:
(2) The standardization process for each criterion is expressed as follows:
(3) For every standardized criterion, the entropy values are computed as follows:
(4) The divergence of each criterion is defined as follows:
A larger value of
(5) Calculate the weight of each criterion as follows:
where
• Weighting Entropy Method 2 [49]
The degree of indeterminacy is defined as follows:
Calculate the weight of each criterion as follows:
For both methods for the calculated weight, it should be true that
2.8 Decision-Making with Aggregation Operators
Generally speaking, a group decision-making process collects all decision-makers’ opinions, introducing a suitable method to aggregate them. Aggregation operators are utilized to combine a set of fuzzy sets into a single fuzzy set. Specifically, these operators are employed to aggregate the q-ROFSs corresponding to each criterion/symptom for every disease or patient in the medical knowledge and patient symptom matrices.
To develop aggregation operators for IVq-ROFNs, we must first understand the underlying concepts of aggregation and dual aggregation operators, as outlined in previous research by Beliakov et al. [61] and Grabisch et al. [62]. These foundational principles are crucial in ensuring that the aggregation operators maintain their essential properties, such as boundary conditions and monotonicity.
Definition 1: Mapping Agg
1.
Monotonicity: If
Definition 2: Let Agg be called an aggregation operator for the unit interval, i.e.,
Agg (a1,..., am) = Neg(Agg (Neg(a1),..., Neg(am)))
where Neg is a negation (complement) operator.
Definition 3: Let
We define
As we know, the Agg operator is closed, i.e., it maps the collection of IVq-ROFSs into an IVq-ROFS. This can be achieved by proving the following theorem using monotonicity.
Theorem 1. If E = Aggre (A1,..., Am) with grade
Aggregation operators serve as efficient and versatile tools. Because of that various aggregation operators have been explored by researchers.
• IVq-ROFWG and q-ROFWG
The q-rung (or Interval Valued q-Rung) Orthopair Fuzzy Weighted Geometric (q-ROFWG/IVq-ROFWG) aggregation operator is a mathematical tool used to combine multiple q-ROFNs into a single representative value. The q-ROFWG operator works by taking a set of q-ROFNs, each associated with a weight that reflects its importance, and then aggregating them using a geometric mean-based formula.
It could be calculated with the equation below [18]:
where
(1) If
(2) If
• q-ROFWA
The q-ROFWA Aggregation Operator is a mathematical operator used for aggregating multiple q-ROFNs while considering their associated weights [63,64].
Suppose
It could be calculated with the following equation:
(1) If
(2) If
• q-ROFWNA
The q-ROFWNA aggregation operator is a specialized tool designed to handle the aggregation of q-ROFNs. This operator is an extension of traditional fuzzy aggregation methods, incorporating normalization to improve the accuracy and effectiveness of decision-making under conditions of uncertainty [63,64].
Suppose
It could be calculated with the following equation:
2.9 Group Decision Making (GDM)
2.9.1 Medical Data Matrix Transformation
By employing the processes outlined below, the medical knowledge matrices could be transformed, as discussed in Section 2.3, and generate various new ones.
a. Medial knowledge representation with IVq-ROFS (Matrix
b. Medial knowledge representation with q-ROFS (Matrix
c. Medial knowledge representation with q-ROFS (Matrix
2.9.2 Rating the Importance of Decision Makers
Each DM has credibility w for his opinions. This reliability is expressed in the linguistic terms of Table 1 as discussed in Section 2.10. Each linguistic term corresponds to a q-ROFN which will be used in the next subsection for the calculation of the weight of each decision matrix.

In a real-world group decision-making problem, DMs have different levels of knowledge, skills, and experience, and therefore each expert’s understanding of an attribute may not be the same. Each DM has different expertise in the field and accordingly, they get support in the group. DMs views are in general imprecise or fuzzy and ambiguous in nature. In many studies, this difference in knowledge and experience (relative weight) has not been taken into account, and every DM has been assigned the same weight. Obviously, it is irrelevant and leads to imprecise and faulty solutions.
Consider the significant degrees of DMs in the context of q-ROFNs. The formula for calculating the weight of kth DM is outlined as follows from Ali et al. [65]:
The below alternative formula can also be used if the score function is replaced by the inverse score function [53]:
Fuse the individual assessment information of DMs into collective assessment information to form the overall decision matrix. To facilitate this, q-ROFWA operator is applied over assessment information and let
2.9.5 Optimal q-Rung Assessment
Continuing the process, the question that should be answered is what the rung q of the IVq-ROFN of decision matrix elements can be used to appropriately represent this information. Here we can proceed as follows:
a. For each q-ROFN determine its q-niche,
b. Determine the rung q such that
For every IVq-ROFN the condition that should be applied is
2.10 Medical Data and Knowledge
Since the medical expert is unable to articulate his opinion regarding the significance of each criterion (symptom) for every disease, Table 1 [66] is utilized. This table connects linguistic values with a q-ROFN and allows us to convert linguistic terms into membership and non-membership values. This is a much better way to evaluate our certainty in the information a decision matrix provides [58]. For example, instead of trying to choose a membership degree for our confidence in a table of knowledge, it could simply be characterized as Important which corresponds to
• Medical Data and uncertainty
Uncertainty affects decision-making and appears in many different forms. As pointed out by Zadeh, uncertainty is an attribute of information [67]. The concept of information is fully connected with the concept of uncertainty. The uncertainty is generated by incomplete information when the initial data is incomplete, fuzziness or vagueness and ambiguous, fragmentary, not fully reliable, vague, contradictory, or deficient in some other way [20,68]. The physicians can assess data with words or more generally with linguistic expressions. Because words mean different things to different people, their linguistic uncertainties both to a single individual (intra-uncertainty: the variation among the individual opinions in a group of participants) and across a group of individuals (inter-uncertainty: the variation (or vagueness) in the opinions of individual participants—usually over time) must be captured by an appropriate kind of fuzzy sets [69,70]. Fuzzy sets and extensions have been used to capture the inherent uncertainty in data. For example, q-ROFS can model both interpersonal and intrapersonal uncertainties.
In this study, the uncertainties are characterized as implicit or epistemic (aka systematic) which includes two types of uncertainty. These two uncertainty types are: indeterminacy, which is a type of linguistic uncertainty of information [71], that is, intra-uncertainty and inter-uncertainty; fuzziness (or vagueness) of information, which results from imprecise boundaries of the fuzzy sets. The extension fuzzy sets, for example, q-ROFS, can model both interpersonal and intrapersonal uncertainties.
• Medical knowledge
There are five diseases D = {viral fever, malaria fever, typhoid fever, stomach problems, and chest problems} and five symptoms in the universe of discourse S = {temperature, headache, stomach pain, cough, and chest pain} [16].
Using a fuzzy mathematical approach, we can represent medical knowledge in a variety of ways. Because of that, Tables 1 and 2 are used in this article.

In each cell of Table 2, every number signifies the degree of membership of the symptom for the disease. This is how Table R is constructed. Medical knowledge R associates symptoms with diseases and this knowledge is depicted in the following Table 2.
The data for Tables 3 and 4 are gathered from [27,48,72–74].


In each cell of Table 3, the first number signifies the degree of membership, while the second number indicates the degree of non-membership of the symptom of the disease. This is how Table R is constructed. Medical knowledge R associates symptoms with diseases and this knowledge is depicted in Table 3.
• Patient’s symptoms
Four patients, denoted as
3 Medical Diagnosis Model and Results
Fig. 1 illustrates a structured approach to medical diagnosis using q-Rung Orthopair Fuzzy Numbers based on expert medical knowledge. The process begins with the identification of possible symptoms, followed by the determination of corresponding diseases. Expert knowledge is then used to establish relationships between symptoms and diseases, resulting in a decision matrix. This matrix, populated with q-ROFNs, serves as the foundation for the medical diagnosis problem, integrating fuzzy logic to manage uncertainties inherent in clinical decision-making.
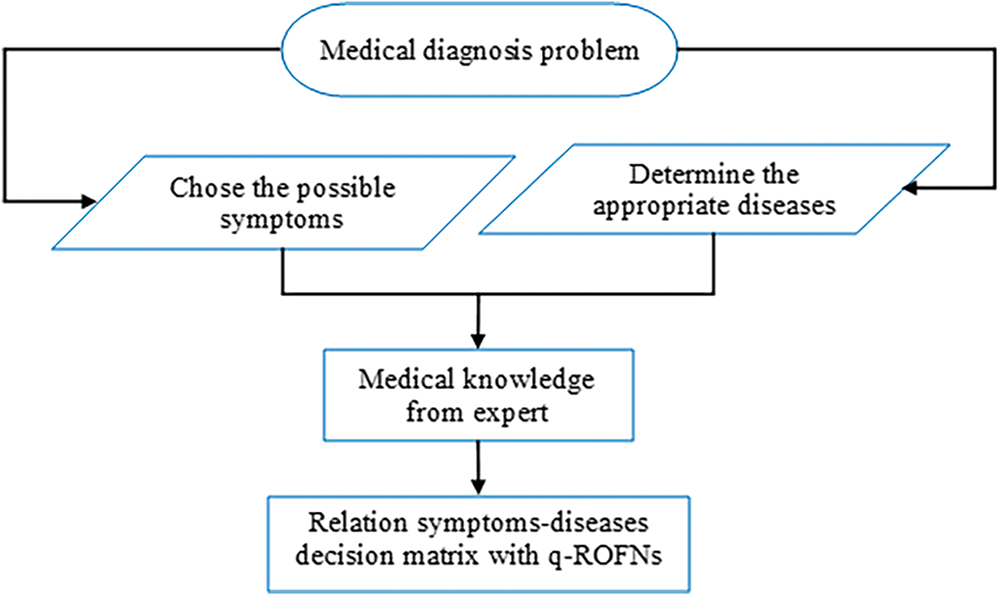
Figure 1: Predefined construct medical knowledge q-ROFNs in relation to symptoms-diagnoses based on expert knowledge
Fig. 2 illustrates the structured approach used in this study to diagnose diseases based on medical knowledge and patient data. The process begins with the DM determining whether to apply the BUI method, which generates new tables with different levels of certainty. If the BUI method is used, it creates new Decision Matrices (DM1, DM2, DM3) and calculates their linguistic values, followed by determining the weights using the BUI tables. Aggregation operators like q-ROFWA, q-ROFWG, and q-ROFWNA are then applied to combine the opinions of multiple experts. The lowest possible q-rung value is determined, and the maximum q-rung is selected for further analysis. This leads to the aggregation of criteria both in the medical knowledge matrix and the patient data table. Finally, the ranking method (similarity measure, score function, or inverse score function) is applied to identify the most likely disease for each patient. The flowchart highlights the step-by-step process that integrates various methodologies to achieve an accurate diagnosis. The results obtained from this process are presented in the sections that follow.
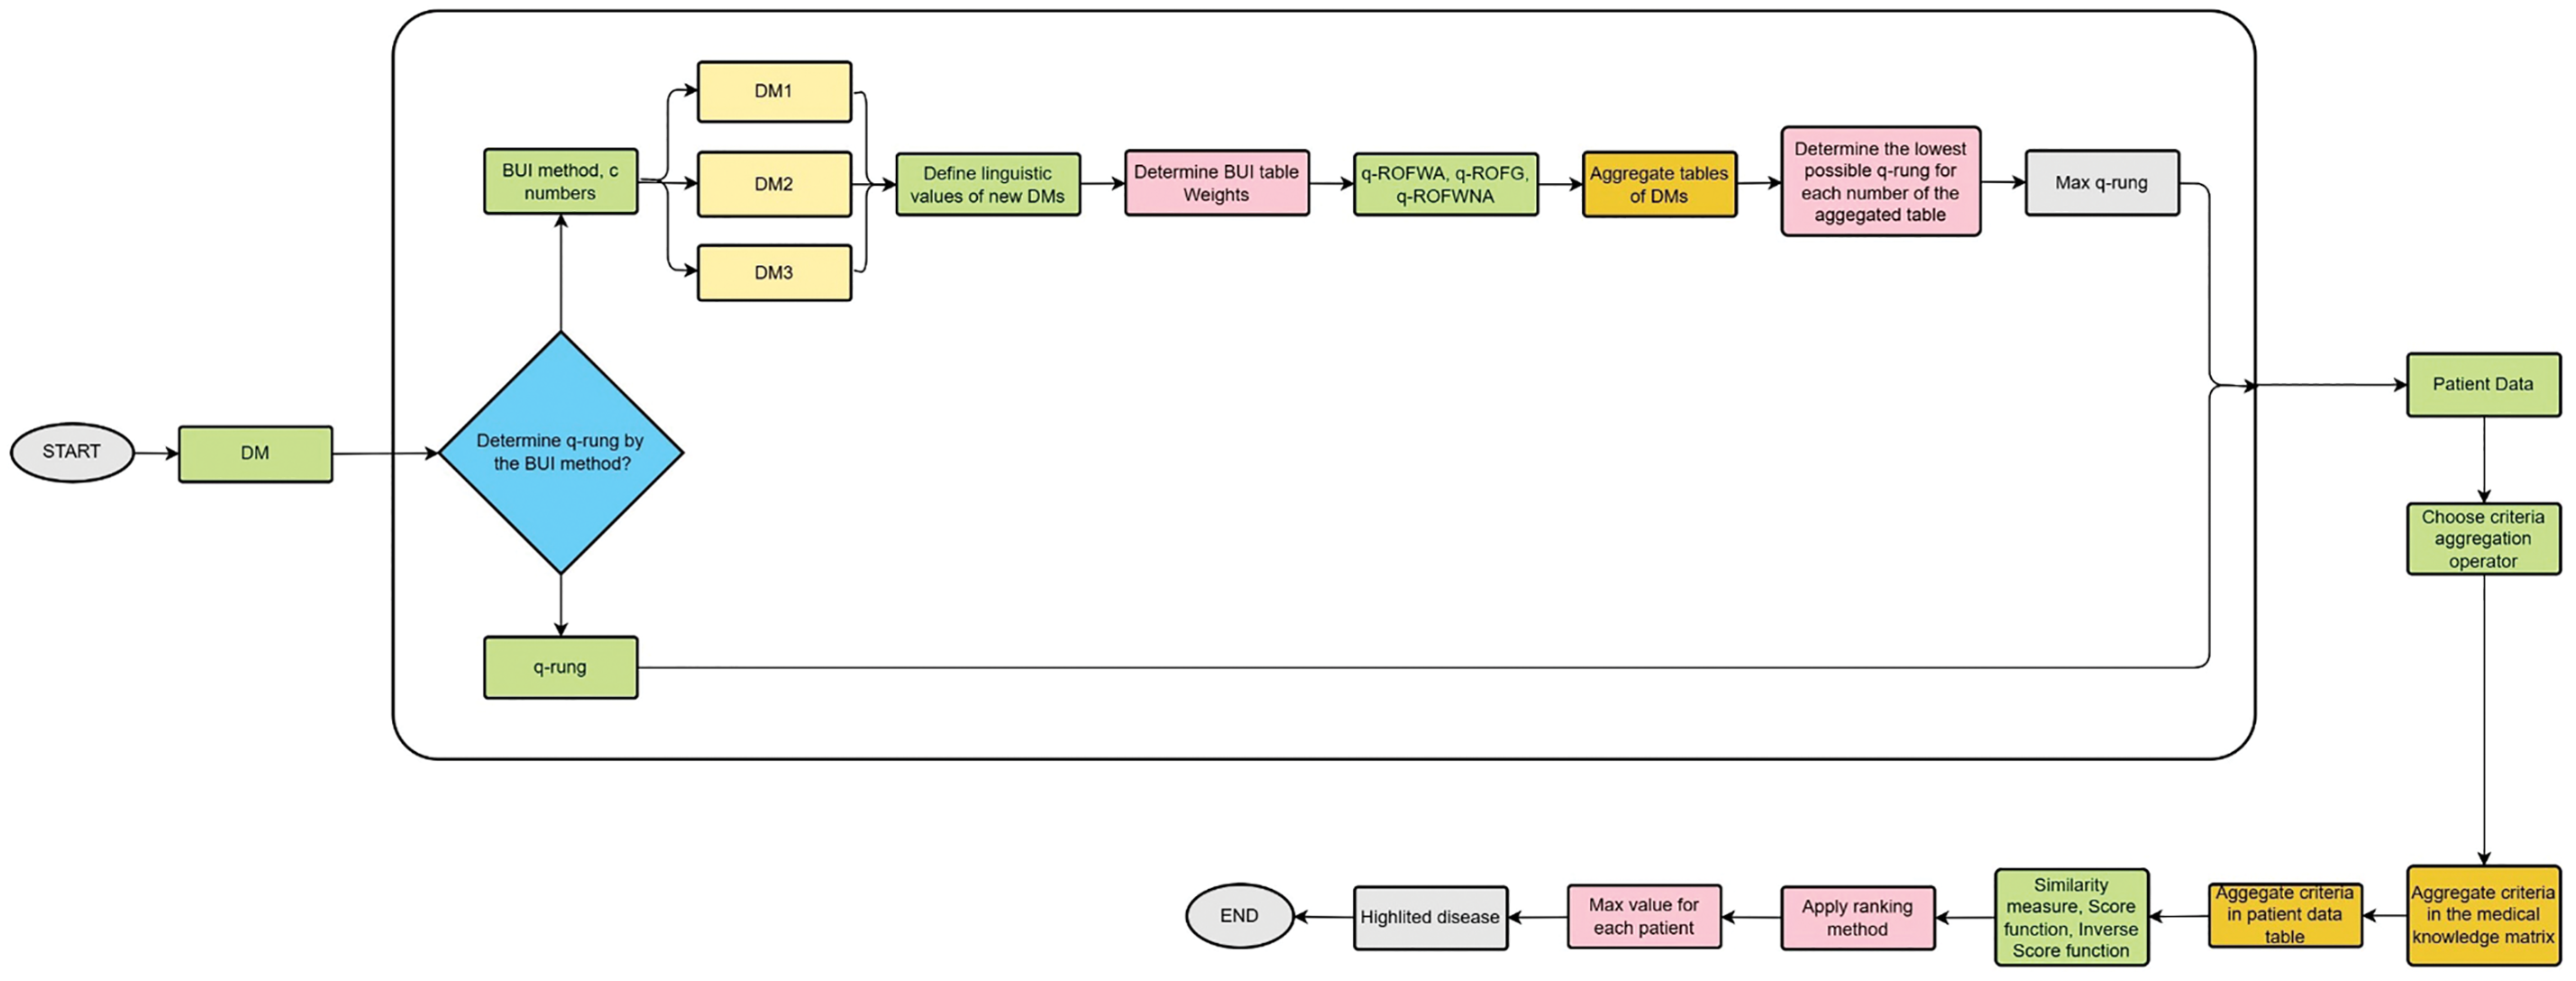
Figure 2: The flowchart of the decision-making process followed in this paper
In this subsection, two tables are presented, displaying the weights calculated by the entropy method for each of the two methods analyzed in the previous section. Tables 5 and 6 present the criteria weights determined using Methods 1 and 2, respectively. Table 5 specifically shows the weights calculated using the first method, which has been applied to both q-ROFS (q-Rough Ordinal Fuzzy Sets) and IV-qROFS (Interval-Valued q-Rough Ordinal Fuzzy Sets). In contrast, Table 6 focuses on the weights derived through the second methodology, providing a comparison between the two approaches for evaluating criteria significance.
It is evident that the relative importance of each symptom derived from the two methods is consistent. Chest pain has the highest weight, signifying its relatively higher importance in the decision-making process. This is followed by stomach pain, cough, temperature, and headache. Since not every symptom holds the same value in the diagnostic process, the weight table must be carefully considered. These weights highlight the varying significance of symptoms, ensuring a more accurate and reliable diagnostic outcome.
Method 1

Method 2

Table 7 below represents the ranking result values of the similarity measure ranking method, utilizing the q-ROFWG aggregation operator applied to the symptoms. For the q-ROFWG, the weights used were those calculated by the first entropy method with a q-rung value of 3.

In Table 7, we can see that for Patients 2 and 3 because for multiple diseases the same similarity measure value is calculated a clear ranking is not possible to be made.
The bar plot of Fig. 3 provides a visual representation of the similarity measure values for different diseases across the patients. Each group of bars corresponds to a patient, and the height of each bar indicates the similarity measure value for a specific disease. This graphical approach helps to quickly identify trends and patterns in the diagnosis results, making it easier to observe the relative rankings and compare the performance of different diseases for each patient. The plot complements the table by offering an intuitive overview of the data.
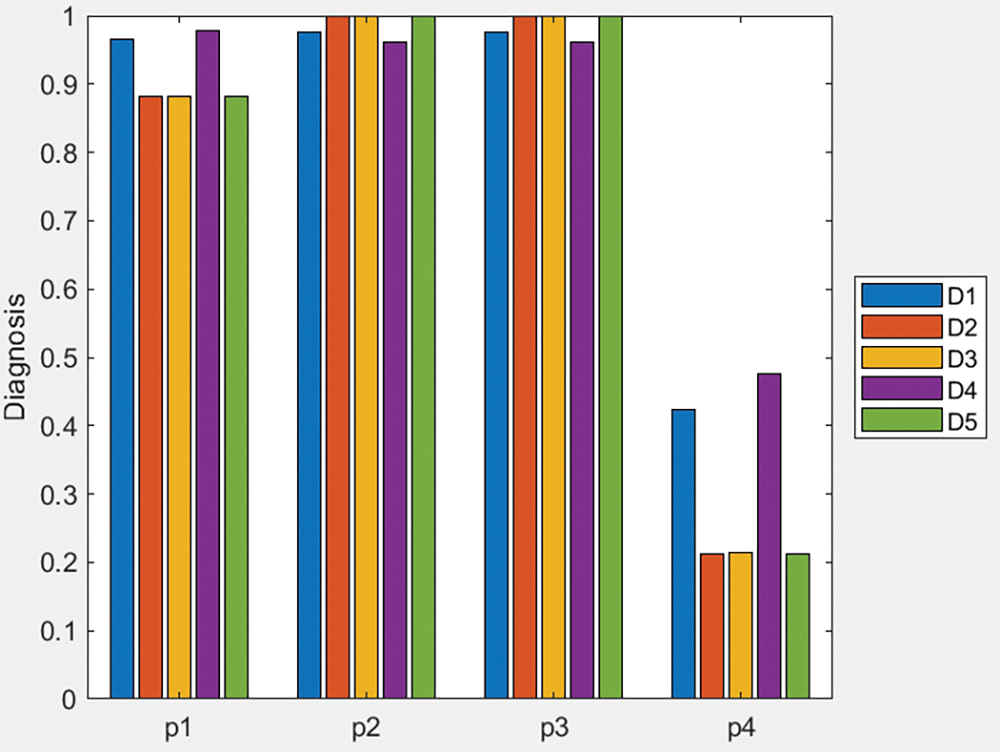
Figure 3: Bar plot of similarity measure values of Table 3 data and q-ROFWG operator
Similarly, by pairing the application of the similarity measure with each of the other two proposed aggregation operators (q-ROFWA and q-ROFWNA), their respective ranking results are presented in Tables A1 and A2 in the Appendix A. Additionally, in Appendix A, Figs. A1 and A2 offer a visual representation of the similarity measure values for different diseases across various patients, providing a clearer understanding of how these methodologies compare in practice.
In Table A1, we can see that for all of the patients because for multiple diseases the same similarity measure value is calculated a clear ranking is not possible to be made even though chest problem symptom is deemed the most probable disease. In Table A2, we can see that for all of the patients because for each disease a distinct similarity measure value is calculated a clear ranking can be performed.
Table 8 represents the ranking result values of the score function ranking method, utilizing the q-ROFWG aggregation operator applied to the symptoms. For the q-ROFWG, the weights used were those calculated by the first entropy method with a q-rung value of 3.

In Table 8, we can see that for all of the patients, because for multiple diseases the same similarity measure value is calculated and a clear ranking is not possible to be made.
The bar plot of Fig. 4 provides a visual representation of the score values for different diseases across the patients. Each group of bars corresponds to a patient, and the height of each bar indicates the score value for a specific disease. This graphical approach helps to quickly identify trends and patterns in the diagnosis results, making it easier to observe the relative rankings and compare the performance of different diseases for each patient. The plot complements the table by offering an intuitive overview of the data.
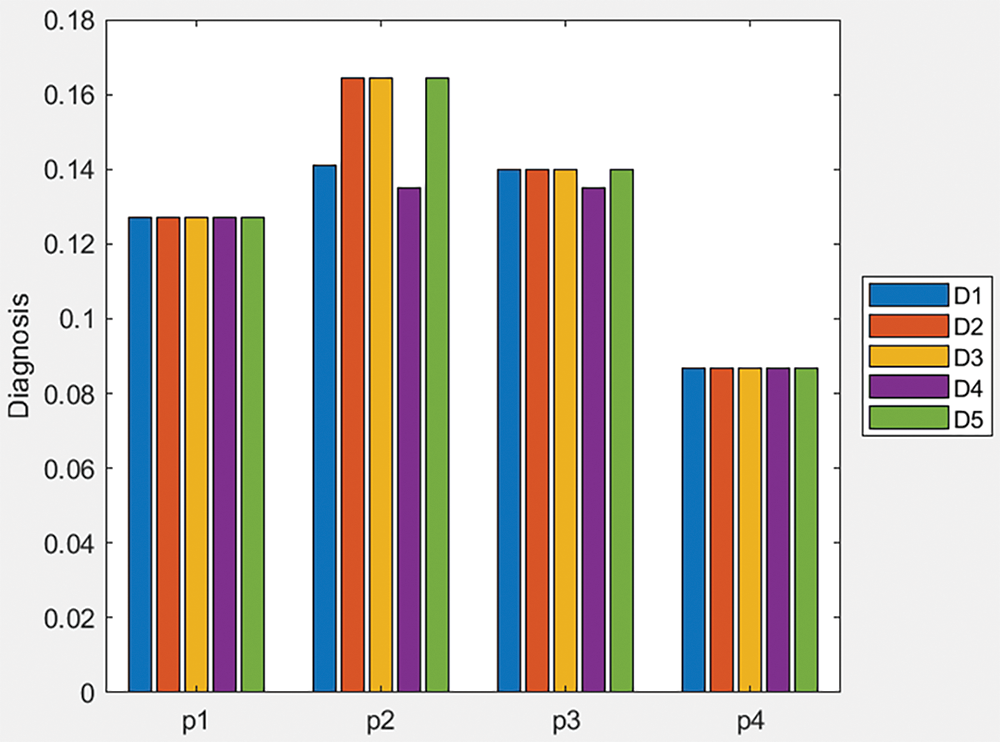
Figure 4: Bar plot of score values of Table 3 data and q-ROFWG operator
Like before, by pairing the application of the score function with each of the other two proposed aggregation operators (q-ROFWA and q-ROFWNA), their respective ranking results are presented in Tables A3 and A4 in the Appendix A. Additionally, in Appendix A, Figs. A3 and A4 offer a visual representation of the similarity measure values for different diseases across various patients, providing a clearer understanding of how these methodologies compare in practice.
In Table A3, we can see that for all of the patients, because for multiple diseases the same similarity measure value is calculated, and a clear ranking is not possible to be made.
In Table A4, we can see that for all of the patients because for multiple diseases the same similarity measure value is calculated a clear ranking is not possible to be made.
Medical Data Matrix Transformation
In this section, the medical data matrix is manipulated using the BUI methodology. Depending on the way the information is represented, the three different BUI techniques, analyzed in Section 2.3, are applied. This process results in the creation of Tables M3, M4, and M5, which are illustrated and utilized in the subsequent three subsections.
(a) Generation of Table M3 from the application of process a as shown in Section 2.9.1.
By employing process a of Section 2.9.1 on Table 3 for
Table 9 represents the results obtained from the process described above for a confidence level of c = 0.9. Given that parameter c can range between 0 and 1, a value of 0.9 indicates that we have a relatively high level of certainty regarding the quality of the information contained in the table. This high certainty suggests that the data is reliable and that the conclusions drawn from it are likely to be accurate, reducing the potential impact of uncertainty on the decision-making process.

Table 10 presents the results derived from the aforementioned process with a confidence level of c = 0.7. Since c can range from 0 to 1, a value of 0.7 indicates a moderate level of certainty about the quality of the information in the table. This lower certainty suggests that there is more room for variability or potential inaccuracies in the data, which may influence the decision-making process. As a result, the conclusions drawn should be considered with caution, acknowledging the increased uncertainty associated with the information.

Table 11 displays the results obtained from the process with a confidence level of c = 0.5. This midpoint suggests a significant degree of uncertainty, which may lead to a less reliable decision-making process. Therefore, the findings should be approached with careful consideration, as the lower certainty introduces a higher possibility of variability in the data.

In reality, the knowledge base available for decision-making is often not fully reliable, reflecting the inherent uncertainties present in complex real-world scenarios. By also using a lower c value, the uncertainty, typical of real-world GDM problems, is more accurately simulated.
I. Rating the importance of decision makers
Because directly evaluating the above tables with a q-ROFN is challenging due to the complexity and uncertainty involved, the Linguistic Term Table is employed. This method allows us to categorize each matrix using a linguistic term that corresponds to a q-ROFN. By doing so, the evaluation process is simplified, enabling us to effectively integrate the matrix into our fuzzy approach for MΑGDM.
Because of the

Following Table 1, the above tables and matrixes are valued as Very Important (VI), Important (I) and Medium (M), respectively [66].
Optimal value: q = 2
II. Decision matrix weight
The weights of the new BUI tables can be calculated using the score and inverse score functions as analyzed in Section 2.9.3. Each function produces different results and requires a unique application method to calculate the Overall Decision Matrix, which combines the opinions of all experts.
• Weight calculation based on the score function.
Table 13 presents the weight calculations for the three decision makers (DMs) based on the score function. In this table, the certainty degree of each DM corresponds directly to its calculated weight, reflecting the level of confidence or reliability assigned to each decision maker’s input in the overall decision-making process.

The process continues with the combination of the previous BUI Tables into a single Table (Table 14) that combines the opinions of all experts using the above weights.

• Overall decision matrix
• Optimal q-rung assessment
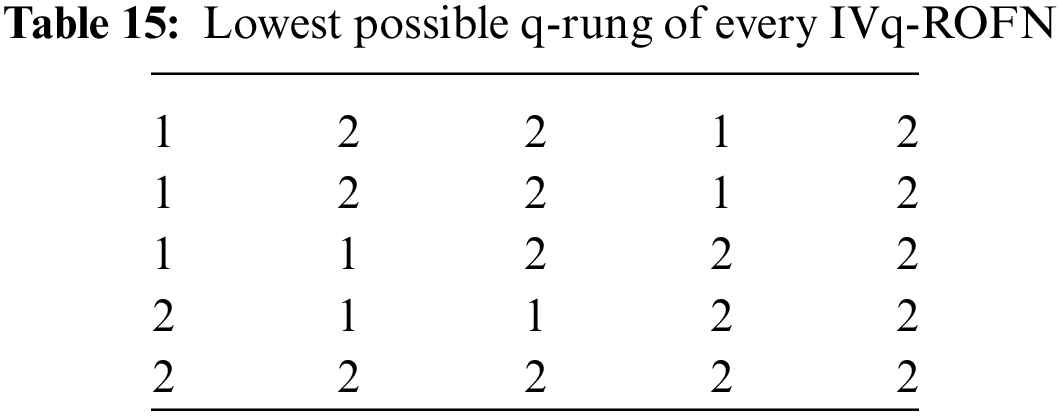
Because of the
• Weight calculation based on the inverse score
Table 16 presents the weight calculations for the three decision makers (DMs) based on the inverse score function. In this table, the certainty degree of each DM corresponds directly to its calculated weight, reflecting the level of confidence or reliability assigned to each decision maker’s input in the overall decision-making process.

• Overall decision matrix
The process continues with the combination of the previous BUI Tables into a single Table (Table 17) that combines the opinions of all experts using the above weights.
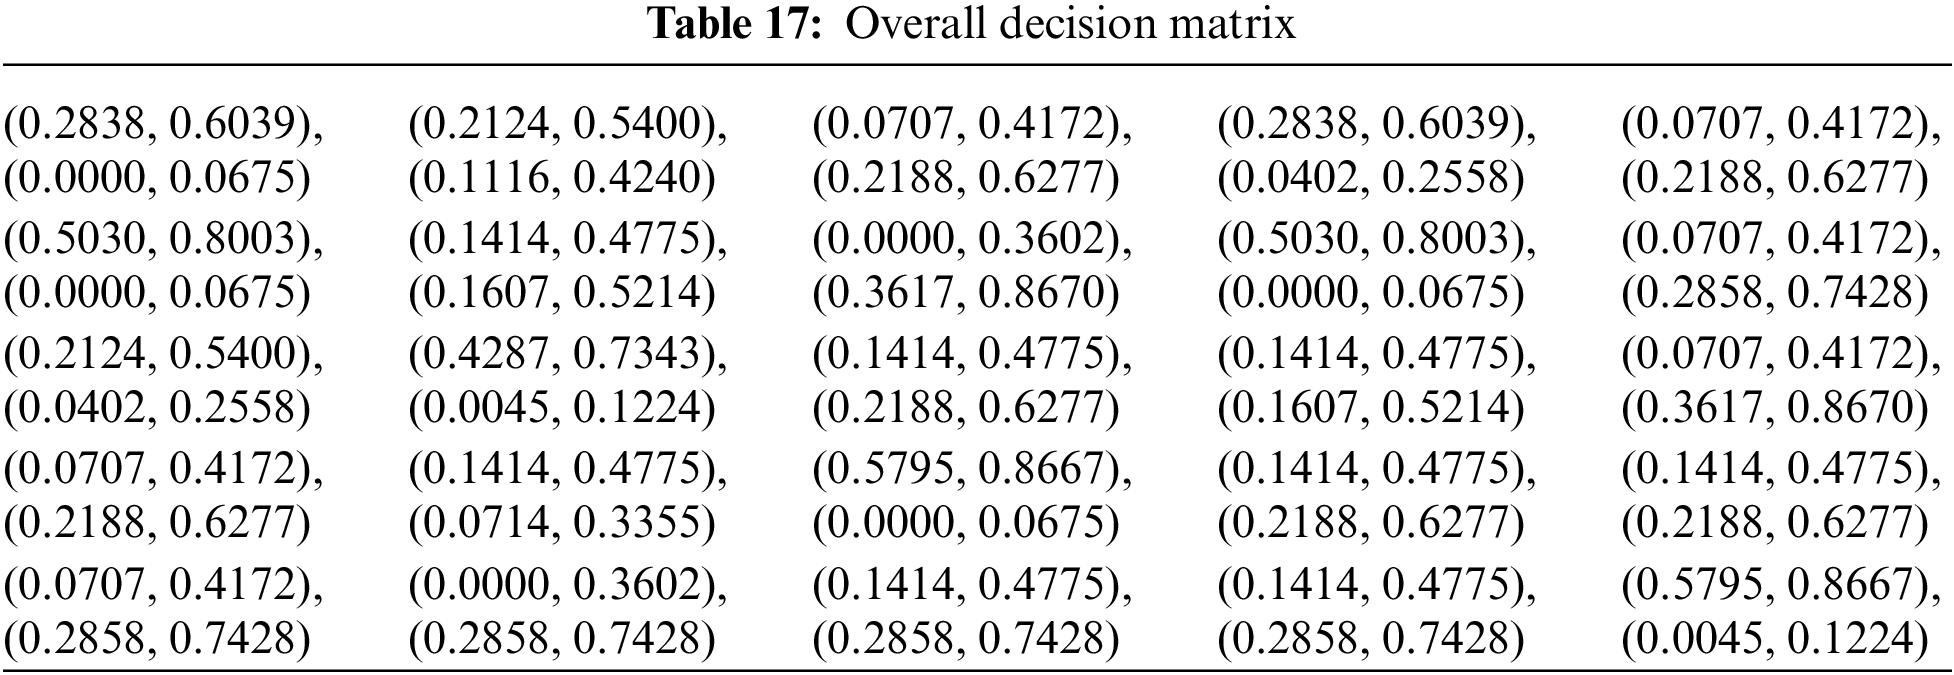
• Optimal q-rung assessment
Because of the
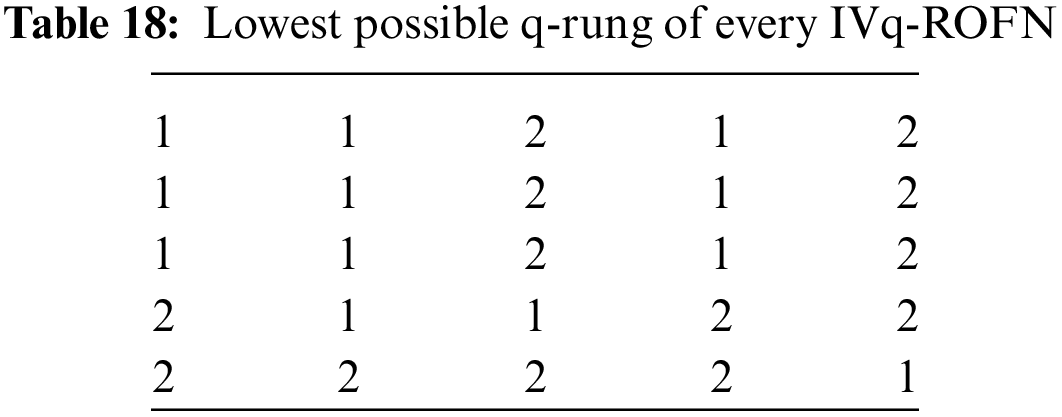
(b) Generation of Table M4 from the application of process b as shown in Section 2.9.1.
By employing process b of Section 2.9.1 on Table 3 for
Table 19 represents the results obtained from the process described above for a confidence level of

Table 20 presents the results derived from the aforementioned process with a confidence level of

Table 21 displays the results obtained from the process with a confidence level of c = 0.5. This midpoint suggests a significant degree of uncertainty, which may lead to a less reliable decision-making process. Therefore, the findings should be approached with careful consideration, as the lower certainty introduces a higher possibility of variability in the data.

In reality, the knowledge base available for decision-making is often not fully reliable, reflecting the inherent uncertainties present in complex real-world scenarios. By also using a lower c value, the uncertainty, typical of real-world GDM problems, is more accurately simulated.
I. Rating the importance of decision makers
Because directly evaluating the above tables with a q-ROFN is challenging due to the complexity and uncertainty involved, the Linguistic Term Table is employed. This method allows us to categorize each matrix using a linguistic term that corresponds to a q-ROFN. By doing so, the evaluation process is simplified, enabling us to effectively integrate the matrix into our fuzzy approach for MΑGDM.
Because of the

Following Table 1, the above tables and matrixes are valued as Very Important (VI), Important (I) and Medium (M), respectively [66].
II. Decision matrix weight
The weights of the new BUI tables can be calculated using the score and inverse score functions as analyzed in Section 2.9.3. Each function produces different results and requires a unique application method to calculate the Overall Decision Matrix, which combines the opinions of all experts.
• Weight calculation based on the score function
Table 23 presents the weight calculations for the three decision makers (DMs) based on the score function. In this table, the certainty degree of each DM corresponds directly to its calculated weight, reflecting the level of confidence or reliability assigned to each decision maker’s input in the overall decision-making process.

The process continues with the combination of the previous BUI Tables into a single Table (Table 24) that combines the opinions of all experts using the above weights.

• Overall decision matrix
• Optimal q-rung assessment
Because of the
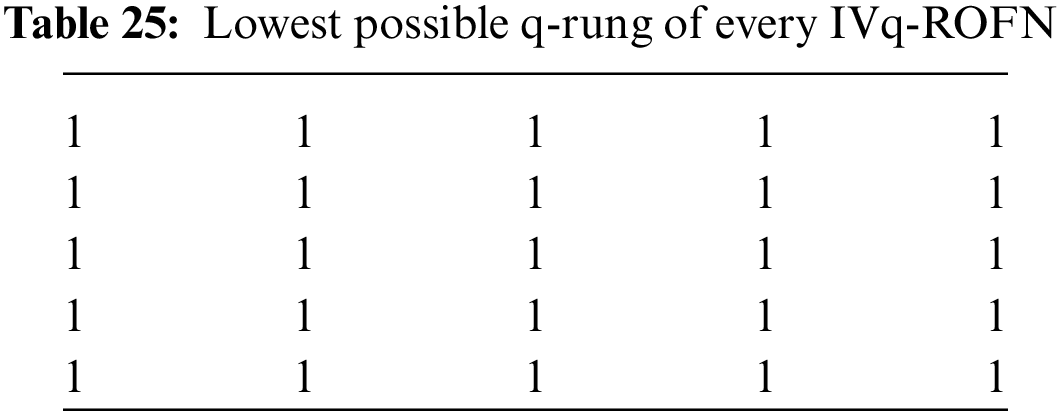
• Weight calculation based on the inverse score function.
Table 26 presents the weight calculations for the three decision makers (DMs) based on the score function. In this table, the certainty degree of each DM corresponds directly to its calculated weight, reflecting the level of confidence or reliability assigned to each decision maker’s input in the overall decision-making process.

The process continues with the combination of the previous BUI Tables into a single Table (Table 27) that combines the opinions of all experts using the above weights.

• Overall decision matrix
• Optimal q-rung assessment
Because of the
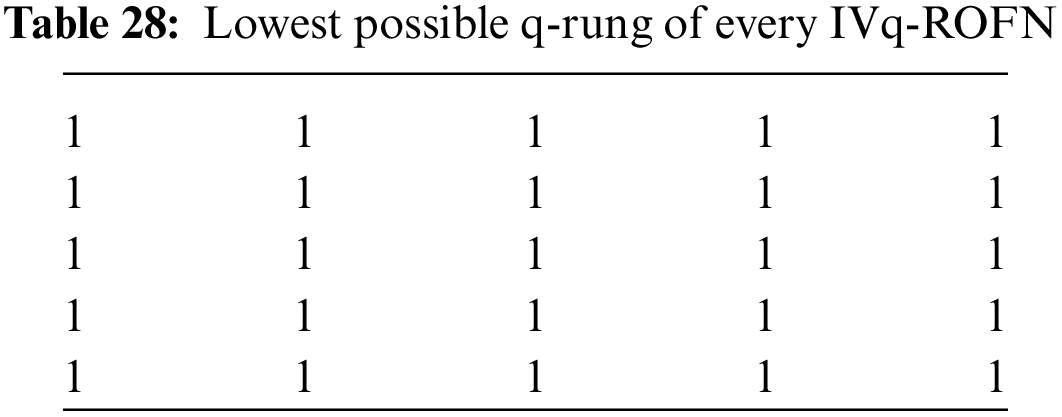
(c) Generation of Table M5 from the application of process c as shown in Section 2.9.1.
By employing process c of Section 2.9.1 on Table 3 for c = 0.5, 0.7, 0.9, we get the three tables below:
In Table 29, we simulate a scenario where our certainty in the membership degree differs from the non-membership degree. Specifically, the certainty in the membership degree is lower than that in the non-membership degree. Despite this difference, both degrees are still relatively high, indicating a generally high level of confidence in the quality of our medical knowledge data. This approach allows us to explore how varying levels of certainty in different aspects of the data impact the decision-making process.

In the scenario of Table 30, both certainties are reduced to

In this scenario of Table 31, the certainty levels have decreased further, with

I. Rating the importance of decision makers
Because directly evaluating the above tables with a q-ROFN is challenging due to the complexity and uncertainty involved, the Linguistic Term Table is employed. This method allows us to categorize each matrix using a linguistic term that corresponds to a q-ROFN. By doing so, the evaluation process is simplified, enabling us to effectively integrate the matrix into our fuzzy approach for MΑGDM.
Because of the

Following Table 1, the above tables and matrixes are valued as Very Important (VI), Important (I) and Medium (M), respectively [66].
II. Decision matrix weight
The weights of the new BUI tables can be calculated using the score and inverse score functions as analyzed in Section 2.9.3. Each function produces different results and requires a unique application method to calculate the Overall Decision Matrix, which combines the opinions of all experts.
• Weight calculation based on the score function
Table 33 presents the weight calculations for the three decision makers (DMs) based on the score function. In this table, the certainty degree of each DM corresponds directly to its calculated weight, reflecting the level of confidence or reliability assigned to each decision maker’s input in the overall decision-making process.

The process continues with the combination of the previous BUI tables into a single table (Table 34) that combines the opinions of all experts using the above weights.

• Overall decision matrix
• Optimal q-rung assessment
Because of the
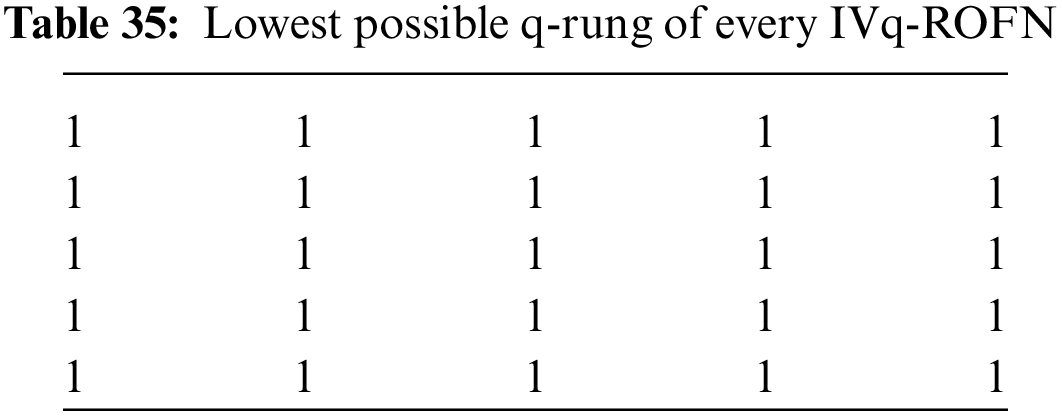
• Weight calculation based on the inverse score function
Table 36 presents the weight calculations for the three decision makers (DMs) based on the inverse score function. In this table, the certainty degree of each DM corresponds directly to its calculated weight, reflecting the level of confidence or reliability assigned to each decision maker’s input in the overall decision-making process.

The process continues with the combination of the previous BUI tables into a single table (Table 37) that combines the opinions of all experts using the above weights.

• Overall decision matrix
• Optimal q-rung assessment
Because of the
To validate the robustness of the proposed diagnosis method a sensitivity analysis is performed. To apply sensitivity analysis the influence of the parameter rung q and similarity measures, as the most significant features of the proposed diagnosis method, is changed slightly and the ranking results are investigated.
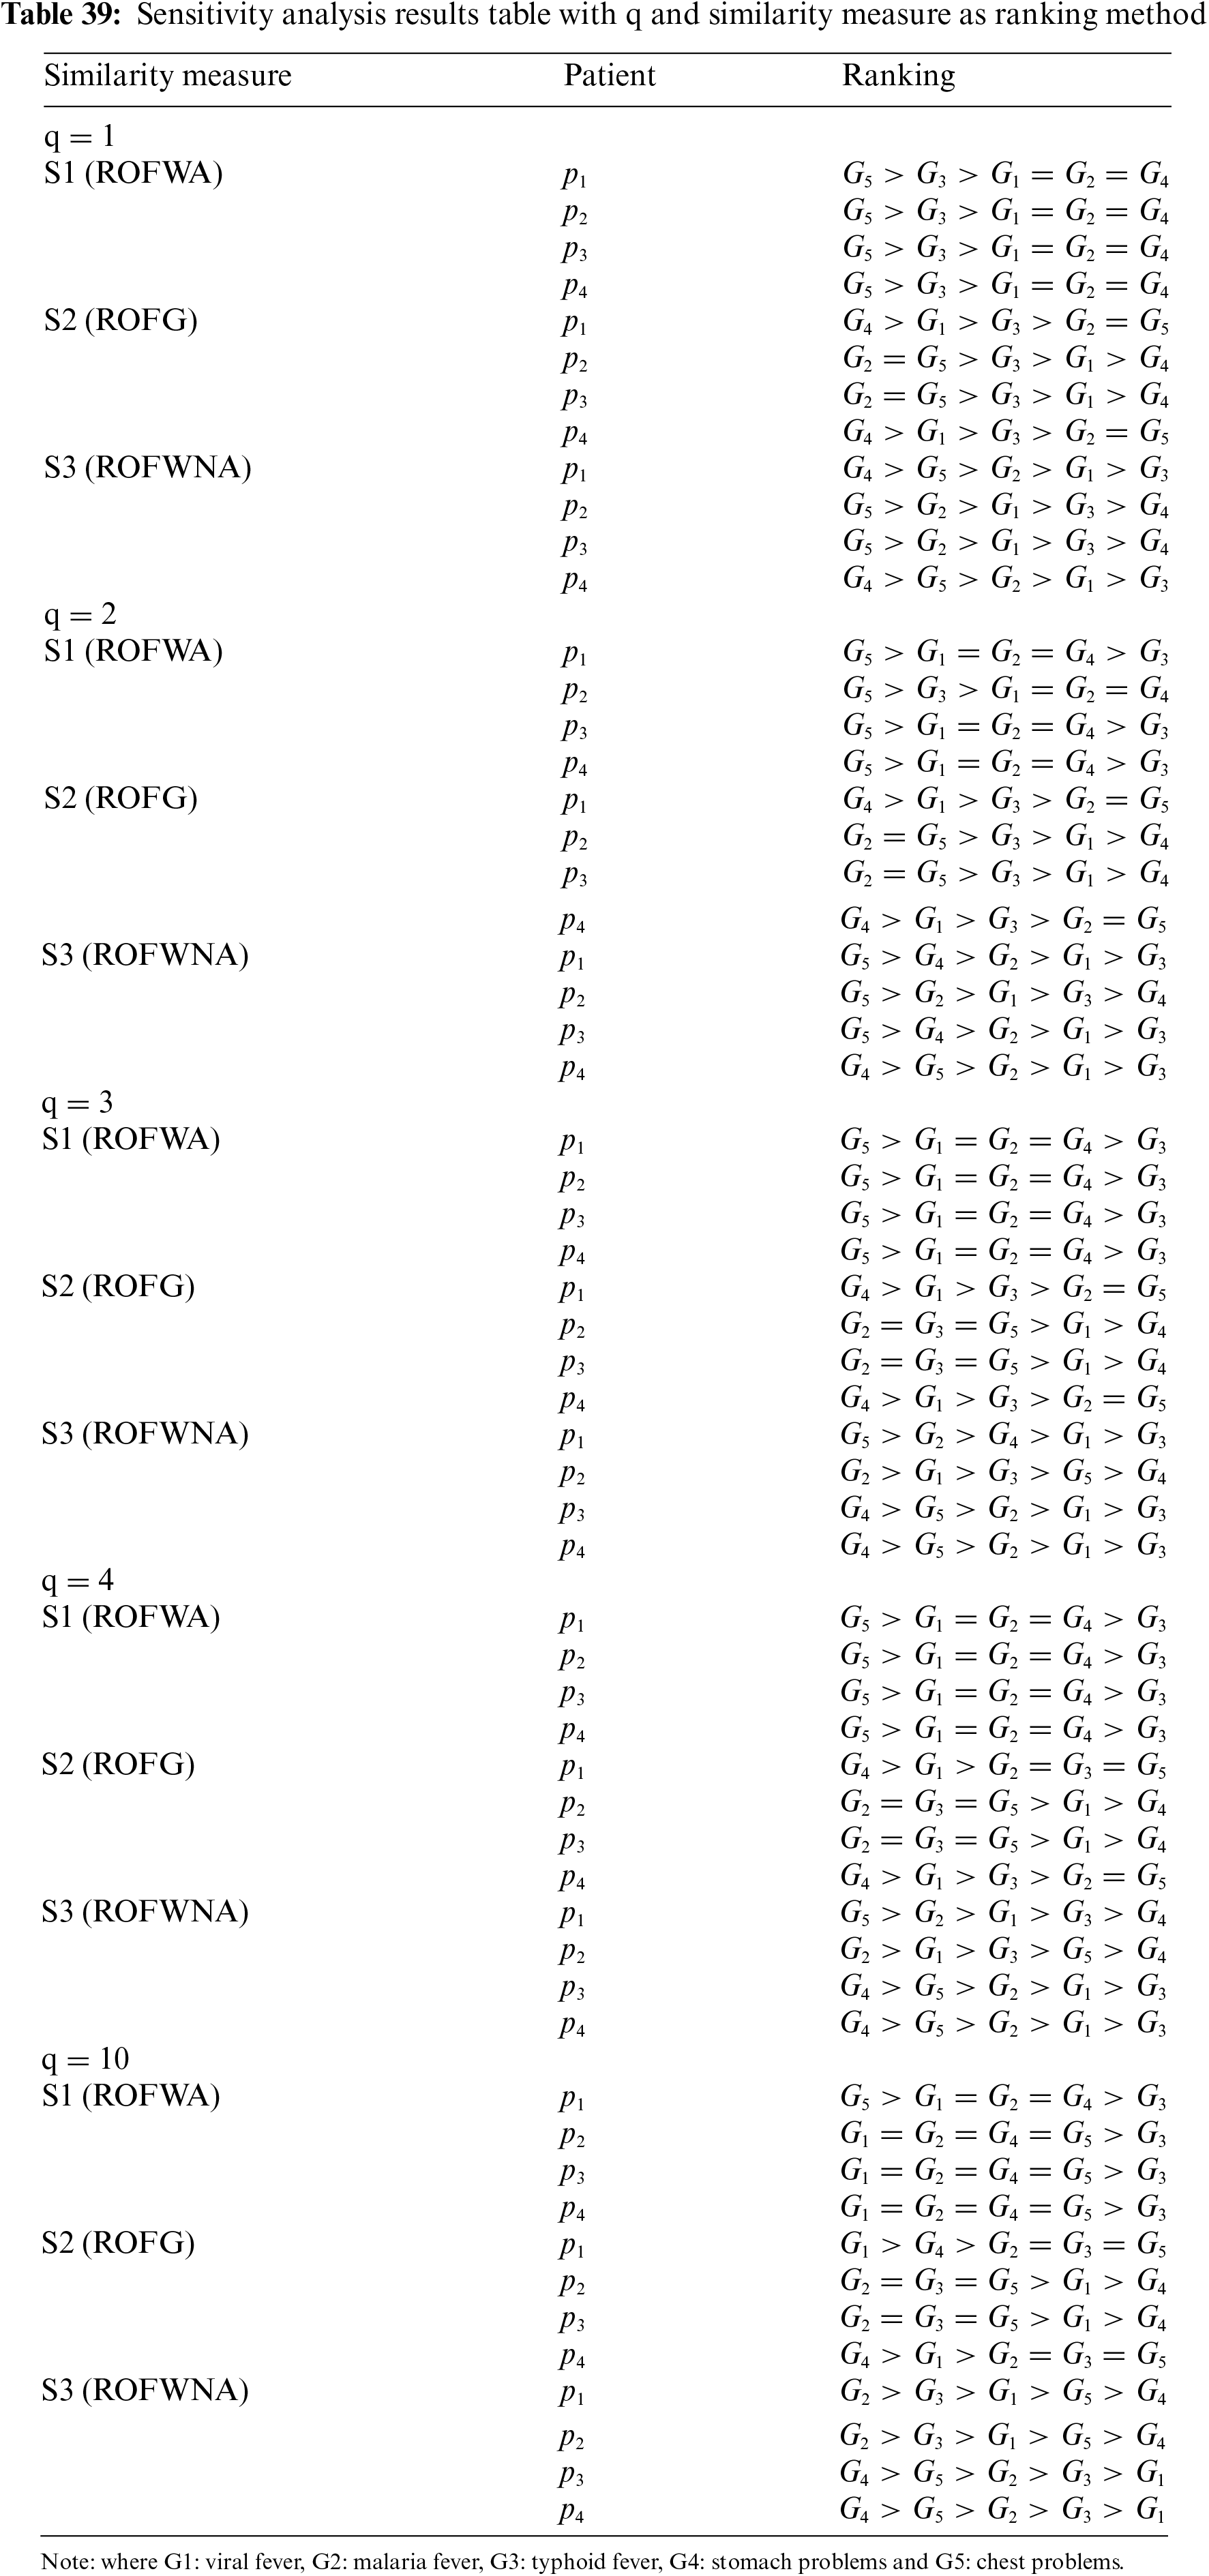
Table 39 presents the results of the sensitivity analysis conducted using the similarity measure ranking method. It illustrates how the 5 diseases are ranked for each of the 4 patients across all aggregation operators employed in this study, beginning with a q-rung value of 1. The analysis is then systematically repeated with increasing q-rung values, specifically 2, 3, 4, and 10.
In our process of classifying the five diseases based on similarity measures, three distinct operators were employed: q-ROFWA, q-ROWG, and q-ROWNA. For each of these operators and each table, the criteria (symptoms) were aggregated into a single criterion. For the aggregation the weight of each criterion was calculated using the first entropy method as it was previously analyzed. And so, the now one-dimensional arrays of medical knowledge and patient symptom information are compared by applying the similarity measure.
In the case of the ROFWA operator due to the mathematical equation of the aggregation, it is evident that when in at least one of the q-ROFNs of the matrix of medical knowledge or patient symptoms, there is a zero degree of non-membership then the final degree of non-membership of the matrix of medical knowledge or patients’ symptoms respectively, will also be zero. Then by applying the formula of the similarity measure, it is also evident that when two q-ROFNs A and B are compared, with the similarity measure, and one of them has a zero degree of non-membership then the similarity measure will depend only on q-ROFN A. For these reasons when in two positions of the aggregated medical knowledge matrix there are q-ROFNs with zero degree of non-membership then the similarity measure matrix will have two identical columns. Likewise with three or more columns.
Similar observations apply to the ROFG operator, albeit with a distinction: for identical columns to emerge, the degrees of membership must be zero, rather than the degrees of non-membership.
For this reason, with the ROFWA operator, the classification of G1, G2, and G4 is always the same whatever q is chosen. With a small q the G5 is considered a better choice, after that the G3, and finally the G1, G2, and G4. As q increases the position of G3 starts to decline for all patients with G5 remaining the optimal choice for patient 1 and G1, G2, G3, and G4 being evaluated as equal for the remaining patients.
With the ROFG operator, the ordering of G2 and G5 is always the same whatever q is chosen. With a small q G4 is considered a better choice for patients 1 and 4 with G2 and G5 worse. While for patients 2 and 3 the opposite is true. As q increases for patient 1, G1 surpasses G4, but the classification remains the same for the other three patients.
For the ROFWNA operator due to its mathematical formula that prevents the calculation of a zero degree of participation or non-participation, there is no problem of evaluating different diseases alike. For a small q, G4 is the best choice for patients 1 and 4, while G5 is for patients 2 and 3. As q increases, it appears that the value of G4 and G5 is degraded for patients 1 and 2, and G2 is the optimal choice, while for patients 3 and 4 G4 and G5 remain the best alternatives.
Fig. 5 presents a spider plot that illustrates the comparison of the similarity measure values for patient 1 using the three different aggregation operators previously used in this paper: ROFWA, ROFG, and ROFWNA. The plot covers five diseases considered in this study, with a q-rung of 1.
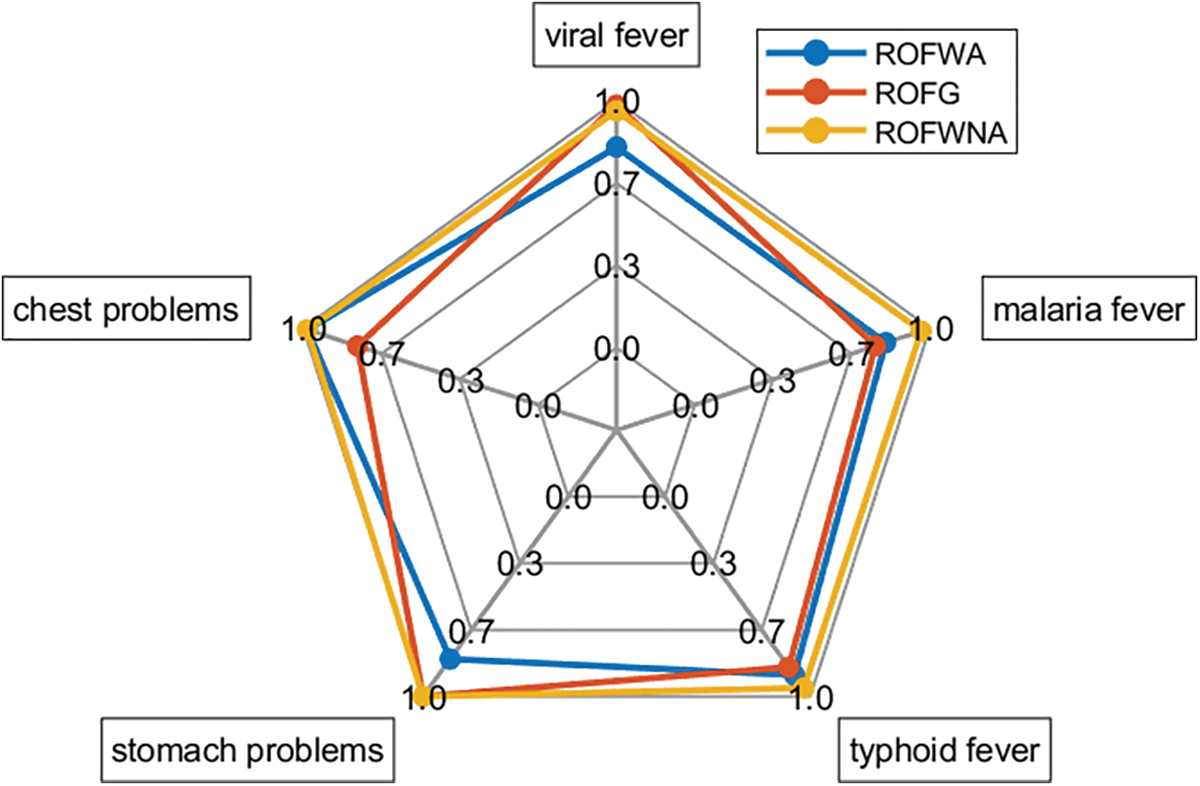
Figure 5: Spider plot of patient 1 results for similarity measure as ranking method with q = 1
Fig. 6 presents a spider plot that illustrates the comparison of the similarity measure values for patient 3 using the three different aggregation operators previously used in this paper: ROFWA, ROFG, and ROFWNA. The plot covers five diseases considered in this study, with a q-rung of 4.
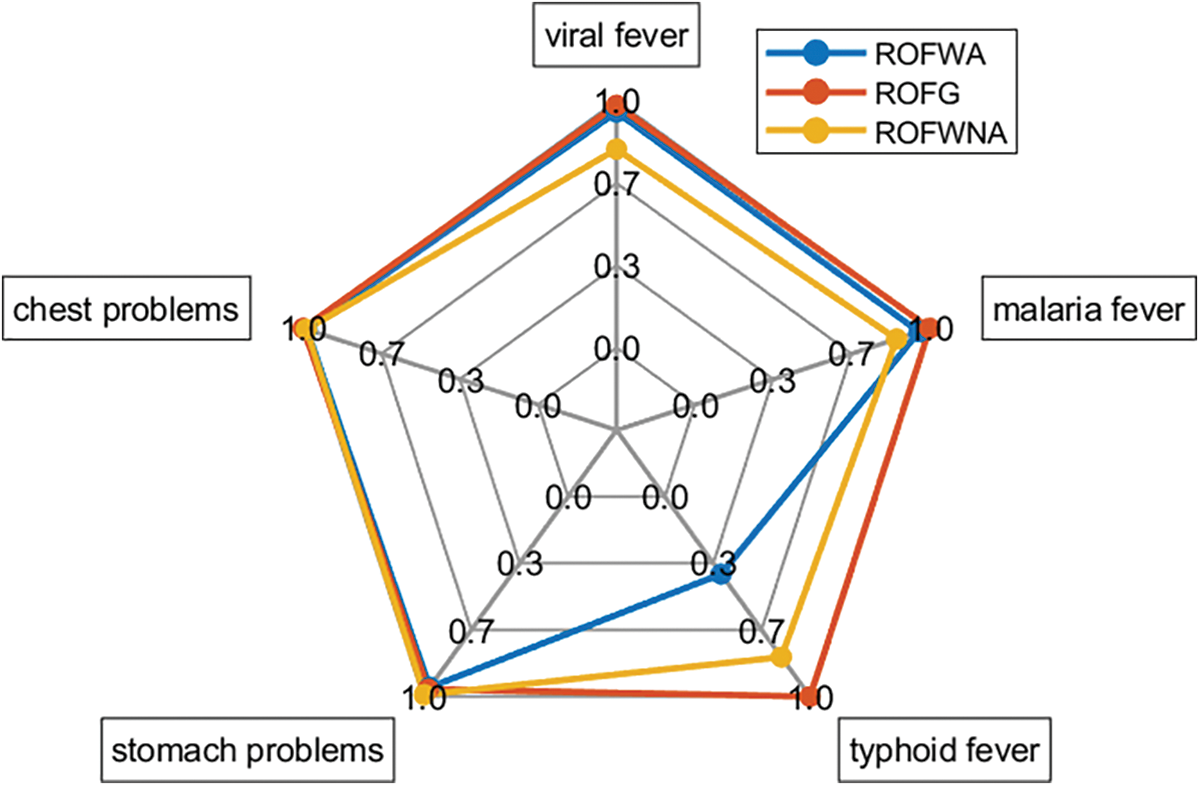
Figure 6: Spider plot of patient 3 results for similarity measure as a ranking method with q = 4
Table 40 presents the results of the sensitivity analysis conducted using the score function ranking method. It illustrates how the 5 diseases are ranked for each of the 4 patients across all aggregation operators employed in this study, beginning with a q-rung value of 1. The analysis is then systematically repeated with increasing q-rung values, specifically 2, 3, 4, and 10.
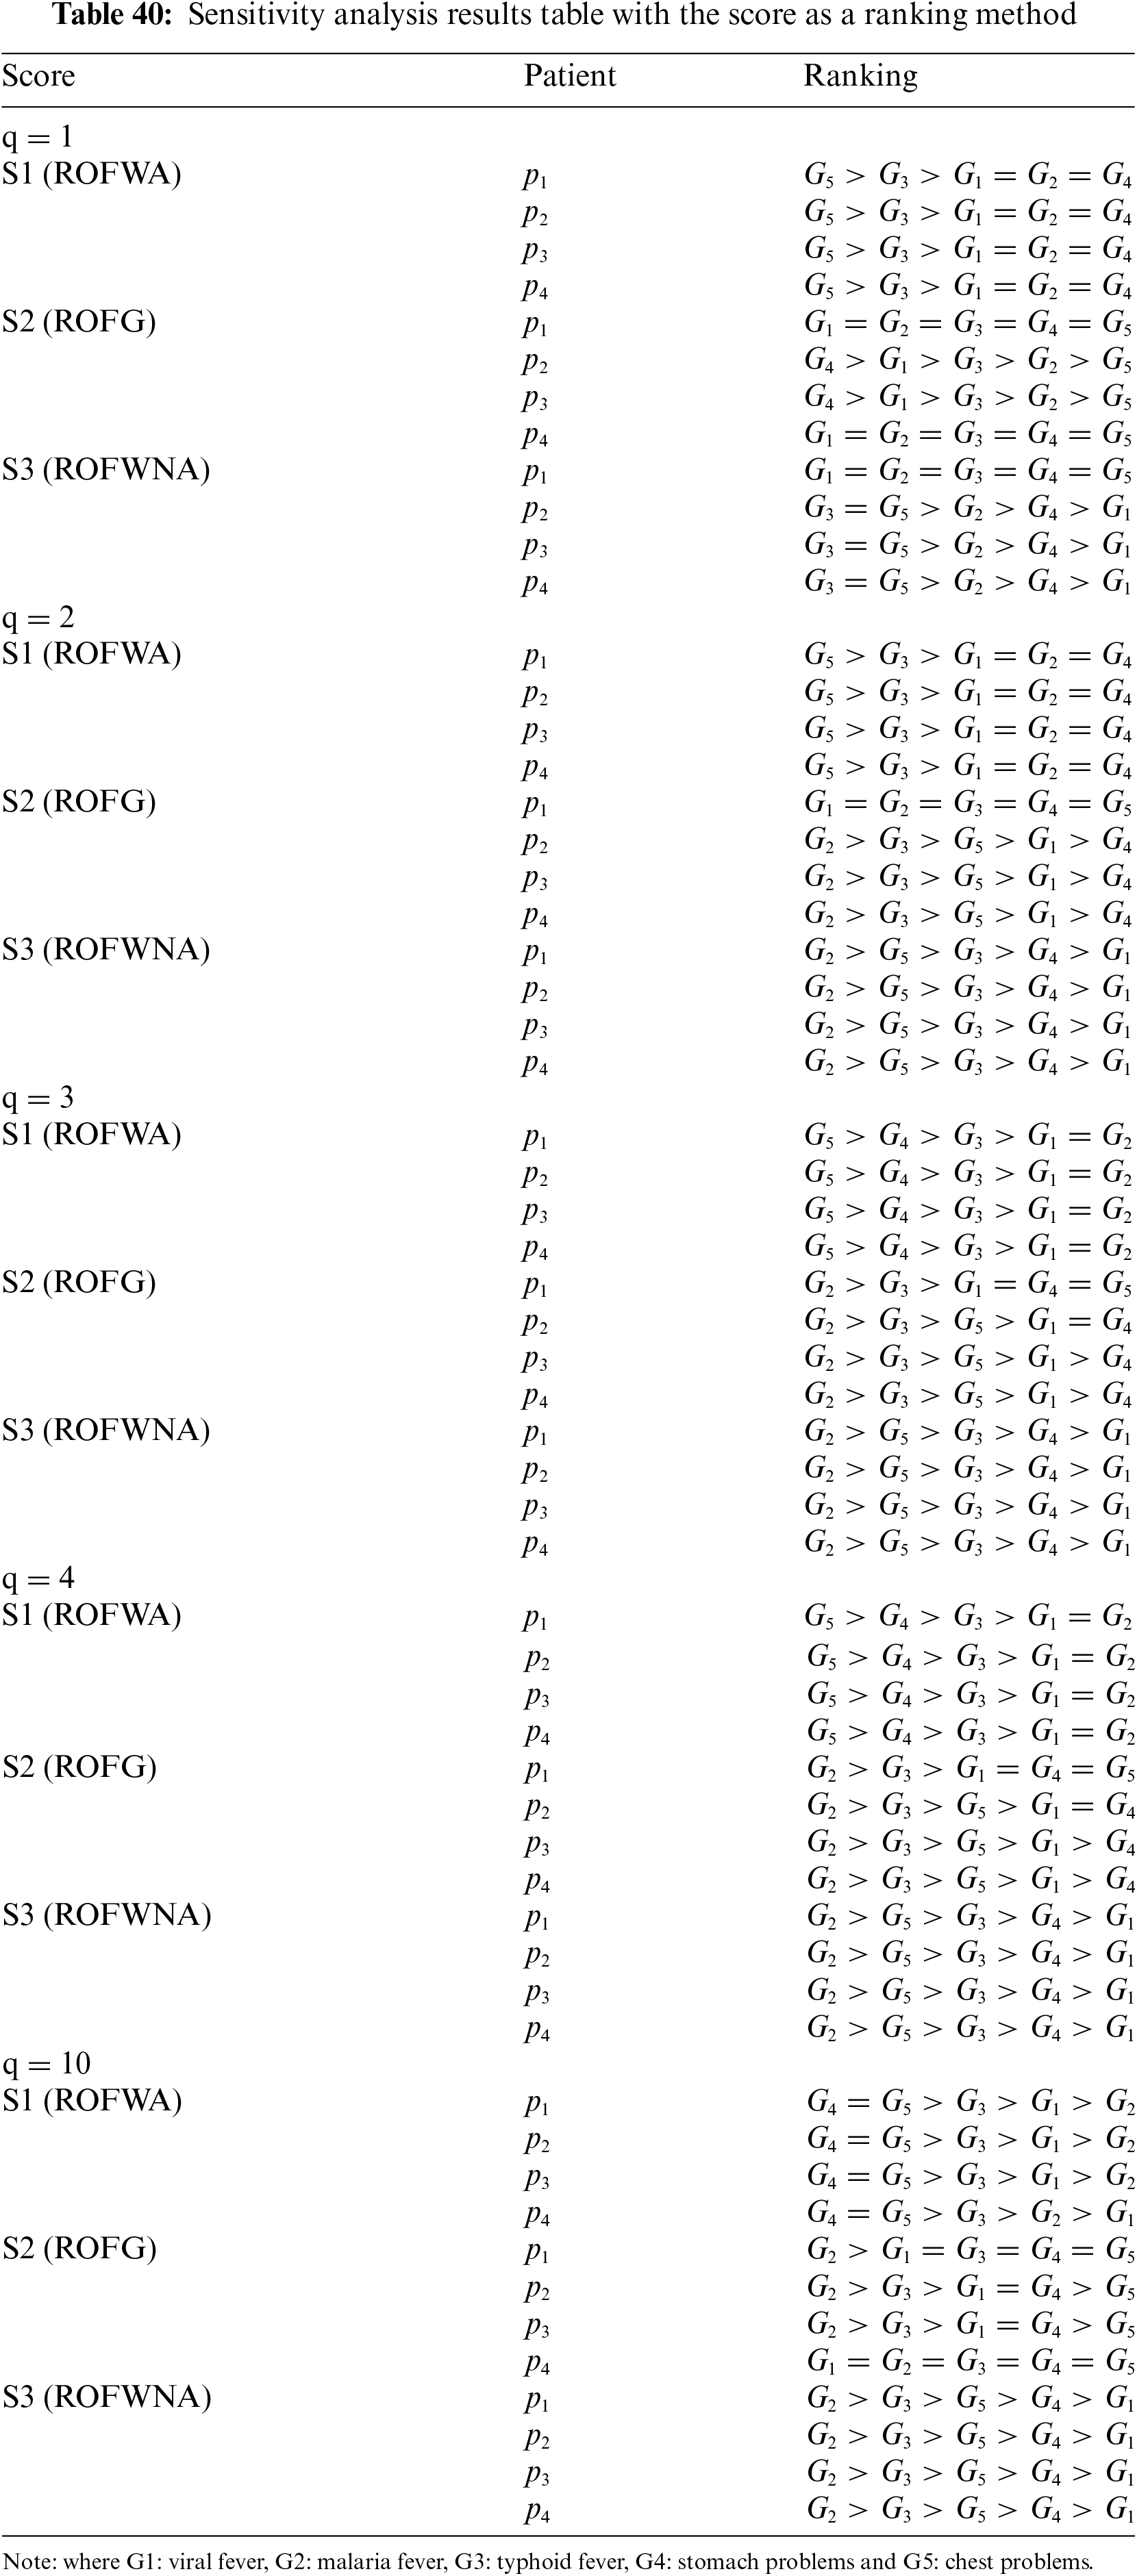
Using the Score Function as the Decision-Making Method
(1) ROFWA Aggregation Operator
With the ROFWA aggregation operator, the ranking of diseases remains consistent for each of the four patients. For low values of q, Disease G5 is selected as the best-fitting disease, followed by Disease G3. However, the operator exhibits a significant drawback similar to the one observed in the similarity measure results: Diseases G1, G2, and G4 cannot be properly ranked against each other since they share the same score value. As the value of q increases, Disease G4 becomes a better choice, eventually surpassing Disease G5 when q is set to 10.
(2) ROFG Aggregation Operator
The ROFG aggregation operator yields the same score for each disease for patients P1 and P4, with Disease G4 emerging as the most probable diagnosis for patients P2 and P3, followed by Disease G1. For these two patients, each disease has a distinct rank. As the value of q rises, the ranking for patients P1 and P4 differentiates, allowing for a clearer decision regarding the ailment of each patient. With higher q values, Disease G2’s score surpasses G3, making it the best option, while Disease G4 becomes the least favorable choice.
(3) ROFWNA Aggregation Operator
Using the ROFWNA aggregation operator, the ranking of each of the five diseases is the same for patient p1. For the remaining patients, Diseases G3 and G5 are deemed the best selections, sharing the same score value. As q increases, the ranking for patient P1 differentiates, enabling a clearer decision regarding the patient’s ailment. Notably, as q rises, Disease G2’s score surpasses G3, positioning it as the best option.
• Disease Selection Variability: Disease G5 is initially the most probable disease, but as q increases, Disease G4 and G2 become more prominent choices depending on the aggregation operator used.
• Sensitivity to q value: The score values initially fluctuate with increasing q values but eventually reach a saturation point where the ranking stabilizes. Higher q values provide clearer and more reliable disease separation and ranking.
• Aggregation Operator Limitations: The ROFWA and ROFG operators show limitations in distinct ranking for lower q values. The ROFWNA operators provide better differentiation but still face challenges in ranking diseases distinctly at certain q values.
Table 41 presents the results of the sensitivity analysis conducted using the inverse score function ranking method. It illustrates how the 5 diseases are ranked for each of the 4 patients across all aggregation operators employed in this study, beginning with a q-rung value of 1. The analysis is then systematically repeated with increasing q-rung values, specifically 2, 3, 4, and 10.
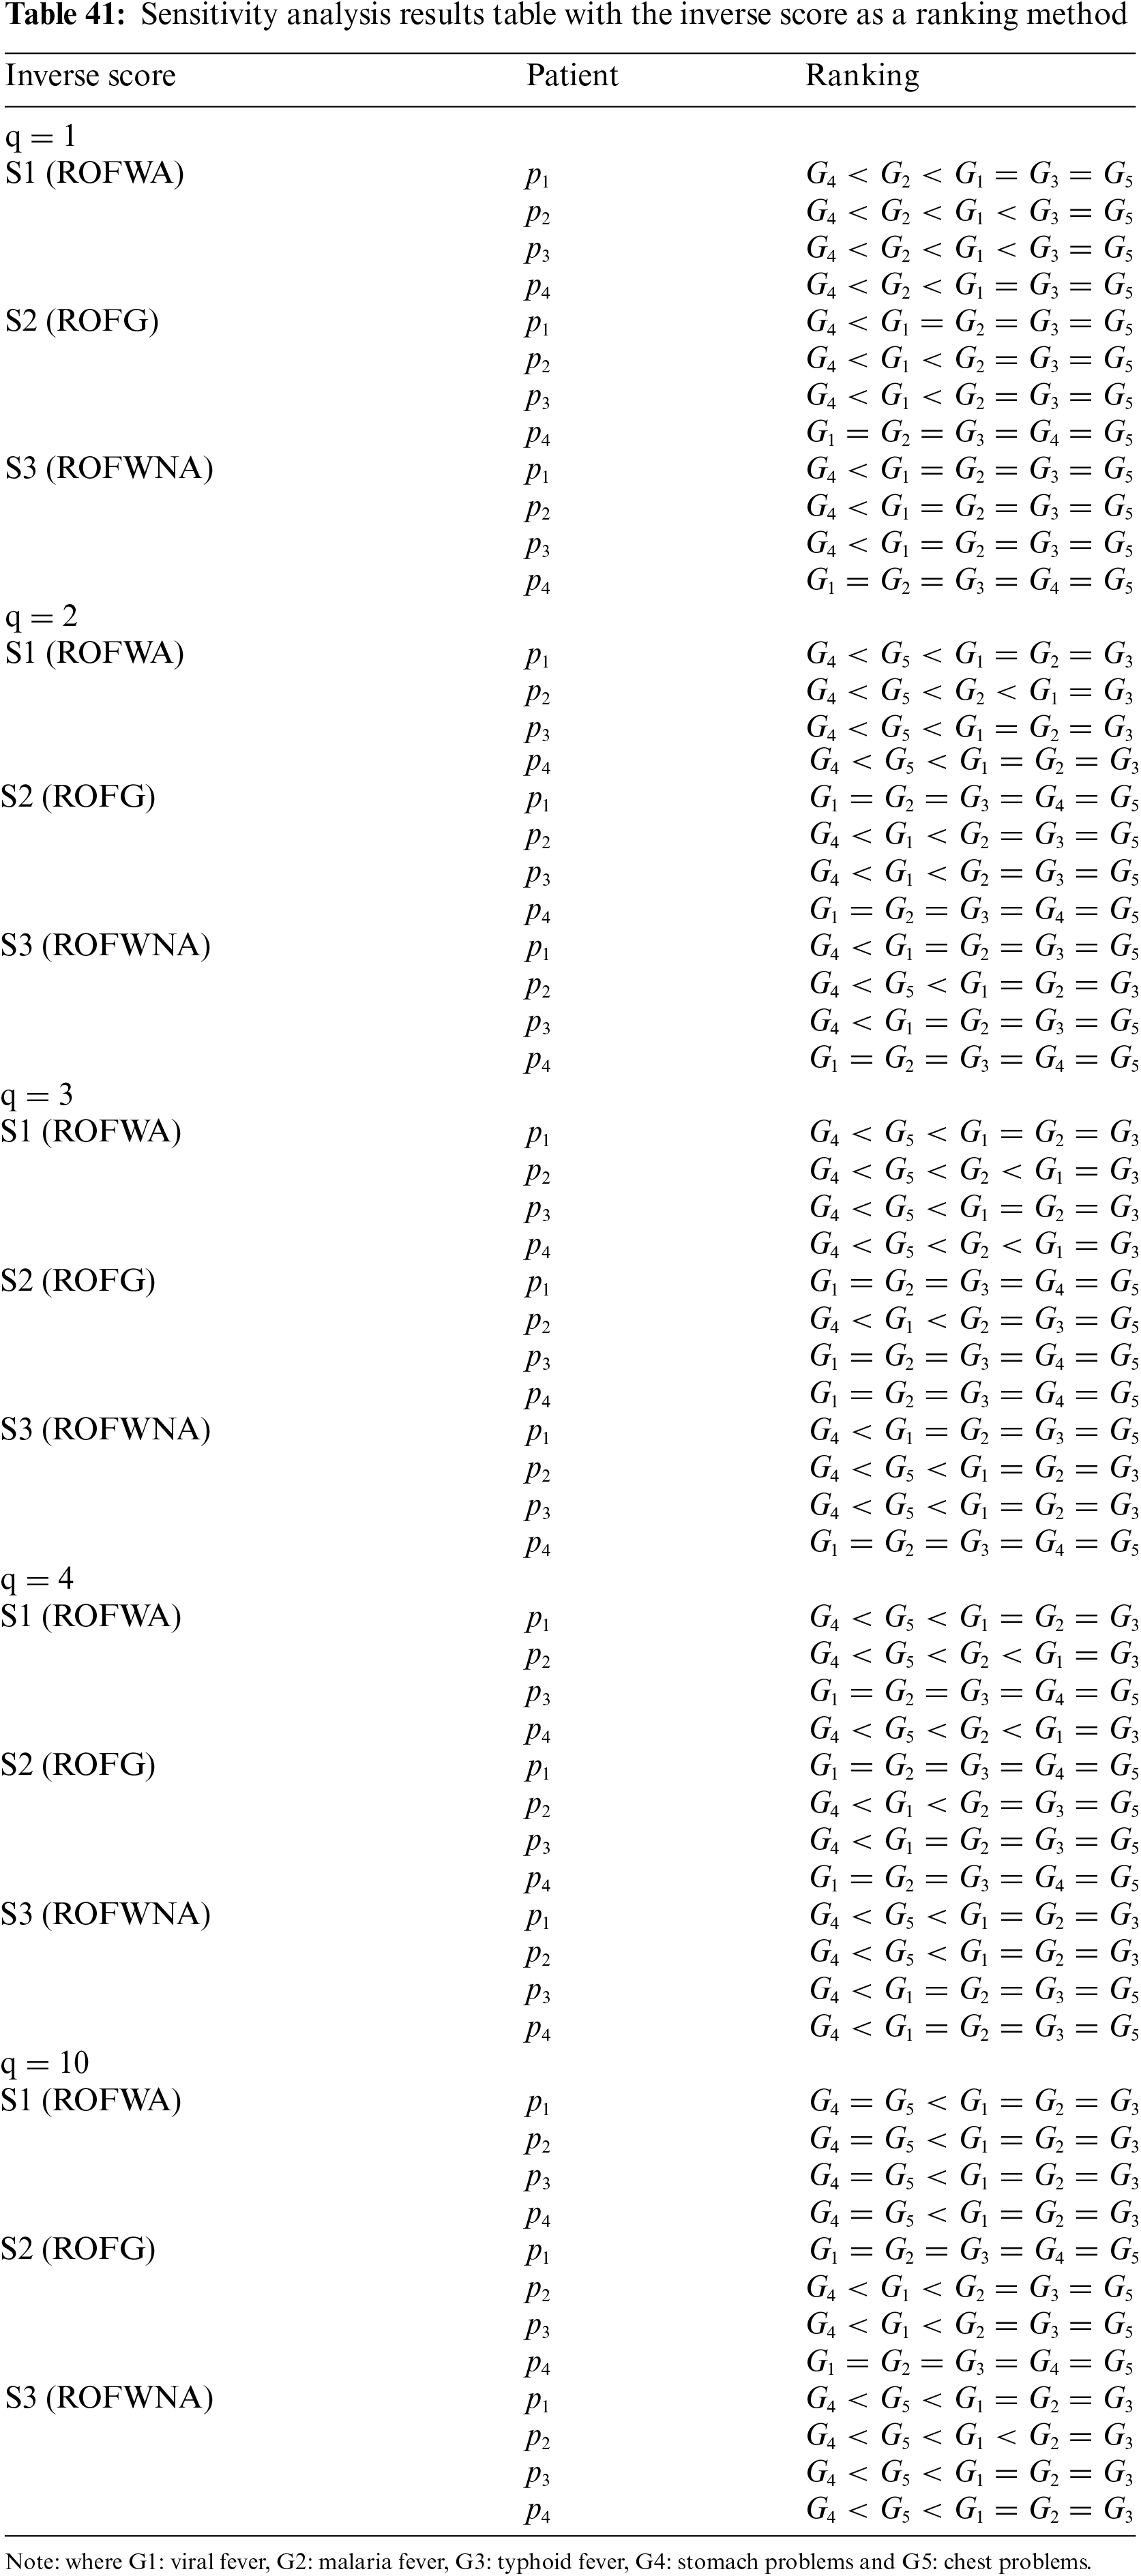
Using the Inverse Score Function as the Decision-Making Method
The inverse score function method determines the ranking of diseases for each patient by calculating the inverse score, where the disease with the lowest calculated score is selected. The ranking is established by increasing inverse score values.
(1) ROFWA Aggregation Operator
With the ROFWA aggregation operator, Disease G4 is consistently determined to be the most probable disease, followed by Disease G2. As the q value increases, Disease G4 remains the top choice, but Disease G5 moves up to the second rank. At q = 10, G5’s inverse score equals G4’s, resulting in both diseases being equally ranked.
(2) ROFG Aggregation Operator
Starting with q = 1, the ROFG aggregation operator produces equal inverse scores for all diseases in patient P4, making it impossible to differentiate between them. For the other three patients, G4 is selected as the most probable disease due to having the lowest inverse score. As q increases to values of 2, 3, and 4, the problem of equal inverse scores extends to patients P1 and P3, making ranking impossible for these patients. However, for patients where scores differ sufficiently, G4 remains the most probable disease.
(3) ROFWNA Aggregation Operator
With a q value of 1 and the ROFWNA aggregation operator, p4 faces the same problem it faced with the ROFG aggregation operator, where all inverse scores are equal, preventing a clear assessment. For the remaining patients, although Disease G4 has the lowest inverse score and is thus the selected disease, an exact ranking of the other diseases is impossible due to them sharing the same inverse score. As the q value increases, while the issue of equal scores persists in some cases, the inverse score values become distinct enough to enable decision-making for every patient. As q increases, G4 is consistently selected, followed by G5.
• Disease Selection Variability: Disease G4 consistently emerges as the most probable disease across various aggregation operators and q values.
• Sensitivity to q Value: As q increases, the inverse score values initially vary but eventually stabilize, indicating that higher q values provide clearer and more reliable rankings.
• Aggregation Operator Limitations: Different aggregation operators exhibit specific limitations. The ROFWA and ROFWNA operators show issues with equal scores for certain q values, while the ROFG operator’s problem extends to more patients as q increases.
A significant aspect of our article involved conducting a sensitivity analysis. In this analysis, the methodologies were repeatedly applied, varying only the value of q each time. In recent literature, q typically is assigned values of 1, 2, or 3. To explore the impact of higher q values, our analysis was extended to include q = 4 and 10. Our findings indicate that as q increases, the allowed uncertainty also increases. Interestingly, our results demonstrate that despite variations in the selected disease, there is a point of stability where the response remains consistent, and the same disease is repeatedly identified regardless of the specific q value. This insight underscores the importance of understanding the implications of different q values in medical decision-making processes and highlights the need for further exploration into the optimal q value for achieving reliable diagnostic outcomes.
In this study, we explored the impact of various aggregation operators and decision-making methods on the sensitivity analysis for medical diagnosis using q-rung orthopair fuzzy sets (q-ROFS). Our analysis focused on three aggregation operators: q-ROGWA, q-ROFWNA, and q-ROFG. Additionally, we employed three different decision-making methods: the similarity measure using the cosine function, the score function, and an innovative method—the inverse score function.
The detailed sensitivity analysis was conducted using three distinct decision-making methods, with the results shown in different tables. The first method utilized a similarity measure with the cosine function, allowing us to quantify the resemblance between patient symptoms and potential diseases. The second method involved the score function, which ranks the diseases based on calculated scores. The third method was the inverse score function, an innovative approach that inversely prioritizes lower scores to highlight different perspectives in diagnosis.
Sensitivity and comparison analysis
The influence of the parameter q and similarity measures on the disease ranking.
(1) Similarity Measure Analysis (Table 39):
The sensitivity analysis using the similarity measure provided insightful results regarding the impact of varying q values on disease ranking. It was evident that with lower q values, the diagnosis was more sensitive to slight variations in patient symptoms, leading to fluctuating disease rankings. However, as q increased, the rankings began to stabilize, indicating a more robust decision-making process under higher uncertainty levels.
(2) Score Function Analysis (Table 40):
The application of the score function in our sensitivity analysis revealed a similar trend. With q values of 1, 2, and 3, there was noticeable variability in the selected diseases, reflecting the method’s sensitivity to uncertainty. When q was increased to 4 and 10, the selected diseases became more consistent. The analysis also shows the differences among the three aggregation methods. The ROFWA and ROFG operators demonstrate significant limitations in providing distinct rankings at lower q values. These operators often fail to differentiate between multiple diseases, resulting in the same score for several conditions. Conversely, the ROFWNA operator shows better differentiation capabilities but still faces challenges in ranking diseases distinctly at certain q values. Despite performing better than ROFWA and ROFG, the ROFWNA operator occasionally struggles to offer a clear and decisive ranking for all conditions.
(3) Inverse Score Function Analysis (Table 41):
The inverse score function provided a unique perspective in the sensitivity analysis. As q increases, the inverse score values initially vary but eventually stabilize, indicating that higher q values provide clearer and more reliable rankings. Using this decision-making method different aggregation operators exhibit specific limitations. The ROFWA and ROFWNA operators show issues with equal scores for certain q values, while the ROFG operator’s problem extends to more patients as q increases.
In conclusion, the sensitivity analysis demonstrated that while lower q values are more prone to variations in diagnosis, higher q values provide a stable and consistent decision-making process. However, because identical score values can appear when using specific aggregation operators with particular decision-making methods at certain q values, the selection of the q value must be carefully considered. The q value significantly influences the ranking of diseases, and an inappropriate choice can lead to indistinguishable rankings, undermining the decision-making process. Therefore, to achieve the optimal ranking of diseases, it is crucial to select the q value carefully, ensuring it enhances the differentiation capability of the chosen aggregation operator and decision-making method. This careful selection helps in producing a more accurate and reliable ranking, ultimately improving diagnostic outcomes.
Previous studies using data from Tables 2 and 3 have shown that most results yield similar outcomes in terms of disease ranking. Table 42 summarizes these earlier works that also utilized the data from Tables 2 and 3.
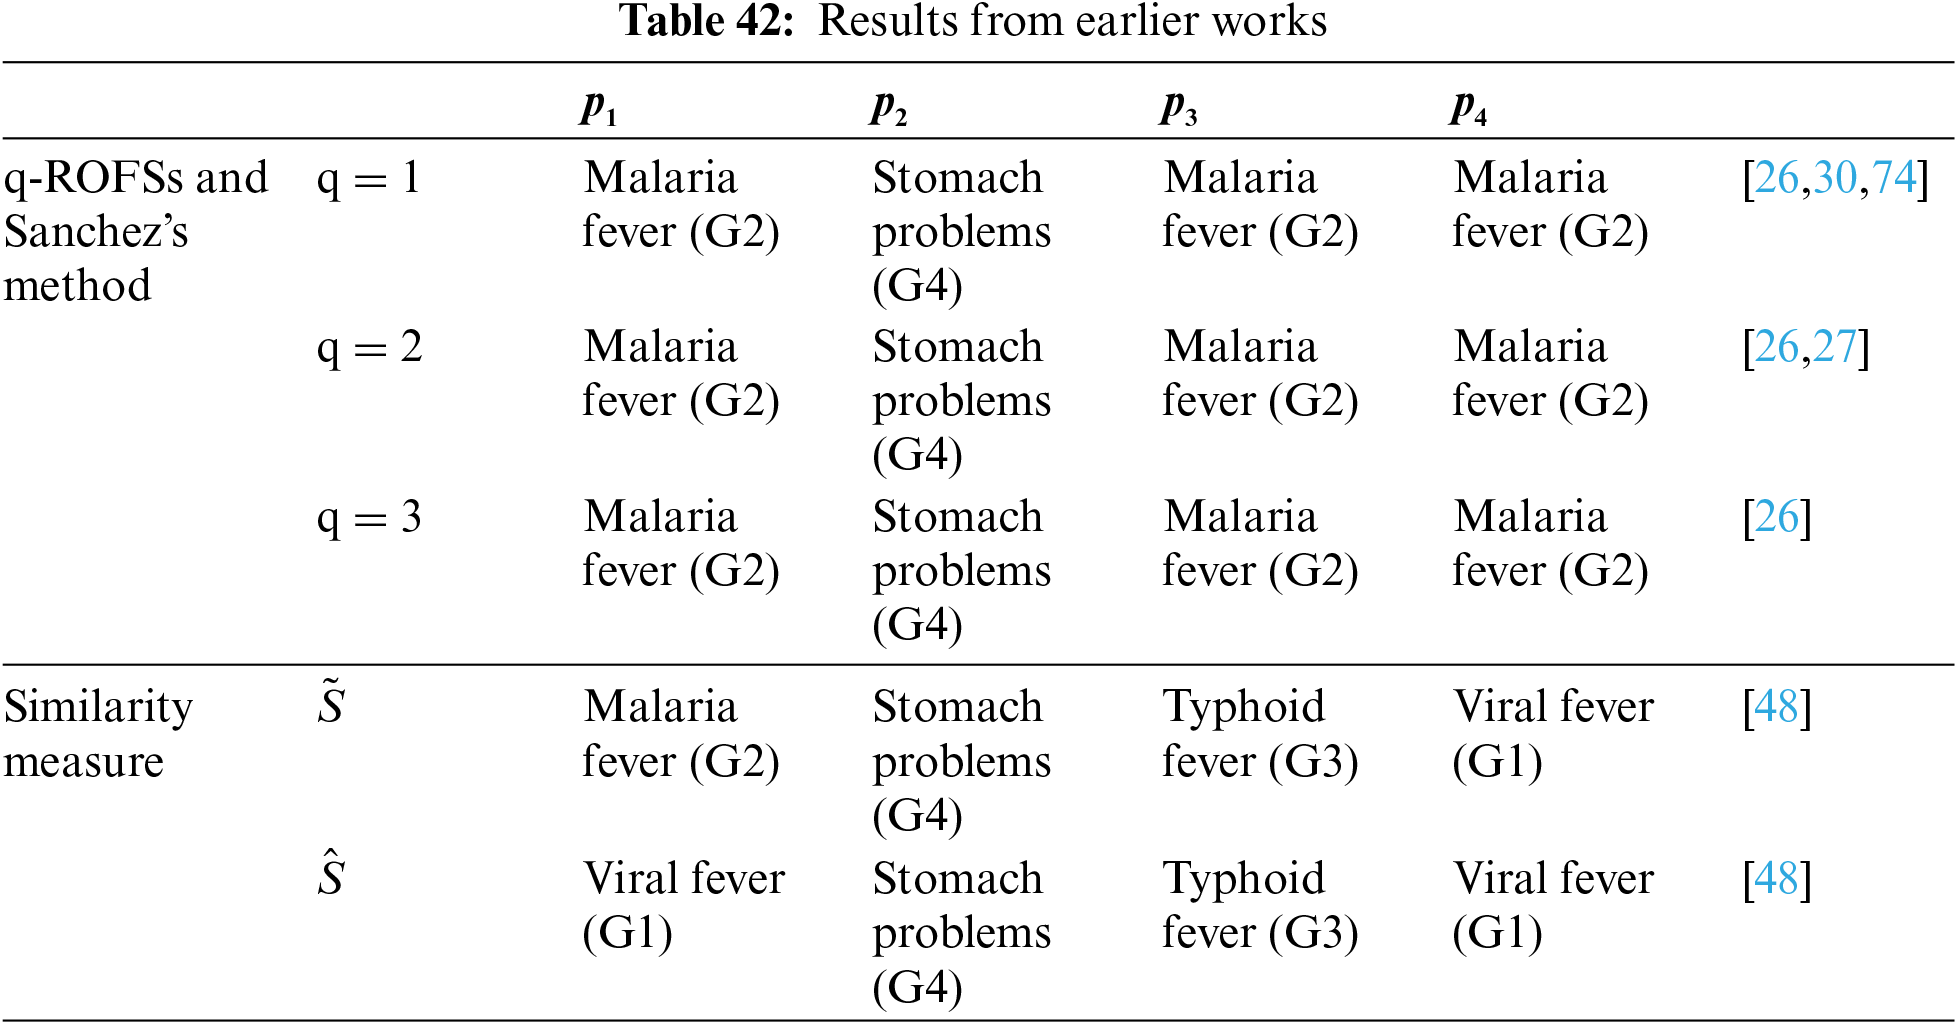
Even though the methodologies used in previous work differ from those in our study, the results are remarkably similar. Malaria fever (G2) consistently ranks as the highest disease for patients p1, p3, and p4, while stomach problems dominate for p2. While our results varied depending on the specific methodology applied, these diseases regularly maintain a high ranking, demonstrating consistency across different approaches.
The diagnostic process relies heavily on the opinions of medical professionals, each bringing their unique perspective to the decision-making process. Given that not all professional opinions will align, the methodologies explored in this paper provide a way to aggregate these diverse opinions into a single mathematical representation of medical knowledge, which can then be utilized in the MΑGDM process. Our research highlights that not all aggregation methods offer the same level of accuracy in disease detection for every patient. For instance, using the q-ROFWA and q-ROFWG aggregation operators and the similarity measure as the decision-making method can result in multiple diseases having the same maximum value, making it challenging to identify the most probable disease. However, the q-ROFWNA aggregation operator addresses this issue by assigning a unique value to each disease, thereby facilitating a clear and decisive diagnosis for each patient. In addition to exploring aggregation operators, our study also investigates decision-making methods, including the cosine similarity measure, the score function, and an innovative method, the inverse score function. These methods offer distinct approaches to analyzing medical data. Of course, the aggregation operators and the decision-making methods explored in our article are not the only ones in existence. They represent just a subset of the available methods, and further exploration of additional ones could yield even more robust solutions for medical diagnostics.
The proposed applications could be extended for data representation to various tasks such as prognosis, classification, and other decision-making processes. The used methodologies are versatile and adaptable, without any specific restrictions on the type of data, including the dimensionality, number of attributes, or number of samples, etc. There are no data representation restrictions in our approach because a wide variety of criteria is possible to be incorporated and, as highlighted in our paper, the opinions of numerous experts can be leveraged. This flexibility is one of the key strengths that enables the application of these methodologies in the initial stages of deep learning, facilitating data manipulation and information extraction. However, the biggest challenge lies in selecting the appropriate methodology for each specific application to ensure optimal results. Pairing the correct technique with the relevant task is crucial for maximizing performance and accuracy.
Despite its promise, fuzzy logic, especially in its advanced forms, is still a relatively new and evolving field that requires extensive research to fully understand and optimize its functions in medical applications. While initial studies have demonstrated its potential to enhance diagnostic accuracy and decision-making, numerous challenges and complexities need to be addressed. This includes refining the methodologies for the diagnostic process, improving the integration of fuzzy logic with other diagnostic tools, and validating its effectiveness across diverse medical conditions and patient populations. Continued research and development are essential to overcome these hurdles, ensuring that fuzzy logic can be reliably and effectively applied in real-world clinical settings to improve patient outcomes.
The data utilized in this paper, while not extensive enough to develop a comprehensive decision-making tool capable of detecting a wide range of diseases, provides a valuable foundation for studying the methodologies analyzed above. The primary focus of this article is to explore and evaluate various advanced fuzzy set techniques and their applications in medical diagnostics. By applying these methodologies to the given dataset, we can filter out and identify the most effective approaches that hold the greatest potential for real-world diagnostic scenarios. This focused analysis allows us to pinpoint the techniques that best handle uncertainty and improve diagnostic accuracy. In the future, a larger knowledge base system should be created, incorporating data about many more diseases and possible symptoms. This expanded dataset would enable us to generalize our results beyond the limited scope of the five diseases and five symptoms currently available, ultimately paving the way for the development of robust clinical tools that can be reliably and effectively applied in diverse medical settings.
For future research directions, we plan to expand the current methodologies in several important ways:
The first aim is to implement the developed aggregation operators and uncertainty-handling techniques as a data preprocessing step for machine learning models. Integrating these methodologies early in the machine learning pipeline will enhance data manipulation and feature extraction, allowing models to better handle uncertainty in medical data. A second focus involves exploring uncertain medical knowledge acquisition in greater detail. The current framework addresses uncertainty in patient data, but further research will concentrate on acquiring and structuring medical knowledge from diverse, uncertain sources. Delving deeper into linguistic medical knowledge is also intended, particularly regarding the representation and aggregation of expert knowledge expressed in natural language. This approach will incorporate qualitative information, such as patient symptoms described in medical records, into fuzzy decision-making processes. Finally, future research will investigate cognitive uncertainty, providing an alternative approach to capturing the uncertainty inherent in expert knowledge.
Acknowledgement: None.
Funding Statement: The authors received no specific funding for this study.
Author Contributions: The authors confirm contribution to the paper as follows: study conception and design: Anastasios Dounis, Ioannis Palaiothodoros; data collection: Anastasios Dounis, Ioannis Palaiothodoros Anna Panagiotou; analysis and interpretation of results: Anastasios Dounis, Ioannis Palaiothodoros Anna Panagiotou; draft manuscript preparation: Anastasios Dounis, Ioannis Palaiothodoros. Anna Panagiotou. All authors reviewed the results and approved the final version of the manuscript.
Availability of Data and Materials: All data that support the findings of this study are included within the article.
Ethics Approval: Not applicable.
Conflicts of Interest: The authors declare no conflicts of interest to report regarding the present study.
References
1. Zadeh LA. Fuzzy sets. Inf Control. 1965;8(3):338–53. doi:10.1016/S0019-9958(65)90241-X. [Google Scholar] [CrossRef]
2. Adlassnig K-P. Fuzzy set theory in medicine. Laxenburg, Austria: Computer Science, Medicine; 1984. [Google Scholar]
3. Kaur J, Khehra BS, Singh A. Significance of fuzzy logic in the medical science. Singapore: Springer; 2022. p. 497–509. [Google Scholar]
4. Aydemir SB, Gunduz SY. A novel approach to multi-attribute group decision making based on power neutrality aggregation operator for q-rung orthopair fuzzy sets. Int J Intell Syst. 2021;36(3):1454–81. doi:10.1002/int.22350. [Google Scholar] [CrossRef]
5. Atanassov KT. Intuitionistic fuzzy sets. Fuzzy Sets Syst. 1986;20(1):87–96. doi:10.1016/S0165-0114(86)80034-3. [Google Scholar] [CrossRef]
6. Castillo O, Alanis A, Garcia M, Arias H. An intuitionistic fuzzy system for time series analysis in plant monitoring and diagnosis. Appl Soft Comput J. 2007;7(4):1227–33. doi:10.1016/j.asoc.2006.01.010. [Google Scholar] [CrossRef]
7. Yager RR. Pythagorean fuzzy subsets. In: 2013 Joint IFSA World Congress and NAFIPS Annual Meeting (IFSA/NAFIPS), 2013; Edmonton, AB, Canada: IEEE; p. 57–61. [Google Scholar]
8. Habib S, Akram M, Ali Al-Shamiri M. Comparative analysis of pythagorean MCDM methods for the risk assessment of childhood cancer. Comput Model Eng Sci. 2023;135(3):2585–615. doi:10.32604/cmes.2023.024551. [Google Scholar] [CrossRef]
9. Noor Abbasi S, Ashraf S, Shazib Hameed M, Eldin MS. Pythagorean fuzzy einstein aggregation operators with Z-numbers: application in complex decision aid systems. Comput Model Eng Sci. 2023;137:2795–844. doi:10.32604/cmes.2023.028963. [Google Scholar] [CrossRef]
10. Dounis A, Avramopoulos A-N, Kallergi M. Advanced fuzzy sets and genetic algorithm optimizer for mammographic image enhancement. Electronics. 2023;12:3269. doi:10.3390/electronics12153269. [Google Scholar] [CrossRef]
11. Dounis A, Avramopoulos A-N, Kallergi M. Hybrid intelligent pattern recognition systems for mass segmentation and classification: a pilot study on full-field digital mammograms. Appl Sci. 2023;13:10401. doi:10.3390/app131810401. [Google Scholar] [CrossRef]
12. Senapati T, Yager RR. Fermatean fuzzy sets. J Ambient Intell Humaniz Comput. 2020;11:663–74. doi:10.1007/s12652-019-01377-0. [Google Scholar] [CrossRef]
13. Gurmani SH, Zhang Z, Zulqarnain RM, Askar S. An interaction and feedback mechanism-based group decision-making for emergency medical supplies supplier selection using T-spherical fuzzy information. Sci Rep. 2023;13:8726. doi:10.1038/s41598-023-35909-8. [Google Scholar] [PubMed] [CrossRef]
14. Yager RR. Generalized orthopair fuzzy sets. IEEE Trans Fuzzy Syst. 2017;25(5):1222–30. doi:10.1109/TFUZZ.2016.2604005. [Google Scholar] [CrossRef]
15. Peng X, Luo Z. A review of q-rung orthopair fuzzy information: bibliometrics and future directions. Artif Intell Rev. 2021;54(5):3361–430. doi:10.1007/s10462-020-09926-2. [Google Scholar] [CrossRef]
16. Dounis A, Stefopoulos A. Intelligent medical diagnosis reasoning using composite fuzzy relation, aggregation operators and similarity measure of q-rung orthopair fuzzy sets. Appl Sci. 2023;13(23):12553. doi:10.3390/app132312553. [Google Scholar] [CrossRef]
17. Joshi BP, Singh A, Bhatt PK, Vaisla KS. Interval valued q-rung orthopair fuzzy sets and their properties. J Intell Fuzz Syst. 2018;35(5):5225–30. doi:10.3233/JIFS-169806. [Google Scholar] [CrossRef]
18. Li H, Yang Y, Zhang Y. Interval-valued q-rung orthopair fuzzy weighted geometric aggregation operator and its application to multiple criteria decision-making. In: SOSE 2020—IEEE 15th International Conference of System of Systems Engineering (SoSE), 2020; Budapest, Hungary; pp. 429–32. [Google Scholar]
19. Zaitseva E, Levashenko V, Rabcan J, Kvassay M. A new fuzzy-based classification method for use in smart/precision medicine. Bioengineering. 2023;10(7):838. doi:10.3390/bioengineering10070838. [Google Scholar] [PubMed] [CrossRef]
20. Zaitseva E, Rabcan J, Levashenko V, Kvassay M. Importance analysis of decision making factors based on fuzzy decision trees. Appl Soft Comput. 2023;134(3):109988. doi:10.1016/j.asoc.2023.109988. [Google Scholar] [CrossRef]
21. Mesiar R, Borkotokey S, Jin L, Kalina M. Aggregation under uncertainty. IEEE Trans Fuzzy Syst. 2018;26(4):2475–8. doi:10.1109/TFUZZ.2017.2756828. [Google Scholar] [CrossRef]
22. Jin L, Mesiar R, Borkotokey S, Kalina M. Certainty aggregation and the certainty fuzzy measures. Int J Intell Syst. 2018;33(4):759–70. doi:10.1002/int.21961. [Google Scholar] [CrossRef]
23. Jin LS, Yager RR, Ma C, Lopez LM, Rodríguez RM, Senapati T, et al. Intuitionistic fuzzy type basic uncertain information. Iran J Fuzz Syst. 2023;20:189–97. doi:10.22111/ijfs.2023.7840. [Google Scholar] [CrossRef]
24. Liu P, Liu P, Wang P, Zhu B. An extended multiple attribute group decision making method based on q-rung orthopair fuzzy numbers. IEEE Access. 2019;7:162050–61. doi:10.1109/ACCESS.2019.2951357. [Google Scholar] [CrossRef]
25. Mukund Deshpande N, Gite S, Pradhan B, Ebraheem Assiri M. Explainable artificial intelligence-a new step towards the trust in medical diagnosis with AI frameworks: a review. Comput Model Eng Sci. 2022;133:843–72. doi:10.32604/cmes.2022.021225. [Google Scholar] [CrossRef]
26. Ejegwa PA. Decision-making on patients’ medical status based on a q-rung orthopair fuzzy max-min-max composite relation. In: q-rung orthopair fuzzy sets. Singapore: Springer Nature Singapore; 2022. p. 47–66. [Google Scholar]
27. Ejegwa PA. Improved composite relation for pythagorean fuzzy sets and its application to medical diagnosis. Granul Comput. 2020;5:277–86. doi:10.1007/s41066-019-00156-8. [Google Scholar] [CrossRef]
28. Sharline JU. Impact of fuzzy logic and its applications in medicine: a review. Int J Stat Appl Math. 2022;7:20–7. [Google Scholar]
29. Ngan RT, Ali M, Son LH. δ-equality of intuitionistic fuzzy sets: a new proximity measure and applications in medical diagnosis. Appl Intell. 2018;48:499–525. doi:10.1007/s10489-017-0986-0. [Google Scholar] [CrossRef]
30. Szmidt E, Kacprzyk J. Intuitionistic fuzzy sets in intelligent data analysis for medical diagnosis. In: Alexandrov VN, Dongarra JJ, Juliano BA, Renner RS, Tan CJK, editors. Computational science. 2001. vol. 2074, p. 263–71. [Google Scholar]
31. Razzaque H, Ashraf S, Kallel W, Naeem M, Sohail M. A strategy for hepatitis diagnosis by using spherical $ q $-linear Diophantine fuzzy Dombi aggregation information and the VIKOR method. AIMS Math. 2023;8:14362–98. doi:10.3934/math.2023735. [Google Scholar] [CrossRef]
32. Naeem K, Riaz M, Karaaslan F. A mathematical approach to medical diagnosis via Pythagorean fuzzy soft TOPSIS, VIKOR and generalized aggregation operators. Complex Intell Syst. 2021;7(5):2783–95. doi:10.1007/s40747-021-00458-y. [Google Scholar] [CrossRef]
33. Ashraf S, Batool B, Naeem M. Novel decision making methodology under pythagorean probabilistic hesitant fuzzy einstein aggregation information. Comput Model Eng Sci. 2023;136(2):1785–811. doi:10.32604/cmes.2023.024851. [Google Scholar] [CrossRef]
34. Wang J, Gao H, Wei G, Wei Y. Methods for multiple-attribute group decision making with q-rung interval-valued orthopair fuzzy information and their applications to the selection of green suppliers. Symmetry. 2019;11(1):56. doi:10.3390/sym11010056. [Google Scholar] [CrossRef]
35. Ju Y, Luo C, Ma J, Gao H, Santibanez Gonzalez EDR, Wang A. Some interval-valued q-rung orthopair weighted averaging operators and their applications to multiple-attribute decision making. Int J Intell Syst. 2019;34(10):2584–606. doi:10.1002/int.22163. [Google Scholar] [CrossRef]
36. Wei G, Lu M, Gao H. Picture fuzzy heronian mean aggregation operators in multiple attribute decision making. Int J Knowl Based Intell Eng Syst. 2018;22(3):167–75. doi:10.3233/KES-180382. [Google Scholar] [CrossRef]
37. Lin M, Li X, Chen R, Fujita H, Lin J. Picture fuzzy interactional partitioned Heronian mean aggregation operators: an application to MADM process. Artif Intell Rev. 2022;55:1171–208. doi:10.1007/s10462-021-09953-7. [Google Scholar] [CrossRef]
38. Hussain A, Ullah K, Latif S, Senapati T, Moslem S, Esztergar-Kiss D. Decision algorithm for educational institute selection with spherical fuzzy heronian mean operators and Aczel-Alsina triangular norm. Heliyon. 2024;10:e28383. doi:10.1016/j.heliyon.2024.e28383. [Google Scholar] [PubMed] [CrossRef]
39. Albahri AS, Hamid RA, Albahri OS, Zaidan AA. Detection-based prioritisation: framework of multi-laboratory characteristics for asymptomatic COVID-19 carriers based on integrated Entropy-TOPSIS methods. Artif Intell Med. 2021;111:101983. doi:10.1016/j.artmed.2020.101983. [Google Scholar] [PubMed] [CrossRef]
40. Liang Z, Shi P. Similarity measures on intuitionistic fuzzy sets. Pattern Recognit Lett. 2003;24:2687–93. [Google Scholar]
41. Szmidt E, Kacprzyk J. A similarity measure for intuitionistic fuzzy sets and its application in supporting medical diagnostic reasoning. In: Rutkowski L, Siekmann JH, Tadeusiewicz R, Zadeh LA, editors. Artificial intelligence and soft computing. 2004. vol. 3070, p. 388–93. [Google Scholar]
42. Chen S-M. A weighted fuzzy reasoning algorithm for medical diagnosis. Decis Support Syst. 1994;11:37–43. doi:10.1016/0167-9236(94)90063-9. [Google Scholar] [CrossRef]
43. Wang W-J. New similarity measures on fuzzy sets and on elements. Fuzzy Sets Syst. 1997;85(3):305–9. doi:10.1016/0165-0114(95)00365-7. [Google Scholar] [CrossRef]
44. Atanassov KT. Remarks on the intuitionistic fuzzy sets—III. Fuzzy Sets Syst. 1995;75(3):401–2. doi:10.1016/0165-0114(95)00004-5. [Google Scholar] [CrossRef]
45. Wei G, Wei Y. Similarity measures of Pythagorean fuzzy sets based on the cosine function and their applications. Int J Intell Syst. 2018;33(3):634–52. doi:10.1002/int.21965. [Google Scholar] [CrossRef]
46. Ye J. Cosine similarity measures for intuitionistic fuzzy sets and their applications. Math Comput Model. 2011;53(1–2):91–7. doi:10.1016/j.mcm.2010.07.022. [Google Scholar] [CrossRef]
47. Muthukumar P, Sai Sundara Krishnan G. A similarity measure of intuitionistic fuzzy soft sets and its application in medical diagnosis. Appl Soft Comput. 2016;41(1):148–56. doi:10.1016/j.asoc.2015.12.002. [Google Scholar] [CrossRef]
48. Iancu I. Intuitionistic fuzzy similarity measures based on Frank t-norms family. Pattern Recognit Lett. 2014;42(1):128–36. doi:10.1016/j.patrec.2014.02.010. [Google Scholar] [CrossRef]
49. Zeng S, Hu Y, Xie X. Q-rung orthopair fuzzy weighted induced logarithmic distance measures and their application in multiple attribute decision making. Eng Appl Artif Intell. 2021;100(7):104167. doi:10.1016/j.engappai.2021.104167. [Google Scholar] [CrossRef]
50. Seker S, Bağlan FB, Aydin N, Deveci M, Ding W. Risk assessment approach for analyzing risk factors to overcome pandemic using interval-valued q-rung orthopair fuzzy decision making method. Appl Soft Comput. 2023;132(1):109891. doi:10.1016/j.asoc.2022.109891. [Google Scholar] [PubMed] [CrossRef]
51. Wang Y, Hussain A, Mahmood T, Ali MI, Wu H, Jin Y. Decision-making based on q-rung orthopair fuzzy soft rough sets. Math Probl Eng. 2020;2020(1):1–21. doi:10.1155/2020/6671001. [Google Scholar] [CrossRef]
52. Jin LS, Yager RR, Chen Z-S, Mesiar M, Bustince H. Unsymmetrical basic uncertain information with some decision-making methods. J Intell Fuzz Syst. 2022;43(4):4457–63. doi:10.3233/JIFS-220593. [Google Scholar] [CrossRef]
53. Zhang D, Wang G. Q-rung orthopair fuzzy decision-making method of multi-source information based on the compression mapping and inverse score function. Expert Syst Appl. 2024;242(3):122574. doi:10.1016/j.eswa.2023.122574. [Google Scholar] [CrossRef]
54. Wang P, Wang J, Wei G, Wei C. Similarity measures of q-rung orthopair fuzzy sets based on cosine function and their applications. Mathematics. 2019;7(4):340. doi:10.3390/math7040340. [Google Scholar] [CrossRef]
55. Farhadinia B, Effati S, Chiclana F. A family of similarity measures for q-rung orthopair fuzzy sets and their applications to multiple criteria decision making. Int J Intell Syst. 2021;36(4):1535–59. doi:10.1002/int.22351. [Google Scholar] [CrossRef]
56. Peng X, Liu L. Information measures for q-rung orthopair fuzzy sets. Int J Intell Syst. 2019;34(8):1795–834. doi:10.1002/int.22115. [Google Scholar] [CrossRef]
57. Rotterová P, Pavlačka O. New approach to fuzzy decision matrices. Acta Polytechnica Hung. 2017;14(5):85–102. doi:10.12700/APH.14.5.2017.5.6. [Google Scholar] [CrossRef]
58. Gul M, Guneri AF. A fuzzy multi criteria risk assessment based on decision matrix technique: a case study for aluminum industry. J Loss Prev Process Ind. 2016;40:89–100. doi:10.1016/j.jlp.2015.11.023. [Google Scholar] [CrossRef]
59. Lotfi FH, Fallahnejad R. Imprecise shannon’s entropy and multi attribute decision making. Entropy. 2010;12:53–62. doi:10.3390/e12010053. [Google Scholar] [CrossRef]
60. Singh P. A neutrosophic-entropy based adaptive thresholding segmentation algorithm: a special application in MR images of Parkinson’s disease. Artif Intell Med. 2020;104:101838. doi:10.1016/j.artmed.2020.101838. [Google Scholar] [PubMed] [CrossRef]
61. Beliakov G, Ana P, Tomasa C. Aggregation functions: a guide for practitioners. Berlin, Heidelberg, Berlin Heidelberg: Springer; 2007. [Google Scholar]
62. Grabisch M, Marichal J-L, Mesiar R, Pap E. Aggregation functions. New York, USA: Cambridge University Press; 2009. [Google Scholar]
63. Garg H, Chen SM. Multiattribute group decision making based on neutrality aggregation operators of q-rung orthopair fuzzy sets. Inf Sci. 2020;517:427–47. doi:10.1016/j.ins.2019.11.035. [Google Scholar] [CrossRef]
64. De SK, Biswas R, Roy AR. An application of intuitionistic fuzzy sets in medical diagnosis. Fuzzy Sets Syst. 2001;117:209–13. doi:10.1016/S0165-0114(98)00235-8. [Google Scholar] [CrossRef]
65. Ali R, Lee S, Chung TC. Accurate multi-criteria decision making methodology for recommending machine learning algorithm. Expert Syst Appl. 2017;71:257–78. doi:10.1016/j.eswa.2016.11.034. [Google Scholar] [CrossRef]
66. Liu P, Diao H, Zou L, Deng A. Uncertain multi-attribute group decision making based on linguistic-valued intuitionistic fuzzy preference relations. Inf Sci. 2020;508:293–308. doi:10.1016/j.ins.2019.08.076. [Google Scholar] [CrossRef]
67. Zadeh LA. Toward a generalized theory of uncertainty (GTU)––an outline. Inf Sci. 2005;172:1–40. doi:10.1016/j.ins.2005.01.017. [Google Scholar] [CrossRef]
68. Klir GJ, Bo Y. Fuzzy sets and fuzzy logic: theory and applications. Upper Saddle River, New Jersey: Prentice Hall of India; 2003. [Google Scholar]
69. Mendel JM. Uncertain rule-based fuzzy logic systems: introduction and new directions. Upper Saddle River, NJ, USA: Prentice-Hall; 2001. [Google Scholar]
70. Mendel JM. Computing with words, when words can mean different things to different people. In: Proceedings of Third International ICSC Symposium on Fuzzy Logic and Applications, 1999; Rochester, NY: Rochester University. [Google Scholar]
71. Hofmann B. Vagueness in medicine: on disciplinary indistinctness, fuzzy phenomena, vague concepts, uncertain knowledge, and fact-value-interaction. Axiomathes. 2022;32:1151–68. doi:10.1007/s10516-021-09573-4. [Google Scholar] [CrossRef]
72. Zhou Q, Mo H, Deng Y. A new divergence measure of pythagorean fuzzy sets based on belief function and its application in medical diagnosis. Mathematics. 2020;8:142. doi:10.3390/math8010142. [Google Scholar] [CrossRef]
73. Maheshwari S, Srivastava A. Study on divergence measures for intuitionistic fuzzy sets and its application in medical diagnosis. J Appl Analy Comput. 2016;6(3):772–89. doi:10.11948/2016050. [Google Scholar] [CrossRef]
74. Samuel E, Rajakumar S. Intuitionistic fuzzy sets in medical diagnosis. Int J Pure Appl Math. 2018;120:129–35. [Google Scholar]
Appendix A

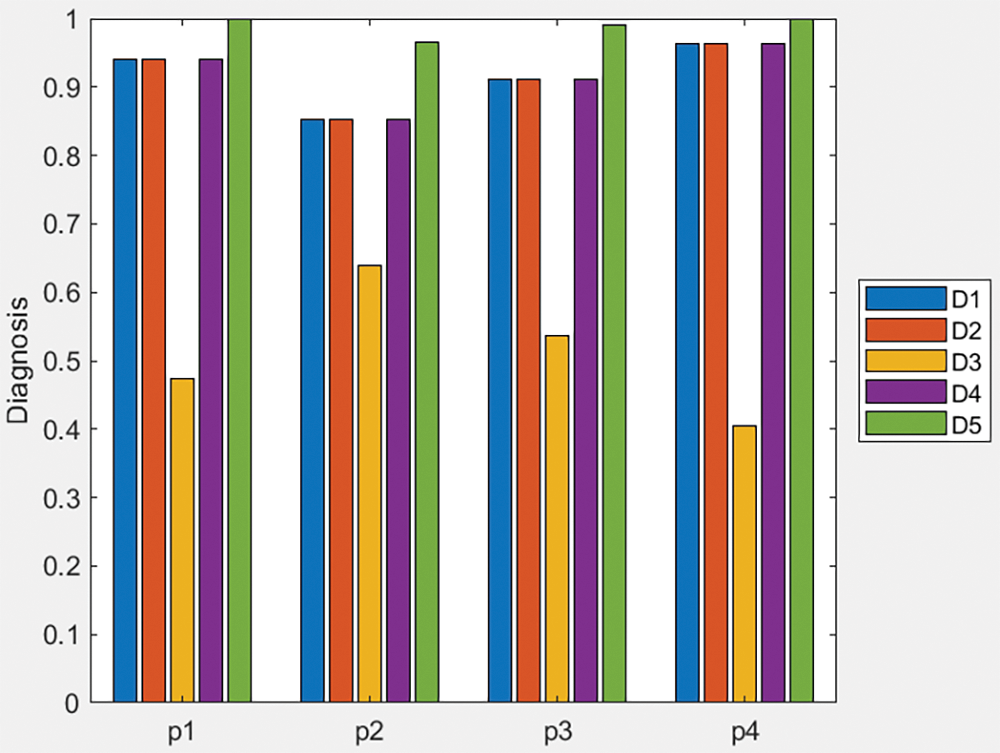
Figure A1: Bar plot of similarity measure values of Table 3 data and q-ROFWA operator

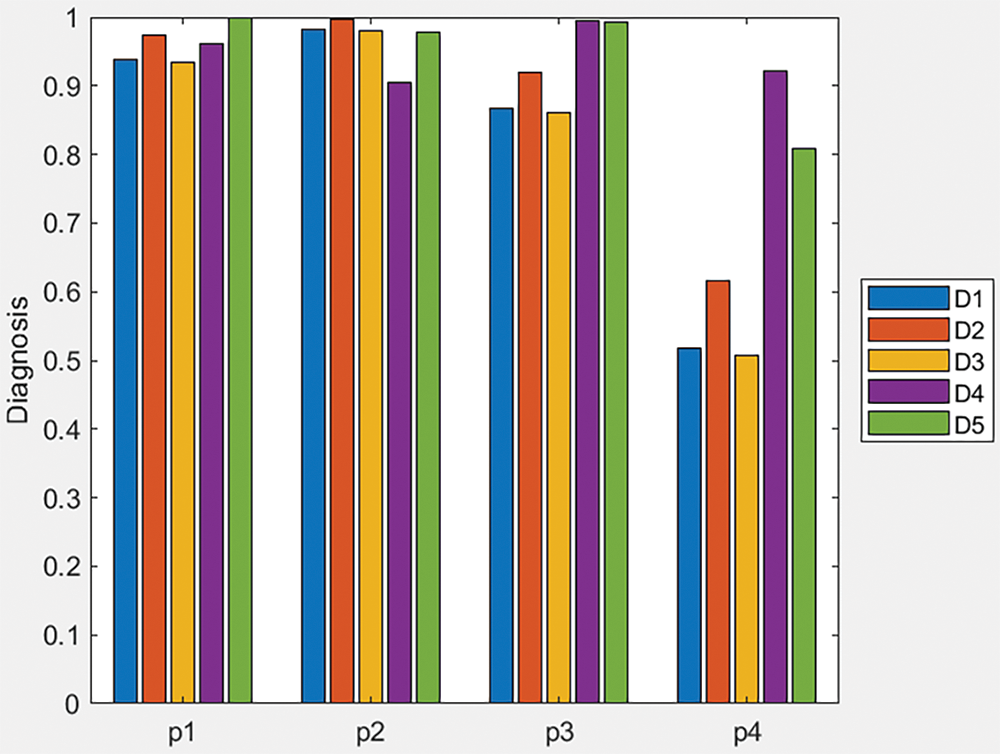
Figure A2: Bar plot of similarity measure values of Table 3 data and q-ROFWNA operator

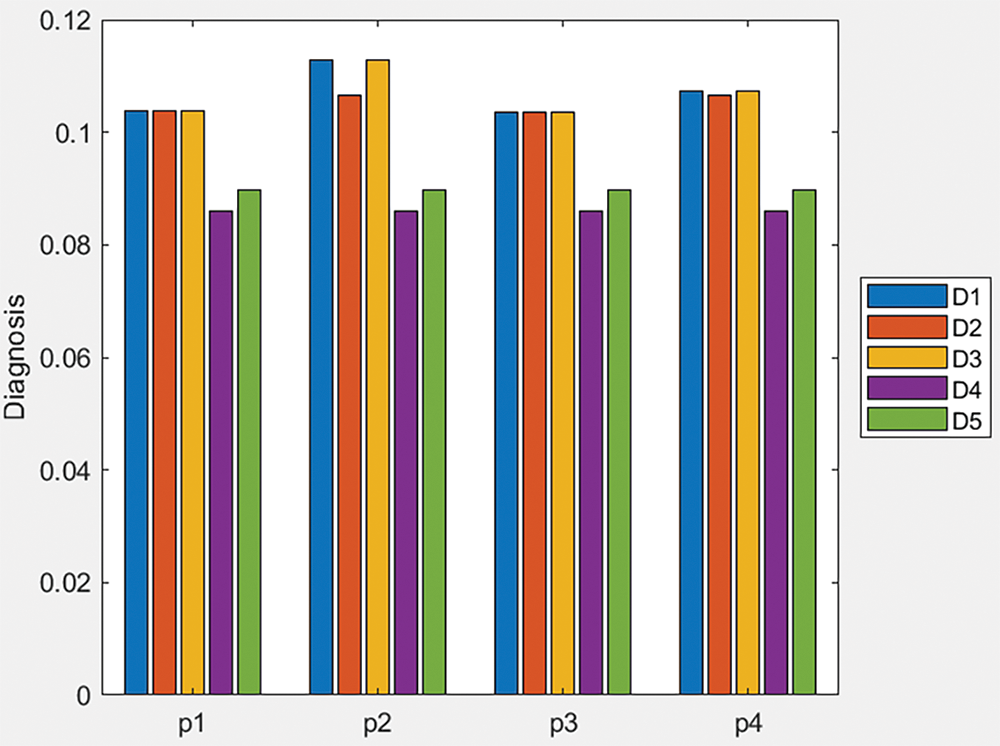
Figure A3: Bar plot of score values of Table 3 data and q-ROFWA operator

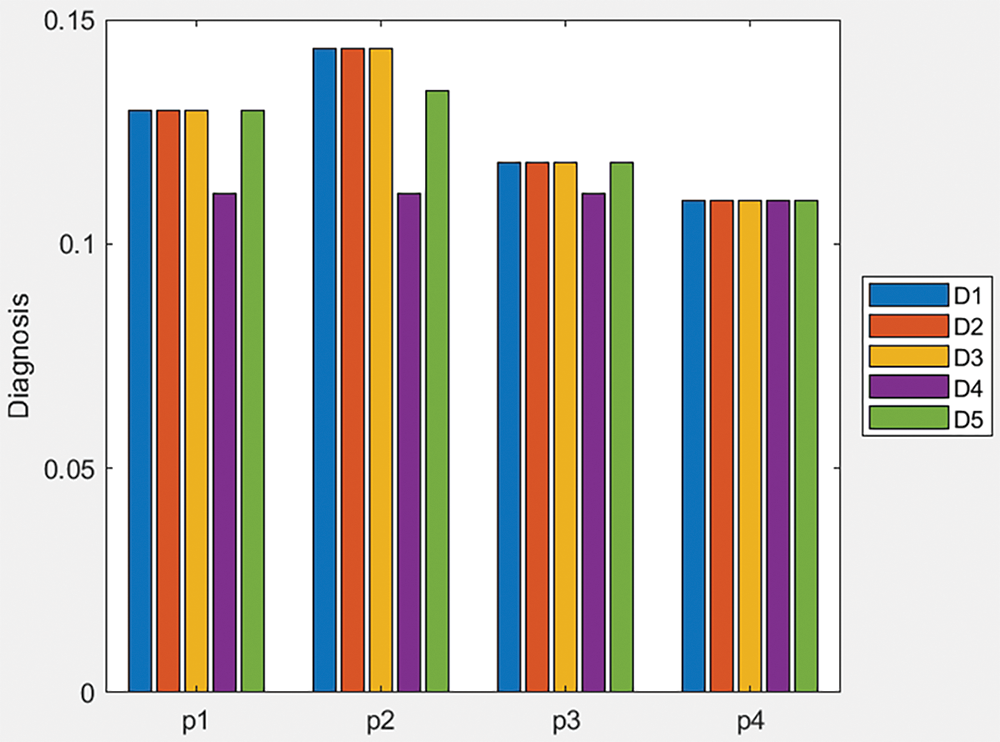
Figure A4: Bar plot of score values of Table 3 data and q-ROFWNA operator
Cite This Article
 Copyright © 2025 The Author(s). Published by Tech Science Press.
This work is licensed under a Creative Commons Attribution 4.0 International License , which permits unrestricted use, distribution, and reproduction in any medium, provided the original work is properly cited.


 Submit a Paper
 Propose a Special lssue
 View Full Text
 Download PDF
 Downloads
 Citation Tools