 Open Access
ARTICLE
Multi-Step Clustering of Smart Meters Time Series: Application to Demand Flexibility Characterization of SME Customers
1 Department of Computer Sciences and Automatic Control, Universidad Nacional de Educación a Distancia (UNED), Madrid, 28040, Spain
2 Iberdrola Innovation Middle East, Doha, 210177, Qatar
* Corresponding Author: Santiago Bañales. Email:
(This article belongs to the Special Issue: Advanced Artificial Intelligence and Machine Learning Methods Applied to Energy Systems)
Computer Modeling in Engineering & Sciences 2025, 142(1), 869-907. https://doi.org/10.32604/cmes.2024.054946
Received 12 June 2024; Accepted 25 October 2024; Issue published 17 December 2024
Abstract
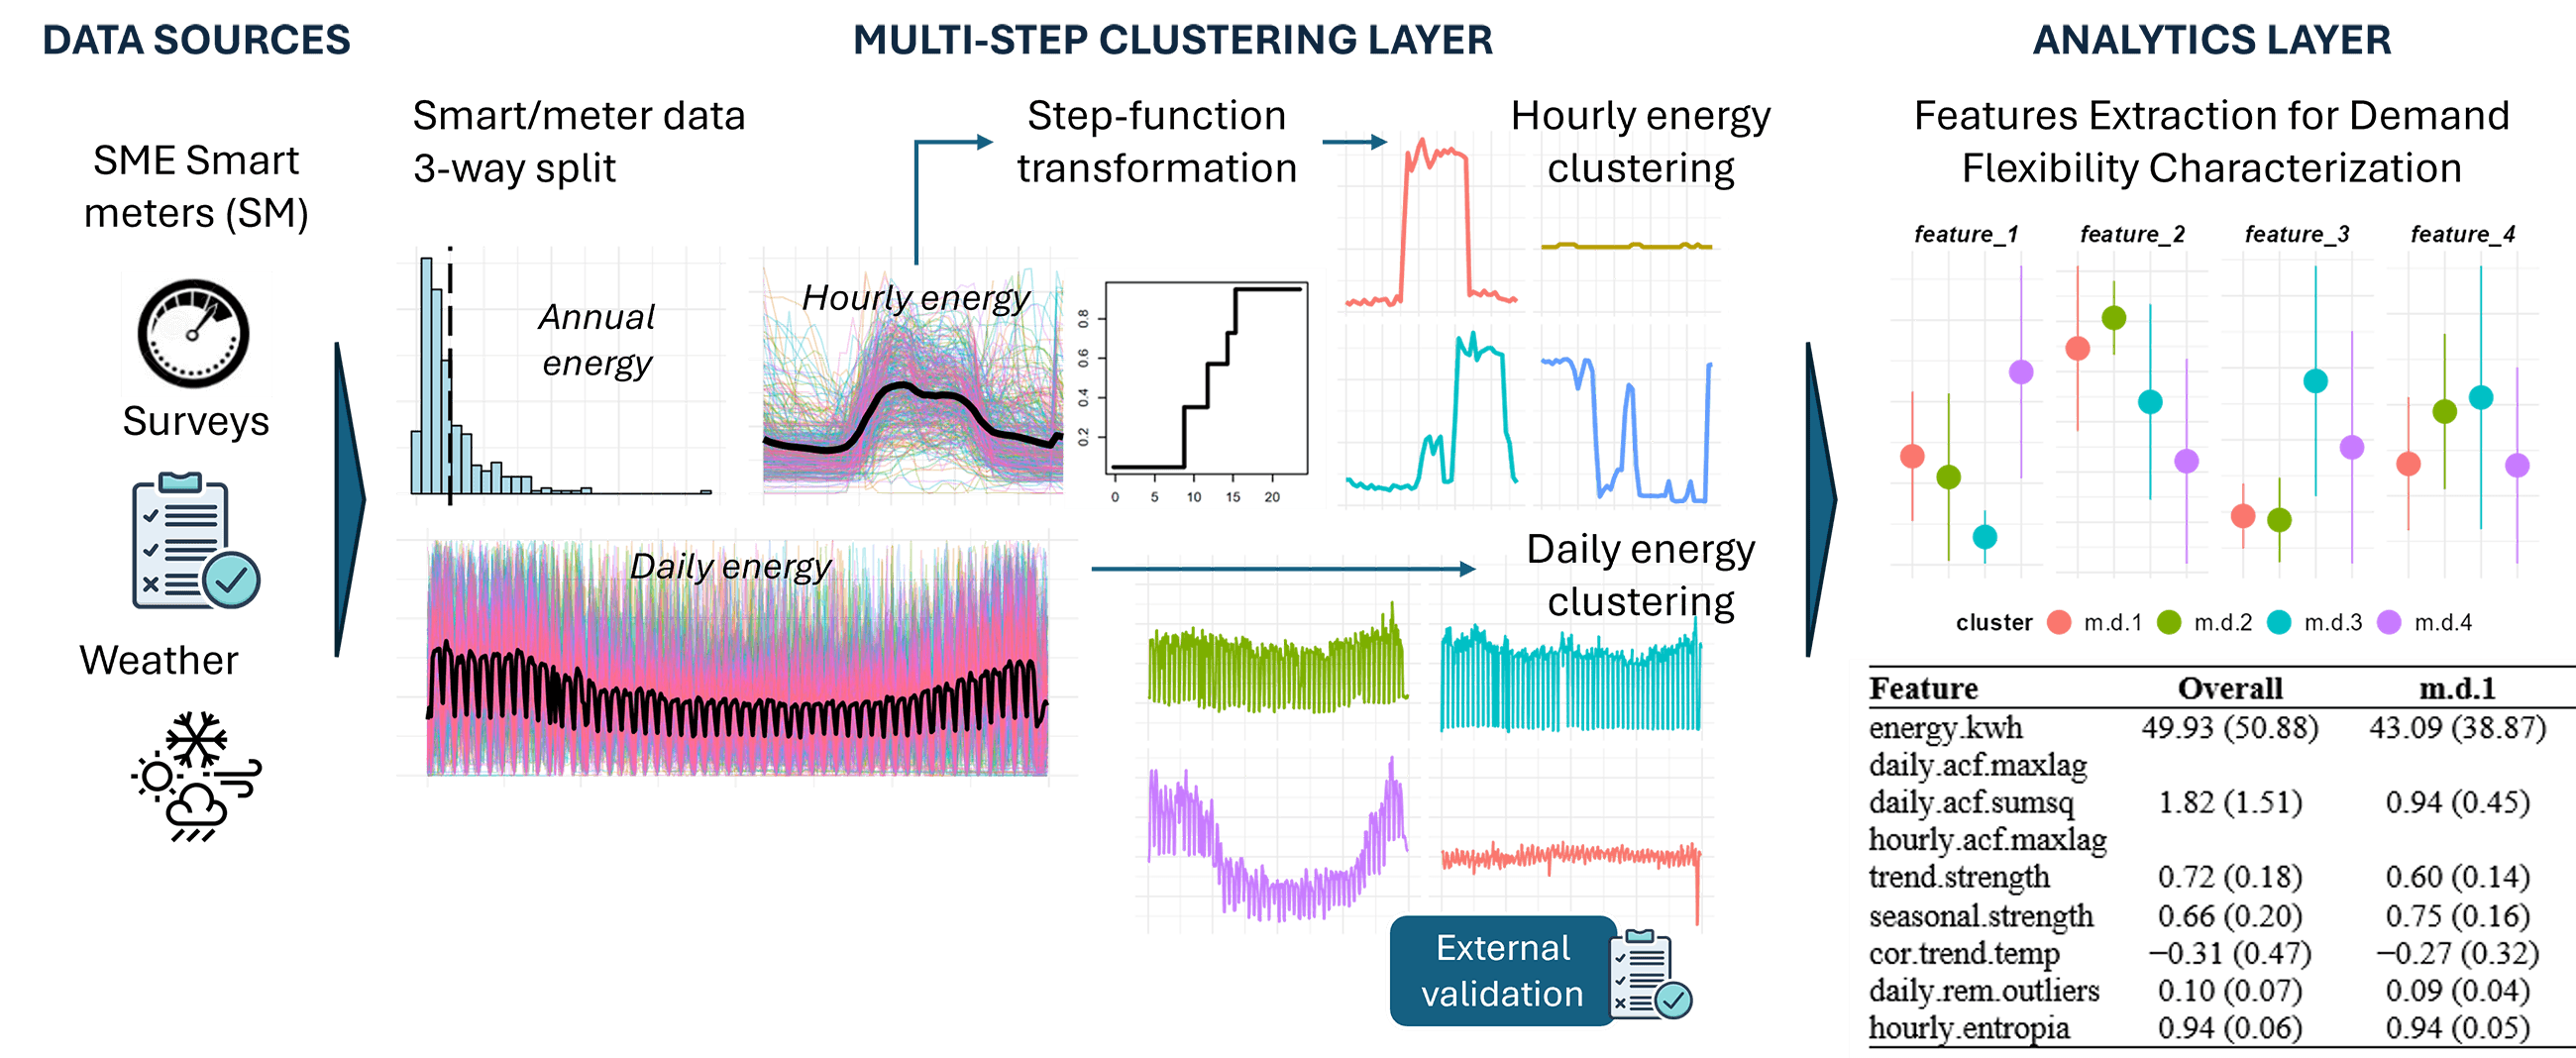
Customer segmentation according to load-shape profiles using smart meter data is an increasingly important application to vital the planning and operation of energy systems and to enable citizens’ participation in the energy transition. This study proposes an innovative multi-step clustering procedure to segment customers based on load-shape patterns at the daily and intra-daily time horizons. Smart meter data is split between daily and hourly normalized time series to assess monthly, weekly, daily, and hourly seasonality patterns separately. The dimensionality reduction implicit in the splitting allows a direct approach to clustering raw daily energy time series data. The intraday clustering procedure sequentially identifies representative hourly day-unit profiles for each customer and the entire population. For the first time, a step function approach is applied to reduce time series dimensionality. Customer attributes embedded in surveys are employed to build external clustering validation metrics using Cramer’s V correlation factors and to identify statistically significant determinants of load-shape in energy usage. In addition, a time series features engineering approach is used to extract 16 relevant demand flexibility indicators that characterize customers and corresponding clusters along four different axes: available Energy (E), Temporal patterns (T), Consistency (C), and Variability (V). The methodology is implemented on a real-world electricity consumption dataset of 325 Small and Medium-sized Enterprise (SME) customers, identifying 4 daily and 6 hourly easy-to-interpret, well-defined clusters. The application of the methodology includes selecting key parameters via grid search and a thorough comparison of clustering distances and methods to ensure the robustness of the results. Further research can test the scalability of the methodology to larger datasets from various customer segments (households and large commercial) and locations with different weather and socioeconomic conditions.Graphic Abstract

Keywords
Cite This Article
 Copyright © 2025 The Author(s). Published by Tech Science Press.
This work is licensed under a Creative Commons Attribution 4.0 International License , which permits unrestricted use, distribution, and reproduction in any medium, provided the original work is properly cited.


 Submit a Paper
 Propose a Special lssue
 View Full Text
 Download PDF
 Downloads
 Citation Tools