 Open Access
ARTICLE
LoRa Sense: Sensing and Optimization of LoRa Link Behavior Using Path-Loss Models in Open-Cast Mines
School of Computer Science and Engineering, VIT-AP University, Amaravati, 52237, India
* Corresponding Author: Prashanth Ragam. Email:
(This article belongs to the Special Issue: Computational Intelligent Systems for Solving Complex Engineering Problems: Principles and Applications-II)
Computer Modeling in Engineering & Sciences 2025, 142(1), 425-466. https://doi.org/10.32604/cmes.2024.052355
Received 30 March 2024; Accepted 01 July 2024; Issue published 17 December 2024
Abstract
The Internet of Things (IoT) has orchestrated various domains in numerous applications, contributing significantly to the growth of the smart world, even in regions with low literacy rates, boosting socio-economic development. This study provides valuable insights into optimizing wireless communication, paving the way for a more connected and productive future in the mining industry. The IoT revolution is advancing across industries, but harsh geometric environments, including open-pit mines, pose unique challenges for reliable communication. The advent of IoT in the mining industry has significantly improved communication for critical operations through the use of Radio Frequency (RF) protocols such as Bluetooth, Wi-Fi, GSM/GPRS, Narrow Band (NB)-IoT, SigFox, ZigBee, and Long Range Wireless Area Network (LoRaWAN). This study addresses the optimization of network implementations by comparing two leading free-spreading IoT-based RF protocols such as ZigBee and LoRaWAN. Intensive field tests are conducted in various opencast mines to investigate coverage potential and signal attenuation. ZigBee is tested in the Tadicherla open-cast coal mine in India. Similarly, LoRaWAN field tests are conducted at one of the associated cement companies (ACC) in the limestone mine in Bargarh, India, covering both Indoor-to-Outdoor (I2O) and Outdoor-to-Outdoor (O2O) environments. A robust framework of path-loss models, referred to as Free space, Egli, Okumura-Hata, Cost231-Hata and Ericsson models, combined with key performance metrics, is employed to evaluate the patterns of signal attenuation. Extensive field testing and careful data analysis revealed that the Egli model is the most consistent path-loss model for the ZigBee protocol in an I2O environment, with a coefficient of determination (R2) of 0.907, balanced error metrics such as Normalized Root Mean Square Error (NRMSE) of 0.030, Mean Square Error (MSE) of 4.950, Mean Absolute Percentage Error (MAPE) of 0.249 and Scatter Index (SI) of 2.723. In the O2O scenario, the Ericsson model showed superior performance, with the highest R2 value of 0.959, supported by strong correlation metrics: NRMSE of 0.026, MSE of 8.685, MAPE of 0.685, Mean Absolute Deviation (MAD) of 20.839 and SI of 2.194. For the LoRaWAN protocol, the Cost-231 model achieved the highest R2 value of 0.921 in the I2O scenario, complemented by the lowest metrics: NRMSE of 0.018, MSE of 1.324, MAPE of 0.217, MAD of 9.218 and SI of 1.238. In the O2O environment, the Okumura-Hata model achieved the highest R2 value of 0.978, indicating a strong fit with metrics NRMSE of 0.047, MSE of 27.807, MAPE of 27.494, MAD of 37.287 and SI of 3.927. This advancement in reliable communication networks promises to transform the opencast landscape into networked signal attenuation. These results support decision-making for mining needs and ensure reliable communications even in the face of formidable obstacles.Keywords
The process of extracting minerals and materials from the earth is called mining, and India is fortunate to have 3100 mines scattered across various states. Based on the Indian Ministry of Mines, these mines contribute 2.5%–3.5% to the country’s GDP [1]. In addition, India earns a substantial income from the export of minerals abroad, which helps the country’s economy reach the five trillion-dollar mark. This growth is partly due to rapid industrialization and infrastructure development. The mining industry plays a crucial role in promoting socio-economic development on a global scale. In India, this industry is overseen by the Ministry of Mines, which issues government orders, permits, leases mines, levies taxes, and imposes fines for illegal mining activities. Most mines are located in remote regions and provide significant employment opportunities, particularly for tribal communities. The mining industry’s influence goes far beyond the extraction of raw materials. It has a far-reaching impact on other sectors, such as transportation, construction, and equipment manufacturing. The industry employs professionals in various fields, including engineers, technicians, and administrators, contributing to economic growth. Mining is a process that involves several phases, each with its challenges and hazards. Mining companies must overcome many hurdles, from pre-processing to post-processing to end-product delivery. Historically, mining has posed significant risks to those who work in the mines, as evidenced by past accidents. Deepening mines increases the likelihood of water, chemical, or flammable gas intrusion. The process of previous excavations can also affect the stability of mine roofs, leading to potential collapses. These problems require preventative measures to protect employees and the surrounding communities. A list of abbreviations used throughout the manuscript is included in Table 1.

Drilling in mines began as early as 1960 with the first generation of drilling rigs [2]. This initial phase of mining was associated with many challenges. In the absence of advanced equipment, blasting was often done with explosives [3], causing environmental pollution [4,5] and physical damage to the surrounding areas [6]. The resulting ground shaking [7] can affect the health of nearby populations, and communication is often non-existent, leaving miners unable to respond quickly to emergencies. This lack of communication and inadequate safety precautions lead to lost production and significant damage. The real upturn in mining began with the introduction of basic automation. This allowed for improvements in various phases of mining, including safety, communication, and production. Modern machinery produces higher production with fewer workers and improved safety measures. However, wireless communication in mining still faces many challenges. Dealing with harsh environments is made possible by sensors that monitor high temperatures, humidity, and dust, and accordingly, through automatic oxygen delivery bottles. This real-time communication improves worker safety, reduces the risk of accidents, and provides emergency alerts. Asset tracking and vehicle management are facilitated to locate and monitor production. Due to the advancement of wireless technology, everyone benefits by optimizing the process and reducing risks on both sides. As safety increases, production also improves. However, wireless communication faces several challenges [8], from planning to execution. As the IoT is growing rapidly, unifying advanced communication in the mining industry remains a challenge. Various wireless communication protocols are used in mining, starting with RF, Bluetooth, Wi-Fi, and NB-IoT, some of which are licensed, and others are free in the Industrial, Scientific, and Medical (ISM) band. As mines must cover large areas, these devices can only cover a minimal area. The power supply inside the mines is also a challenge, so they cannot be operated over a long period. Due to the appearance of mines, the harsh environment, and other obstacles, continuous wireless communication is difficult.
The advanced IoT [9] has significantly impacted the simplification of each solution step [10] in various ways, such as getting the results within the specified time. For reusability or updating, it can access services remotely from any place, and at any time, installation costs are reduced, and less technical knowledge is required to interact with the devices. Due to all these benefits, IoT has rapidly grown in almost all application areas, including healthcare [11,12], military, agriculture [13,14], industry [15], transportation [16,17], mining, manufacturing, smart cities [18,19], smart grids [20,21], remote environmental monitoring [22], search and rescue applications [23], fire detection [24], underwater [25], and satellite communications [26]. The advances in various technologies make IoT a breakthrough technology for a new level of novel applications ranging from improved security to higher energy efficiency and personalized experiences. For its tremendous growth and adoption, IoT, as a revolutionary trend in wireless network infrastructure [27], plays a vital role in virtually connecting devices and sensors with the Low Power Wide Area Network (LPWAN) [28,29], which supports long distances [30,31] at low cost, which is enabled by IoT. Fig. 1a illustrates the various applications of IoT, and Fig. 1b shows the interactions between the IoT modules.
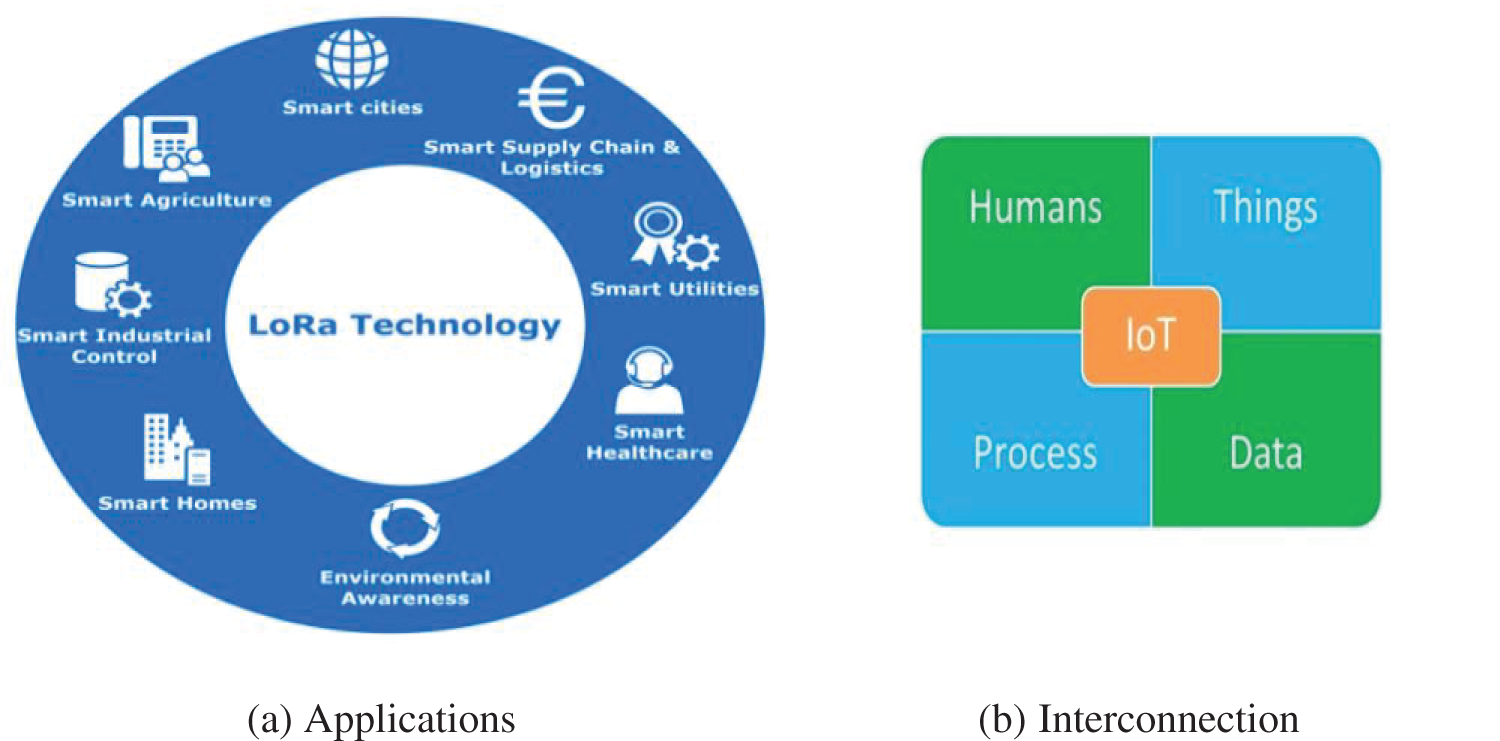
Figure 1: IoT Applications and Interconnections interaction framework
The IoT connects different things, such as data, processes, and people. It begins by collecting and analyzing the data to take immediate action [32]. Different elements of the IoT process are used in all application services [33,34] to fulfill their task. It contains sensors to collect data such as temperature, gas, and humidity, which are forwarded to the network. Then, actuators or devices take commands to perform the desired actions, such as controlling the room temperature or turning the heater on and off. Gateways are employed to connect sensors and devices to the cloud. Different network protocols are used for communication between the devices and the cloud, depending on the technology or manufacturer. The cloud platform supports the development and deployment of IoT applications [35,36]. It processes data locally on its edge computing systems, which include 202 × 5 computing systems. Tools are utilized for analysis to make decisions about data analytics. Unique features [37,38] and strengths are frequency coverage, data rate, power consumption, security, latency, compatibility, scalability, and reliability. Wireless protocols are the rules and standards for wireless devices to communicate with each other for various applications. These protocols allow devices to exchange data innovatively, making communication more accessible, efficient, and connected.
Table 2 lists an overview of the wireless protocols used in the IoT for various applications in wireless technology. The history of wireless technology is rich with innovative protocols. Emerging in the 1940s, RFID [39] utilized radio waves for object identification and tracking. The 1970s saw the introduction of infrared communication, enabling short-distance wireless data transmission for remote control. Radio Communication has a long history, dating back to the 19th century, facilitating long-distance signal transmission through the air. The 1990s witnessed a surge in wireless protocols. Bluetooth [40] emerged as a short-range communication solution for devices like cell phones. Alongside it came Wi-Fi [41], enabling high-speed data transfer between various electronic devices such as mobile phones and computers. The 2000s introduced ZigBee [42], a low-power, low-speed protocol for device communication in applications such as home automation. Near Field Communication (NFC) [43], introduced in the early 2000s, facilitates cashless transactions, data communication, and access control over short distances. LoRa, developed in 2009, established as a low-power Wide-Area Network LPWAN [44] technology for long-distance communication. The continuous advancement of these wireless protocols has revolutionized device communication, enabling reliable data exchange over an extended range for a broad spectrum of applications. The various protocols are mentioned below based on various parameters. Fig. 2 illustrates the critical enablers for classifying RF protocols [45] based on eight main characteristics crucial for enhancing IoT. These characteristics include closeness, which refers to how well the devices are positioned near one another, and power supply, which involves selecting an appropriate energy source for the technology. Data transfer plays a vital role, considering the quantity and frequency of data that must be transmitted. The range determines the signal’s coverage area according to the protocol specifications. Location features help identify the current position of the device. Tariff involves the cost, which can vary based on the selected protocol, usage, and equipment. Reachability enriches the signal quality in various scenarios, influenced by the proper hardware used, while protection ensures network security. These factors collectively decide the categorization and upliftment of IoT through RF protocols.
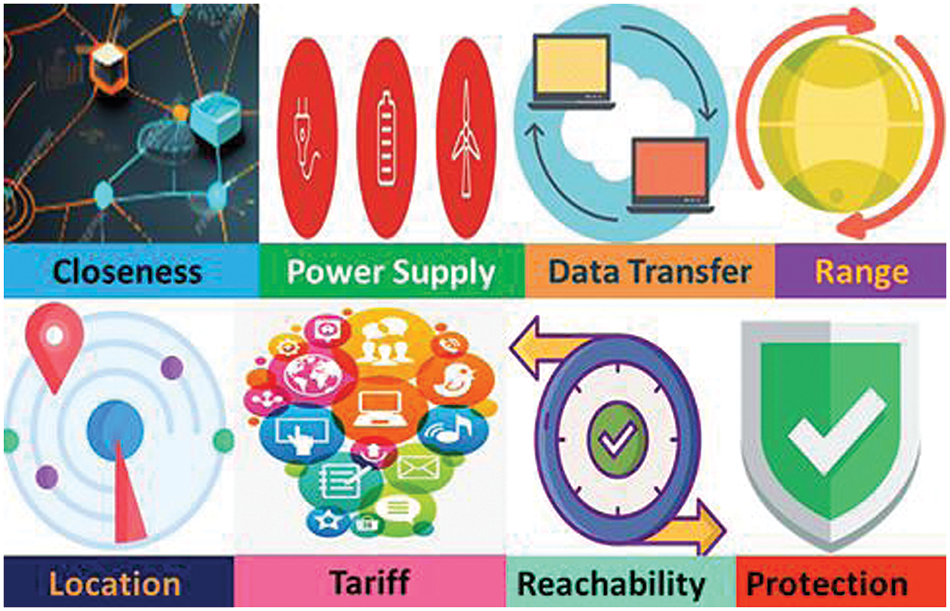
Figure 2: Key enablers for classifying RF protocols
1.1 Outline of ZigBee and LoRaWAN Protocols
This section provides an overview of ZigBee and LoRaWAN as dominant protocols in wireless technology that support various IoT applications. LoRaWAN provides long-range wireless coverage that supports long distances, lower power consumption, and longer battery life. On the other hand, ZigBee is optimized for short-range applications with low power consumption over short distances. Table 3 lists the critical differences between ZigBee and LoRa protocols, which operate under the free ISM band radio frequencies and allow users to build networks without relying on service providers or requiring licenses. These protocols overcome traditional RFID, Bluetooth, and Wi-Fi limitations, such as higher costs, limited range, and excessive power consumption. They also eliminate the need for service providers in remote locations. These issues can be mitigated by replacing older technologies with the low power consumption and short range of ZigBee and the long-range and security of LoRaWAN with minimal power consumption [48,49].
1.2 Motivations and Key Contributions
• This study focuses on optimizing network deployments for reliable communication driven by the limited understanding of ZigBee and LoRaWAN performance in the harsh and complex environments of mines, where traditional research often overlooks specific challenges. Inefficient network performance due to physical obstacles and unique propagation factors can lead to safety hazards and operational disruptions. In orde to address these shortcomings, this study conducts a comparative analysis of ZigBee and LoRaWAN in mining environments.
• This study is organized into different sections to comprehensively examine ZigBee and LoRaWAN and their performance in mining environments.
• Section 2 lays the foundation with a thorough analysis of existing ZigBee and LoRaWAN research in various applications such as smart metering, mining, and industrial environments.
• Section 3 presents experimental field tests of ZigBee performance in I2O and O2O mining environments and provides initial observations and comparisons.
• Section 4 extends the investigation and focuses exclusively on LoRaWAN in I2O and O2O mining environments, offering preliminary insights and comparative analyses.
• Section 5 establishes a robust framework for specific path-loss models, including Free space, Egli, Okumura-Hata, Cost231-Hata, and Ericsson models and performance metrics that apply to both ZigBee and LoRaWAN.
• Section 6 deals with interpreting the results through analysis and graphical representations, drawing a critical comparison between ZigBee and LoRaWAN to gain insights into their respective performance in these challenging environments.
• Section 7 summarizes the key findings from the path-loss modeling, the discussions, and their implications for optimizing ZigBee and LoRaWAN deployments in different mining scenarios.
• Section 8 summarizes the results of the ZigBee and LoRaWAN field tests and concludes the findings in mining environments in I2O and O2O scenarios. The evaluation includes various parameters, such as R2, NRMSE, MSE, MAPE, MAD, and SI, to determine the suitability of ZigBee and LoRaWAN for mining applications.
• Section 9 discusses the future scope of the research by extending the current results using machine learning algorithms for dynamic path-loss prediction. The goal is to make faster and more accurate predictions, enabling the development of simplified, customized communication solutions for mining.
Various RF protocols for IoT have been developed throughout history, including ZigBee and LoRaWAN. These protocols utilize the ISM band, freely available for establishing wireless communication between a transmitter and receiver. This section examines how they employ signal attenuation for different applications. Table 4 lists the primary uses of ZigBee and LoRaWAN protocols across various areas, highlighting their applications in IoT projects.
The extensive tables presented were intended to contextualize previous research on IoT-based protocols, particularly Zigbee and LoRa. These protocols were explored in various applications such as garden monitoring, vehicle speed control, and climate monitoring, with studies assessing factors like distance coverage in different environments such as I2O, O2O, I2I, and parameters like RSSI and SNR. This study builds upon this foundation by focusing specifically on applying Zigbee and LoRa protocols in mine environments, including both I2O and O2O scenarios. It extends the analysis beyond previous studies by incorporating additional performance metrics such as R2, NRMSE, SI, MAD, MAPE, and MSE. This research incorporates various performance models, including Free-space, Egli, Okumura-Hata, and Cost-231 Ericsson path-loss models. These additions aim to provide a more comprehensive understanding of the performance of Zigbee and LoRa protocols in challenging mining environments.
3 Performance Evaluation Test for ZigBee
The most prominent feature of an IoT-enabled network should focus on establishing connectivity among devices, as there are several protocols under the IoT sector, including Bluetooth, Wi-Fi, and ZigBee. All these protocols are facilitated with energy-efficient features. This section’s primary objective is to gain a deeper understanding of ZigBee network performance by conducting range tests using IEEE 802.155.4 ZigBee devices of the S2C series as transmitter and receiver which are manufactured by Digi International Inc, based in Hopkins, United States. This approach aims to evaluate performance in various environments, such as I2O and O2O, where the signal strength of ZigBee is observed in both rugged and clean areas, with and without interference.
3.1 Configuration of ZigBee Devices
The ZigBee devices are short-range protocols. To setup a ZigBee device, go to the configuration interface, select the operating mode as transmitter and receiver, and adjust parameters such as channel and address to the network configuration. Fig. 3 depicts coverage tests conducted using two S2C series ZigBee RF devices. One device was configured as a transmitter, and the other as a receiver. After setting the ZigBee devices, output parameters such as the RSSI (in dB) and SNR (in dB) are noted to ensure reliable communication. Both devices operate on a 2.4 GHz frequency band.

Figure 3: Configuration of ZigBee S2 series devices as Transmitter and Receiver
The following pseudo-code outlines the steps for configuring a ZigBee device to function in both roles: Transmitter and Receiver.
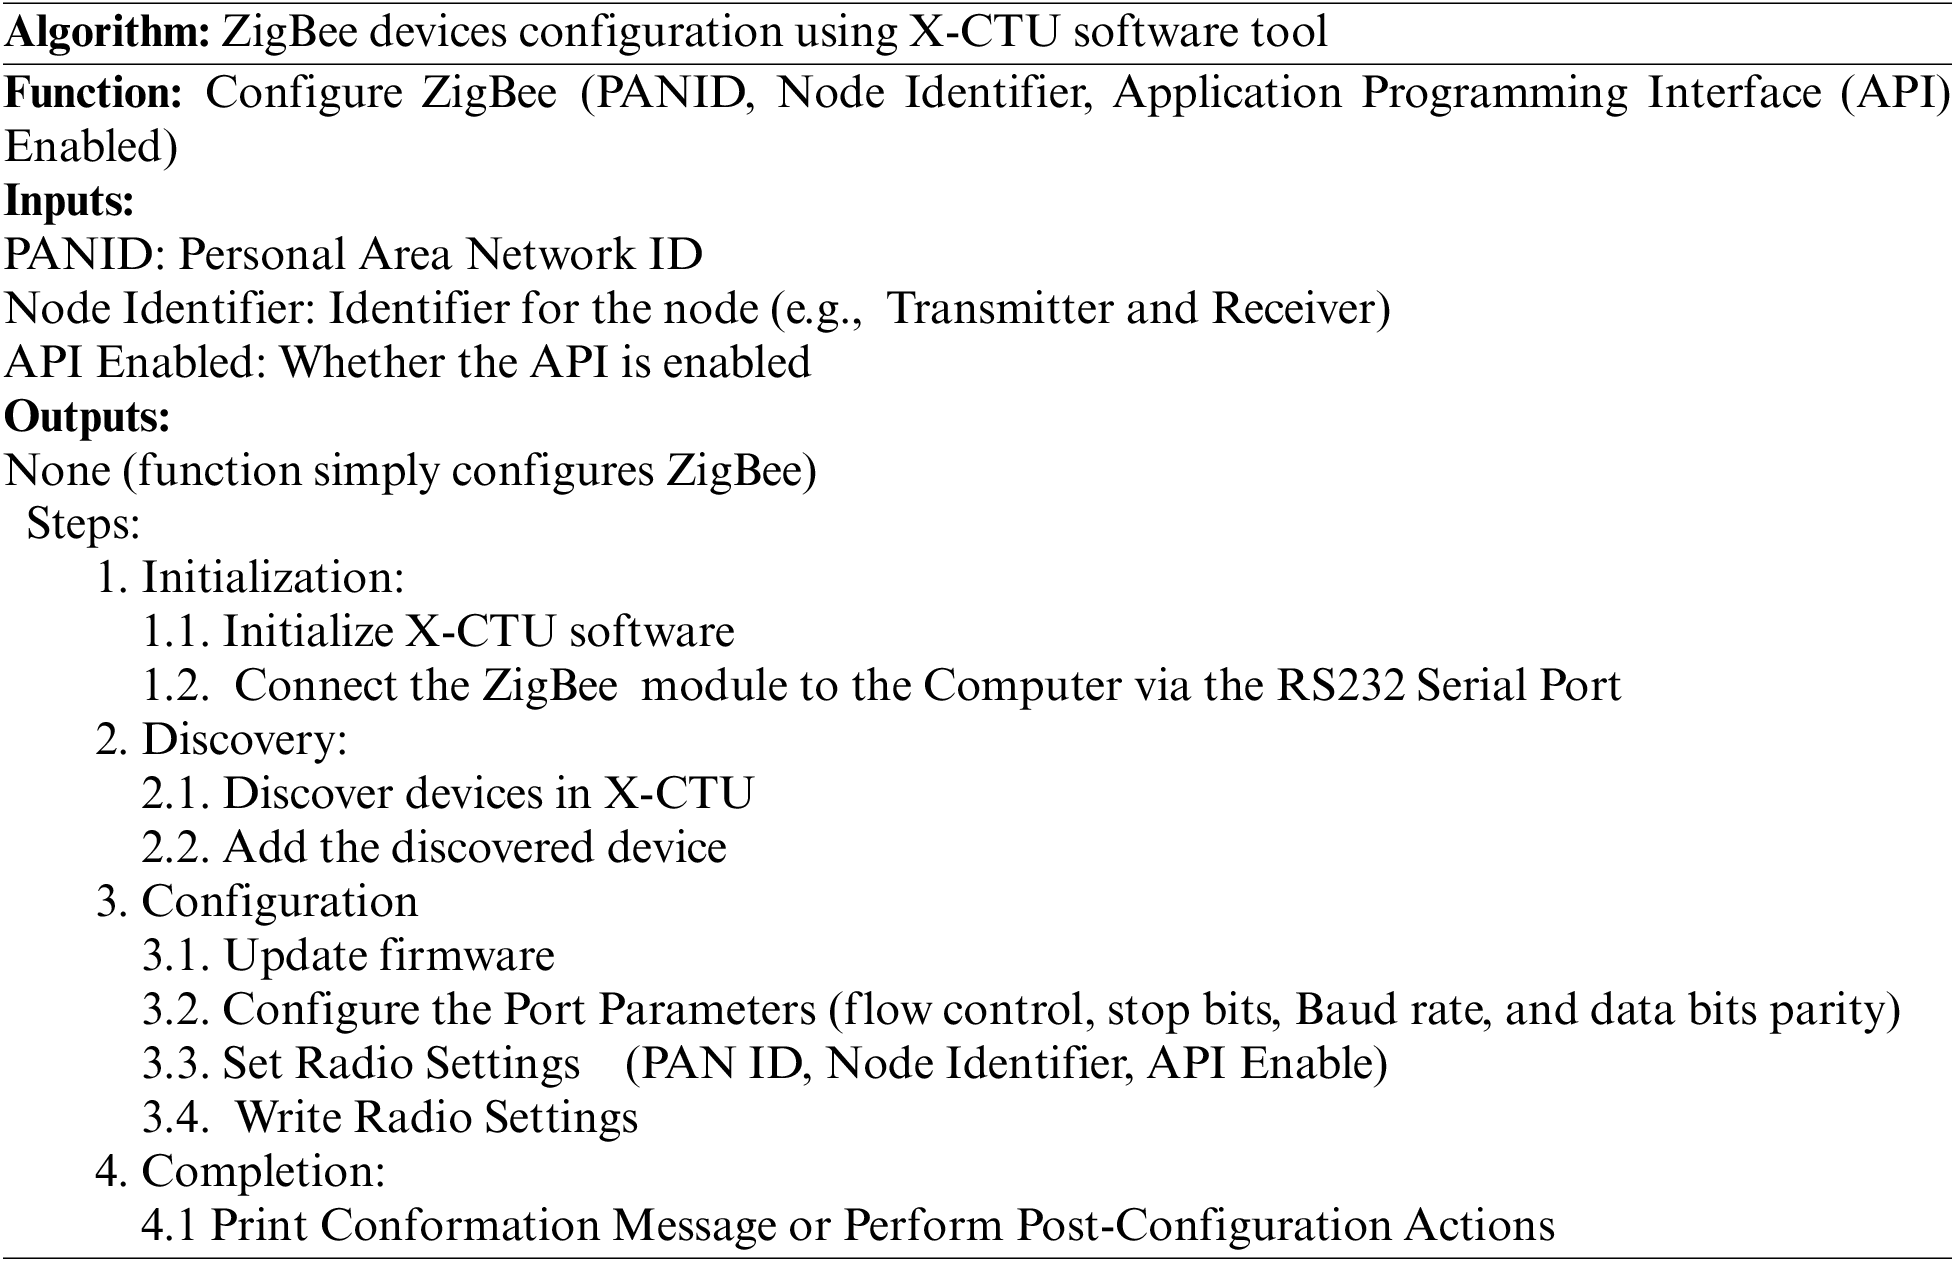
After receiving the confirmation message for the successful configuration parameters, the ZigBee module displays various parameters indicating its current configuration and status. These parameters include the currently installed firmware version, device information details with the device serial number, model number, network parameters with PAN ID, node identifier along with API status, radio-related parameters of the ZigBee module, and the channel and power level. Finally, it displays the device status, including whether the ZigBee module is active, sleeping, or in an error state.
3.2 Description of Mine Location
The experimental field test occurred at the Tadicherla open-pit mine in India, where coal is mined in an open pit and sub-bituminous to C-grade coal. The tests were conducted in I2O and O2O environments, which are critical for evaluating the performance of ZigBee in such environments. The environmental conditions at the site are a temperature of 26°C, a humidity of 51%, a pressure of 14.7 PSI, and a wind speed of 12.8 km/h. The exact coordinates of the mine are 18.524052 latitude and 79.744075 longitude, providing important contextual information for the experiment. A map of the mine layout is included to understand the test area, as shown in Fig. 4.
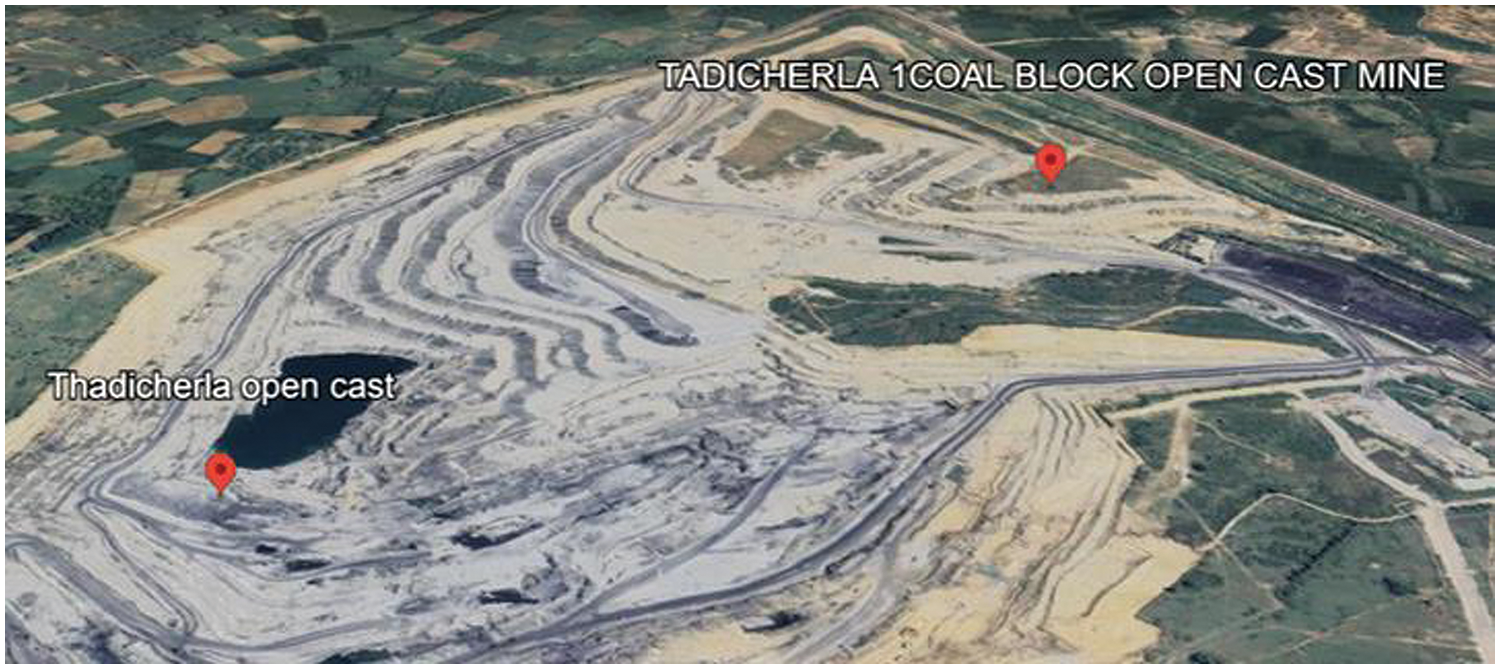
Figure 4: Location of Tadicherla Mine, India
3.3 Field Test Procedure for ZigBee Protocol
ZigBee is one of the emerging standards for the Internet of Things. Wireless communication occurs between Xbee devices that function as RF devices. Both devices must be connected to the same network to send and receive data from one ZigBee module to another. The process of conducting a field test for ZigBee in a specific mine begins with the hardware setup, where ZigBee devices are connected to a computer via an RS-232 USB cable. This enables the configuration of these devices and establishes connections between the RF modules. The X-CTU software configures the ZigBee devices to update the firmware. Similarly, ZigBee devices are configured as transmitters and receivers with the specific settings PANID, Channel Verification, Node Identifier, and API Activation. Select the Range Test option in the tools menu to perform the range test. The ZigBee devices are then started with the ZigBee_Transmitter and ZigBee-Reciver. After successful configuration, the range test is started, and the data is collected to understand the performance under various parameters. In this view, the ZigBee range test was performed in two environments, I2O and O2O, as shown in Fig. 5.
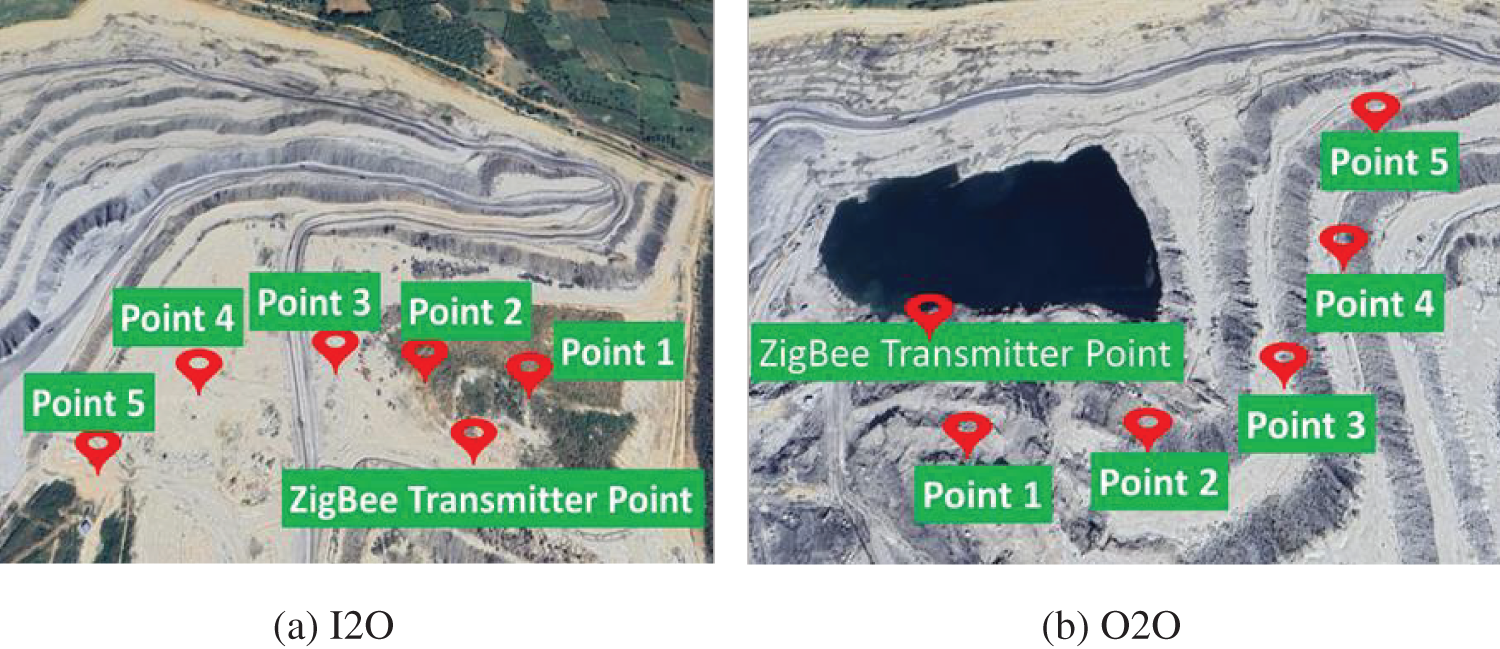
Figure 5: ZigBee system coverage map with blue location marks representing the measured location in different scenarios
3.3.1 Indoor-to-Outdoor (I2O) Scenario
ZigBee, designated with the IEEE 802.15.4 operating standard, is characterized by its low-power consumption and suitability for applications requiring lower data rates. For the indoor-to-outdoor setup, the mine authority administration conference hall was chosen as the reference point, and the RSSI values varied in the receiver’s position in various locations. Photos capturing key moments during the field tests are shown below for further analysis. Fig. 6 shows the transmitter and receiver devices for the ZigBee protocol. Both ZigBee devices operate at a frequency of 2.4 GHz.
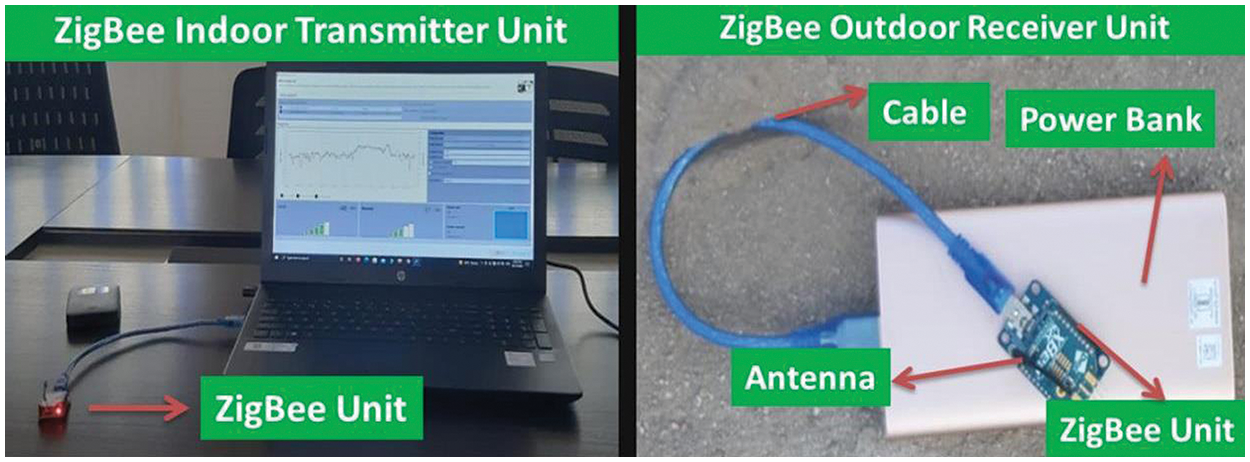
Figure 6: Zigbee device units for Transmitter and Receiver in I2O scenario
3.3.2 Oustdoor-to-Outdoor (O2O) Scenario
ZigBee has proven its dynamic adaptability in many applications that require flexibility and performance, even in complex environments such as mines. For the outdoor-to-outdoor setup, this study chose transmitter and receiver reference points in the mine’s outdoor area. It noted the RSSI values by varying the receiver’s position at various locations. Below are photos of key moments during the field tests to further enhance the analysis. Fig. 7 shows the test setup of the ZigBee modules in an outdoor environment.
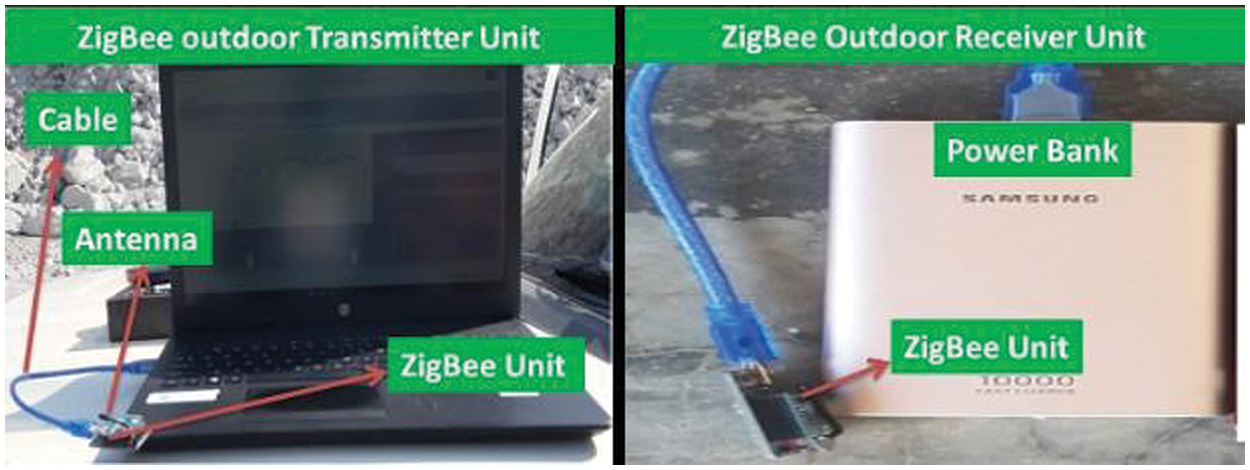
Figure 7: ZigBee module units for Transmitter unit and Receiver unit in O2O scenario
3.3.3 Observations through Field Test
These graphs reveal the essential findings of ZigBee performance in both I2O and O2O mining environments and show trends in signal attenuation over different distances to shed light on signal variability. This initial observation offers valuable guidance for further analysis and optimization efforts.
I2O Environmental Analysis
Fig. 8a,b depicts a ZigBee network’s performance in an I2O environment, represented by the RSSI as a function of logarithmic distance. The X-axis represents the logarithmic distance in meters between the transmitter and receiver, while the Y-axis represents the dBm. RSSI decreases when the logarithm distance increases, as signal attenuation degrades when the distance increases between the transmitter and receiver for several reasons, including weather conditions and obstructions, all of which affect the signal strength and range. The observed RSSI ranges from −32 dBm at the shortest distance, indicating a strong signal, to −100 dBm at the longest, representing a weak signal. In addition, the SD of RSSI varies between 0 and 13 dBm, highlighting the fluctuations in signal strength due to environmental factors.
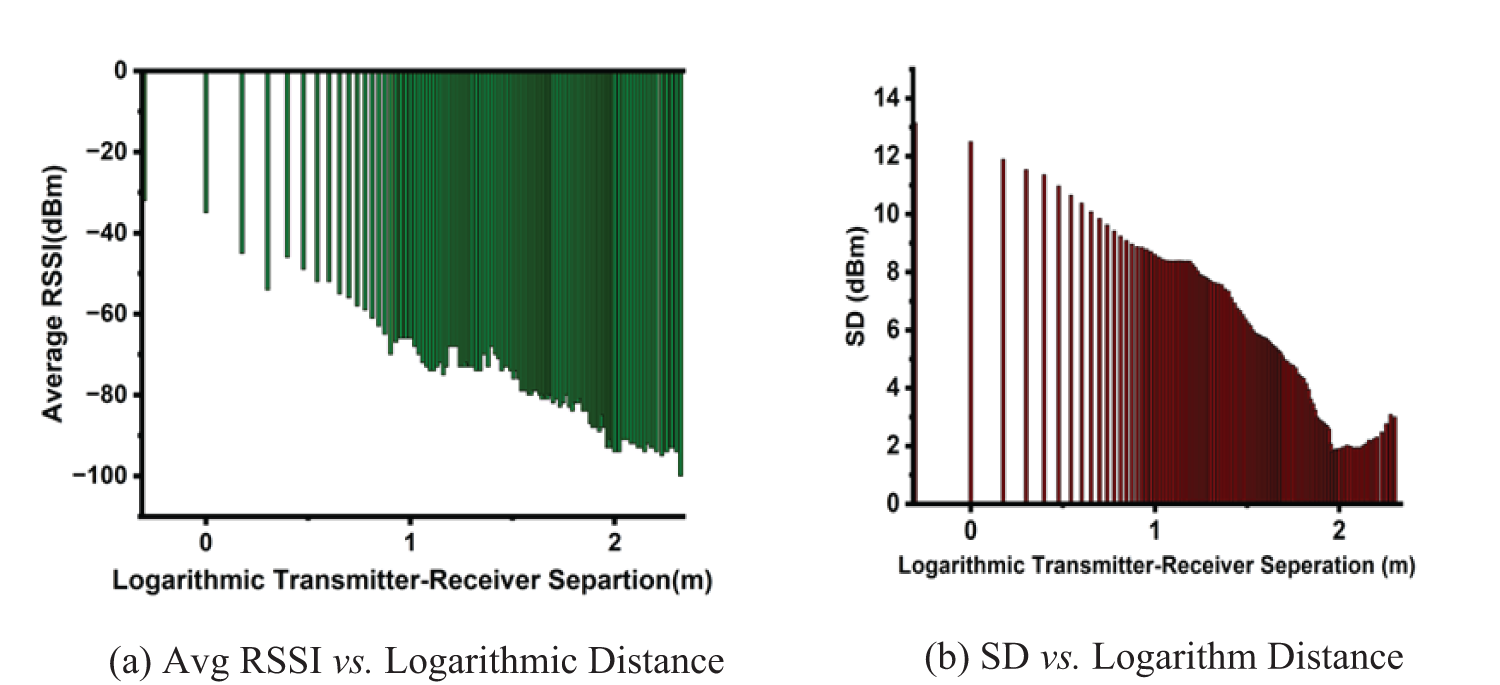
Figure 8: ZigBee network performance in an I2O scenario
Outdoor to Outdoor Environment Analysis
Fig. 9a,b illustrates the relationship between logarithmic distance and RSSI values for O2O environments. The X-axis represents the logarithmic distance, varying from 1.1 to 1.8 m, while the Y-axis shows the RSSI values, ranging from −36 to −100 dBm. This graph is crucial for understanding the RSSI across varying distances, providing insights into the performance of ZigBee communication in an O2O environment where signal quality can be significantly affected by distance and environmental factors. Similarly, graph b examines the relationship between logarithmic distance and SD, with the X-axis ranging from 1.1 to 1.65 m and the Y-axis showing SD values from 1.6 to 6.4 dBm. This shows the perspective on the variability of signal quality across distances, highlighting the stability and reliability of ZigBee communication in O2O scenarios.
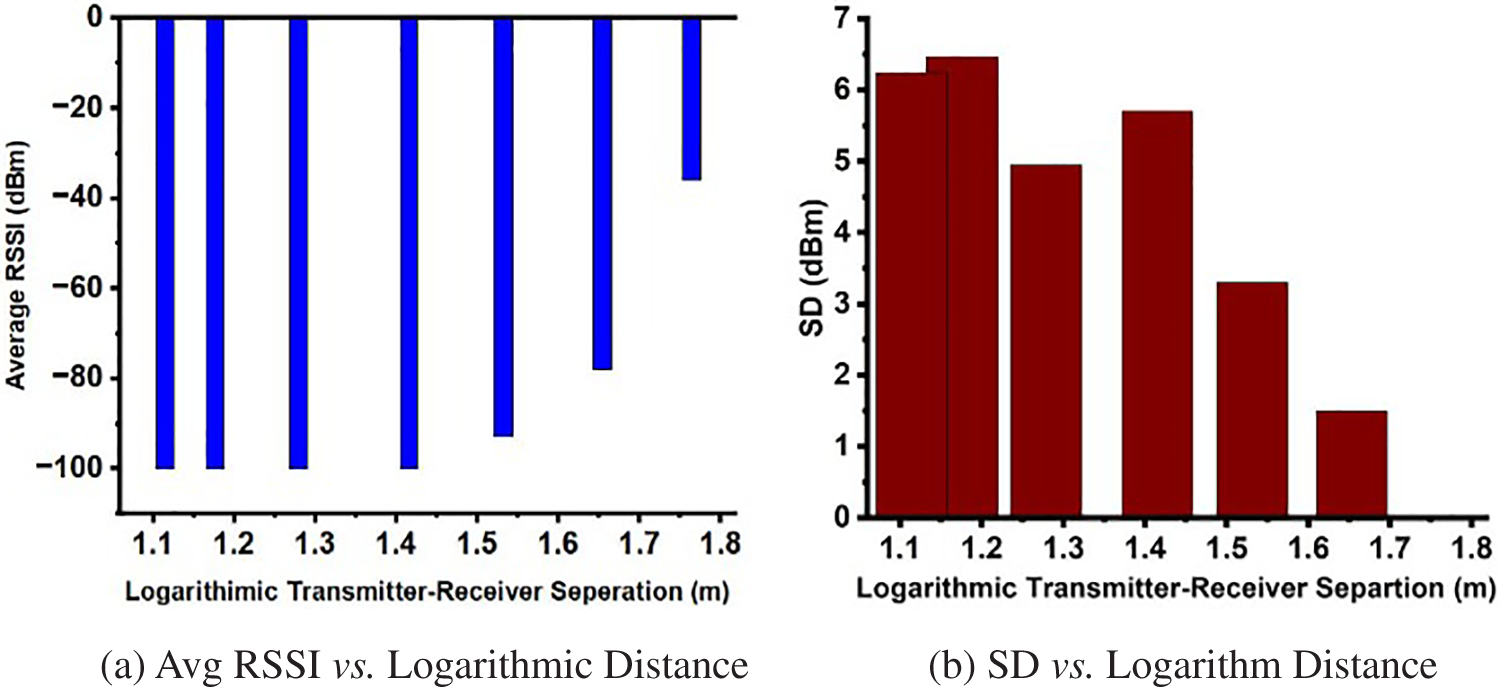
Figure 9: ZigBee network performance in an O2O scenario
4 Performance Evaluation Coverage Test for LoRa Network
This study utilizes the test bed to trace the performance of LoRa for both I2O and O2O scenarios. To experimentally evaluate the strength of the LoRa, the RSSI values were recorded by adjusting the input parameters, changing the receiver to different locations, and maintaining the transmitter at a fixed point for both I2O and O2O scenarios.
4.1 Configuration of LoRa Devices
The configuration process was carefully designed to ensure the LoRaWAN efficiency in the challenging environment of mines. The field tests were conducted in both I2O and O2O environments. The transmitter and receiver were configured with specific parameters. RSSI and SNR measurement values were collected during the range test. Fig. 10 depicts the LoRa-based experimental setup of the coverage field test. This setup includes transmitter and receiver units. The transmitter module is connected to the PC via an RS-232 USB cable to capture the observations. The receiver LoRa module operates independently. Here, Both the LoRa devices function at the frequency of 868 MHz.
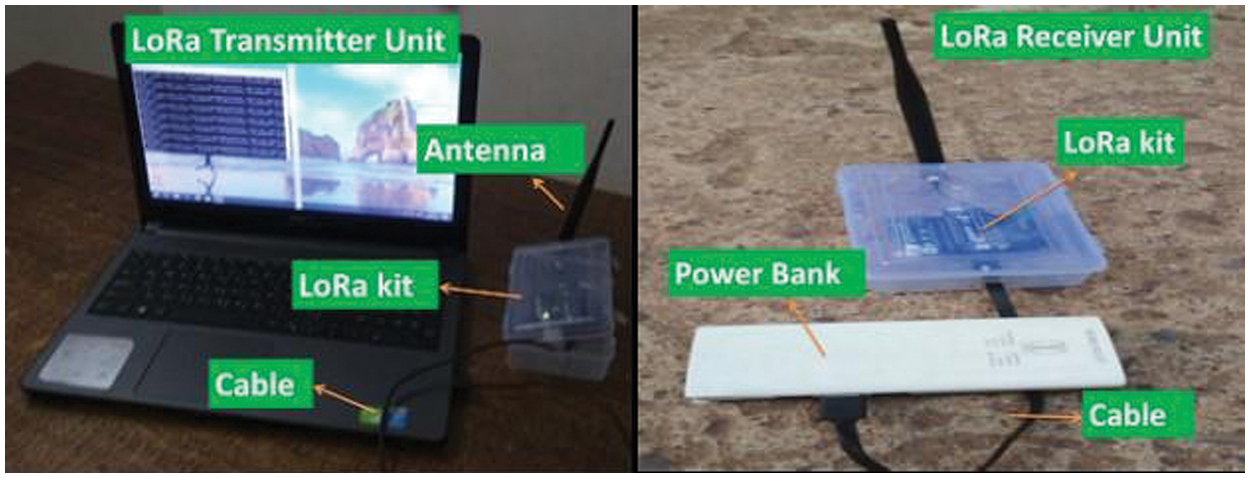
Figure 10: Configuration of Pycom-based Semtech SX1276 LoRa devices
The following pseudo-code outlines the steps for configuring a LoRa device to function in both roles: transmitter and receiver (Algorithm 1).
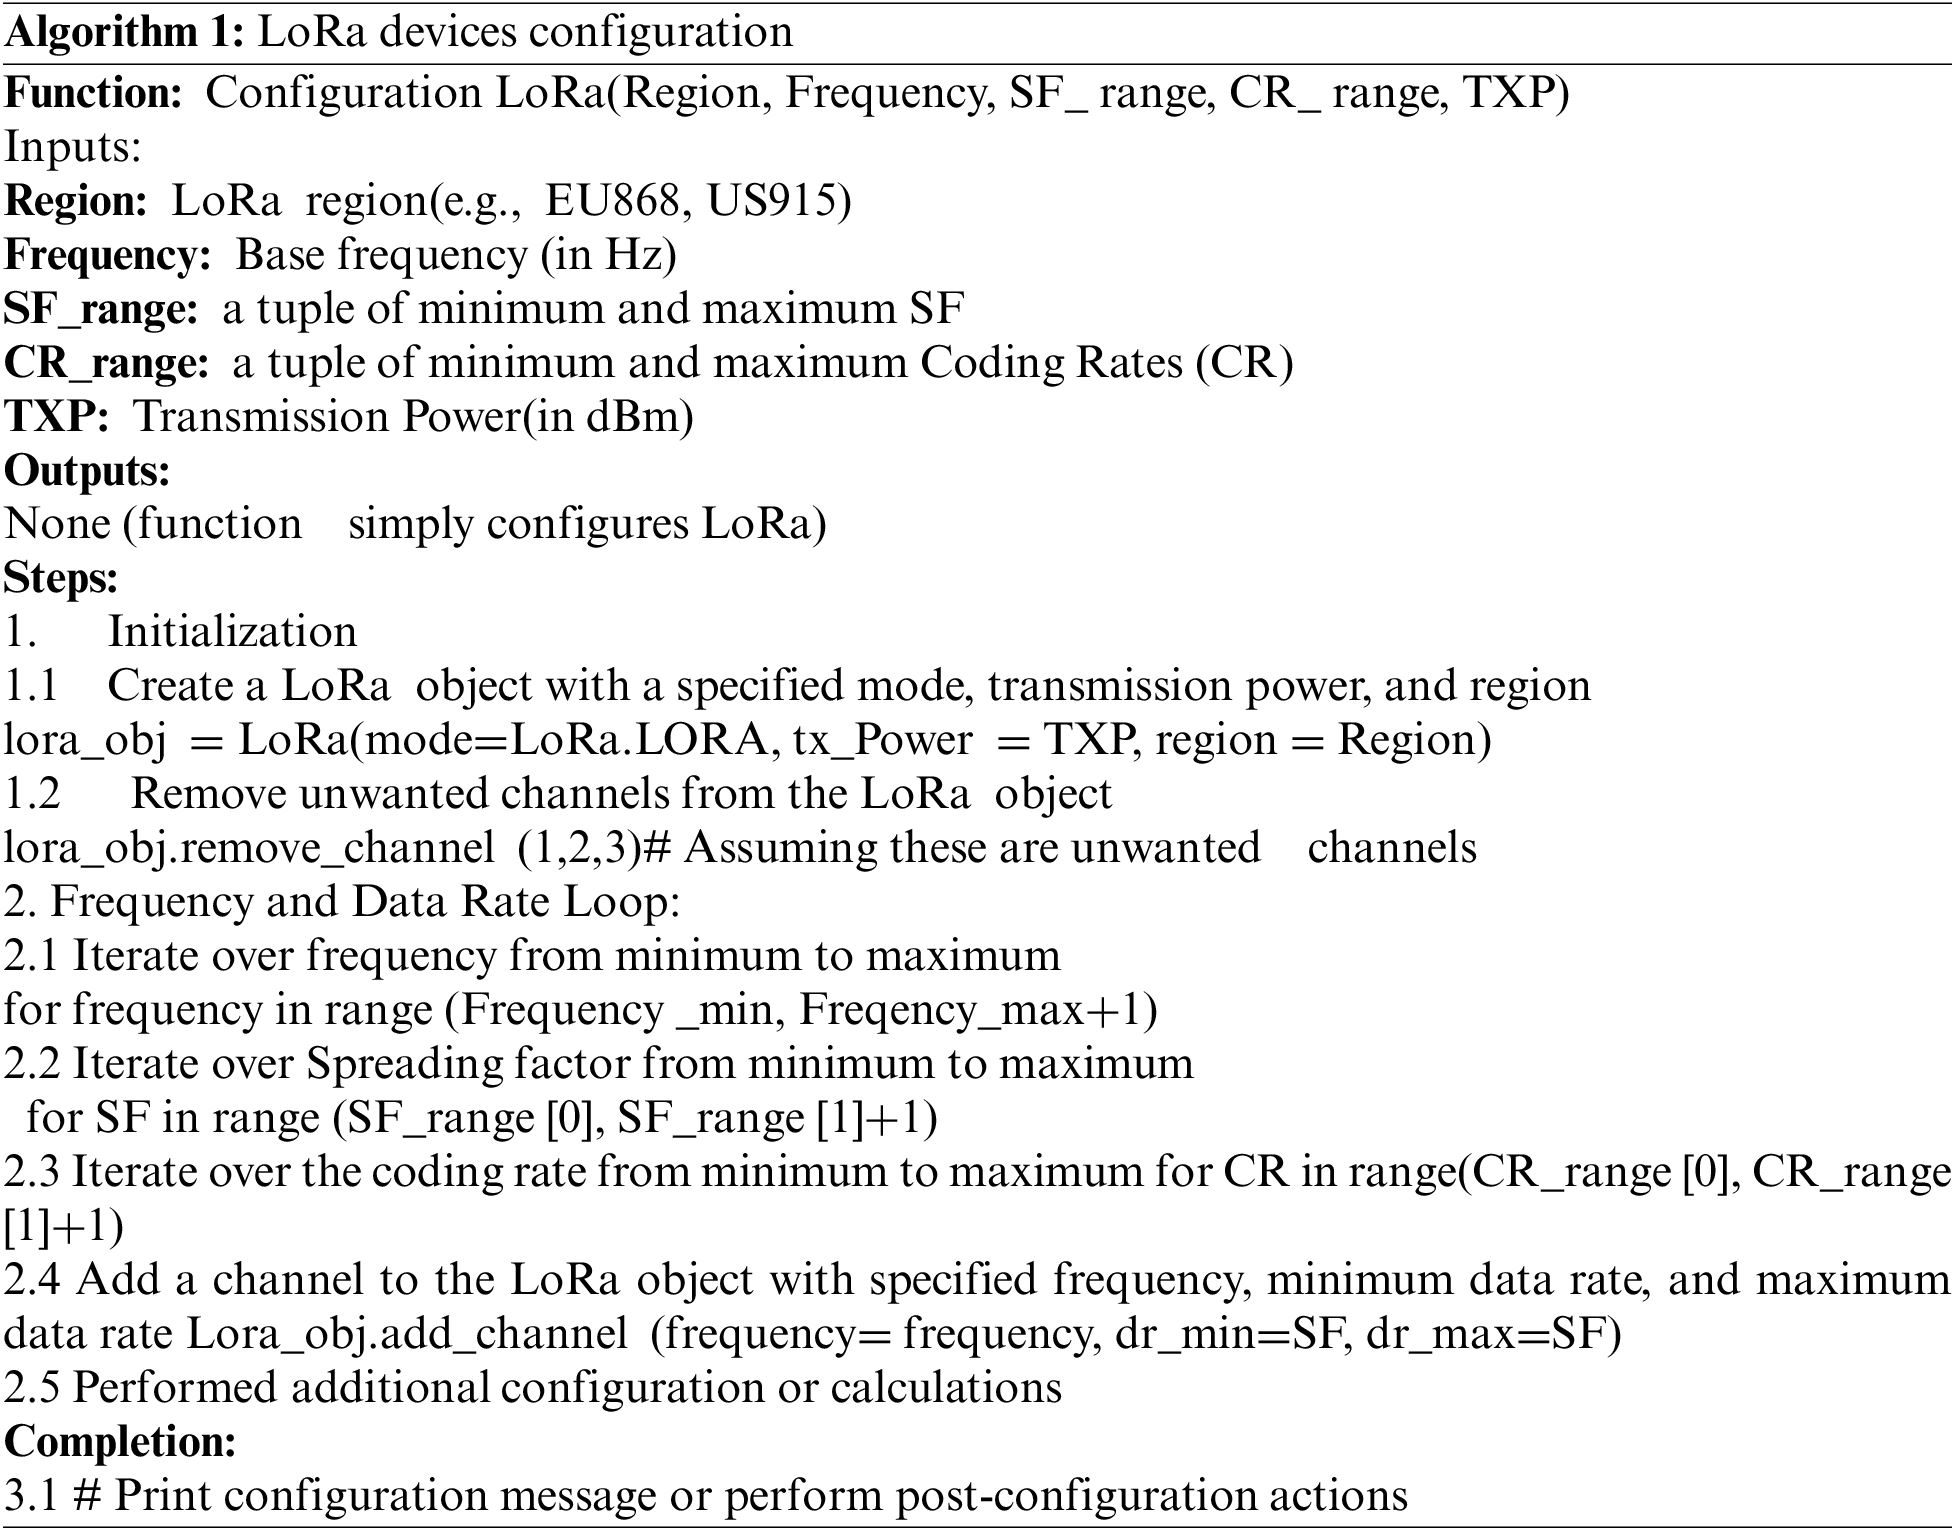
After performing the LoRa device configuration, it will receive a confirmation message as configuration was successful and show specified parameters, including the currently installed firmware version, details about device information containing the device serial number, model number, network parameters with PAN ID, node identifier along with API status, and radio-related parameters of LoRaWAN module along with the channel and power level. Finally, it displays the device status, including whether the LoRa module is active, sleeping, or in error.
4.2 Description of Mine Location
The experiment was performed in the Dungri limestone mine in Odisha’s Bargarh district in India as shown in Fig. 11. The mining method employed is surface, open-cast. The exact coordinates of Dungri limestone have a longitude 83°32′57.4′′ and 21°41′24′′ latitude. In order to examine the performance of the LoRa coverage distance, different distance scenarios were utilized by changing the positions of the LoRa receiver to what extent of distance it can receive the signal of LoRa in terms of RSSI (dBm) and SNR (dB).
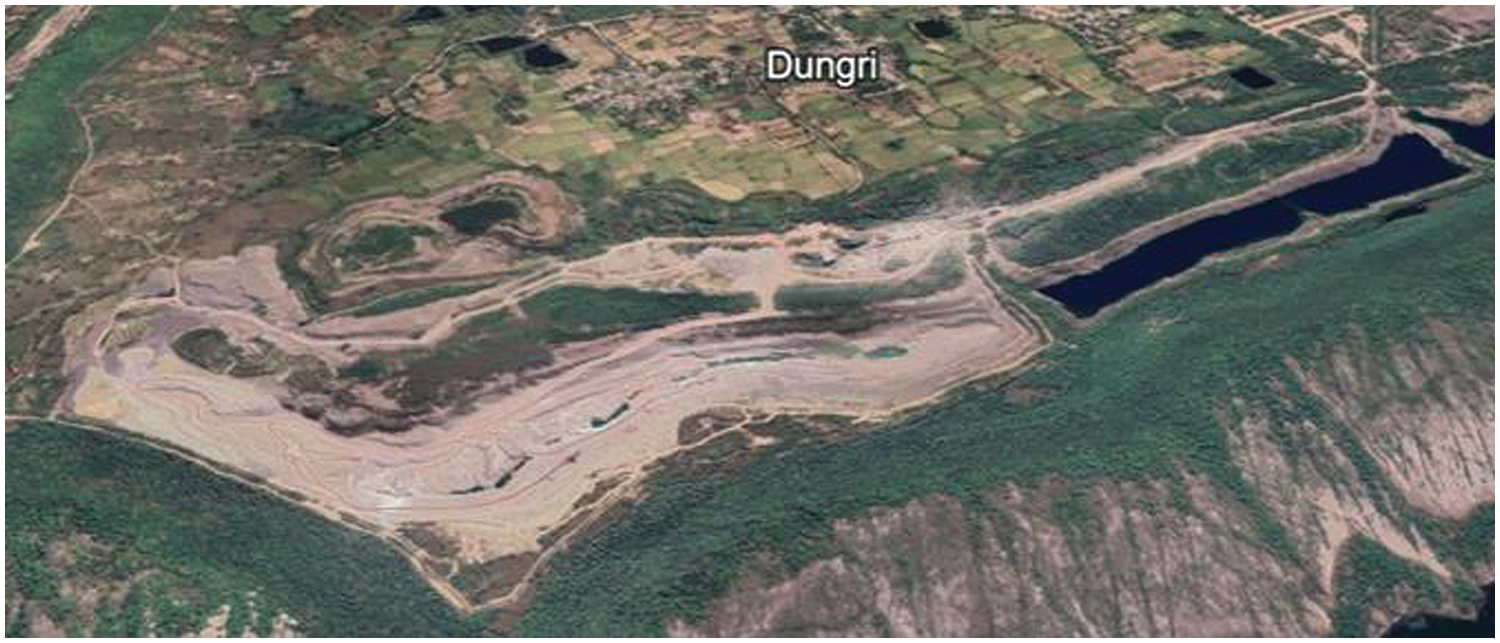
Figure 11: Google image of the location of ACC Dungri limestone
4.3 Field Test Procedure for LoRa
LoRaWAN offers ideal advantages for improving mine operations, making them easier, safer, and more accurate with good signal coverage throughout the mine. These benefits are possible only with LoRaWAN’s unique features, including long-range communication, low power usage, battery backup lasting for years, and strong signal connectivity. This study uses the LoRa devices as Semtech SX1276 LoRaWAN transceivers with a sensor shield for data collection. In addition, B210 USRP (Universal software radio peripheral) was employed, configured for an RF frequency of 868 MHz and capturing data at various time intervals. Two LoRa modules of Pycom FIPY supporting five networks were utilized, which are manufactured by Pycom Ltd., a company based in Fareham, Hampshire, United Kingdom. An external antenna connected to the LoRa device was configured with an RF frequency of 868 MHz, having a 125 KHz bandwidth, a 4/5 coding rate, and an SF of 7. The transmitter and receiver sides utilized Pycom boards and were programmed using Micro Python programming version 3. This environment provides built-in features and basic Python libraries for working with microcontrollers. Pymakr was employed to run the Read-Eval-Print Loop (REPL) console code. The antenna used at the transmitting and receiving end is 14 dBi power and has a height of 0.19 m. The field experimental test was conducted in different environmental scenarios, such as Indoor-to-Outdoor (I2O) and Outdoor-to-Outdoor (O2O).
4.3.1 LoRa Test in Indoor-to-Outdoor Environment
This study ran the indoor experimental setup for performance assessment while avoiding an outdoor environment and collected the RSSI values. This experiment was conducted by changing LoRa’s receiver locations and keeping the transmitter fixed. The transmitter will send messages to the receiver from different locations to make uniform channel conditions. Fig. 12a,b depicts the deployed LoRa devices as transmitter and receiver units at field locations.
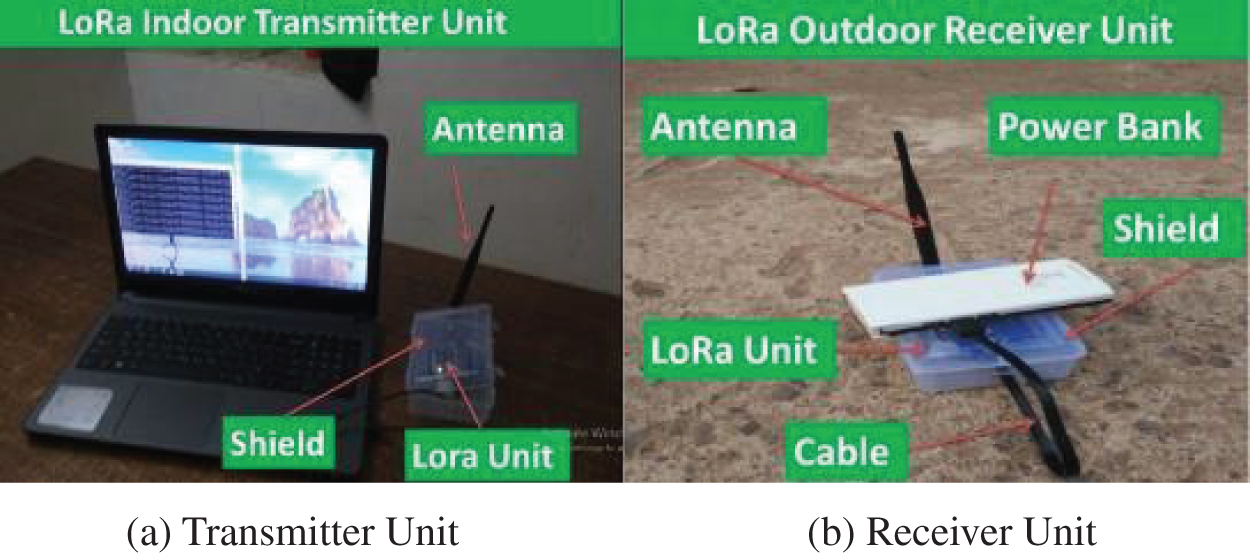
Figure 12: LoRa device deployment setup
The LoRa coverage investigation was performed at various receiver locations, and the RSSI, SNR, and other vital values were collected. Observations are captured in various ranges, starting from the initial location of the transmitter point with minimum value and gradually enhancing the distance (range). Fig. 13a,b illustrates the aerial images of the I2O test scenario at ACC Dungri limestone mine, India.
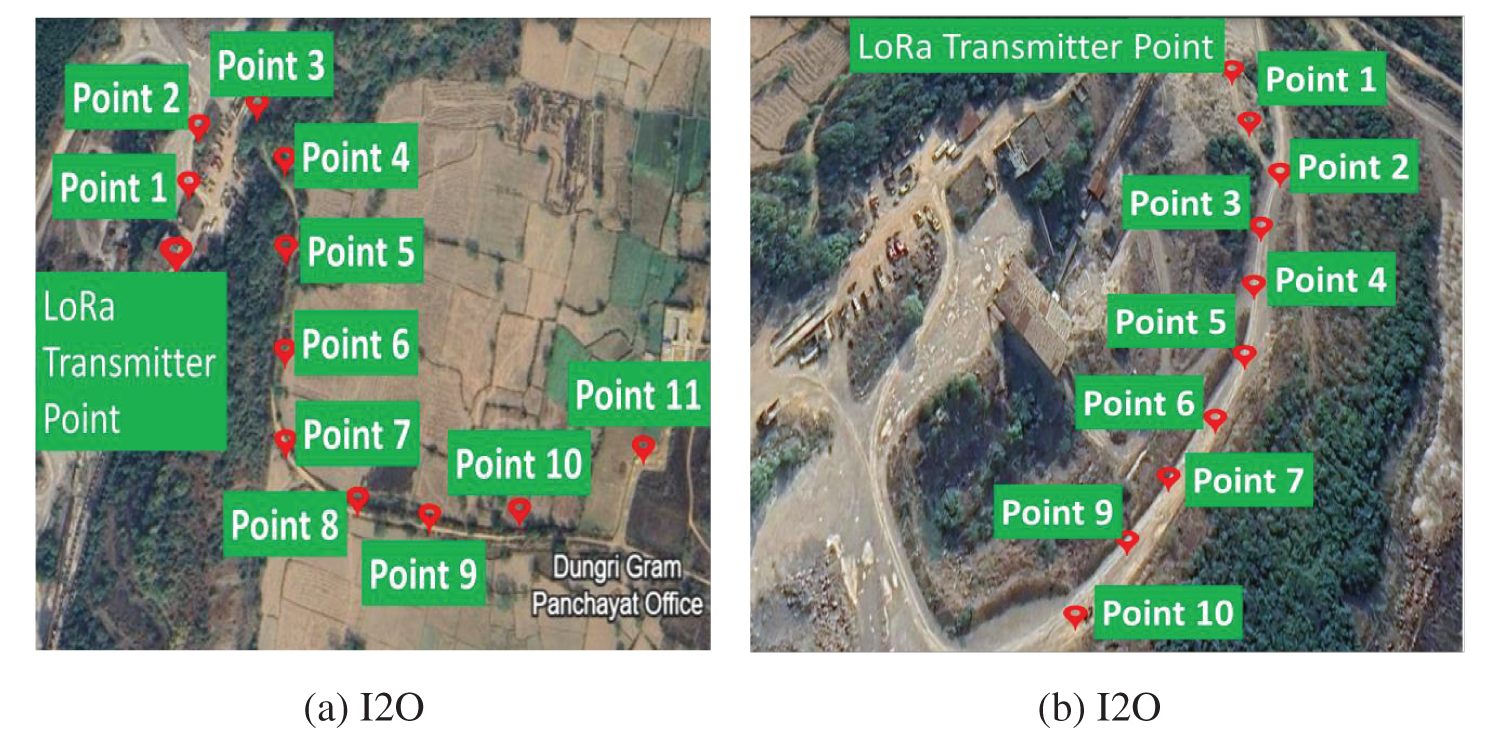
Figure 13: Google map of I2O test case in ACC Dungri open-cast mine, India
4.3.2 LoRa Test in Outdoor-to-Outdoor (O2O) Environment
Usually, the LoRa network signal is attenuated by the surrounding environments, such as high-rise buildings, trees, hill areas, and others. In this regard, the coverage test must be conducted in the LoS case, also known as O2O. In order to assess the LoRa coverage range, this study conducted the experimental test in O2O by deploying the LoRa test bed, as shown in Fig. 14a,b. The experimental setup collected the RSSI values and other key values. This test was performed by changing different receiver locations of LoRa, keeping the transmitter in a fixed location. The transmitter will send the same messages to the receiver for different locations to ensure uniform channel conditions.
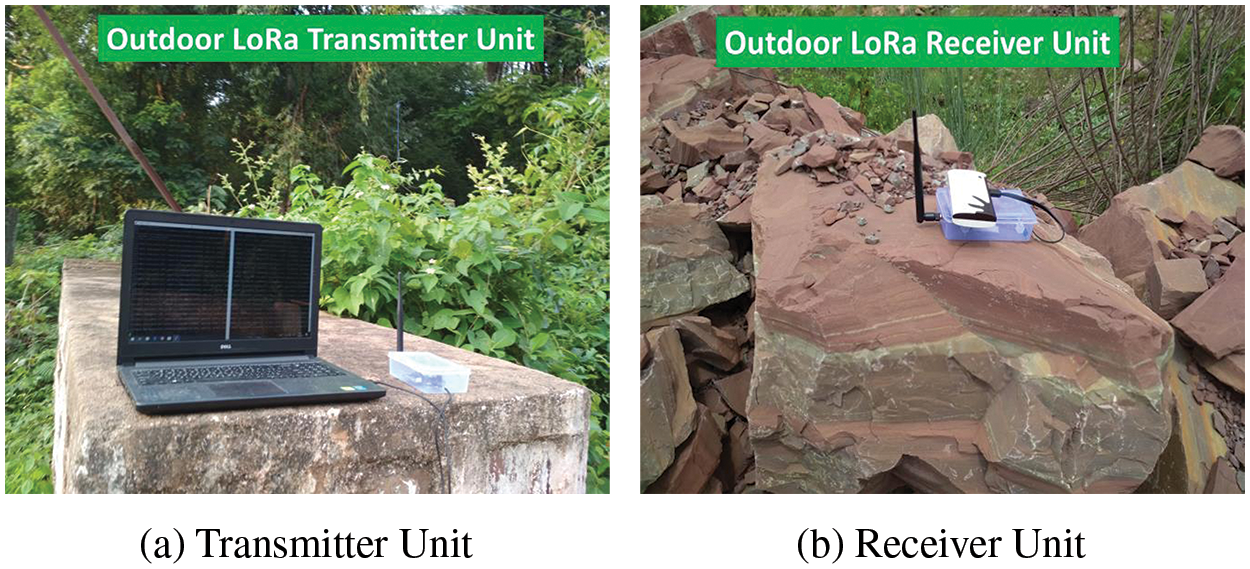
Figure 14: Field deployement of LoRa units for O2O
4.3.3 Outcomes of the Field Test
These graphs shed light on LoRa’s behavior in I2O and O2O mining environments, charting distinct signal strength patterns across distances and illuminating its unique variability. These initial insights hold for further analysis and optimization for robust deployments in these challenging environments.
Indoor to Outdoor Environment
Fig. 15a depicts the outcomes for LoRaWAN in an I2O environment, showing that the captured RSSI values range from −132 dBm, indicating weak signal strength, to −51 dBm, indicating strong signal strength. The observation is that the signal strength decreases as the distance between the transmitter and the receiver increases. Fig. 15b indicates that the captured SD values range from 2 to 34 dBm, reflecting the stability and reliability of LoRaWAN in I2O environments.
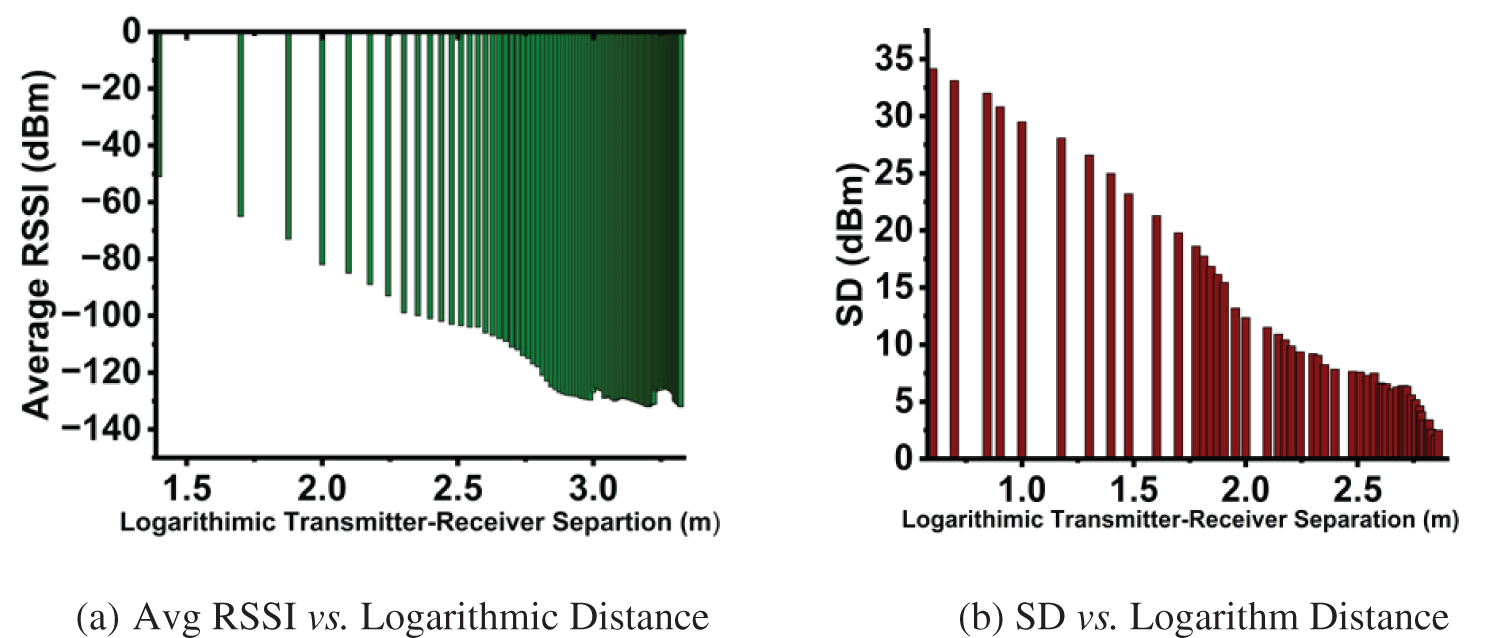
Figure 15: LoRaWAN I2O performance evaluation
Outdoor to Outdoor Environment
Fig. 16 illustrates the RSSI and SD for the LoRaWAN in O2O environments. The captured RSSI values ranged between −14 and −125 dBm as the shortest and longest distances, as shown in Fig. 16a. It indicates a negative correlation between RSSI and distance. The RSSI values progressively decrease as the distance increases on the logarithmic scale, indicating a weakening signal. This wide range highlights LoRaWAN’s ability to communicate over significant distances in O2O environments. Fig. 16b exhibits that the SD spans from 0.25 to 16 dBm at the longest distance, indicating that signal strength becomes more variable as the transmission distance increases.
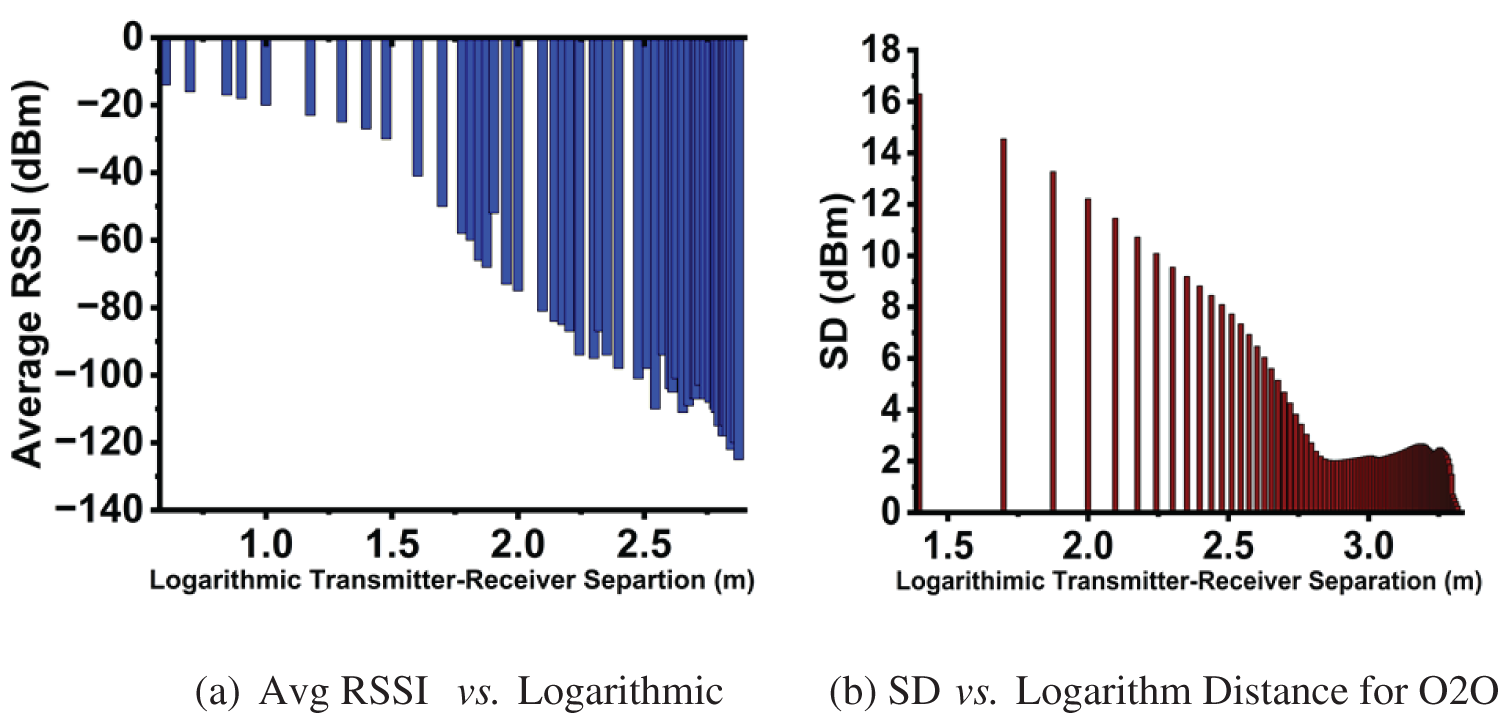
Figure 16: LoRaWAN O2O performance evaluation
Path-loss refers to the loss in the signal path due to many effects, such as changes in environmental concerns such as disturbances in the airflow, temperature, the physical spacing between the sender and the receiver, the foot to head, and the placement of antennas.in proper locations. Path loss is measured in decibels (dB) and is expressed mathematically as:
By considering Pt and Pr as the signals being sent and received powers in dBm, Gt and Gr as the sender and receiver gains in dB, and the assigned values for Gt and Gr are 1.8 dB. Path loss modeling is a decisive factor in wireless communication, serving as the reference point to grade the originality of the signal between the sender and the recipient. In this research work, the path-loss models implemented are the Free Space Propagation Model, Egli Model, Okumura-Hata Model, COST 231-Hata Model, and Ericsson Model.
The Free space model is a fundamental concept in wireless communication. It assumes that all signals are radiated uniformly in all directions. It is typically mathematically represented as follows:
where f is the frequency and d is the distance.
The Egil model is designed to extend the capabilities of the Free space model, incorporating additional considerations such as antenna heights at the sender and receiver. It is typically mathematically represented as follows:
where d is the distance, hb is the height of the antenna over ground level in meters, and f is the frequency in megahertz.
5.1.3 Okumura-Hata Propagation Model
The Okumura-Hata model considers the multipath propagation of signals. Path-loss prediction can be performed in three areas: open, suburban, and urban [66]. The equation for the Hata model is given as follows:
1. For urban area:
where
For
For
2. For medium to small cities:
3. For suburban areas:
4. For open areas:
5.1.4 Cost231 Hata Propagation Model
The Cost231 model, also known as the Hata model, is often used in urban environments and is suitable for handling multipath and terrain shadowing effects. It is typically mathematically represented as follows:
where
(f) is the frequency in megahertz (MHz),
(d) is the separation between the transmitter and receiver in kilometers,
(hb) is the elevation of the base station antenna over the ground levels in meters, and considering the criterion for the parameter (cm) is set to 0 dB for suburban or open settings and 3 dB for urban environments, the parameter
For Suburban or Rural environments, as follows:
where hr is the elevation of the mobile device’s antenna, measured meters above the ground surface.
5.1.5 Ericsson Propagation Model
The Ericsson model is similar to Cost231 and can handle reflections and diffractions indoors and outdoors. It is typically mathematically represented as follows:
where
hb is the height of the transmitting antenna in meters,
hr is the height of the receiving antenna in meters.
Specifications a0, a1, a2, and a3 are predefined constants that can be changed to adopt certain propagation conditions. The values of a0 and a1 in suburban and rural regions depend on the least squares (LS) approach. Table 5 shows the default settings for these parameters in different terrains.

It is essential to examine the performance of various path-loss models to achieve accurate path-loss modeling for reliable wireless communication. This will help identify the most effective model to enhance the signal strength, quality, and continuity. Proper analysis using key metrics, specifically MSE, MAD, MAPE, SI, NRMSE, and R2, can provide insights into the best model performance.
5.2.1 Mean Squared Error (MSE)
MSE is the most concise criteria metric to evaluate the regression analysis. It is calculated by averaging the squared discrepancies among the predicted and actual path loss values. The mathematical equation for this is given below:
where n is the sum of all the values. Actual and prediction represent the actual and predicted path losses, respectively. The symbol ∑ indicates the summation procedure. The lessened MSE suggests a more accurate model as the perdition values are nearer to the actual path loss values.
5.2.2 Mean Absolute Deviation (MAD)
MAD is one of the metrics used to estimate performance. It calculates the model’s performance based on the average discrepancy between the actual and predicted path losses. The mathematical equation for this is given below:
A minimized MAD represents an accurate model, suggesting that the predicted path loss values closely approximate the actual path loss values.
5.2.3 Mean Absolute Percentage Error (MAPE)
MAPE is also a metric to evaluate the performance of a model, particularly when the actual path losses are approaching zero. It is the sum of the average of the absolute percentage among the actual and predicted path loss values. The mathematical equation for this is provided below:
A smaller value of MAPE signifies a more accurate model where the predicted and actual path loss values closely match.
The SI is a statistic for evaluating the accuracy of a model’s performance. It considers all the values and their relative frequencies. The SI is computed by dividing the RMSE by the mean of all values and multiplying the result by 100. The mathematical equation for this is given below:
Lower values of SI indicate a better performance model.
5.2.5 Normalized Root Means Square Error (NRMSE)
NRMSE is a variant of the RMSE metric. While RMSE calculates the differences between the actual and predicted path loss values, NRMSE offers a relative error indicator. This is achieved by dividing the RMSE by a scaling factor, and it can be the mean, which could be the mean, standard deviation, range, or interquartile range of the observed values. Normalizing the RMSE simplifies comparisons, making it easier to assess the performance of models or dataset scales with different scales.
where
The Scale factor can be the mean (mean (values), standard deviation (std_dev (values), range max (values)-min (values), or interquartile range (Q1–Q3) of the actual values.
where
n is the total number of values
∑ is summation symbol
Pi is the predicted value for ith
Oi is the actual value for ith
6 Path-Loss Modeling for ZigBee Network
In order to gain deeper insights into ZigBee performance in both II2O and O2O environments, various path-loss models were developed, including Free space, Egli, Okumura-Hata, Cost231-Hata, and Ericson models, and their performance was evaluated using key performance evaluation metrics, including MSE, MAPE, MAD, SI, R2, and NRMSE. The subsequent graphs illustrate the performance of each path-loss model. Figs. 17a and 18a indicate that the X-axis represents the distance between the transmitter and the receiver, while the y-axis displays the performance metrics. They illustrate signal strength and path-loss prediction between the transmitter and receiver at various distances. The X-axis in Figs. 17b and 18b is logarithmically scaled to represent the distances between the transmitter and the receiver, and the Y-axis shows the NRMSE values. This graph provides an overall assessment of the path-loss model’s performance based on NRMSE.
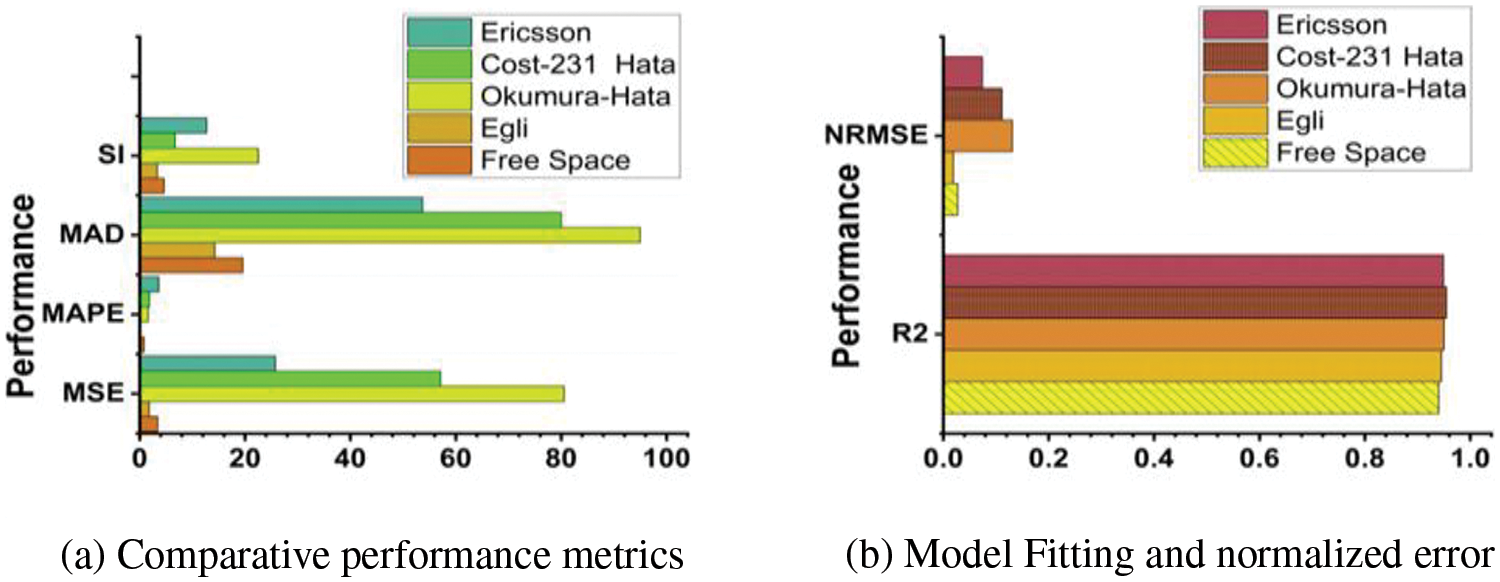
Figure 17: Performance and error analysis of ZigBee I2O
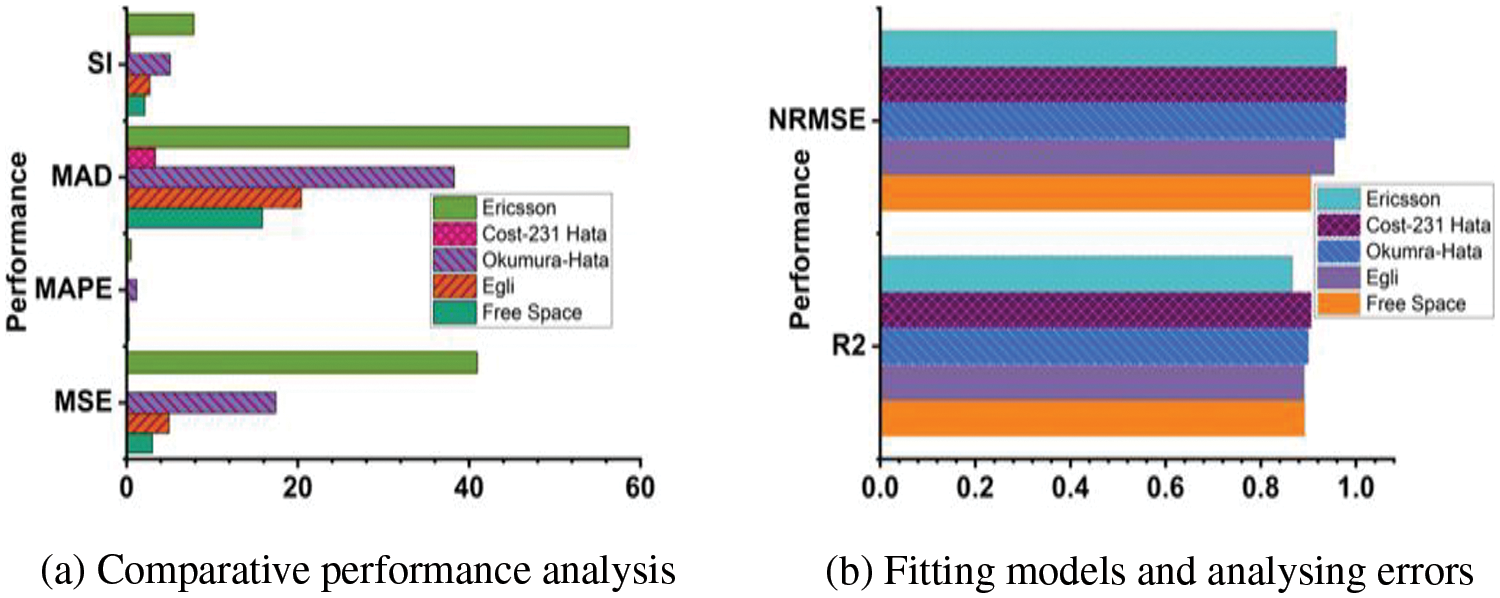
Figure 18: Performance and error analysis of ZigBee O2O path-loss models
6.1 Path-Loss Modeling Related to LoRa Network
Figs. 19 and 20present a comparative analysis of the path-loss models for LoRa I2O and O2O environments. The analysis focuses on the model’s performance metrics and how the model fits the data. These figures evaluate the performance of various path-loss models incorporating Free space, Eli, Okumura-Hata, Cost231-Hata, and Ericsson models. The performance is measured using MSE, MAPE, MAD, and SI metrics. The horizontal axis in Figs. 19a and 20a represents the separation distance between the transmitter and the receiver, while the vertical axis shows the corresponding performance metrics. These visualizations demonstrate the effectiveness of different path-loss models in estimating the signal strength or path loss at varying distances within LoRa I2O and O2O environments. Figs. 19b and 20b utilize a logarithmic scale on the X-axis to depict the distance between the transmitter and the receiver. The Y-axis displays the NRMSE values. This visualization provides a clear view of how the different path-loss models predict the signal strength across various distances in I2O and O2O environments, specifically in terms of NRMSE.
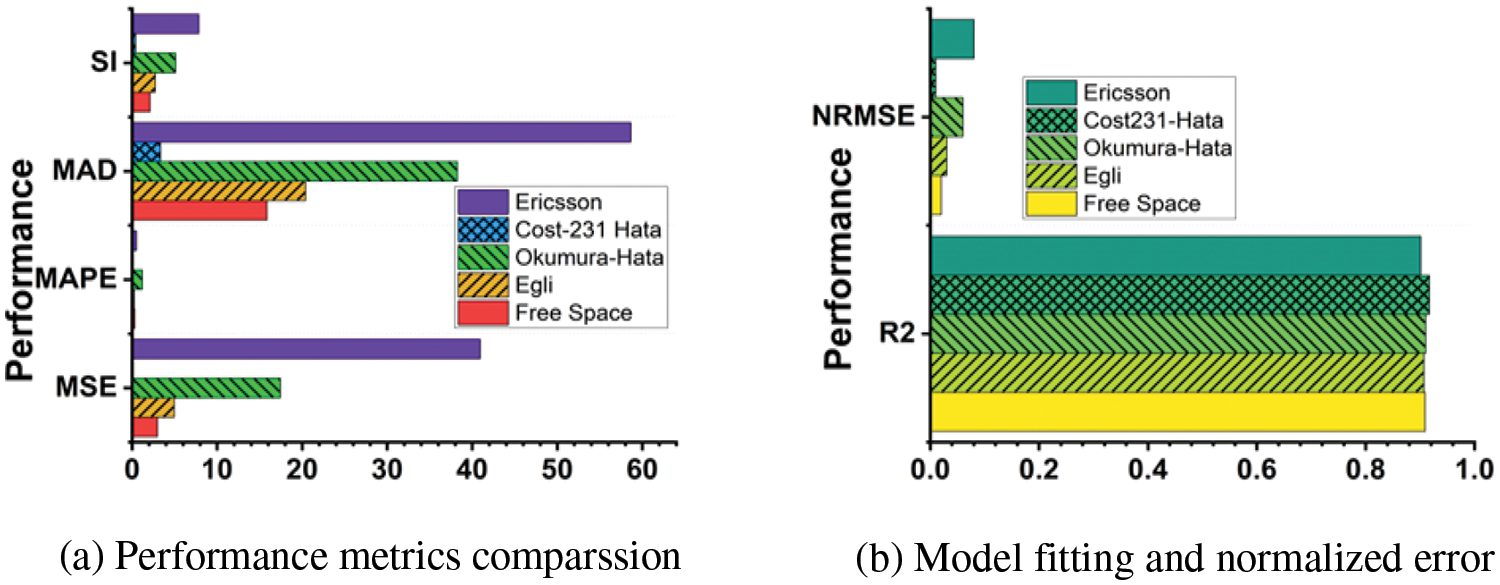
Figure 19: An overall perspective, outlining the evaluation of path-loss models for I2O
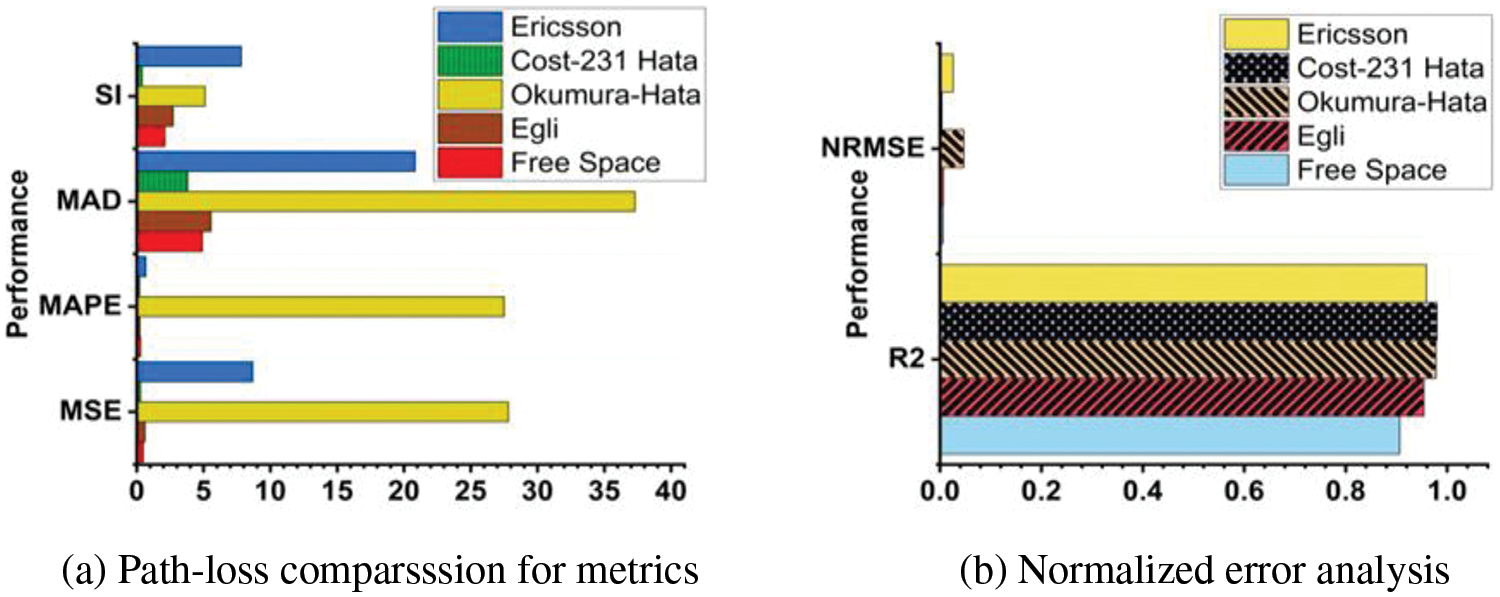
Figure 20: LoRa O2O path-loss model performance comparssion
In the province of wireless communication, this study conducted field tests in both I2O and O2O environments to analyze the propagation characteristics of ZigBee and LoRaWAN protocols. The findings indicate that both technologies exhibit similar patterns in RSSI measurements across varying distances between the transmitter and the receiver. As the distances increase, signal attenuation becomes more pronounced, a phenomenon crucial for understanding the performance of wireless communication in real-world scenarios. RSSI measurements were collected at multiple points along I2O and O2O paths between the transmitter and the receiver, enabling a comprehensive analysis of the signal propagation characteristics. Various path loss models were applied to investigate the data collected from these field experiments. These models, including the Free space, Egli, Okumura-Hata, Cost231-Hata, and Ericsson path-loss models, were utilized to predict signal degradation over distance. The application of these models provides a deeper insight into the factors influencing the performance of ZigBee and LoRaWAN protocols in different environments. The selection of the best path-loss model was determined by performance metrics such as R2, NRMSE, MSE, MAPE, and SI. These criteria were employed to evaluate the validity and reliability of path-loss models in predicting signal degradation over distance. The model with the highest R2 and the lowest NRMSE, MSE, and MAD was identified as the best model in each environment for the ZigBee and LoRaWAN protocols, highlighting its effectiveness in accurately predicting the path-loss model characteristics.
7.1 Analysis of ZigBee Protocol
7.1.1 Understanding Signal Attenuations in the I2O Environment
In an I2O environment, unique challenges significantly dampen radio signals. This attenuation contrasts with outdoor environments, which face obstructions and varying terrain, further degrading signal attenuation between the transmitter and the receiver. It is important to choose the most appropriate path-loss model to overcome degradation in signal attenuation and achieve reliable communication in the ZigBee I2O environment. These models can mathematically determine signal attenuation, which can predict the weakening of radio signals. This analysis will evaluate the performance of six path-loss models along with six performance metrics for the ZigBee I2O environment. Among all of them, the best overall fit model can be suggested.
Analyzing the path-loss models for ZigBee I2O communication reveals a trade-off between R2 as a correlation with the measured signals and error metrics with NRMSE, MSE, MAPE, MAD, and SI. The Cost231-Hata model boasts the highest R2 value as 0.955 but exhibits slightly higher error metrics NRMSE as 0.111, MSE as 57.072, MAPE as 1.814, MAD as 79.950 and SI as 6.7198 compared to the Egli model with n R2 value as 0.945 and NRMSE as 0.019, MSE as 1.808, MAPE as 0.231, MAD as 14.232 and SI as 3.368. The Okumura-Hata model achieves a high R2 value of 0.950 with slightly higher values of NRMSE at 0.131, MSE at 80.54, MAD at 94.978, SI at 22.49, and lower values for MAPE at 1.559. The Ericsson model offers a moderate R2 value of 0.949 with a lower NRMSE of 0.074, MSE of 25.746, and MAD of 53.698 but a higher MAPE of 3.660 and SI of 12.709 Compared to the Cost231-Hata model, Finally Free space achieves decent R2 value of 0.940 but suffers from the highest error metrics of NRMSE as 0.027, MSE as 3.4418, MAPE as 0.830, MAD as 19.566 and SI as 4.630. Therefore, the Egli path-loss model emerges as the preferred model for the ZigBee I2O environment if minimizing deviation from measurements is crucial due to its lowest scatter index and minimal prediction errors. However, for applications prioritizing a strong correlation with measured signals, the Cost231-Hata or Okumura-Hata could be viable alternatives, considering trade-offs with error metrics.
7.1.2 Understanding Signal Attenuations in the O2O Environment
In an O2O environment for ZigBee networks, maintaining signal strength over long distances is compounded by external factors such as sudden climate changes and the increased distances between the router and the coordinator. These factors collectively degrade the signal strength, requiring inclusive analysis within these devices. Analyzing the performance of all six path-loss models along with the six performance metrics leads to an effective model that reduces the signal attenuation between devices.
The evaluation of these models reveals that the Cost231-Hata model, with an R2 value of 0.906, exhibits the highest R2 value, indicating its effectiveness in predicting signal strength. Although, it is necessary to analyze all the performance metrics to determine the most suitable model. The Cost231-Hata model got relatively low error metrics, including NRMSE as 0.136, MSE as 6.747, MAPE as 1.279, MAD as 6.872, and SI as 2.592, suggesting its robustness in this environment. The Okumura-Hata model, with an R2 value of 0.900, presents higher error rates compared to the Cost231-Hata model, with NRMSE as 1.266, MSE as 463.339, MAPE as 30.529, MAD as 56.950 and SI as 1.802. This indicates a trade-off between its R2 value and error rates, suggesting a need for a balanced approach in model selection. The Free space model, with an R2 value of 0.893, shows higher error rates than the Cost231-Hata model but lower error rates than the Okumura-Hata model with NRMSE as 0.358 MSE as 46.408 MAPE as 3.926 MAD as 18.023 and SI as 3.470. This model’s performance suggests a middle ground between the Cost231-Hata and Okumura-Hata models, indicating its potential as a viable alternative. The Egli model, with an R2 value of 0.891, exhibits high error rates across all metrics, making it less effective than the Cost231-Hata and Okumura-Hata models. Specifically, the Egli model’s NRMSE is 0.821, MSE is 243.87, MAPE is 4.725, MAD is 41.316, and SI is 2.249. The Ericsson model, with the lowest R2 value of 0.866, also shows high error rates across all metrics, making it the least effective among the models evaluated. The specific metric values for the Ericsson model are NRMSE 0.136, MSE 6.738, MAPE 1.084, MAD 6.868, and SI 0.902. These values underscore the model’s inefficiency in assuring signal attenuation between devices. Accordingly, the Cost231-Hata model is suggested as the most suitable model for an O2O environment in the ZigBee network. The Free space model, while having higher error rates than the Cost231-Hata model, presents better performance than the Egli and Okumura-Hata models as an alternative model. The least effective model among all is the Ericsson model, with the lowest R2 value and higher rate across all metrics. To ensure reliable communication, choose the most appropriate path-loss model with the highest R2 values and the lowest error rates across all metrics.
7.2 Analysis of LoRa Performance
7.2.1 Understanding Signal Attenuations in the I2O Environment
The rapid growth of the IoT is significantly advancing, with LPWAN technologies, such as LoRaWAN, playing a pivotal role in connecting battery-powered devices. Particularly within the I2O environment, the study of communication within the LoRaWAN protocol network to achieve proper signal attenuation among LoRaWAN devices presents a complex challenge. This analysis aims to address all the challenges in signal propagation within the I2O environment and investigate the effect of various path-loss models and other performance metrics to suggest the most appropriate model.
In evaluating various path-loss models in the I2O environment, the Cost231-Hata model has the greatest R2 value of 0.917, indicating its potency in predicting signal strength. Nevertheless, performance metrics must be considered in order to choose the most appropriate model. The Cost231-Hata model also presents the strongest lowest error metrics, including NRMSE as 0.01, MSE as 0.133, MAPE as 0.054, MAD as 3.347, and SI as 0.398, which underscores its suitability for the I2O environment. The Okumura-Hata model, with an R2 value of 0.910, exhibits error rates higher than those of the Cost231-Hata model, with an NRMSE as 0.06, MSE as 17.42, MAPE as 1.175, MAD as 38.252 and SI as 5.108. These values suggest a trade-off between the R2 values and error rates of metrics, which advised the need for a balanced approach in model selection. The Free space model achieves an R2 value of 0.909; it exhibits more error compared to the Cost231-Hata model and less error compared to the Okumura-Hata model. Specifically, it has NRMSE as 0.02, MSE as 2.991, MAPE as 0.308, MAD as 15.850, and SI as 2.116. The Free space model positions between the Cost231-Hata and Okumura-Hata models regarding error, indicating its potential as a viable alternative for applications prioritizing accuracy and simplicity. Although the Egli model achieves a high R2 value of 0.907, it exhibits higher error rates across all metrics than the Cost231-Hata and Okmura-Hata models. This suggests that the Egli model might be a less suitable choice. The Egli model’s specific metric values are NRMSE as 0.03, MSE as 4.950, MAPE as 0.249, MAD as 20.391, and SI as 2.723. These metrics indicate lower efficiency in predicting signal attenuation between devices. Therefore, it is crucial to prioritize models with a balance of high R2 values and low error metrics for optional performance in device communication. Among the evaluated models, the Ericsson model exhibits the lowest R2 value of 0.901 and the highest error rates across all performance metrics. This suggests that the Ericsson model is the least effective for predicting signal attenuation. Specifically, it has an NRMSE of 0.08, MSE of 40.93, MAPE of 0.514, MAD of 58.642, and SI of 7.831. Due to these high error rates, the Ericsson model is not recommended for applications requiring reliable communication between devices. Based on the analysis, the Cost231-Hata model emerges as the most recommended path-loss model for the I2O environment within the LoRaWAN networks. It achieves the highest R2 value, indicating a strong correlation with measured signals while exhibiting lower error rates across all performance metrics, including NRMSE, MSE, MAPE, MAD, and SI. This combination makes it the most effective model for predicting signal strength in these scenarios. The Free space model recorded higher error rates than the Cost231-Hata model, but its performance is better than the Egli and Okumura-Hata models, suggesting an alternative model. The Ericsson model is the least effective model with the lowest R2 value and higher error rates among all performance metrics.
7.2.2 Understanding Signal Attenuations in the O2O Environment
The IoT relies on reliable communication between devices. This is especially critical in LoRaWAN networks and LPWAN communication, where O2O communication is crucial for various applications. LoRaWAN networks are known for their lower power consumption and long-range communication capacities, often powered by batteries. However, in the O2O environment, external factors like sudden climate change can weaken the signal strength and disrupt reliable communication. This investigation of different path-loss models and their performance metrics aims to furnish a thorough understanding of selecting the most efficient model for reliable communication between devices in LoRa O2O environments.
The analysis of these models in the O2O environment reveals the Cost231-Hata model as the most effective for predicting signal strength. This is due to its combination of a high R2 value of 0.980, indicating a strong correlation with the measured signals and lower error metrics across all categories, NRMSE as 0.004, MSE as 0.289, MAPE as 0.210, MAD as 3.806, and SI as 0.400. Therefore, the Cost231-Hata model is recommended for this O2O environment. The Okumura-Hata model, with an R2 value of 0.978, exhibits higher error rates than the Cost231-Hata model. This is evident in its NRMSE as 0.047, MSE as 27.807, MAPE as 27.494, MAD as 37.287, and SI as 3.927. The Ericsson model with an R2 value of 0.959 also shows high error rates across all metrics, making it the least effective among the models evaluated. The specific metric values for the Ericsson model are NRMSE as 0.026, MSE as 8.685, MAPE as 0.685, MAD as 20.839, and SI as 2.194. The Egli model, despite achieving a relatively high R2 value of 0.954, also exhibits higher error rates across all metrics compared to the Cost231-Hata and Okumura-Hata models. This is evident in its NRMSE as 0.007, MSE as 0.617, MAPE as 0.243, MAD as 5.556, and SI as 0.5585, indicating it might be less effective for accurate signal prediction. The Free space model, with an R2 value of 0.906, exhibits r error rates higher than the Cost231-Hata model but lower error rates than the Okumura-Hata models. This is reflected in NRMSE as 0.006, MSE as 0.482, MAPE as 0.280, MAD as 4.913, and SI as 0.517. Hence, the Free space model positions itself between the Cost231-Hata and Okumuura-Hata models in terms of error, potentially making it a viable alternative for applications that prioritize a balance between accuracy and simplicity. Based on this analysis, the Cost231-Hata model is the most suitable choice for O2O environments within LoRaWAN networks. This is because it achieves the highest R2 value, indicating a strong correlation with the measured signals, while exhibiting lower rates across all performance metrics, including NRMSE, MSE, MAPE, MAD, and SI. This combination suggests its effectiveness in accurately predicting signal strength. The Free space model, although exhibiting higher error rates than the Cost231-Hata model, offers better performance than the Egli and Okumura-Hata models. Therefore, it can be considered a viable alternative, particularly for applications prioritizing accuracy and simplicity. Finally, the Ericsson model demonstrates the lowest R2 value and the highest error rates across all metrics. This suggests that it is the least effective model among those evaluated for predicting signal attenuation in LoRa O2O environments.
7.3.1 Range Test of Signal Coverage in I2O and O2O for ZigBee Networks
This section outlines the ZigBee Range test, which evaluated performance in both I2O and O2O scenarios. Prior to the field test, the router and coordinator were configured. For the indoor setup, the coordinator was positioned in a fixed location within a mining conference area, while the router was relocated to various reference points within the mine area. The RSSI decreased as the distance between the transmitter and the receiver increased. The overall signal packets were successfully received up to a distance of 58 m.
In the O2O environment, the transmitter and receiver were strategically placed in open areas within the mine. The transmitter was stationed at a single, fixed reference point, while the receiver was relocated to various points until a signal null was observed between the two devices. The coverage range was approximately 210 m between both the transmitter and receiver. The coverage strength in O2O scenarios was noted through observation, as it contains several obstacles between the transmitter and the receiver.
7.3.2 Range Test of Signal Coverage in I2O and O2O for LoRaWAN Networks
The study explores the capabilities of LoRaWAN technology in enhancing long-range communication within both the I2O and O2O environments. A range test was conducted to demonstrate LoRa’s potential in Long Range communication. In the I2O scenario, the transmitter and receiver were configured according to the selected parameters. The transmitter was positioned at a fixed location within a mine conference area, while the receiver was moved to various distances to observe the RSSI values across different location points. The results showed that LoRaWAN can maintain signal coverage between the transmitter and receiver, covering a distance of 750 m in the I2O scenario.
For the O2O scenario, a similar configuration was employed to determine the coverage range between the transmitter and the receiver. The transmitter was fixed in a specific location within the mine area, and the receiver was moved to different locations until the signal broke. The findings indicated that Lora could cover up to 2100 m in the O2O scenario. This difference in coverage is attributed to the absence of obstacles in the O2O environment that can degrade signal strength, unlike in the I2O scenario, where physical barriers may interface with the signal.
7.4 Evaluative Performance Comparison for ZigBee and LoRa
The performance of various path loss models was evaluated for ZigBee and LoRa in both I2O and O2O mining environments. Table 6 lists a comparative analysis of these models, which provides insights into how each model predicts signal strength, offering valuable information for optimizing ZigBee network design and performance. The Cost231-Hata model is the most accurate predictor of signal attenuation, with an outstanding R2 value of 0.906 and the least NRMSE, MSE, MAPE, and MAD across both settings. Despite the Egli Okumura-Hata models exhibiting comparable R2 values, their higher error metrics indicate less reliable predictions. Table 7 shows a detailed comparison of path-loss models suitable for LoRa communication to understand the effectiveness of each model in predicting signal propagation for LoRa networks. The Cost231-Hata model again demonstrates superior performance, achieving the highest R2 value of 0.980 and minimal error metrics in both I2O and O2O environments. The Egli model also exhibits excellent performance with an R2 value of 0.954 and lower error metrics, suggesting the next alternative model for path loss prediction in these settings.


The research comprehensively assesses the significance of various insights into optimizing wireless communication in mines to enhance signal attenuation in challenging environments. It conducts the performance comparison between the ZigBee and LoRa protocols in I2O and O2O mining scenarios.
• For the ZigBee field test, the parameters were set to operate under the IEEE 802.15.4 standard, utilizing a frequency of 2.4 GHz, a transmitted power of 5 dBm, and a power gain of 1.8 dBm. The RSSI values were collected within the range of −32 to −100 dBm over a distance of 58 m in the I2O environment. In the O2O environment, the RSSI values ranged from −36 and −100 dBm over a distance of 210 m. As the distance between the transmitter and receiver increases, there is a corresponding decrease in the RSSI values.
• In contrast, for the LoRa Field test, the setup involved different criteria, specifically a frequency of 868 MHz, a bandwidth of 125 KHz, a coding rate of 4/5, an SF of 7, a transmitter power of 14 dBm, and a power gain of 6 dBm. The RSSI values observed in the I2O environment fall within the −51 to −132 dBm over a distance of 750 m. Similarly, in the O2O environment, the RSSI values were recorded between −14 and −125 dBm over 2100 m. As distances from the transmitter to the receivers increase, the RSSI value decreases, indicating degradation in signal strength at the receiver’s antenna.
• In order to assess signal attenuation, a robust framework of various path-loss models, including Free space, Egli, Okumura-Hata, Cost231-Hata, and Ericsson models, was examined using an experimental setup of actual and predicted path-loss values.
• To determine the most efficient path-loss model, a set of performance metrics, including RMSE, R2, NRMSE, MSE, MAPE, and MAD, was reinforced to assess the accuracy and reliability of the path-loss model.
• All the path-loss models were framed for a thorough analysis by plotting different graphical representations for the ZigBee and LoRa protocols in I2O and O2O scenarios.
• For the ZigBee network, the Cost231-Hata model emerged as the most accurate predictor of signal attenuation, achieving the highest R2 value of 0.906 and the least NRMSE, MSE, MAPE, and MAD for both settings. The other models gained comparable R2 values, but their higher error metrics suggest less reliable ZigBee predictions.
• For the LoRa network, the Cost231-Hata model achieved a high R2 value of 0.980 and minimal error metrics in both settings. The Egli model also achieved the next highest R2 value of 0.954 with lower error metrics, serving as an alternative model.
• These findings contribute to the understanding of optimizing the deployment of ZigBee and LoRa in mining environments, particularly in path-loss modeling.
While traditional Path Loss models like the Cost231-Hata model excel in static analysis, the future of optimized mining communication lies in embracing the dynamic capabilities of Machine learning algorithms. These algorithms can leverage vast datasets and diverse performance metrics to unlock new advances, including real-time path loss predictions that dynamically adjust to factors like tunnel closures, machinery activity, and weather changes. ML can also accelerate prediction speed and accuracy, streamline investigation steps through automation, and generate customized communication solutions tailored to specific mining layouts.
Acknowledgement: The authors would like to express their profound gratitude to the authorities of Tadicherla Open-Cast Coal Mine and Associated Cement Companies (ACC), particularly those managing the mine operations in India. Their generous permission and unwavering support have facilitated our research endeavors. This collaboration has provided us with invaluable opportunities to conduct extensive field range tests within various environmental settings, including Indoor-to-Outdoor (I2O) and Outdoor-to-Outdoor (O2O) scenarios. Such access has significantly contributed to our ability to explore the physical coverage potential and signal attenuation characteristics of ZigBee and LoRa technologies. Navigating unfamiliar mining environments presented unique challenges, yet your moral and logistical support enabled us to select optimal locations for our receivers and transmitters confidently. Your assistance has been crucial in overcoming these obstacles, allowing us to successfully optimize the network implementation for ZigBee and LoRaWAN technologies.
Funding Statement: The authors received no specific funding for this study.
Author Contributions: The authors confirm contribution to the paper as follows: study conception and design: Prashanth Ragam, Bhanu Pratap Reddy Bhavanam; data collection: Bhanu Pratap Reddy Bhavanam; analysis and interpretation of results: Bhanu Pratap Reddy Bhavanam; draft manuscript preparation: Bhanu Pratap Reddy Bhavanam. All authors reviewed the results and approved the final version of the manuscript.
Availability of Data and Materials: The devices mentioned in this manuscript are commercially available and can be purchased. The specific data collected during our study are not provided within this manuscript. However, upon reasonable request, the corresponding author will make the data available to researchers interested in conducting further analysis using the described methodologies.
Ethics Approval: Not applicable.
Conflicts of Interest: The authors declare no conflicts of interest to report regarding the present study.
References
1. Deb M, Sarkar SC, Deb M, Sarkar SC. Mines and minerals sector in India and its regulatory regime. In: Minerals and allied natural resources and their sustainable development: principles, perspectives with emphasis on the Indian scenario. Singapore: Springer; 2017. p. 489–518. [Google Scholar]
2. Dienenthal A. A short history of the development of tapping equipment. Furn Tap. 2014 May;2014:203–16. [Google Scholar]
3. Singh RR. Quality and performance of permitted explosives and detonators used in SCCL mines in India. Int J Aspects Min Miner Sci. 2020;4(3):495–503. doi:10.31031/AMMS.2020.04.000587. [Google Scholar] [CrossRef]
4. Saha NC, Saha D. Impact of coal mining on ambient air in respect of global warming: a critical approach. Indones J Soc Environ Issues. 2023 Apr 28;4(1):12–24. doi:10.47540/ijsei.v4i1.707. [Google Scholar] [CrossRef]
5. Luo Y. Environmental problems in the mining of metal minerals. InIOP Conf Series: Earth Environ Sci. 2019 Nov 1;384(1):12195. [Google Scholar]
6. Mhlongo SE. Physical hazards of abandoned mines: a review of cases from South Africa. Extractive Ind Soc. 2023 Sep 1;15:101285. doi:10.1016/j.exis.2023.101285. [Google Scholar] [CrossRef]
7. Murlidhar BR, Nguyen H, Rostami J, Bui X, Armaghani DJ, Ragam P, et al. Prediction of flyrock distance induced by mine blasting using a novel Harris Hawks optimization-based multi-layer perceptron neural network. J Rock Mech Geotechnical Eng. 2021 Dec 1;13(6):1413–27. doi:10.1016/j.jrmge.2021.08.005. [Google Scholar] [CrossRef]
8. Vitturi S, Zunino C, Sauter T. Industrial communication systems and their future challenges: next-generation Ethernet, IIoT, and 5G. Proc IEEE. 2019 May 15;107(6):944–61. doi:10.1109/JPROC.2019.2913443. [Google Scholar] [CrossRef]
9. Evans D. The internet of things–how the next evolution of the internet is changing everything. In: White Paper. Cisco Internet Business Solutions Group (IBSG); 2011; p. 1–12. [Google Scholar]
10. Poursafar N, Alahi MEE, Mukhopadhyay S. Long-range wireless technologies for IoT applications: a review. In: 2017 Eleventh International Conference on Sensing Technology (ICST), 2017; Sydney, Australia: IEEE. [Google Scholar]
11. Rodrigues JJ, Segundo DBDR, Junqueira HA, Sabino MH, Prince RM, Al-Muhtadi J, et al. Enabling technologies for the internet of health things. IEEE Access. 2018;6:13129–41. doi:10.1109/ACCESS.2017.2789329. [Google Scholar] [CrossRef]
12. Gandhi DA, Ghosal M. Intelligent healthcare using IoT: a extensive survey. In: 2018 Second International Conference on Inventive Communication and Computational Technologies (ICICCT), 2018; Coimbatore,India: IEEE; p. 800–2. [Google Scholar]
13. Kodali RK, Yerroju S, Sahu S. Smart farm monitoring using lora enabled IoT. In: 2018 Second International Conference on Green Computing and Internet of Things (ICGCIoT), 2018; Bangalore, India: IEEE; p. 391–4. [Google Scholar]
14. Kevin I, Wang K, Wu S, Ivoghlian A, Salcic Z, Austin A, et al. LWS: a LoRaWAN wireless underground sensor network simulator for agriculture applications. In: 2019 IEEE SmartWorld, Ubiquitous Intelligence & Computing, Advanced & Trusted Computing, Scalable Computing & Communications, Cloud & Big Data Computing, Internet of People and Smart City Innovation (SmarWorld/SCALCOM/UIC/ATC/CBDCom/IOP/SCI), 2019; Leicester, UK: IEEE; p. 475–82. [Google Scholar]
15. Sisinni E, Saifullah A, Han S, Jennehag U, Gidlund M. Industrial internet of things: challenges, opportunities, and directions. IEEE Trans Ind Inform. 2018;14(11):4724–34. doi:10.1109/COMST.2018.2881008. [Google Scholar] [CrossRef]
16. Li Z, Zhu Y, Zhu H, Li M. Compressive sensing approach to urban traffic sensing. In: 2011 31st International Conference on Distributed Computing Systems, 2011; Minneapolis, MN, USA: IEEE; p. 889–98. [Google Scholar]
17. Eriksson J, Girod L, Hull B, Newton R, Madden S, Balakrishnan H. The pothole patrol: using a mobile sensor network for road surface monitoring. In: Proceedings of the 6th International Conference on Mobile Systems, Applications, and Services, 2008; New York, NY, USA; p. 29–39. [Google Scholar]
18. Du R, Santi P, Xiao M, Vasilakos AV, Fischione C. The sensable city: a survey on the deployment and management for smart city monitoring. IEEE Commun Surv Tutor. 2018;21(2):1533–60. doi:10.1109/JIOT.2013.2296516. [Google Scholar] [CrossRef]
19. Jin J, Gubbi J, Marusic S, Palaniswami M. An information framework for creating a smart city through internet of things. IEEE Internet Things J. 2014;1(2):112–21. doi:10.1109/ACCESS.2020.3010032. [Google Scholar] [CrossRef]
20. Abbasi M, Khorasanian S, Yaghmaee MH. Low-power wide area network (LPWAN) for smart grid: an in-depth study on LoRaWAN. In: 2019 5th Conference on Knowledge Based Engineering and Innovation (KBEI), 2019; Tehran, Iran: IEEE; p. 22–9. [Google Scholar]
21. Lalle Y, Fourati M, Fourati LC, Barraca JP. Routing strategies for LoRaWAN multi-hop networks: a survey and an SDN-based solution for smart water grid. IEEE Access. 2021;9:168624–47. doi:10.1109/ACCESS.2021.3135080. [Google Scholar] [CrossRef]
22. Rosli AN, Mohamad R, Yusof YWM, Shahbudin S, Rahman FYA. Implementation of mqtt and lorawan system for real-time environmental monitoring application. In: 2020 IEEE 10th Symposium on Computer Applications & Industrial Electronics (ISCAIE), 2020; Malaysia: IEEE; p. 287–91. [Google Scholar]
23. Bouras C, Gkamas A, Salgado SA. Long range based IoT search and rescue system, a human-computer interaction preliminary study and implementation. Comput Netw Commun. 2023;1(1):2–16. doi:10.37256/cnc.1120231753. [Google Scholar] [CrossRef]
24. Al Mojamed M. Smart Mina: LoRaWAN technology for smart fire detection application for Hajj Pilgrimage. Comput Syst Sci Eng. 2022 Jan 1;40(1):259–272. doi:10.32604/csse.2022.018458. [Google Scholar] [CrossRef]
25. Marquet A, Montavont N, Papadopoulos GZ. Towards an SDR implementation of LoRa: reverse-engineering, demodulation strategies and assessment over Rayleigh channel. Comput Commun. 2020 Mar 1;153:595–605. doi:10.1016/j.comcom.2020.02.034. [Google Scholar] [CrossRef]
26. Colombo RM, Mahmood A, Sisinni E, Ferrari P, Gidlund M. Low-cost SDR-based tool for evaluating LoRa satellite communications. In: 2022 IEEE International Symposium on Measurements & Networking (M&N), 2022 Jul 18; Padua, Italy: IEEE; p. 1–6. [Google Scholar]
27. Goursaud C, Gorce J-M. Dedicated networks for IoT: PHY/MAC state of the art and challenges. EAI Endorsed Trans Internet Things. 2015;1(1):1–11. doi:10.4108/eai.26-10-2015.150597. [Google Scholar] [CrossRef]
28. Kartakis S, Choudhary BD, Gluhak AD, Lambrinos L, McCann JA. Demystifying low-power wide-area communications for city IoT applications. In: Proceedings of the Tenth ACM International Workshop on Wireless Network Testbeds, Experimental Evaluation, and Characterization, 2016; New York, NY, USA; p. 2–8. [Google Scholar]
29. Raza U, Kulkarni P, Sooriyabandara M. Low power wide area networks: an overview. IEEE Commun Surv Tutor. 2017;19(2):855–73. doi:10.1109/COMST.2017.2652320. [Google Scholar] [CrossRef]
30. Yasmin R, Petäjäjärvi J, Mikhaylov K, Pouttu A. On the integration of lorawan with the 5G test network. In: 2017 IEEE 28th Annual International Symposium on Personal, Indoor, and Mobile Radio Communications (PIMRC), 2017; Bologna, Italy: IEEE; p. 1–6. [Google Scholar]
31. Mikhaylov K, Petrov V, Gupta R, Lema MA, Galinina O, Andreev S, et al. Energy efficiency of multi-radio massive machine-type communication (MR-MMTCapplications, challenges, and solutions. IEEE Commun Mag. 2019;57(6):100–6. doi:10.1109/MCOM.2019.1800394. [Google Scholar] [CrossRef]
32. Al-Fuqaha A, Guizani M, Mohammadi M, Aledhari M, Ayyash M. Internet of things: a survey on enabling technologies, protocols, and applications. IEEE Commun Surv Tutor. 2015;17(4):2347–76. doi:10.1109/COMST.2015.2444095. [Google Scholar] [CrossRef]
33. Khanna A, Kaur S. Internet of things (IoTapplications and challenges: a comprehensive review. Wirel Pers Commun. 2020;114:1687–762. doi:10.1007/s11277-020-07446-4. [Google Scholar] [CrossRef]
34. Dinesh K, Gobinath M, Subathra M. A survey on intelligent internet of things-technology and its application. In: 2018 International Conference on Inventive Research in Computing Applications (ICIRCA), 2018; Coimbatore, India: IEEE; p. 81–4. [Google Scholar]
35. Pilkington K. Revolv teams up with home depot to keep your house connected. San Francisco, CA, USA: CNET—News; 2014. [Google Scholar]
36. Rushden U. Belkin brings your home to your fingertips with wemo home automation system. UK: Press Room Belkin; 2012. [Google Scholar]
37. Mekki K, Bajic E, Chaxel F, Meyer F. A comparative study of LPWAN technologies for large-scale IoT deployment. ICT Express. 2019;5(1):1–7. doi:10.1016/j.icte.2017.12.005. [Google Scholar] [CrossRef]
38. Georgiou O, Raza U. Low power wide area network analysis: can LoRa scale? IEEE Wirel Commun Lett. 2017;6(2):162–5. doi:10.1109/LWC.2016.2647247. [Google Scholar] [CrossRef]
39. Want R. An introduction to RFID technology. IEEE Pervasive Comput. 2006;5(1):25–33. doi:10.1109/MPRV.2006.2. [Google Scholar] [CrossRef]
40. McDermott-Wells P. What is Bluetooth? IEEE Potentials. 2005;23(5):33–5. [Google Scholar]
41. Ferro E, Potorti F. Bluetooth and Wi-Fi wireless protocols: a survey and a comparison. IEEE Wirel Commun. 2005;12(1):12–26. doi:10.1109/MWC.2005.1404569. [Google Scholar] [CrossRef]
42. Khan MA, Kabir MA. Comparison among short range wireless networks: bluetooth, Zig Bee & Wi-Fi. Daffodil Int Univ J Sci Technol. 2016;11(1):1–7. [Google Scholar]
43. Want R. Near field communication. IEEE Pervasive Comput. 2011;10:4–7. [Google Scholar]
44. Chilamkurthy NS, Pandey OJ, Ghosh A, Cenkeramaddi LR, Dai H-N. Low-power wide-area networks: a broad overview of its different aspects. IEEE Access. 2022;10:81926–59. doi:10.1109/ACCESS.2022.3196182. [Google Scholar] [CrossRef]
45. Yole Group. Internet of Things RF Protocols; 2019. Available from: https://medias.yolegroup.com/uploads/2019/01/YD18043-IoT_RF_Protocols_flyer_web.pdf. [Accessed 2024]. [Google Scholar]
46. Sohraby K, Minoli D, Znati T. Wireless sensor networks: technology, protocols, and applications. Hoboken, New Jersey: John Wiley & Sons; 2007. [Google Scholar]
47. Bembe M, Abu-Mahfouz A, Masonta M, Ngqondi T. A survey on low-power wide area networks for IoT applications. Telecommun Syst. 2019;71:249–74. doi:10.1109/SST49455.2020.9264085. [Google Scholar] [CrossRef]
48. Qureshi KN, Newe T, Jeon G, Chehri A. Internet of everything: evolution and fundamental concepts. In: Cybersecurity vigilance and security engineering of internet of everything. Cham: Springer Nature Switzerland; 2023. p. 3–20. [Google Scholar]
49. Truong VT, Nayyar A, Lone SA. System performance of wireless sensor network using LoRa-Zigbee hybrid communication. Comput Mater Contin. 2021;68(2):1615–35. doi:10.32604/cmc.2021.016922. [Google Scholar] [CrossRef]
50. Petäjäjärvi J, Mikhaylov K, Pettissalo M, Janhunen J, Iinatti J. Performance of a low-power wide-area network based on LoRa technology: doppler robustness, scalability, and coverage. Int J Distrib Sens Netw. 2017;13(3):1550147717699412. doi:10.1177/1550147717699412. [Google Scholar] [CrossRef]
51. de Carvalho Silva J, Rodrigues JJ, Alberti AM, Solic P, Aquino AL. LoRaWAN—a low power WAN protocol for IoT: a review and opportunities. In: 2017 2nd International Multidisciplinary Conference on Computer and Energy Science (SpliTech), 2017; Antalya: IEEE; p. 1–6. [Google Scholar]
52. Al Mojamed M. A duty cycle-based gateway selection algorithm for LoRaWAN downlink communication. Comput Syst Sci Eng. 2023 Jul 1;46(1):2953–70. doi:10.32604/csse.2023.032965. [Google Scholar] [CrossRef]
53. Ding S, Liu J, Yue M. The use of ZigBee wireless communication technology in industrial automation control. Wirel Commun Mob Comput. 2021 Dec 23;2021:8317862. doi:10.1155/2021/8317862. [Google Scholar] [CrossRef]
54. Fahama HS, Ansari-Asl K, Kavian YS, Soorki MN. An experimental comparison of RSSI-based indoor localization techniques using ZigBee technology. IEEE Access. 2023;11:87985–96. doi:10.1109/ACCESS.2023.3305396. [Google Scholar] [CrossRef]
55. Lv Z, Hu B, Lv H. Infrastructure monitoring and operation for smart cities based on IoT system. IEEE Trans Ind Inform. 2019;16(3):1957–62. doi:10.1109/TII.2019.2913535. [Google Scholar] [CrossRef]
56. Bianchi V, Ciampolini P, De Munari I. RSSI-based indoor localization and identification for ZigBee wireless sensor networks in smart homes. IEEE Trans Instrum Meas. 2018;68(2):566–75. doi:10.1109/TIM.2018.2851675. [Google Scholar] [CrossRef]
57. Wang X, Xie W, Song X, Wan T, Liu A. Grassland ecological protection monitoring and management application based on ZigBee wireless sensor network. Math Probl Eng. 2022 Apr 8;2022:1–9. doi:10.1155/2022/2623183. [Google Scholar] [CrossRef]
58. Klaina H, Guembe IP, Lopez-Iturri P, Astrain JJ, Azpilicueta L, Aghzout O, et al. Implementation of an interactive environment with multilevel wireless links for distributed botanical garden in university campus. IEEE Access. 2020 Jul 17;8:132382–96. doi:10.1109/ACCESS.2020.3010032. [Google Scholar] [CrossRef]
59. Liu Z, Li Y, Zhao L, Liang R, Wang P. Comparative evaluation of the performance of ZigBee and LoRa wireless networks in building environment. Electronics. 2022 Oct 31;11(21):3560. doi:10.3390/electronics11213560. [Google Scholar] [CrossRef]
60. Bravo-Arrabal J, Zambrana P, Fernandez-Lozano JJ, Gómez-Ruiz JA, Barba JS, García-Cerezo A. Realistic deployment of hybrid wireless sensor networks based on ZigBee and LoRa for search and Rescue applications. IEEE Access. 2022 Jun 14;10:64618–37. doi:10.1109/ACCESS.2022.3183135. [Google Scholar] [CrossRef]
61. Pereira DS, De Morais MR, Nascimento LB, Alsina PJ, Santos VG, Fernandes DH, et al. Zigbee protocol-based communication network for multi-unmanned aerial vehicle networks. IEEE Access. 2020 Mar 23;8:57762–71. doi:10.1109/ACCESS.2020.2982402. [Google Scholar] [CrossRef]
62. Faber MJ, Van der Zwaag KM, dos Santos WGV, Rocha HRDO, Segatto ME, Silva JA. A theoretical and experimental evaluation on the performance of lora technology. IEEE Sens J. 2020;20(16):9480–9. doi:10.1109/JSEN.2020.2987776. [Google Scholar] [CrossRef]
63. Svertoka E, Rusu-Casandra A, Burget R, Marghescu I, Hosek J, Ometov A. LoRaWAN: lost for localization? IEEE Sens J. 2022;22(23):23307–19. doi:10.1109/JSEN.2022.3212319. [Google Scholar] [CrossRef]
64. Kumari P, Gupta HP, Dutta T. A bayesian game based approach for associating the nodes to the gateway in LoRa network. IEEE Trans Intell Transp Syst. 2021;23(5):4583–92. doi:10.1109/TITS.2020.3046302. [Google Scholar] [CrossRef]
65. Yao Y, Chen X, Rao L, Liu X, Zhou X. LORA: loss differentiation rate adaptation scheme for vehicle-to-vehicle safety communications. IEEE Trans Veh Technol. 2016;66(3):2499–512. doi:10.1109/TVT.2016.2573924. [Google Scholar] [CrossRef]
66. Kumari P, Mishra R, Gupta HP, Dutta T, Das SK. An energy efficient smart metering system using edge computing in LoRa network. IEEE Trans Sustain Comput. 2021;7(4):786–98. doi:10.1109/TSUSC.2021.3049705. [Google Scholar] [CrossRef]
67. Baghel LK, Gautam S, Malav VK, Kumar S. TEMPSENSE: LoRa enabled integrated sensing and localization solution for water quality 24 monitoring. IEEE Trans Instrum Meas. 2022;71:1–11. doi:10.1109/TIM.2022.3175059. [Google Scholar] [CrossRef]
68. Premsankar G, Ghaddar B, Slabicki M, Francesco MDi. Optimal configuration of lora networks in smart cities. IEEE Trans Ind Inform. 2020;16(12):7243–54. doi:10.1109/TII.2020.2967123. [Google Scholar] [CrossRef]
69. Hu K, Gu C, Chen J. LTrack: a LoRa-based indoor tracking system for mobile robots. IEEE Trans Veh Technol. 2022;71(4):4264–76. doi:10.1109/TVT.2022.3143526. [Google Scholar] [CrossRef]
70. Manzano LG, Boukabache H, Danzeca S, Heracleous N, Murtas F, Perrin D, et al. An IoT LoRaWAN network for environmental radiation monitoring. IEEE Trans Instrum Meas. 2021;70:1–12. doi:10.1109/TIM.2021.3089776. [Google Scholar] [CrossRef]
71. Di Renzone G, Parrino S, Peruzzi G, Pozzebon A, Bertoni D. LoRaWA underground to aboveground data transmission performances for different soil compositions. IEEE Trans Instrum Meas. 2021;70:1–13. doi:10.1109/TIM.2021.3061820. [Google Scholar] [CrossRef]
72. Soto-Vergel A, Arismendy L, Bornacelli-Durán R, Cardenas C, Montero-Arévalo B, Rivera E, et al. LoRa performance in industrial environments: analysis of different ADR algorithms. IEEE Trans Ind Inform. 2023;19:10501–11. doi:10.1109/TII.2023.3240696. [Google Scholar] [CrossRef]
73. Branch P, Li B, Zhao K. A LoRa-based linear sensor network for location data in underground mining. Telecom. 2020;1(2):6. doi:10.3390/telecom1020006. [Google Scholar] [CrossRef]
74. RayChowdhury A, Pramanik A, Roy GC. New approach for localization and smart data transmission inside underground mine environment. SN Appl Sci. 2021;3(6):604. doi:10.1007/s42452-021-04589-2. [Google Scholar] [PubMed] [CrossRef]
75. Ebi C, Schaltegger F, Rüst A, Blumensaat F. Synchronous LoRa mesh network to monitor processes in underground infrastructure. IEEE Access. 2019;7:57663–77. doi:10.1109/ACCESS.2019.2913985. [Google Scholar] [CrossRef]
76. Xu W, Kim JY, Huang W, Kanhere SS, Jha SK, Hu W. Measurement, characterization, and modeling of LoRa technology in multifloor buildings. IEEE Internet Things J. 2019;7(1):298–310. doi:10.1109/JIOT.2019.2946900. [Google Scholar] [CrossRef]
77. Ragam P, Nimaje D. Performance evaluation of LoRa LPWAN technology for IoT-based blast-induced ground vibration system. J Meas Eng. 2019;7(3):119–33. doi:10.21595/jme.2019.20586. [Google Scholar] [CrossRef]
78. Islam R, Rahman MW, Rubaiat R, Hasan MM, Reza MM, Rahman MM. LoRa and server-based home automation using the internet of things (IoT). J King Saud Univ-Comput Inf Sci. 2022;34(6):3703–12. doi:10.1016/j.jksuci.2020.12.020. [Google Scholar] [CrossRef]
Cite This Article
 Copyright © 2025 The Author(s). Published by Tech Science Press.
This work is licensed under a Creative Commons Attribution 4.0 International License , which permits unrestricted use, distribution, and reproduction in any medium, provided the original work is properly cited.


 Submit a Paper
 Propose a Special lssue
 View Full Text
 Download PDF


 Downloads
 Citation Tools