 Open Access
ARTICLE
Effect of Process Parameters on the Agglomeration Behavior and Tensile Response of Graphene Reinforced Magnesium Matrix Composites Based on Molecular Dynamics Model
1 School of Mechanical Engineering, Northwestern Polytechnical University, Xi’an, 710072, China
2 Shanxi Key Laboratory of Fiber Reinforced Light Composite Materials, Northwestern Polytechnical University, Xi’an, 710072, China
3 Future Intelligent Wear Centre, School of Fashion and Textiles, The Hong Kong Polytechnic University, Hong Kong, 999077, China
* Corresponding Author: Jiming Zhou. Email:
(This article belongs to the Special Issue: Theoretical and Computational Modeling of Advanced Materials and Structures-II)
Computer Modeling in Engineering & Sciences 2024, 141(3), 2453-2469. https://doi.org/10.32604/cmes.2024.052723
Received 12 April 2024; Accepted 10 July 2024; Issue published 31 October 2024
Abstract
The mechanical properties of graphene reinforced composites are often hampered by challenges related to the dispersion and aggregation of graphene within the matrix. This paper explores the mechanism of cooling rate, process temperature, and process pressure’s influence on the agglomeration behavior of graphene and the tensile response of composites from a computer simulation technology, namely molecular dynamics. Our findings reveal that the cooling rate exerts minimal influence on the tensile response of composites. Conversely, processing temperature significantly affects the degree of graphene aggregation, with higher temperatures leading to the formation of larger-sized graphene clusters. In contrast, processing pressure exhibits negligible impact on the degree of graphene aggregation, and increasing pressure effectively mitigates the formation of large-sized graphene clusters. Moreover, we elucidate the intrinsic factors governing the mechanical response to variations in processing parameters. Notably, we observe that the stretching process facilitates the decomposition of large-sized graphene clusters into smaller ones. This research contributes to the advancement of lightweight metal matrix composites by offering insights into optimizing processing parameters. Additionally, it provides crucial theoretical underpinnings for developing high-performance graphene-reinforced composites.Keywords
Graphene has garnered considerable attention and research interest from scholars owing to its outstanding properties, such as excellent specific surface area, high Young’s modulus and low density, and it served as an ideal reinforcement in metal matrix composites (MMCs) [1,2]. Graphene nanoplatelets reinforced magnesium matrix composites (GNPs/Mg) have broad application prospects in the aerospace, automotive, electronics and transportation industries due to their high specific strength, dimensional stability, excellent wear resistance and shock absorption performance [3,4]. However, the mechanical properties of graphene nanocomposites are limited by the degree of dispersion and aggregation of graphene within the matrix [5].
The uniform dispersion of graphene nanoplatelets (GNPs) enhances various characteristics of the metal matrix, including changes in microstructures, crystallization temperature, and load transfer during the loading process [6,7]. Meng et al. [8] fabricated GNPs/Mg laminated composites with reinforcing phase content of 0.25 and 0.75 vol%, with tensile strengths of 160 and 179 MPa, respectively (pure magnesium is 136 MPa). Obviously, uniformly dispersed GNPs improve the material’s load transfer capability and the composites’ mechanical properties. However, the inevitable agglomeration of GNPs diminishes the strengthening efficiency. Li et al. [9] observed that graphene/aluminum composites with addition of 0.5 wt% GNPs exhibited higher strength and comparable ductility to pure aluminum, primarily due to the uniform distribution of GNPs within the aluminum matrix and the robust interfacial bonding between aluminum and GNPs. However, with increasing agglomeration of GNPs, the enhancement effect sharply decreases when exceeding 1.0 wt% of GNPs. Due to the high surface energy and large surface area of graphene, it tends to float and agglomerate during the preparation process. Hence, studying graphene’s aggregation and dispersion behavior in MMCs holds significant importance for composite preparation and performance research.
Additionally, parameters involved in preparing metal matrix composites, such as pressure and processing temperature, will greatly influence the aggregation of graphene and the performance of the composite. Insufficient hot-pressing conditions may damage graphene during the process, while inadequate pressure can hinder the construction of intimate bonding between adjacent graphene layers, leading to dispersion failure [10]. Furthermore, research indicates that as the test temperature rises, GNPs/AZ31 composites exhibit micro pores and cracks, suggesting potential enhancement of AZ31 matrix secondary processing by graphene [11]. Safina et al. [12] observed that even under high pressure of up to 500 GPa at room temperature, successful attainment of graphene/nickel matrix composites was unachievable. However, heating the temperature to nearly 1000 K and above facilitates the formation of covalent bonds between graphene and adjacent structural elements. In summary, elucidating the mechanism of process parameters’ influence on graphene aggregation during MMCs preparation is crucial.
The experimental method for producing graphene-reinforced metal matrix composites presents challenges in reproducibility due to the scattering and aggregation of graphene within the matrix. This process is characterized by lengthy cycles and high costs. As for the study of computational modelling of agglomerated graphene reinforced composites [13,14], the thermodynamic response of a porous functionally graded graphene-reinforced composite is accurately predicted through the utilization of an enhanced third-order shear deformation theory [15]. Francesco et al. [16] examined laminated anisotropic doubly-curved shell structures with variable thickness, considering both the general distribution of volume fractions of constituent materials and the presence of voids. Research indicates that an increase in the mass fraction of graphene sheets and the porosity coefficient correlates with a greater impact on the buckling load of the structure [17]. Emad et al. [18] studied the natural frequency response of nanocomposite shells by defining the agglomeration factor of graphene. Molecular dynamics (MD) simulation has emerged as a valuable tool widely employed to investigate interface behavior and predict mechanical performance in MMCs [19–21]. Xia et al. [22] employed molecular dynamics methods to uniaxially stretch single-layer graphene nanosheets for reinforcing magnesium-based composites. Their findings revealed that the incorporation of graphene nanoplatelets led to a significant enhancement in the mechanical properties of magnesium-based composites. Wang et al. [23] investigated the mechanical characteristics of multi-layer graphene incorporated within an aluminum matrix subjected to uniaxial tension. Their study demonstrated that the presence of graphene layers inhibited the propagation of dislocations across interfaces, consequently leading to notable enhancements in both the stiffness and strength of the composite. Researchers have explored the impact of the matrix orientation, graphene size, number of graphene layers and spacing on the deformation and enhancement mechanism of MMCs [24–26]. The findings demonstrate that graphene enhances the strength and toughness of the matrix while altering the deformation mechanism by controlling the dislocation. Despite existing experiments and MD simulations on graphene reinforced metal matrix composites, a comprehensive and in-depth explanation of graphene agglomeration during the preparation process and the enhancement mechanism of GNPs/Mg composites is lacking.
This study establishes various nano-scale models of GNPs/Mg and utilizes molecular dynamics simulations to investigate graphene’s dispersion and aggregation behavior within the magnesium matrix. Subsequently, we explored the influence of factors such as temperature and pressure on the tensile performance of GNPs/Mg composites. Results indicate that processing temperature significantly impacts graphene aggregation and cluster formation, whereas processing pressure has minimal effect. The increase in temperature leads to the formation of larger-sized graphene clusters, whereas increased processing pressure inhibits the generation of such clusters. Unveiling graphene’s aggregation behavior and reinforcement mechanism in composites is crucial, providing the theoretical underpinning for guiding the preparation process.
2 Molecular Dynamics Models and Methodology
This section encompasses establishing the molecular dynamics model, the employed potential function during simulation, and a comprehensive overview of the simulation process. It includes detailed information regarding pre-processing, relaxation process, constant temperature and pressure process, cooling process, and stretching simulations, along with relevant parameters and settings.
This study utilized Atomsk [27] for modeling and Lammps [28] for molecular dynamics simulation. Fig. 1a illustrates the construction of an appropriately sized graphene model. In Atomsk, an orthogonal double-layer graphene model can be directly established. However, one layer of graphene atoms must be removed from the established double-layer graphene configuration to create a single-layer graphene model. Subsequently, the single-layer graphene can be duplicated to achieve the desired size. Fig. 1b depicts the established Mg matrix model, where magnesium crystals adopt a hexagonal close-packed (HCP) structure, with the perpendicular x, y, and z axes aligned along the crystal orientation of
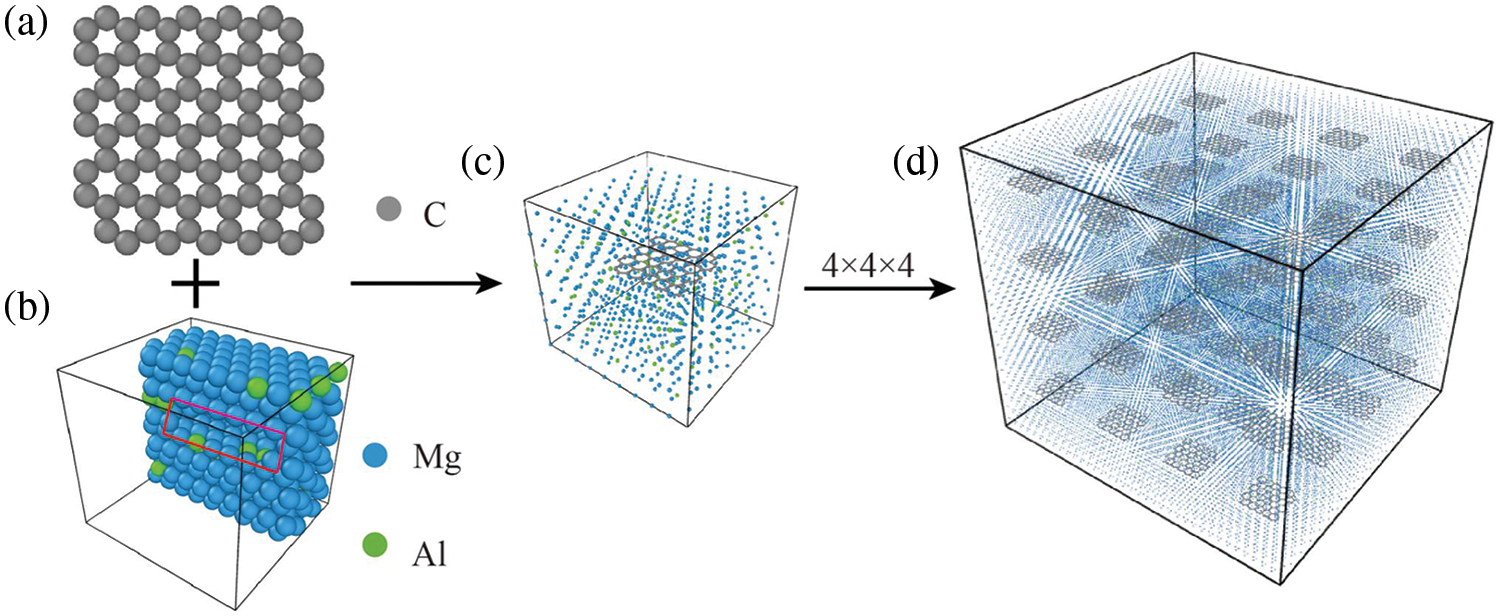
Figure 1: Molecular dynamics model establishment process of graphene sheet reinforced magnesium matrix composites. (a) Graphene, (b) Magnesium matrix containing 9% Al, (c) GNPs/Mg composite cells, (d) GNPs/Mg model
2.2 Atomic Potential Functions
The embedded atom model (EAM) potential function is widely recognized for its accurate description of metal atom interactions and is commonly employed in simulations of metal systems. In this study, the Al-Mg interactions utilize the EAM potential function developed by Mendelev et al. [29].
For hydrocarbons, the adaptive intermolecular reactive empirical bond order (AIREBO) potential function is considered one of the most precise models. The C-C interaction adopts the AIREBO potential function proposed by Stuart et al. [30] with a chosen cut-off radius of 2 Å.
The Lennard-Jones (LJ) potential function is often used to describe the interaction between atoms in the system as follows [31]:
where ε is the energy scale parameters, and σ is defined in the LJ formula as the zero-crossing distance for the potential. The interactions involving Mg-C and Al-C are described by the LJ potential, with a selected cut-off radius of 10 Å. The parameters σ and ε for Mg [32], C and Al [33] utilized to calculate σMg-C, σAl-C, εMg-C and εAl-C. Employing the Lorentz-Berthelot mixing rule, combined with relevant literature, the parameters for these interactions are determined, as outlined in Table 1.

2.3 Simulation Process Details
After establishing the model, the initial system energy was minimized using the conjugate gradient method. This minimization process was to attain a stable structure and alleviate any initial internal stress. To efficiently control the atomic interactions, a neighbor list was constructed with a skin distance of 2.0 Å, ensuring that all atom pairs within the cut-off distance were included in the list for subsequent calculations. Then, models undergo an initial relaxation process under a temperature of 300 K, utilizing a time step of 1 fs and spanning 2 × 10⁵ steps. The boundary conditions are set as periodic, and the ensemble is configured as canonical (NVT). Subsequently, the system proceeds to a constant temperature and pressure process.
In the simulation of graphene aggregation, maintaining constant temperature and pressure throughout the system over an extended duration is paramount. Kumar et al. [34] provided valuable insights into the aggregation behavior of graphene in pure Al, serving as a reference for selecting certain parameters in this study. Given that graphene aggregation is a macroscopic process, periodic boundary conditions were applied in all three directions (x, y, and z) to eliminate boundary effects within the simulation system. The NPT (constant-pressure, constant-temperature) ensemble was employed during the simulation, with the Nosé-Hoover method serving as the temperature control method and the Parrinello-Rahman barostat serving as the pressure control method. A time step of 1 fs was chosen, with a constant temperature and pressure time of 2 ns, equivalent to 2 × 10⁶ time steps, to obtain comprehensive results regarding graphene aggregation within the matrix under varying processing temperature and pressure conditions. The cooling process involves gradually lowering the temperature of the composite model to 300 K at a prescribed cooling rate. This is achieved over 2 × 10⁶ time steps, employing periodic boundary conditions and utilizing the NPT ensemble. Following the cooling process, it is imperative to subject the model to further relaxation.
In the subsequent MD simulation, the velocity-Verlet algorithm was applied for integration calculations, ensuring both accuracy and efficiency in obtaining reliable results. Stretch simulations in molecular dynamics can be executed through two methods: overall deformation and applying velocity to the free end of the system. In this work, the method of applying velocity to the free end was utilized to conduct tensile simulations. This method involves fixing the bottom atoms while imparting velocity to the top atoms along the stretching direction, thereby inducing model deformation through inter-atomic forces. Due to the stretching method employed, non-periodic boundary conditions are chosen, and the NPT ensemble is employed to control temperature and pressure, ensuring stability throughout the stretching process. The stretching temperature in the simulation was set at 300 K, with a stretching rate of 10 Å/ps. Consequently, stress and strain variations were observed, and pertinent simulation data was calculated to generate stress-strain curves. Graphene clusters are identified using a cut-off radius. The cut-off distance criterion for defect clusters is defined as follows: For interstitial atoms, the third nearest neighbor is selected, while for vacancies, the second nearest neighbor is chosen. This means that an interstitial atom and the atoms in its third nearest neighbor positions form a cluster, and similarly, a vacancy and the atoms in its second nearest neighbor positions form a cluster.
This section focuses on elucidating the impacts of cooling rate, processing temperature, and pressure on the aggregation behavior of graphene and the tensile response of GNPs/Mg. It primarily encompasses the assessment of graphene distribution state, the processed final model, radial distribution function (RDF) analysis, tensile stress-strain diagrams, and snapshots analysis.
3.1 Effect of Cooling Rates on Graphene Agglomeration Behavior and Tensile Response
In this section, the GNPs/Mg model undergoes a simulation at 0 MPa and 900 K for 2 ns, followed by a cooling process to reach 300 K. The cooling rates considered are 0.5, 1, 5, and 10 K/ps. The final model obtained after cooling is shown in Fig. 2. Given that the simulation is conducted at 900 K, atoms within the model transition from a liquid to a solid state, making it challenging for graphene to aggregate further. Consequently, the four models depicting graphene aggregation in Fig. 2 exhibit similarities. The results indicate that the cooling rate has minimal influence on the final distribution of graphene within the matrix. At lower cooling rates, the degree of graphene aggregation exhibits minimal variation; however, at higher cooling rates, the extent of graphene aggregation becomes more pronounced.

Figure 2: The final model at 300 K obtained at different cooling rates under 900 K and 0 MPa. (a) 0.5 K/ps, (b) 1 K/ps, (c) 5 K/ps, (d) 10 K/ps. Blue, yellow, and red atoms correspond to Mg, Al, and C atoms, respectively
Fig. 3 presents the stress-strain curve, strength and modulus curves of the model following cooling at various rates. The tensile stress-strain curve of the GNPs/Mg model post-simulation differs from its initial processing state. Specifically, the peak value transitions from a double peak to a single peak, while both the strength and modulus experience significant decreases.Additionally, the strain at which the model reaches its tensile strength decreases approximately to 0.07. This deviation in behavior can be attributed to several factors. Firstly, graphene, being randomly distributed within the matrix, fails to exert its load transfer effect fully. Secondly, structural changes inevitably occur within the matrix post-simulation, further contributing to the observed reduction in strength and modulus. Consequently, the characteristics displayed by the stress-strain curve post-simulation differ notably from those of the uniaxial tensile stress-strain curve exhibited by the processing model.
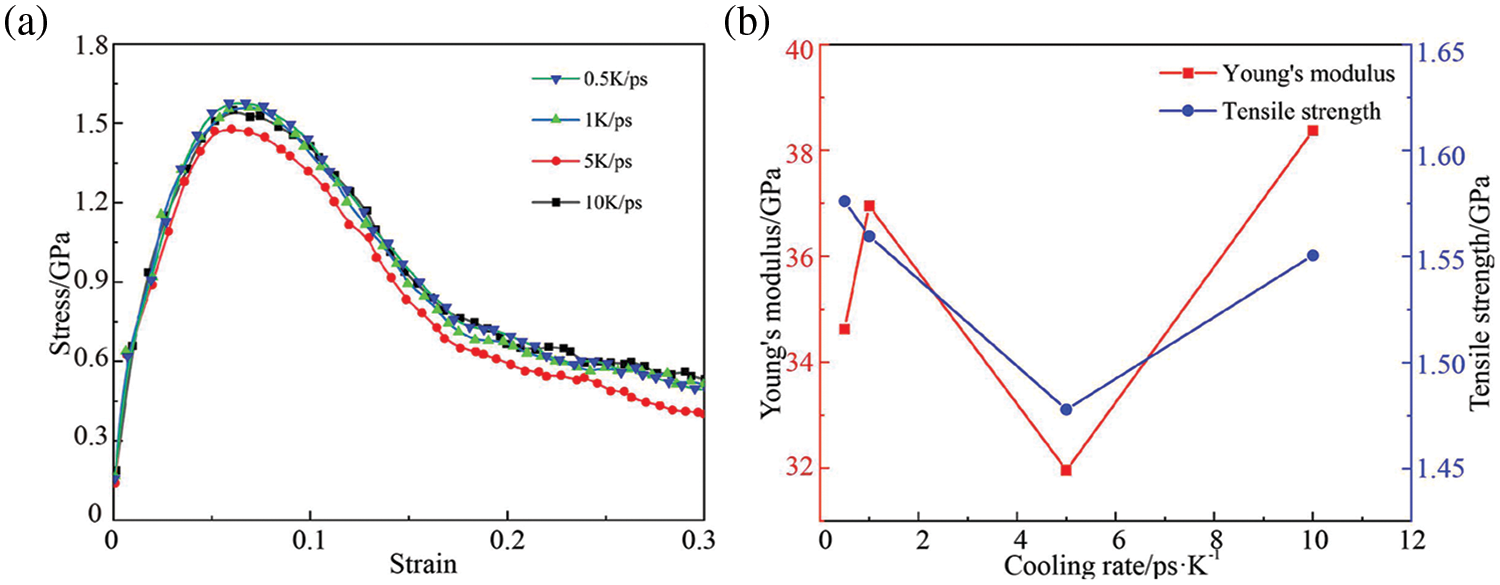
Figure 3: Tensile response of GNPs/Mg model under different cooling rates. (a) Stress-strain curves, (b) Strength and Young’s modulus curves
As the cooling rate increases, the strength and modulus of GNPs/Mg exhibit numerical similarity with slight fluctuations. Specifically, the strength initially decreases before showing a subsequent increase, while the change in modulus lacks a discernible pattern. Overall, both the strength and modulus fluctuate around a certain value as the cooling rate varies. The investigation revealed that varying the cooling rate from 0.5 to 10 K/ps has a negligible impact on the tensile response after the model undergoes cooling. Therefore, a cooling rate of 10 K/ps was deemed appropriate in the subsequent research, balancing computational cost and simulation accuracy to expedite simulation time.
3.2 Effect of Temperature on Graphene Agglomeration Behavior and Tensile Response
Temperature significantly influences the aggregation behavior of graphene within the matrix. The GNPs/Mg composite model, containing 9% Al, was used to simulate the graphene aggregation phenomenon at different processing temperatures. The melting point of magnesium and common alloys ranges from 923 to 973 K, but temperature can reach 1000 to 1100 K during the preparation of metal matrix composites [35–38]. Fig. 4 illustrates the aggregation of the GNPs/Mg model over a 2 ns period under 0 MPa pressure at temperatures of 900, 1000, and 1100 K. To facilitate clearer observation of graphene aggregation within the composites, the matrix in the GNPs/Mg composite was removed.
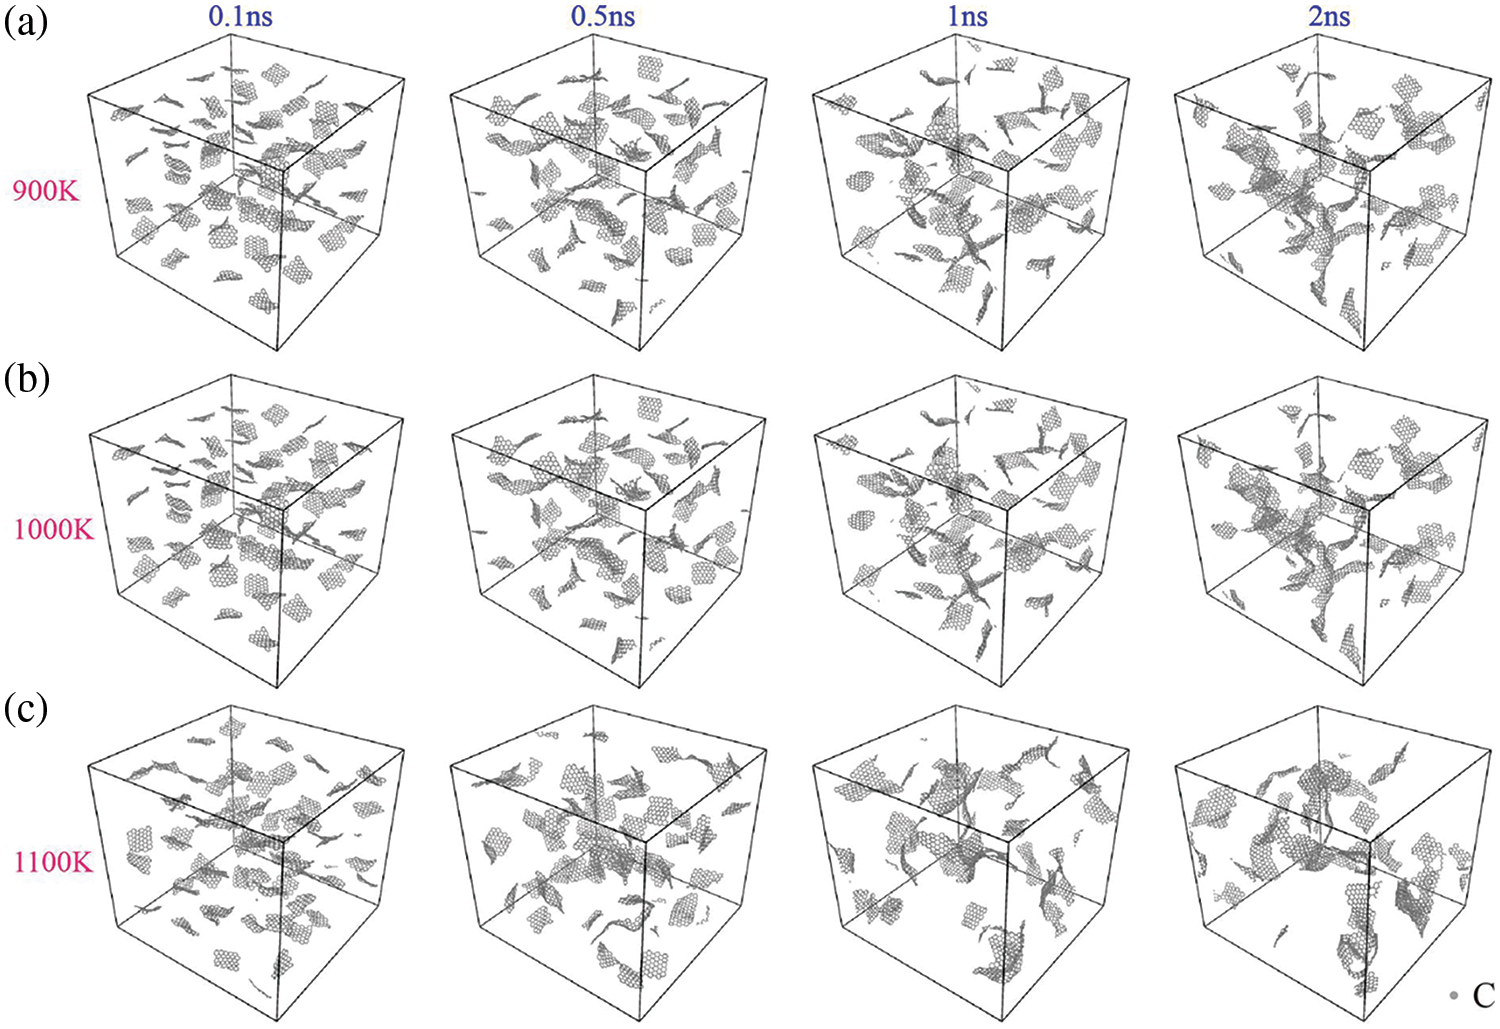
Figure 4: Distribution of graphene in Mg matrix at different temperatures. (a) 900 K, (b) 1000 K, (c) 1100 K
At 900 K (Fig. 4a), the matrix initially has no discernible graphene aggregation. However, at t = 0.5 ns, some graphene sheets begin to form covalent bonds and connect. Over time, the number of interconnected graphene sheets increases in the central area of the model, with a tendency for further aggregation observed at t = 1 ns and t = 2 ns. At 1000 K (Fig. 4b), a significantly higher number of graphene sheets form covalent bonds and connect compared to 900 K, and there is a tendency for further agglomeration. Multiple sheets of graphene begin to interconnect at t = 0.1 ns, with further connections observed between graphene sheets from t = 0.5 to 1 ns. When the temperature is raised to 1100 K (Fig. 4c), evident graphene aggregation occurs. At 0.1 to 1 ns, From t = 0.1 to 1 ns, graphene sheets connect due to newly formed covalent bonds, increasing the number of interconnected graphene sheets. Notably, graphene exhibits conspicuous aggregation within the matrix, with some sheets even curling up to form complex three-dimensional structures by t = 2 ns.
Fig. 5 presents the radial distribution function (RDF) of GNPs/Mg composites across varying temperatures. RDF analysis is a widely employed method in molecular dynamics simulations to elucidate the spatial distribution between atoms or molecules. Notably, the parameter r ≈ 1.42 Å signifies the presence of carbon-carbon bonds within graphene. As temperature rises, a notable decline is observed in the peak value of graphene within the RDF plot. This decline reflects the rupture of covalent C-C bonds within graphene, indicating an escalation in graphene defects with increasing temperature. Conversely, as temperature decreases, the atomic distribution of the composite tends to densify within a proximity of 1.4 Å from graphene and within the defined cut-off distance of 3.4 Å.
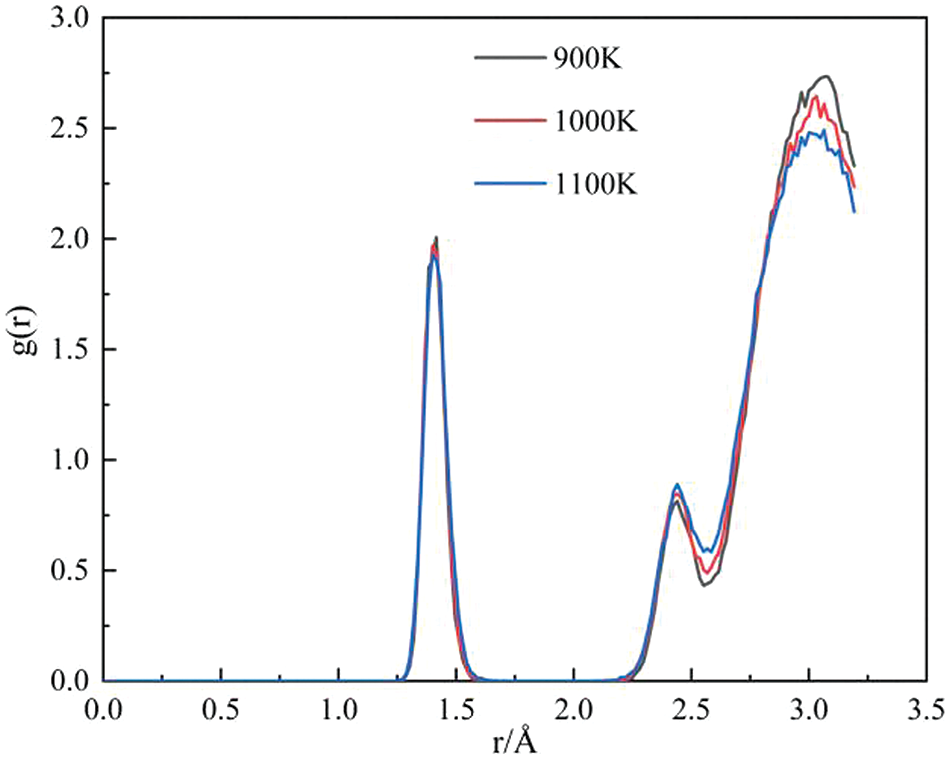
Figure 5: RDFof GNPs/Mg composites at different temperatures
The GNPs/Mg model undergoes cooling to 300 K at various initial processing temperatures after 2 ns simulation, with a cooling rate of 10 K/ps. The resultant model at normal temperature following cooling at different processing temperatures is depicted in Fig. 6. It becomes apparent that the degree of graphene aggregation intensifies as the processing temperature increases. Notably, in models processed at higher temperatures, larger holes and defects become evident, as depicted in Fig. 6c.

Figure 6: Final model of GNPs/Mg model cooled at different processing temperatures after 2 ns. (a) 900 K, (b) 1000 K, (c) 1100 K
The GNPs/Mg model was stretched after cooling at different processing temperatures, and the stress-strain curves, strength and modulus curves of the stretch simulation at 300 K are illustrated in Fig. 7. When the processing temperature ranges from 900 to 1100 K, there emerges a trend wherein the modulus of GNPs/Mg initially decreases before subsequently increasing as the temperature rises. Additionally, the stress and strain results of the GNPs/Mg model at 1200 K were incorporated into the strength-modulus curve. Remarkably, despite the rise in processing temperature, the strength and modulus of the composites continued to exhibit an upward trend. The observed reduction in composite strength can be attributed to the augmentation of graphene defects induced by the processing temperature (Fig. 5).
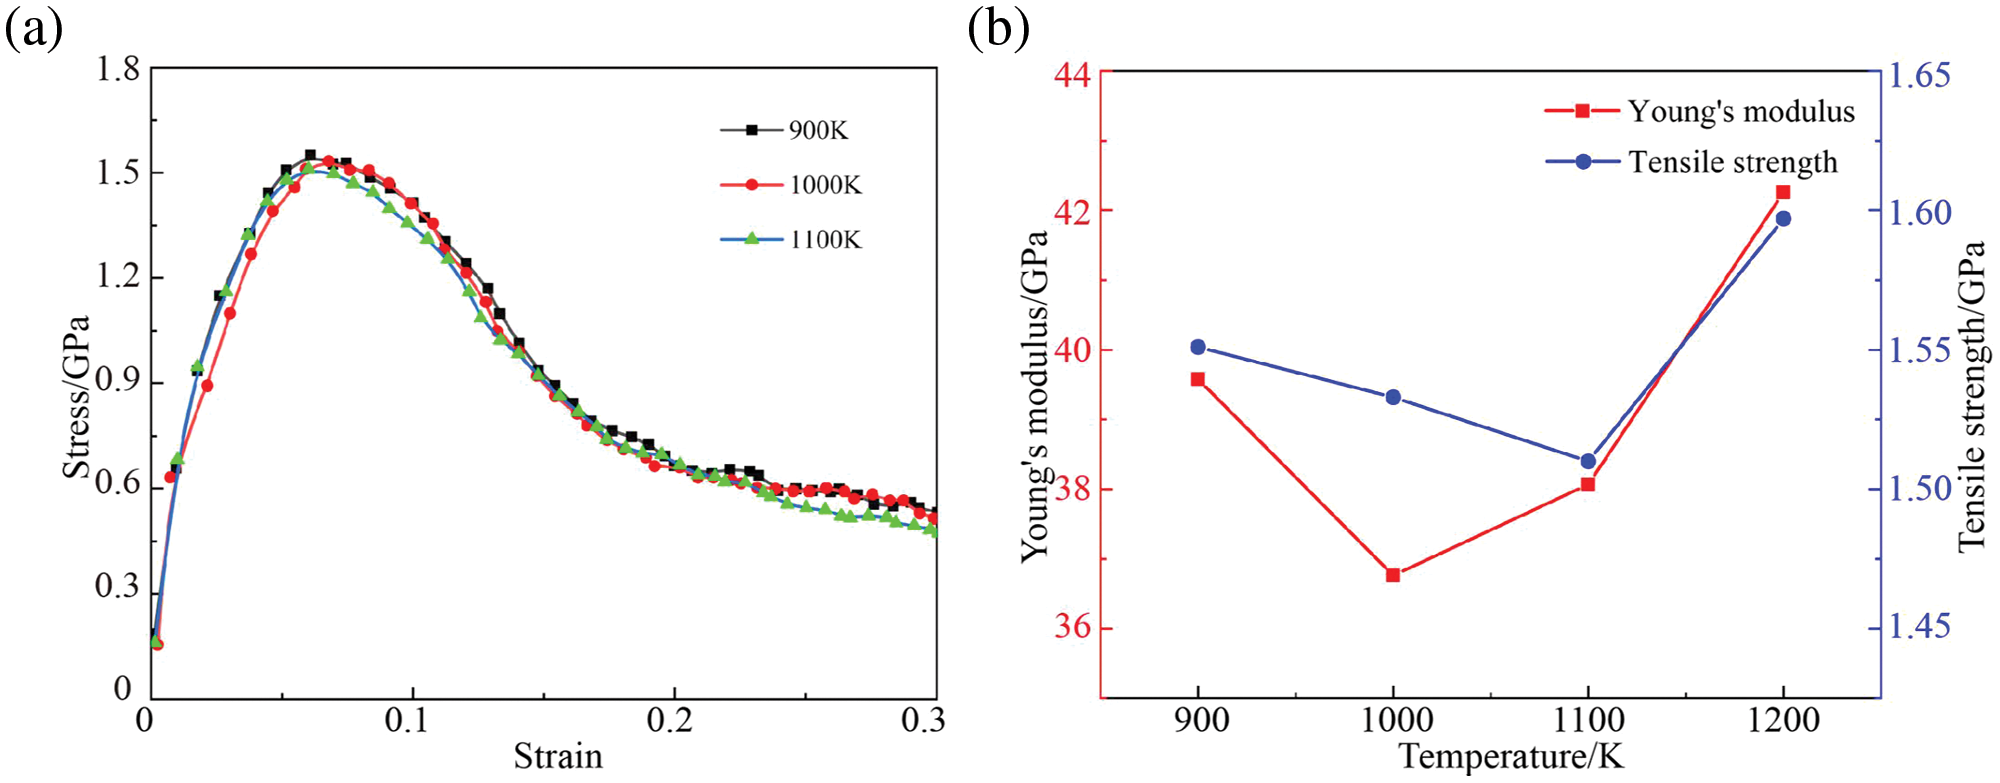
Figure 7: Tensile response of GNPs/Mg model under different temperatures. (a) Stress-strain curves, (b) Strength and Young’s modulus curves
Fig. 8a depicts the relationship between size and the number of graphene clusters at the strain corresponding to the tensile strength (0.07) across various processing temperatures. Notably, at lower processing temperatures, the clusters primarily manifest within smaller-sized clusters. In the study of graphene-reinforced aluminum matrix composite samples prepared within the temperature range of 953 to 1023 K, it was observed that with increasing processing temperature, the agglomeration of graphene became progressively more pronounced [39]. This observation is consistent with the simulation results, showing that as the temperature increases, the agglomeration of graphene becomes increasingly severe. This leads to the formation of distinct regions within the sample: areas where graphene is heavily concentrated and areas where it is sparse. The graphene tends to concentrate in the middle of the sample, leaving the rest as the dilution area. However, increasing processing temperature makes larger clusters more prevalent within graphene. Fig. 8b reveals that the number of clusters within smaller graphene increases as the stretching process advances. The reduction of large-sized graphene clusters indicates that the stretching process can promote the decomposition of large-sized graphene. In other words, larger defect clusters are caused by excessively high processing temperatures (Fig. 8c–e). This observation aligns with the findings in Fig. 5, wherein higher temperatures lead to a decrease in the peak of graphene at 1.4 Å, indicative of a heightened generation of defects. Furthermore, snapshots suggest that the stretching process does not exacerbate graphene aggregation but will disperse the graphene with a higher degree of aggregation. The mechanisms underlying the decomposition of large-sized graphene clusters into smaller counterparts are as follows: (1) Structural alterations within graphene clusters can modify atomic interactions, potentially resulting in the rupture or rearrangement of bonds within the clusters, thus prompting fragmentation into smaller entities. (2) External stress may induce localized stress concentrations within graphene clusters, leading to deformation or structural breakdown at the atomic level, ultimately resulting in cluster disintegration. (3) Localized heating within graphene clusters, induced by external forces, may trigger thermal activation, thereby enhancing atomic mobility within the clusters [40]. This heightened mobility can lead to bond breakage and subsequent disintegration of the clusters. Notably, as temperature increases, the dispersion of graphene with high aggregation becomes more pronounced during the stretching process.
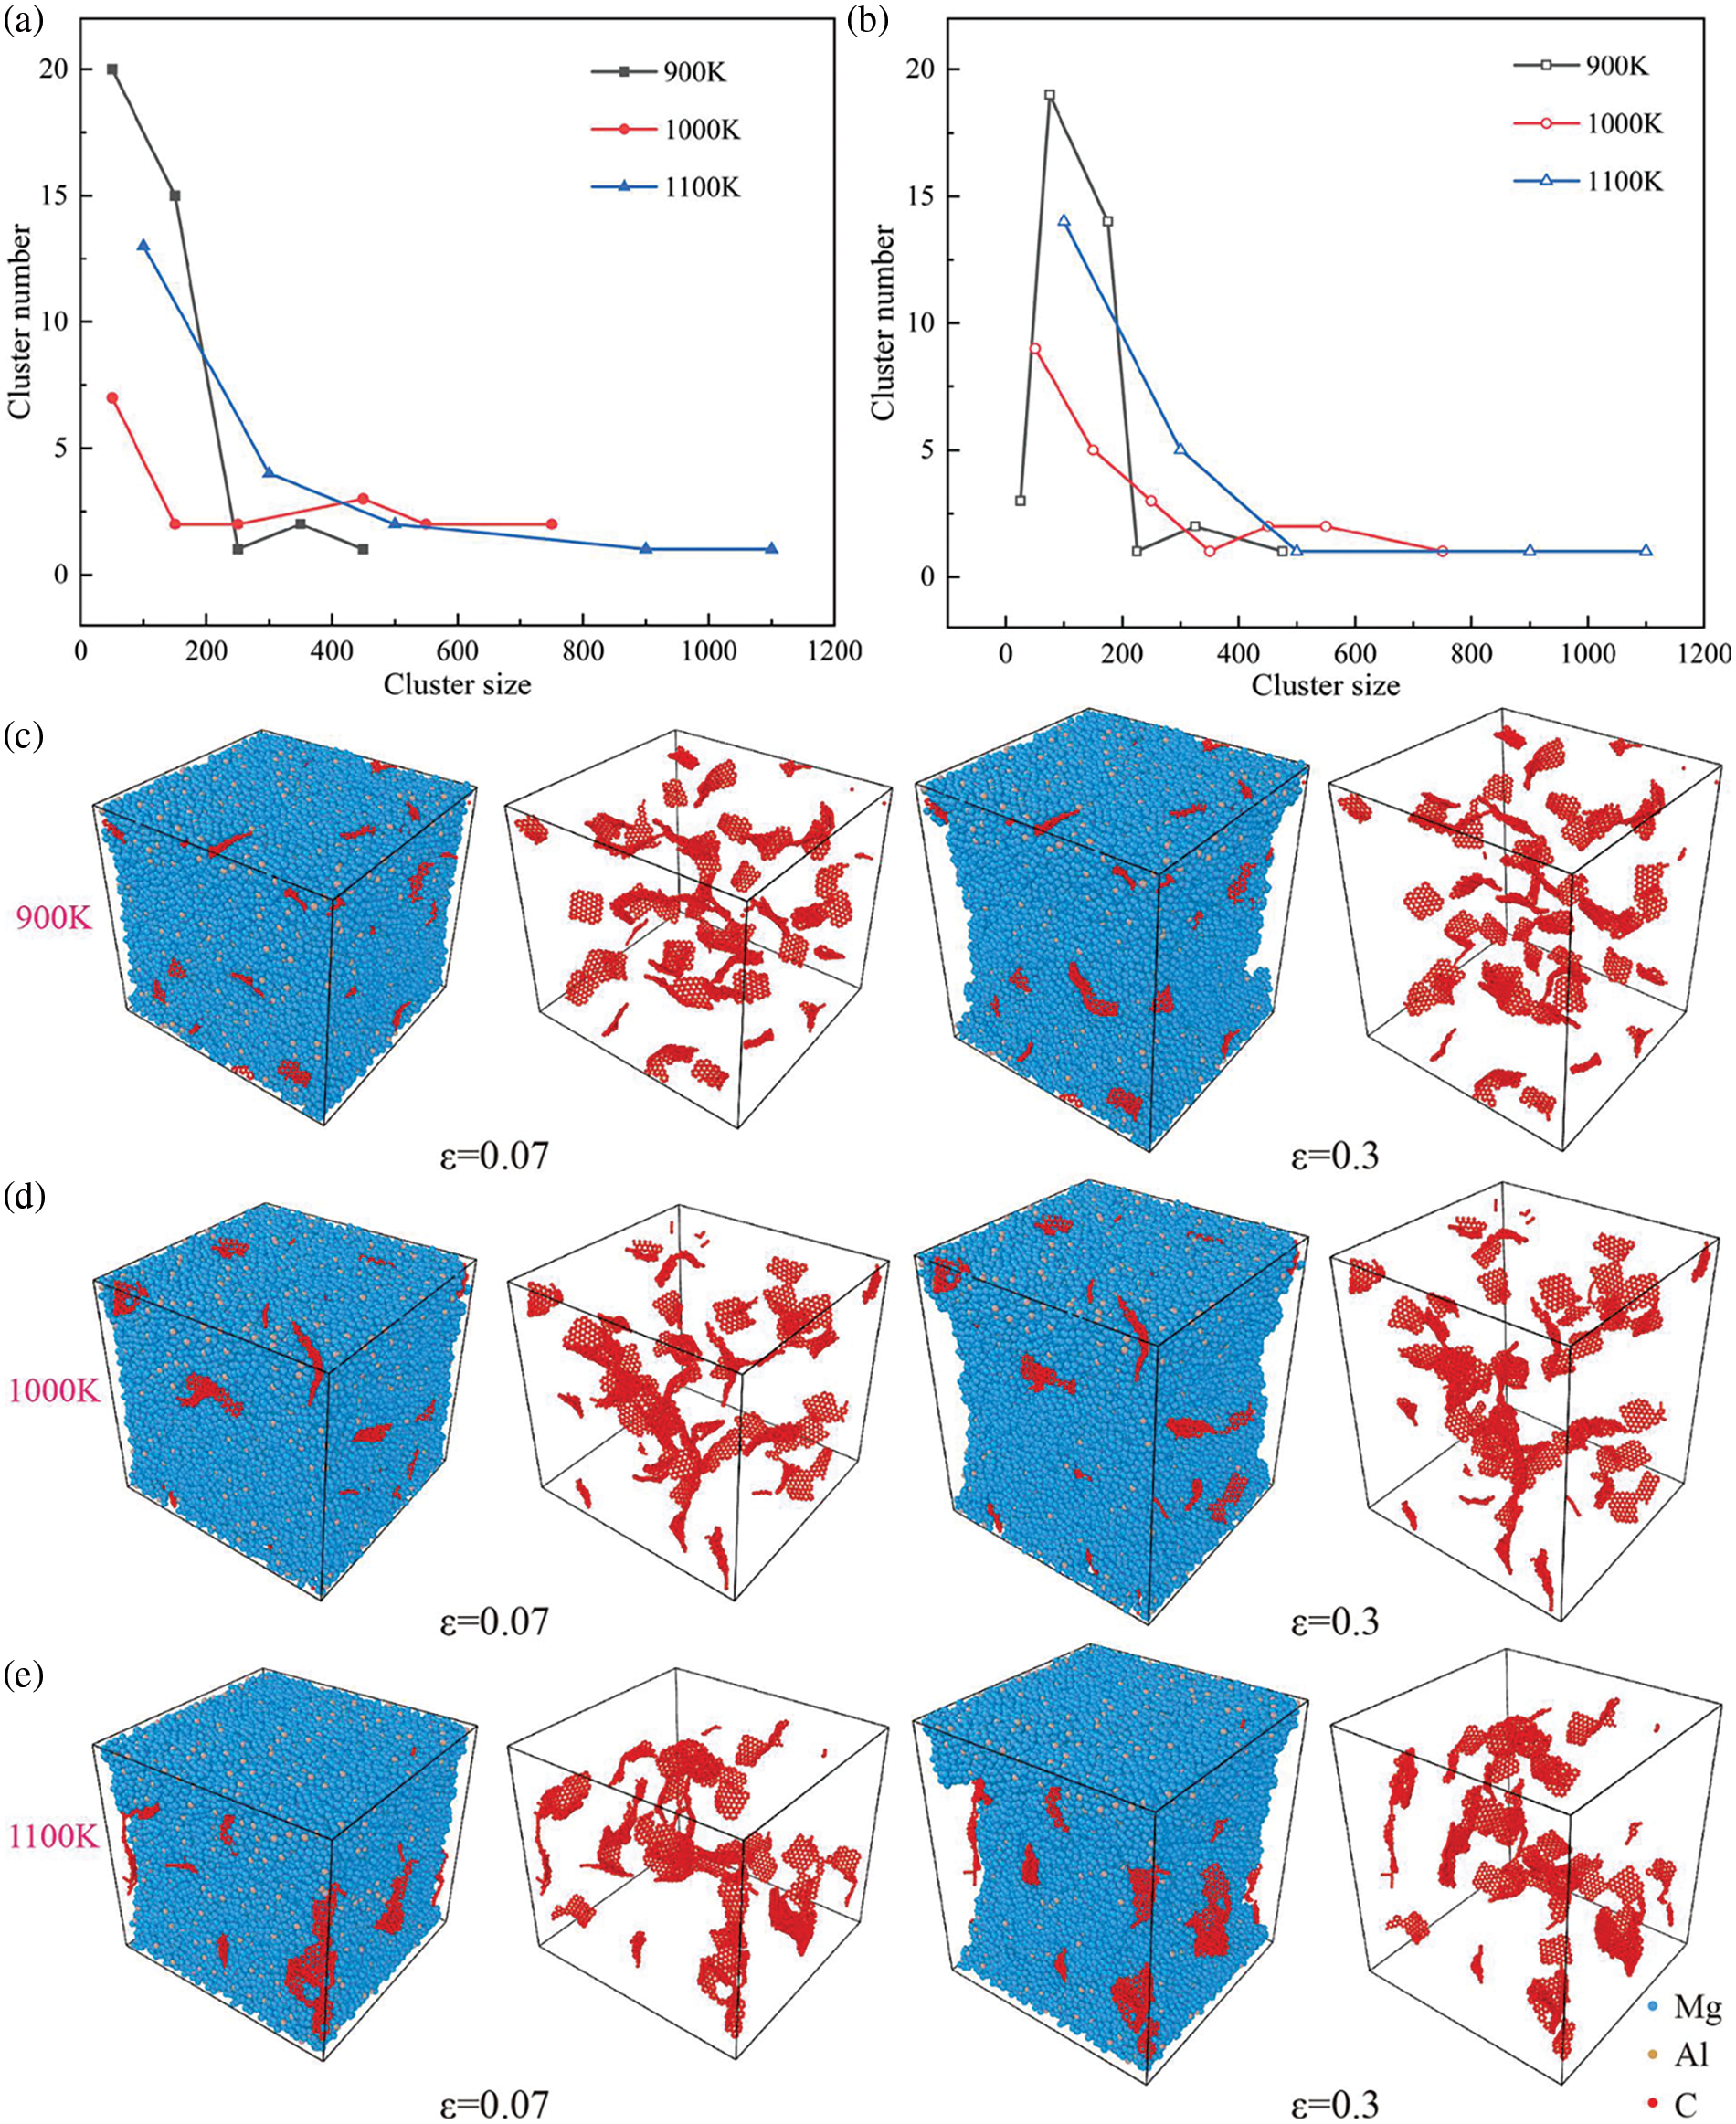
Figure 8: Snapshots and curves of different processing temperatures on the degree of graphene aggregation in Mg matrix. (a, b) Defect cluster size-number diagram of graphene at different processing temperatures and ε = 0.07 (solid point), and ε = 0.3 (hollow points), (c–e) Snapshots when the strain becomes 0.07 and 0.3 at 900 K, 1000 K and 1100 K
3.3 Effect of Pressure on Graphene Agglomeration Behavior and Tensile Response
Pressure constitutes another influential process parameter affecting the aggregation of graphene within the matrix. A certain pressure is typically applied in the practical preparation of GNPs/Mg. For this section, a temperature of 900 K was utilized. Fig. 9a shows the graphene agglomeration situation without applying pressure. In actual GNPs/Mg preparation processes, pressures typically do not exceed 80 MPa. Consequently, simulations were conducted with 40 and 80 MPa pressures, as illustrated in Fig. 9b,c, respectively. The dispersion state of graphene at 1 ns is consistent with the description in the literature [34]. Graphene nanoflakes are randomly mixed with the matrix, and the highly reactive edges of the graphene form covalent bonds with adjacent graphene flakes. This bonding results in an interconnected graphene network within the metal matrix. While previous literature used an Al matrix, we utilized a magnesium alloy containing 9% Al. Due to the differences in atomic interactions, the interconnected graphene network formed in the magnesium alloy is not as extensive as that observed in the Al matrix. Notably, increasing pressure did not accelerate graphene aggregation within the matrix. Moreover, elevating the pressure from 40 to 80 MPa did not exert a significant influence on the graphene aggregation process. Even at a pressure of 160 MPa, as shown in Fig. 9d, simulation results indicate that after 2 ns, graphene does not exhibit prominent aggregation. Instead, the distribution of graphene within the matrix remains relatively uniform, with only a few graphene sheets connecting to each other. Evidently, the phenomenon of graphene aggregation appears to be insensitive to pressure variations at 900 K.
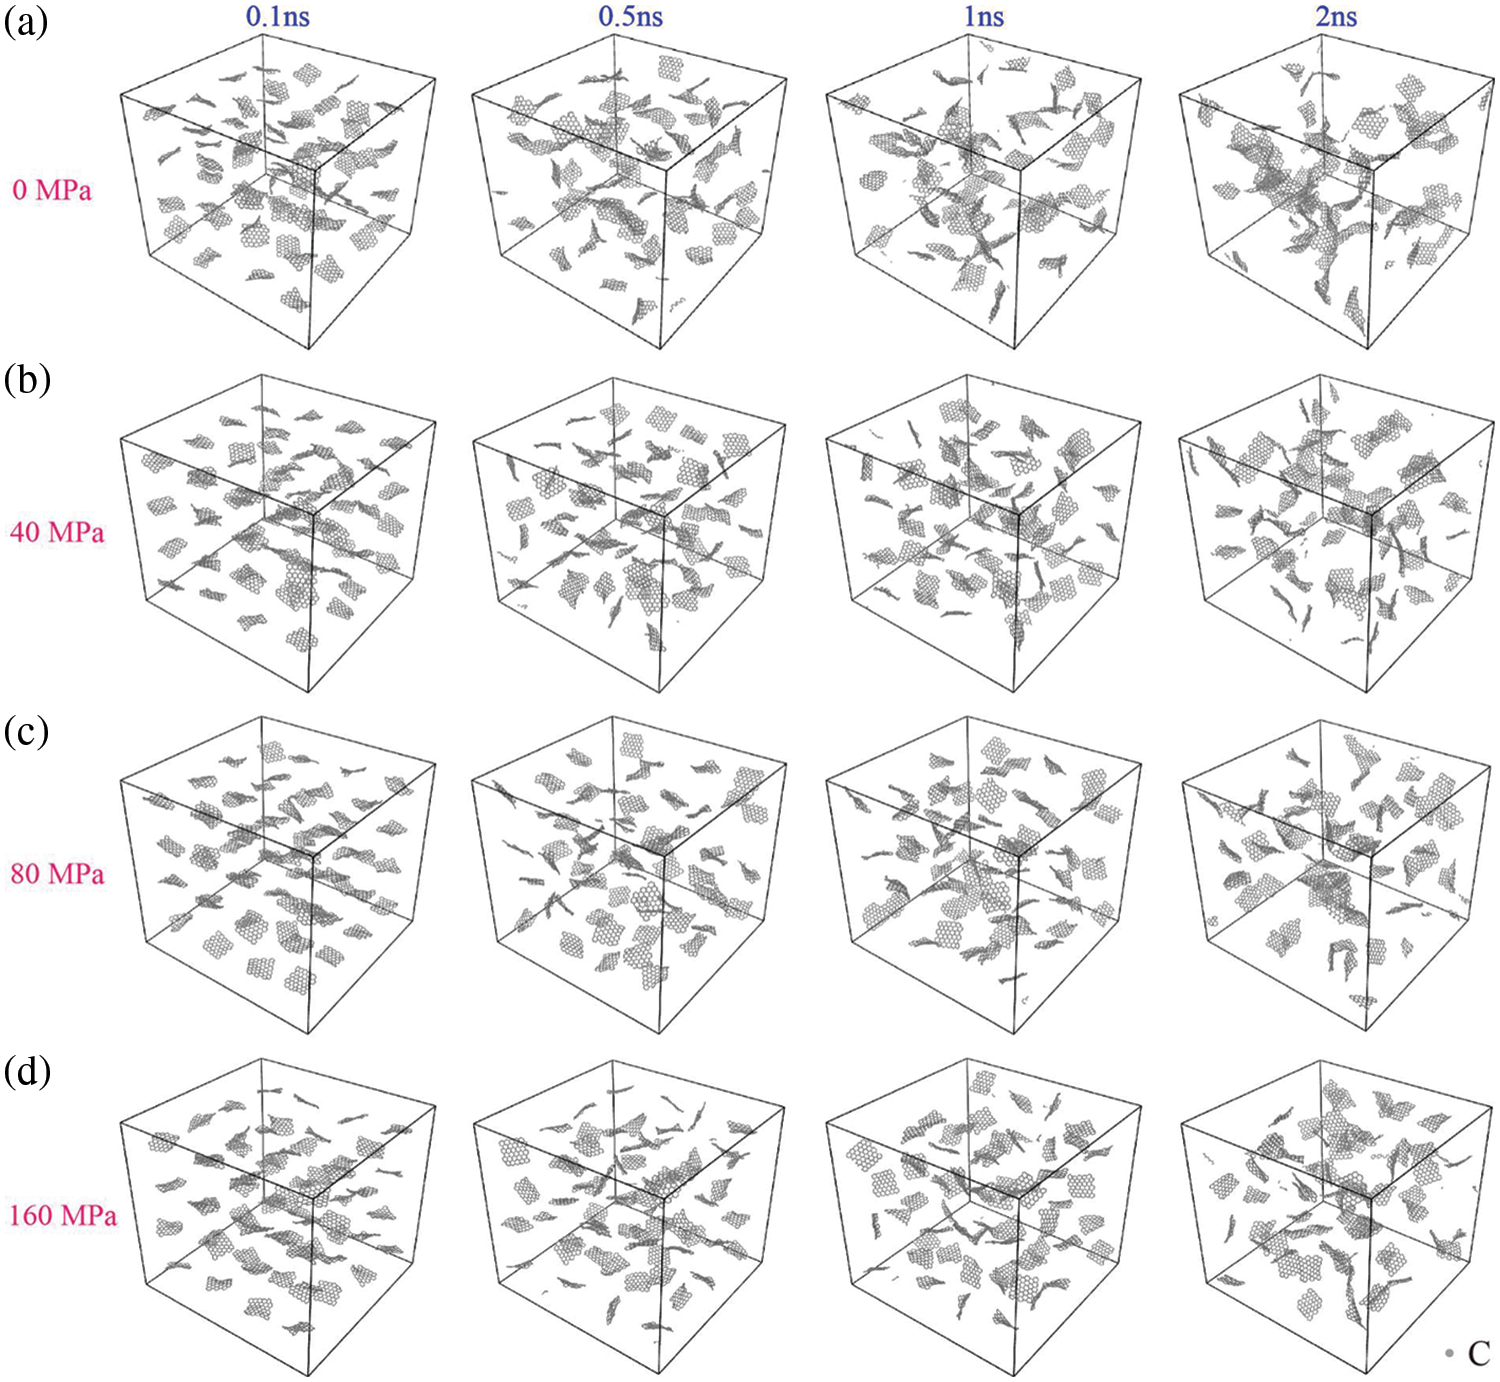
Figure 9: Distribution of graphene in Al-Mg matrix at different processing pressure. (a) 0 MPa, (b) 40 MPa, (c) 80 MPa, (d) 160 MPa
Fig. 10 illustrates the RDFof GNPs/Mg composites at various pressures, with a temperature of 900 K. Remarkably, it is observed that changes in pressure exert minimal influence on the defects and atomic density of graphene. However, a direct positive correlation between pressure and graphene defects is not evident. Surprisingly, at a pressure of 80 MPa, graphene exhibits more defects compared to other GNPs/Mg composites. Furthermore, the peak value near the cut-off distance in the enlarged picture remains largely unaffected by processing pressure. This observation shows that processing pressure does not significantly alter the overall structure of the composites.
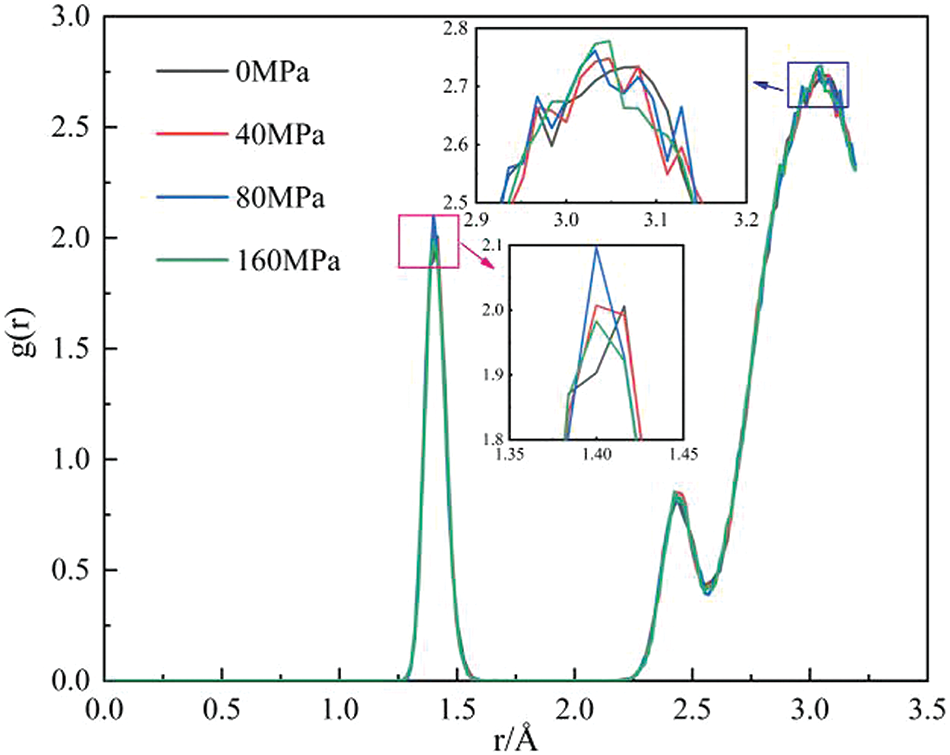
Figure 10: RDFof GNPs/Mg composites at different processing pressures
The GNPs/Mg model was subjected to cooling from 900 to 300 K at various processing pressures after a 2 ns simulation, with a cooling rate of 10 K/ps. The resultant models at normal temperatures under different pressures are depicted in Fig. 11. Interestingly, as pressure increases, graphene aggregation does not exhibit significant escalation, nor does it induce substantial structural damage to the composite model. Notably, processing pressure exerts a minor influence on the degree of graphene aggregation, while temperature plays a more prominent role in modulating graphene aggregation, as evidenced by the observations in Fig. 6.

Figure 11: Final model of GNPs/Mg model cooled at different pressures after 2 ns. (a) 0 MPa, (b) 40 MPa, (c) 80 MPa, (d) 160 MPa
Tensile simulations were conducted on the final model at room temperature, and the stress-strain curves, strength and modulus curves of the GNPs/Mg model subjected to uniaxial tensile simulation at different pressures are illustrated in Fig. 12. Notably, the tensile curves of the GNPs/Mg composite at different pressures exhibit relative proximity during the yield stage, with slight variations observed in the corresponding tensile strength peaks. While the modulus curves display significant fluctuations in Fig. 12b, Young’s modulus is relatively close in value of 39.5 GPa. Interestingly, the tensile strength curve demonstrates a trend of decreasing as pressure increases. This observation may appear inconsistent with the peak value observed in the RDF. However, it can be elucidated by considering the analysis of the number of graphene clusters, as detailed below.
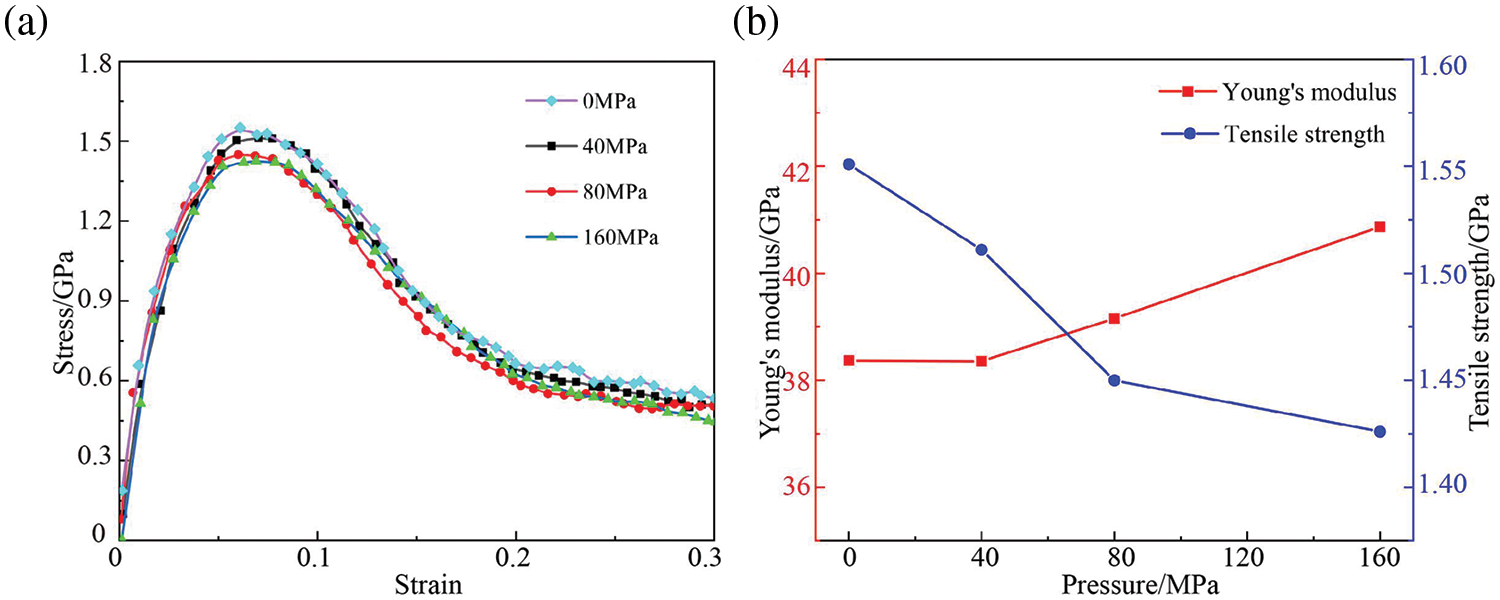
Figure 12: Tensile response of GNPs/Mg model under different pressure. (a) Stress-strain curves, (b) Tensile strength and Young’s modulus curves
Fig. 13a shows the relationship between size and the number of graphene clusters at the strain of the tensile strength (0.07) across various processing pressures. At lower processing pressures, graphene tends to concentrate within smaller clusters. Interestingly, an increase in processing pressure leads to a reduction in large-sized defect clusters in graphene. However, small-sized graphene clusters will still increase with increasing pressure as shown in Fig. 13b. Although the peak at 1.4 Å for 80 MPa is the highest (Fig. 10), the size of the cluster remains relatively concentrated as shown in Fig. 13e. This observation suggests that a higher density of graphene defects makes achieving dispersed graphene defect cluster sizes challenging. Because there are more clusters of small-sized graphene defects when the processing pressure is high, the tensile strength of the composites decreases (Fig. 12). Moreover, the stretching process minimizes the dispersion of small-sized graphene clusters but promotes further dispersion and reduction of large-sized graphene clusters as shown in Fig. 13c–f, particularly evident at 40 MPa in Fig. 13c. Compared with the effect of processing temperature on the degree of graphene aggregation and clusters, it is observed that processing pressure tends to result in smaller-sized graphene clusters, albeit with a higher quantity of small-sized clusters.
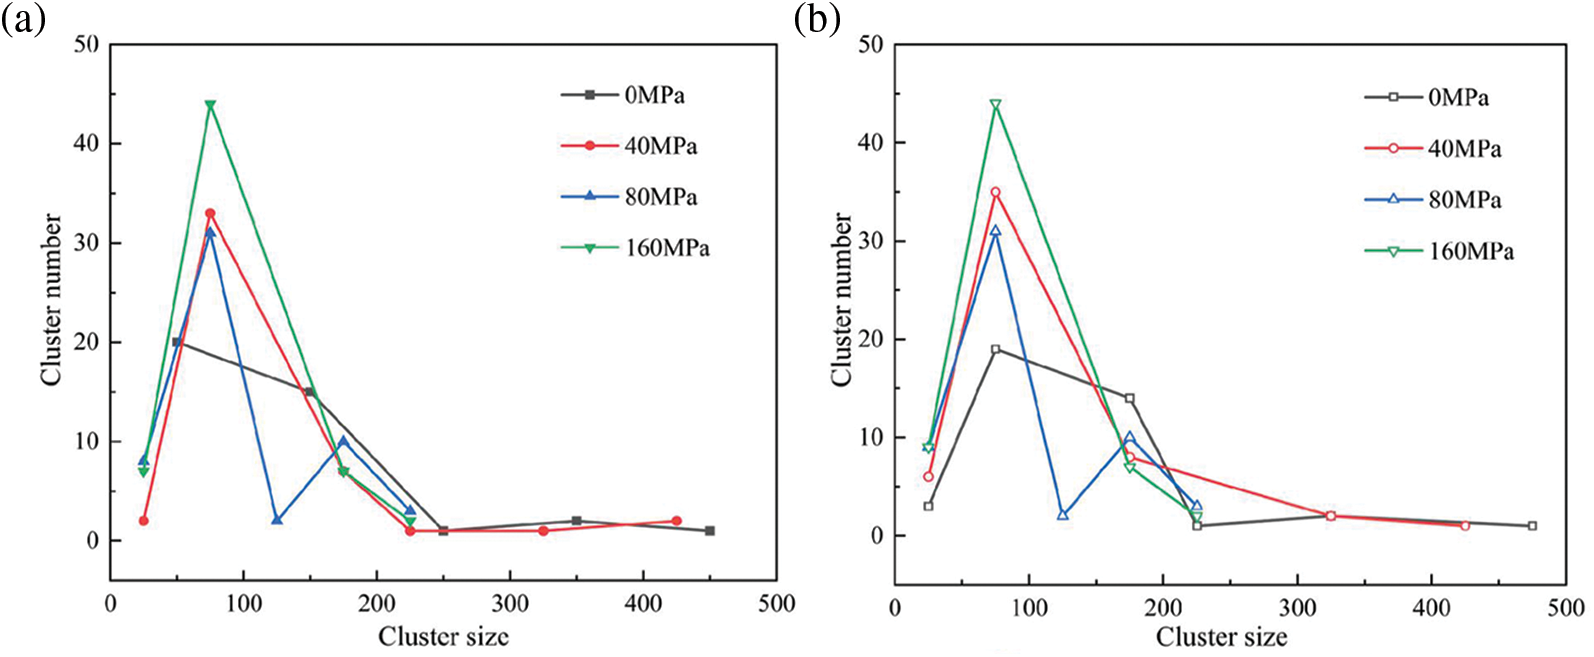
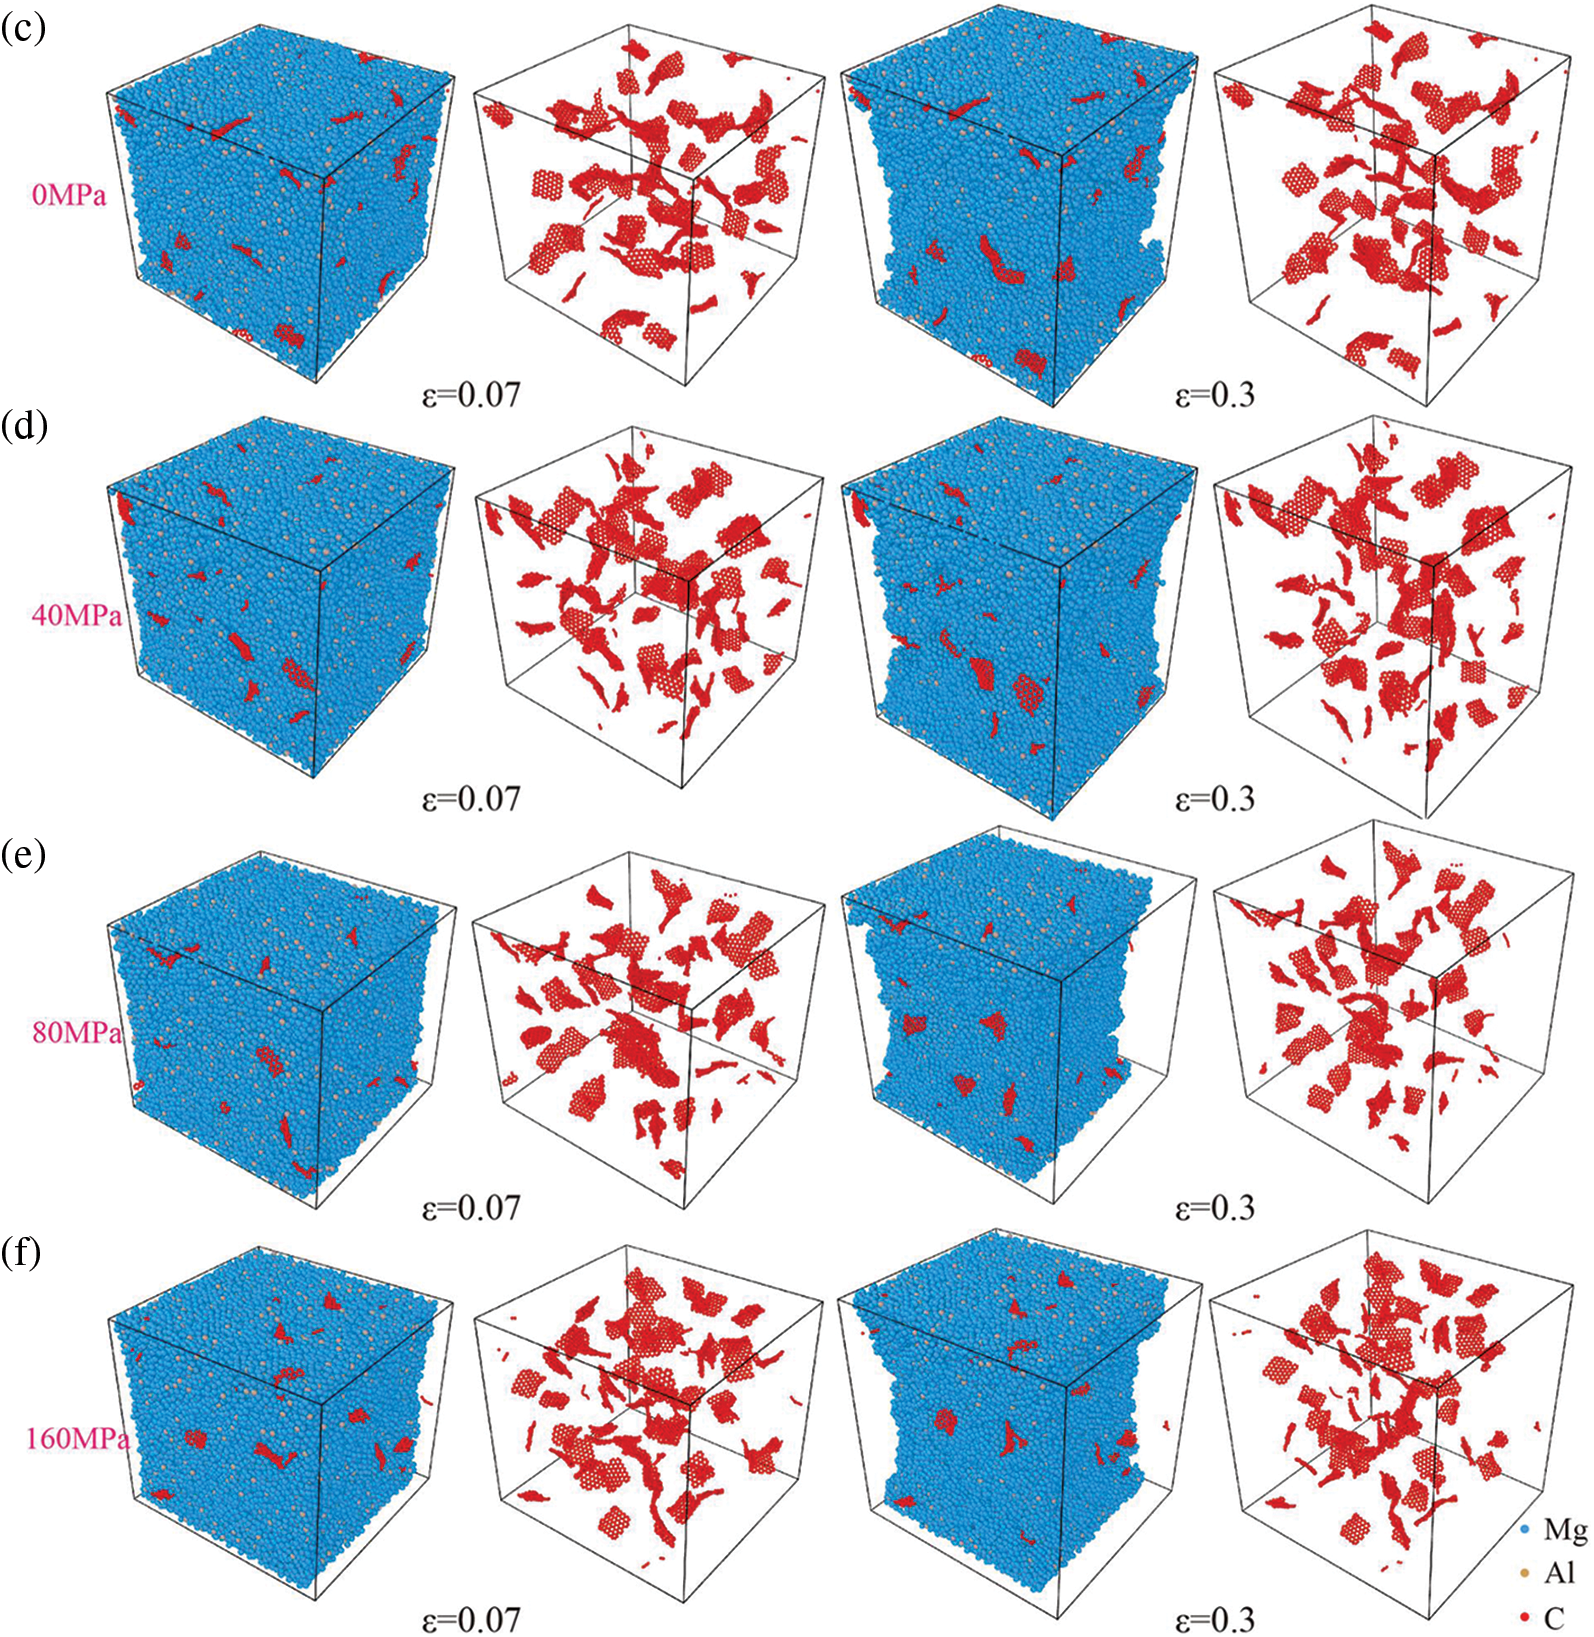
Figure 13: Snapshots and curves of different processing pressures on the degree of graphene aggregation in Mg matrix. (a, b) Defect cluster size-number diagram of graphene at different processing pressures and ε = 0.07 (solid point), and ε = 0.3 (hollow points), (c–f) Snapshots when the strain becomes 0.07 and 0.3 at 0 MPa, 40 MPa, 80 MPa and 160 MPa
In conclusion, our study investigated the effects of cooling rate, processing temperature, and processing pressure on the mechanical properties of composite materials reinforced with graphene. Several key findings have emerged from our experiments.
Under varying cooling rates, the strength and modulus of the GNPs/Mg composite exhibited minimal fluctuation, suggesting that the cooling rate has negligible effects on the tensile properties of the composite. Graphene shows a low degree of aggregation and primarily comprises small-sized clusters at lower processing temperatures. However, as the processing temperature increases, the aggregation of graphene and the formation of larger clusters intensify, consequently reducing the composites’ strength. Processing pressure demonstrated minimal impact on graphene aggregation and defect damage. Nonetheless, increasing processing pressure effectively suppressed the generation of large-sized graphene defect clusters, albeit resulting in an elevated content of smaller defect clusters. This phenomenon ultimately contributed to a decrease in the strength of the composites. Processing pressure produces smaller graphene clusters than processing temperature, but the number of small-sized graphene clusters is greater. Additionally, during the stretching process, large-sized clusters undergo decomposition into multiple smaller clusters, further influencing the mechanical behavior of the composite.
Acknowledgement: None.
Funding Statement: This work was supported by the National Natural Science Foundation of China (Grant No. 52475405, 52471164, and 52231004). Innovation Foundation for Doctor Dissertation of Northwestern Polytechnical University (No. CX2022039).
Author Contributions: Study conception and design: Chentong Zhao, Su Wang; data collection: Su Wang; analysis and interpretation of results: Chentong Zhao, Su Wang, Jiming Zhou; draft manuscript preparation: Chentong Zhao, Xujiang Chao, Lehua Qi. All authors reviewed the results and approved the final version of the manuscript.
Availability of Data and Materials: Data is available on request from the authors. The data that support the findings of this study are available from the corresponding author upon reasonable request.
Ethics Approval: No applicable.
Conflicts of Interest: The authors declare they have no conflicts of interest to report regarding the present study.
References
1. Yolshina LA, Muradymov RV, Korsun IV, Yakovlev GA, Smirnov SV. Novel aluminum-graphene and aluminum-graphite metallic composite materials: synthesis and properties. J Alloys Compd. 2016;663:449–59. doi:10.1016/j.jallcom.2015.12.084. [Google Scholar] [CrossRef]
2. Zhao Z, Bai P, Du W, Liu B, Pan D, Das R, et al. An overview of graphene and its derivatives reinforced metal matrix composites: preparation, properties and applications. Carbon. 2020;170(1):302–26. doi:10.1016/j.carbon.2020.08.040. [Google Scholar] [CrossRef]
3. Pillari LK, Lessoway K, Bichler L. Carbon nanotube and graphene reinforced magnesium matrix composites: a state-of-the-art review. J Magnes Alloy. 2023;11(6):1825–905. doi:10.1016/j.jma.2023.05.010. [Google Scholar] [CrossRef]
4. Munir K, Wen C, Li Y. Graphene nanoplatelets-reinforced magnesium metal matrix nanocomposites with superior mechanical and corrosion performance for biomedical applications. J Magnes Alloy. 2020;8(1):269–90. doi:10.1016/j.jma.2019.12.002. [Google Scholar] [CrossRef]
5. Hynes Navasingh RJ, Kumar R, Marimuthu K, Planichamy S, Khan A, Asiri AM, et al. 6-Graphene-based nano metal matrix composites: a review. In: Khan A, Jawaid M, Inamuddin A, editors. Nanocarbon and its composites. Britain: Woodhead Publishing; 2019. p. 153–70. [Google Scholar]
6. Liu J, Khan U, Coleman J, Fernandez B, Rodriguez P, Naher S, et al. Graphene oxide and graphene nanosheet reinforced aluminium matrix composites: powder synthesis and prepared composite characteristics. Mater Des. 2016;94:87–94. doi:10.1016/j.matdes.2016.01.031. [Google Scholar] [CrossRef]
7. Wozniak J, Kostecki M, Cygan T, Buczek M, Olszyna A. Self-lubricating aluminium matrix composites reinforced with 2D crystals. Compos Part B: Eng. 2017;111(4):1–9. doi:10.1016/j.compositesb.2016.11.054. [Google Scholar] [CrossRef]
8. Meng L, Hu X, Wang X, Zhang C, Shi H, Xiang Y, et al. Graphene nanoplatelets reinforced Mg matrix composite with enhanced mechanical properties by structure construction. Mater Sci Eng: A. 2018;733:414–8. doi:10.1016/j.msea.2018.07.056. [Google Scholar] [CrossRef]
9. Li JL, Xiong YC, Wang XD, Yan SJ, Yang C, He WW, et al. Microstructure and tensile properties of bulk nanostructured aluminum/graphene composites prepared via cryomilling. Mater Sci Eng: A. 2015;626:400–5. doi:10.1016/j.msea.2014.12.102. [Google Scholar] [CrossRef]
10. Zhang X, Xu Y, Wang M, Liu E, Zhao N, Shi C, et al. A powder-metallurgy-based strategy toward three-dimensional graphene-like network for reinforcing copper matrix composites. Nat Commun. 2020;11(1):2775. doi:10.1038/s41467-020-16490-4 [Google Scholar] [PubMed] [CrossRef]
11. Rashad M, Pan F, Liu Y, Chen X, Lin H, Pan R, et al. High temperature formability of graphene nanoplatelets-AZ31 composites fabricated by stir-casting method. J Magnes Alloy. 2016;4(4):270–7. doi:10.1016/j.jma.2016.11.003. [Google Scholar] [CrossRef]
12. Safina LL, Baimova JA. Molecular dynamics simulation of fabrication of Ni-graphene composite: temperature effect. Micro Nano Lett. 2020;15(3):178–82. doi:10.1049/mnl.2019.0414. [Google Scholar] [CrossRef]
13. Afrazi M, Lin Q, Fakhimi A. Physical and numerical evaluation of mode ii fracture of quasi-brittle materials. Int J Civil Eng. 2022;20(9):993–1007. doi:10.1007/s40999-022-00718-z. [Google Scholar] [CrossRef]
14. Pour AE, Afrazi M, Golshani A. Experimental study of the effect of length and angle of cross-cracks on tensile strength of rock-like material. Iran J Sci Technol Trans civil Eng. 2022;46(6):4543–56. doi:10.1007/s40996-022-00891-0. [Google Scholar] [CrossRef]
15. Zhang W, Wang C, Wang Y. Thermo-mechanical analysis of porous functionally graded graphene reinforced cylindrical panels using an improved third order shear deformable model. Appl Math Model. 2023;118(11):453–73. doi:10.1016/j.apm.2023.01.026. [Google Scholar] [CrossRef]
16. Tornabene F, Viscoti M, Dimitri R. Effect of porosity on the modal response of doubly-curved laminated shell structures made of functionally graded materials employing higher order theories. Structures. 2024;60:105848. doi:10.1016/j.istruc.2023.105848. [Google Scholar] [CrossRef]
17. Zhou Z, Wang Y, Zhang S, Dimitri R, Tornabene F, Asemi K. Numerical study on the buckling behavior of FG porous spherical caps reinforced by graphene platelets. Nanomaterials. 2023;13(7):1205. doi:10.3390/nano13071205 [Google Scholar] [PubMed] [CrossRef]
18. Sobhani E, Masoodi AR. On the frequencies of graphene nanoplatelet agglomerated nanocomposite paired paraboloidal-cylindrical shells under arbitrary boundary conditions. Aerosp Sci Technol. 2022;128(9):107782. doi:10.1016/j.ast.2022.107782. [Google Scholar] [CrossRef]
19. Babu PN, Gargeya BSK, Ray BC, Pal S. Atomistic investigation of mechanical behavior for CNT reinforced nanocrystalline aluminum under biaxial tensile loading. Maters Today: Proc. 2020;33(1):4942–50. doi:10.1016/j.matpr.2020.02.685. [Google Scholar] [CrossRef]
20. Duan K, Li L, Hu Y, Wang X. Damping characteristic of Ni-coated carbon nanotube/copper composite. Mater Des. 2017;133(5479):455–63. doi:10.1016/j.matdes.2017.08.019. [Google Scholar] [CrossRef]
21. Zhao C, Zhou J, Zhong K, Bai Y, Qi L. Enhancing understanding metal matrix composites through molecular dynamics simulation: a comprehensive review. Comput Mater Sci. 2024;239:112993. doi:10.1016/j.commatsci.2024.112993. [Google Scholar] [CrossRef]
22. Xia Z, Xiaoxia L. Mechanical properties and strengthening mechanism of graphene nanoplatelets reinforced magnesium matrix composites. Acta Metall Sin. 2020;56(2):240–8. doi:10.11900/0412.1961.2019.00158. [Google Scholar] [CrossRef]
23. Wang X, Xiao W, Wang L, Shi J, Sun L, Cui J, et al. Investigation on mechanical behavior of multilayer graphene reinforced aluminum composites. Phys E: Low-Dimens Syst Nanostruct. 2020;123(11):114172. doi:10.1016/j.physe.2020.114172. [Google Scholar] [CrossRef]
24. Jiang W, Wu Y, Qin Q, Li D, Liu X, Fu M. A molecular dynamics based cohesive zone model for predicting interfacial properties between graphene coating and aluminum. Comput Mater Sci. 2018;151:117–23. doi:10.1016/j.commatsci.2018.05.008. [Google Scholar] [CrossRef]
25. Faria B, Guarda C, Silvestre N, Lopes JNC. Aluminum composites reinforced by γ-graphynes: the effect of nanofillers porosity and shape on crystal growth and composite strengthening. Comput Mater Sci. 2020;176(1):109538. doi:10.1016/j.commatsci.2020.109538. [Google Scholar] [CrossRef]
26. Zhu J, Liu X, Yang Q. Dislocation-blocking mechanism for the strengthening and toughening of laminated graphene/Al composites. Comput Mater Sci. 2019;160:72–81. doi:10.1016/j.commatsci.2018.12.061. [Google Scholar] [CrossRef]
27. Hirel P. Atomsk: a tool for manipulating and converting atomic data files. Comput Phys Commun. 2015;197:212–9. doi:10.1016/j.cpc.2015.07.012. [Google Scholar] [CrossRef]
28. Thompson AP, Aktulga HM, Berger R, Bolintineanu DS, Brown WM, Crozier PS, et al. LAMMPS–a flexible simulation tool for particle-based materials modeling at the atomic, meso, and continuum scales. Comput Phys Commun. 2022;271(4):108171. doi:10.1016/j.cpc.2021.108171. [Google Scholar] [CrossRef]
29. Mendelev MI, Asta M, Rahman MJ, Hoyt JJ. Development of interatomic potentials appropriate for simulation of solid-liquid interface properties in Al-Mg alloys. Philos Mag. 2009;89(34–36):3269–85. [Google Scholar]
30. Stuart SJ, Tutein AB, Harrison JA. A reactive potential for hydrocarbons with intermolecular interactions. J Chem Phys. 2000;112(14):6472–86. doi:10.1063/1.481208. [Google Scholar] [CrossRef]
31. Tang T, Kim S, Horstemeyer MF. Molecular dynamics simulations of void growth and coalescence in single crystal magnesium. Acta Mater. 2010;58(14):4742–59. doi:10.1016/j.actamat.2010.05.011. [Google Scholar] [CrossRef]
32. Rappe AK, Casewit CJ, Colwell KS, Goddard WA, Skiff WM. UFF, a full periodic table force field for molecular mechanics and molecular dynamics simulations. J Am Chem Soc. 1992;114(25):10024–35. doi:10.1021/ja00051a040. [Google Scholar] [CrossRef]
33. Munilla J, Castro M, Carnicero A. Surface effects in atomistic mechanical simulations of Al nanocrystals. Phys Rev B. 2009;80(2):241. doi:10.1103/PhysRevB.80.024109. [Google Scholar] [CrossRef]
34. Kumar S, Pattanayek SK, Das SK. Reactivity-controlled aggregation of graphene nanoflakes in aluminum matrix: atomistic molecular dynamics simulation. J Phys Chem C. 2019;123(29):18017–27. doi:10.1021/acs.jpcc.9b03101. [Google Scholar] [CrossRef]
35. Schuster JC, Perring L, Richter KW, Ipser H, Grin Y, Weitzer F. The binary system Re-Al. J Alloys Compd. 2001;320(2):224–27. [Google Scholar]
36. Li L, Li D, Zeng X, Luo AA, Hu B, Sachdev AK, et al. Microstructural evolution of Mg-Al-Re alloy reinforced with alumina fibers. J Magnes Alloy. 2020;8(3):565–77. doi:10.1016/j.jma.2019.07.012. [Google Scholar] [CrossRef]
37. Zhang L, Deng K, Nie K, Wang C, Xu C, Shi Q. Achieving strength-thermal conductivity synergy in Mg bulk system via introducing oriented graphite flakes into Mg-Zn-Ca alloy. Compos Commun. 2023;37:101451. doi:10.1016/j.coco.2022.101451. [Google Scholar] [CrossRef]
38. Xiao H, Ma G, Ye J, He Y. Preparation of graphene reinforced AZ31B magnesium-based composites by stirring casting. Vacuum. 2021;191:110281. doi:10.1016/j.vacuum.2021.110281. [Google Scholar] [CrossRef]
39. Wang Q, Sun Q, Chen S. Effect of temperature on the dispersion of graphene in graphene reinforced aluminum matrix composite. IOP Conf Ser: Mater Sci Eng. 2020;774(1):12130. doi:10.1088/1757-899X/774/1/012130. [Google Scholar] [CrossRef]
40. Azizi B, Shariati M, Souq SSMN, Hosseini M. Bending and stretching behavior of graphene structures using continuum models calibrated with modal analysis. Appl Math Model. 2023;114(10):466–87. doi:10.1016/j.apm.2022.10.003. [Google Scholar] [CrossRef]
Cite This Article
 Copyright © 2024 The Author(s). Published by Tech Science Press.
This work is licensed under a Creative Commons Attribution 4.0 International License , which permits unrestricted use, distribution, and reproduction in any medium, provided the original work is properly cited.


 Submit a Paper
 Propose a Special lssue
 View Full Text
 Download PDF
 Downloads
 Citation Tools