 Open Access
ARTICLE
Tree-Based Solution Frameworks for Predicting Tunnel Boring Machine Performance Using Rock Mass and Material Properties
1 School of Civil and Environmental Engineering, University of Technology Sydney (UTS), Ultimo, NSW 2007, Australia
2 School of Resources and Safety Engineering, Central South University, Changsha, 410083, China
3 Faculty of Earth Sciences Engineering, Arak University of Technology, Arak, 38181-46763, Iran
4 Department of Mechanical Engineering, New Mexico Institute of Mining and Technology, Socorro, NM 87801, USA
* Corresponding Author: Danial Jahed Armaghani. Email:
(This article belongs to the Special Issue: Computational Intelligent Systems for Solving Complex Engineering Problems: Principles and Applications-II)
Computer Modeling in Engineering & Sciences 2024, 141(3), 2421-2451. https://doi.org/10.32604/cmes.2024.052210
Received 26 March 2024; Accepted 18 September 2024; Issue published 31 October 2024
Abstract
Tunnel Boring Machines (TBMs) are vital for tunnel and underground construction due to their high safety and efficiency. Accurately predicting TBM operational parameters based on the surrounding environment is crucial for planning schedules and managing costs. This study investigates the effectiveness of tree-based machine learning models, including Random Forest, Extremely Randomized Trees, Adaptive Boosting Machine, Gradient Boosting Machine, Extreme Gradient Boosting Machine (XGBoost), Light Gradient Boosting Machine, and CatBoost, in predicting the Penetration Rate (PR) of TBMs by considering rock mass and material characteristics. These techniques are able to provide a good relationship between input(s) and output parameters; hence, obtaining a high level of accuracy. To do that, a comprehensive database comprising various rock mass and material parameters, including Rock Mass Rating, Brazilian Tensile Strength, and Weathering Zone, was utilized for model development. The practical application of these models was assessed with a new dataset representing diverse rock mass and material properties. To evaluate model performance, ranking systems and Taylor diagrams were employed. CatBoost emerged as the most accurate model during training and testing, with R2 scores of 0.927 and 0.861, respectively. However, during validation, XGBoost demonstrated superior performance with an R2 of 0.713. Despite these variations, all tree-based models showed promising accuracy in predicting TBM performance, providing valuable insights for similar projects in the future.Keywords
Nomenclature
| AdaBoost | Adaptive boosting machine |
| ANN | Artificial neural network |
| AR | Advance rate |
| AutoML | Automated machine learning |
| BTS | Brazilian tensile strength |
| R2 | Coefficient of determination |
| R | Coefficient correlation |
| CNN | Convolutional neural network |
| DT | Decision tree |
| XGBoost | Extreme gradient boosting |
| ERT | Extremely randomised tree |
| GBM | Gradient boosting machine |
| ICA | Imperialism competitive algorithm |
| LightGBM | Light gradient boosting machine |
| LSTM | Long short-term memory network |
| MAE | Mean absolute error |
| ML | Machine learning |
| PDP | Partial dependence plot |
| PR | Penetration rate |
| PSO | Particle swarm optimization |
| RF | Random forest |
| RQD | Rock quality designation |
| RMR | Rock mass rating |
| RMSE | Root mean square error |
| SVM | Support vector machine |
| TBM | Tunnel boring machine |
| TGML | Theory-guided machine learning |
| UCS | Uniaxial compressive strength |
| VAF | Variance accounted for |
| WZ | Weathering zone |
Tunnel Boring Machines (TBMs) offer superior safety and efficiency in long-distance tunnel construction compared to traditional drilling and blasting methods [1,2]. However, TBMs encounter various performance challenges when operating under different conditions. Adjusting TBM parameters promptly in response to changing geological conditions poses a challenge due to limited environmental awareness. Therefore, understanding the relationship between TBM conditions and working circumstances is crucial. Additionally, geological conditions, geomaterial properties, and geological hazards can impose limitations on TBM applications and pose risks [3]. Consequently, accurate estimation of TBM performance is essential for optimizing tunnel construction projects in terms of operational objectives, project costs, and scheduling [4,5]. Thus, achieving reliable TBM performance estimation stands as a primary objective in mechanized tunnel construction.
Methodologies for evaluating TBM performance can be categorized into theoretical, empirical, and intelligent techniques [6]. Theoretical techniques aim to approximate cutting force based on indentation experiments and full-scale laboratory cutting trials. Initially, these techniques only considered the uniaxial compressive strength (UCS) of the rock [7–9]. However, as experimental facilities advanced, diverse parameters were incorporated, leading to the development of models such as the Colorado School of Mines [10] and the Norwegian Institute of Technology model [11] to predict TBM performance. While theoretical methods are simple, easy to execute, and useful for assessing cutter head operation, they fail to account for actual rock conditions and lack a universal solution scheme due to the frequent variability of geological conditions [12].
Empirical methods are developed based on data obtained from TBM operation sites in tunnels, establishing quantitative relationships between TBM performance and surrounding rock mass characteristics. Armaghani et al. [13] formulated equations to estimate Penetration Rate (PR) and Advance Rate (AR) in various weathered zones within granitic rock masses. Similarly, Goodarzi et al. [14] proposed an empirical method for estimating TBM parameters in soft sedimentary rock. Empirical methods are well-suited for practical excavation engineering due to their consideration of rock conditions and simple applicability. However, they require certain key parameters that may be challenging to obtain consistently [6], and they overlook the underlying operating principles of the cutter head.
Intelligent models/approaches rely on extensive data to establish comprehensive relationships for predicting TBM performance. These models excel in tackling complex engineering challenges and can construct precise and efficient models solely by focusing on input and output parameters [15]. Compared to theoretical methods, intelligent techniques can adapt to environmental changes by adjusting model inputs and outputs. Additionally, they offer a broader range of applications than empirical equations and are economically advantageous due to their low cost [16].
With advancements in computing science, numerous intelligent models have been employed to address geotechnical problems [16–20] and estimate TBM performance [21–24]. Recently, base models with optimization techniques, ensemble models, deep learning models, automated machine learning (AutoML) systems, etc., have been utilized for TBM performance assessment. Optimization algorithms enhance model accuracy by adjusting hyperparameters. Armaghani et al. [25] utilized particle swarm optimization (PSO) and imperialism competitive algorithm (ICA) to optimize artificial neural network (ANN) for predicting TBM PR, demonstrating improved performance over single ANN models. Zhou et al. [26] employed three swarm-based algorithms to optimize support vector machine (SVM) for forecasting TBM AR, showing significant enhancement in TBM capability evaluation. Li et al. [27] applied ANN, gene expression programming, and multivariate adaptive regression splines with a whale optimization algorithm for forecasting TBM performance. Harandizadeh et al. [28] used ICA to optimize hyperparameters of the adaptive neuro-fuzzy inference system-polynomial neural network for TBM performance prediction. Xu et al. [15] utilized a convolutional neural network (CNN) and long short-term memory network (LSTM) for estimating TBM performance in Jilin Province, China, demonstrating the superior performance of LSTM over CNN in the real-time evaluation of TBM performance parameters. Feng et al. [6] employed a deep belief network to predict TBM performance in the Yingsong Water Diversion Project in Northeastern China, suggesting the practicality of deep learning methods for TBM performance prediction.
As a nascent technology, AutoML offers the capability to construct robust models without extensive knowledge of machine learning (ML) parameter tuning [29]. Zhang et al. [30] applied AutoML and neural architecture search with Bayesian optimization to efficiently predict TBM performance parameters. Their findings suggest that AutoML does not require an in-depth understanding of machine learning and can yield exceptional estimations for TBM performance parameters. Ensemble models, which combine multiple models to mitigate individual limitations and enhance predictive capabilities, are commonly utilized in this context. Ensemble models often utilize decision trees (DTs) as foundational learners due to their minimal bias and significant variance [31]. Zhou et al. [32] employed six metaheuristic algorithms to optimize Extreme Gradient Boosting (XGBoost) for evaluating TBM capabilities, finding XGBoost and Particle Swarm Optimization (PSO) to be most practical on-site. Xu et al. [15] utilized two ensemble models and three statistical models to forecast TBM performance, concluding that ensemble models outperformed single statistical models.
Given the above discussion, it appears that only a few tree-based solutions and ensemble DT models have been utilized in predicting TBM performance. One significant advantage of tree-based models is their ability to handle complex and non-linear relationships between input features and target variables. This makes them particularly well-suited for predicting TBM performance, which is influenced by a variety of factors such as geological conditions, machine specifications, and operational parameters. On the other hand, the efficacy of these models in addressing geotechnical problems has been underscored in numerous studies [33–35]. Consequently, the authors chose to conduct an in-depth examination of these models, specifically Random Forest (RF), Extremely Randomized Trees (ERT), Adaptive Boosting Machine (AdaBoost), Gradient Boosting Machine (GBM), XGBoost, Category Gradient Boosting Machine (CatBoost), and Light Gradient Boosting Machine (LightGBM). The objective is to estimate TBM PR by leveraging rock mass and material characteristics, incorporating parameters such as Rock Mass Rating (RMR), Brazilian Tensile Strength (BTS), and Weathering Zone (WZ). These tree-based solutions are modeled, and validated, and their performance capabilities are compared to select the best tree-based model.
The remainder of this research is structured as follows: Section 2 discusses the significance of the current research. Section 3 introduces ensemble models based on DTs. Section 4 describes the project location, statistical information of input parameters, and modeling procedure. Section 5 presents the modeling process and results in detail. The ensemble DT models will be evaluated and ranked for estimating TBM performance in Section 6. Section 7 provides details regarding the use of a new database for validation purposes (practical application). The operational mechanism of the black box models (i.e., tree-based models) is discussed in Section 8. Section 9 presents some ideas regarding the future direction of this field. Finally, Section 10 reviews the study’s findings and limitations.
Several models proposed in the field of TBM performance prediction utilizing ML techniques incorporate numerous inputs or predictors [36–38], which may pose implementation challenges. These models typically categorize input parameters into three groups: rock material, rock mass, and machine specifications. However, data pertaining to machine specifications, such as thrust force, are often only accessible during or after the tunneling project when the TBM is operational and capable of recording such data. Consequently, predicting TBM performance prior to tunnel construction or even when ordering an appropriate TBM becomes challenging.
On the other hand, during the site exploration phase of tunneling projects, it is possible to easily measure or monitor the characteristics related to the rock material and the rock mass attributes. Therefore, to offer a clear predictive model that has sufficient applicability, the purpose of this study is to estimate TBM PR using only three input parameters, which are derived from rock mass and material qualities. Through a singular concentration on factors that are easily accessible at the preliminary stages of a project, the model that has been developed intends to improve both the practicability and the ease of execution. In addition, the model will be validated by utilizing a new database that is derived from the same case study. This new database will include a variety of ranges and conditions for the input parameters, which will ensure that the model is durable throughout a wide range of scenarios.
3 Brief Background of Tree-Based Models
This section presents a brief description of the background of the tree-based models used in this study. Since the same material and explanations can be found elsewhere, here the most important or common points regarding these techniques will be given.
RF is an ensemble model that leverages multiple regression trees for training samples in regression tasks [39]. Fig. 1 illustrates the flowchart depicting the construction of an RF model for predictive purposes. RF introduces randomness in two main dimensions:
i) Bootstrap Sampling: From a training set comprising N samples, a subset of size N is chosen through bootstrap sampling to construct an individual tree.
ii) Feature Selection: A subset of all available features is randomly selected to determine the optimal split point in each node.
RF exhibits robust performance in machine learning tasks, is capable of handling high-dimensional data with fast training speeds, and has strong anti-interference, and generalization abilities. However, RF may be susceptible to overfitting in regression problems with high noise levels. Moreover, the effectiveness of RF can be influenced by attributes with varying degrees of value division within the data.
For further details regarding RF formulations and backgrounds, interested readers are referred to additional studies [40,41].
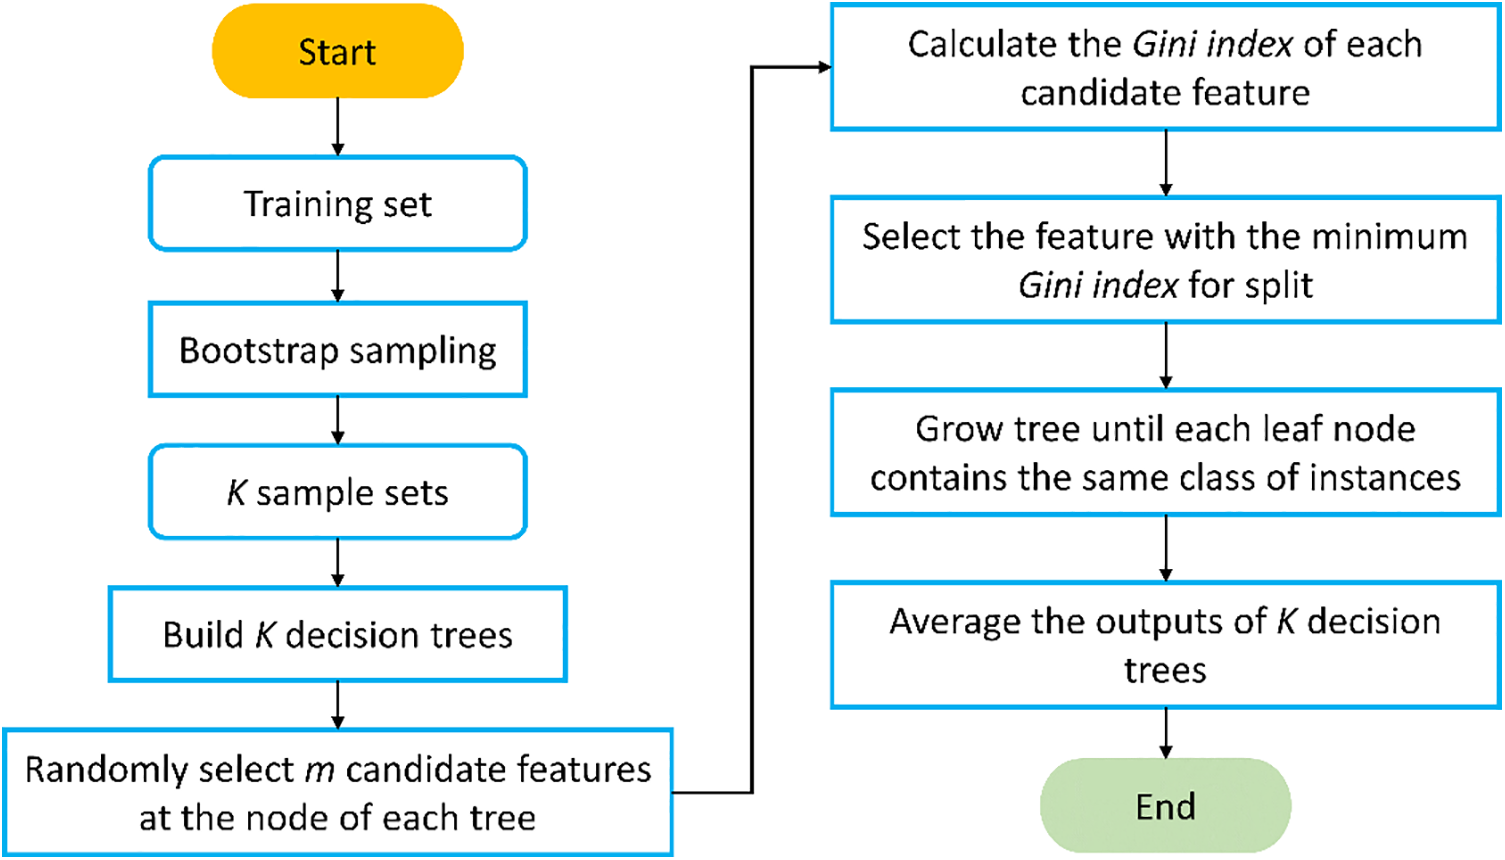
Figure 1: General flowchart of random forest (RF)
3.2 Extremely Randomized Tree (ERT)
An ERT is akin to RF, comprising numerous unpruned trees [42]. However, there exist two main distinctions between ERT and RF:
1. Data Sampling: In RF, trees are trained using partial data randomly selected from the training samples, whereas in ERT, trees utilize the original training sample.
2. Feature Splitting: While RF selects the best feature split point in each regression tree, ERT randomly selects a feature point for division.
The randomness inherent in ERT offers improved split points compared to RF. Fig. 2 outlines the steps involved in constructing an ERT. Initially, ERT selects a feature subset from all available features and then determines a random number within the range of values in the feature subset, dividing the features into two branches. Subsequently, the split threshold is computed, traversing all features within the node to obtain split thresholds for each feature. The feature with the maximum splitting threshold is chosen for division. Notably, the splitting threshold is entirely randomly selected, considering all possible attribute divisions.
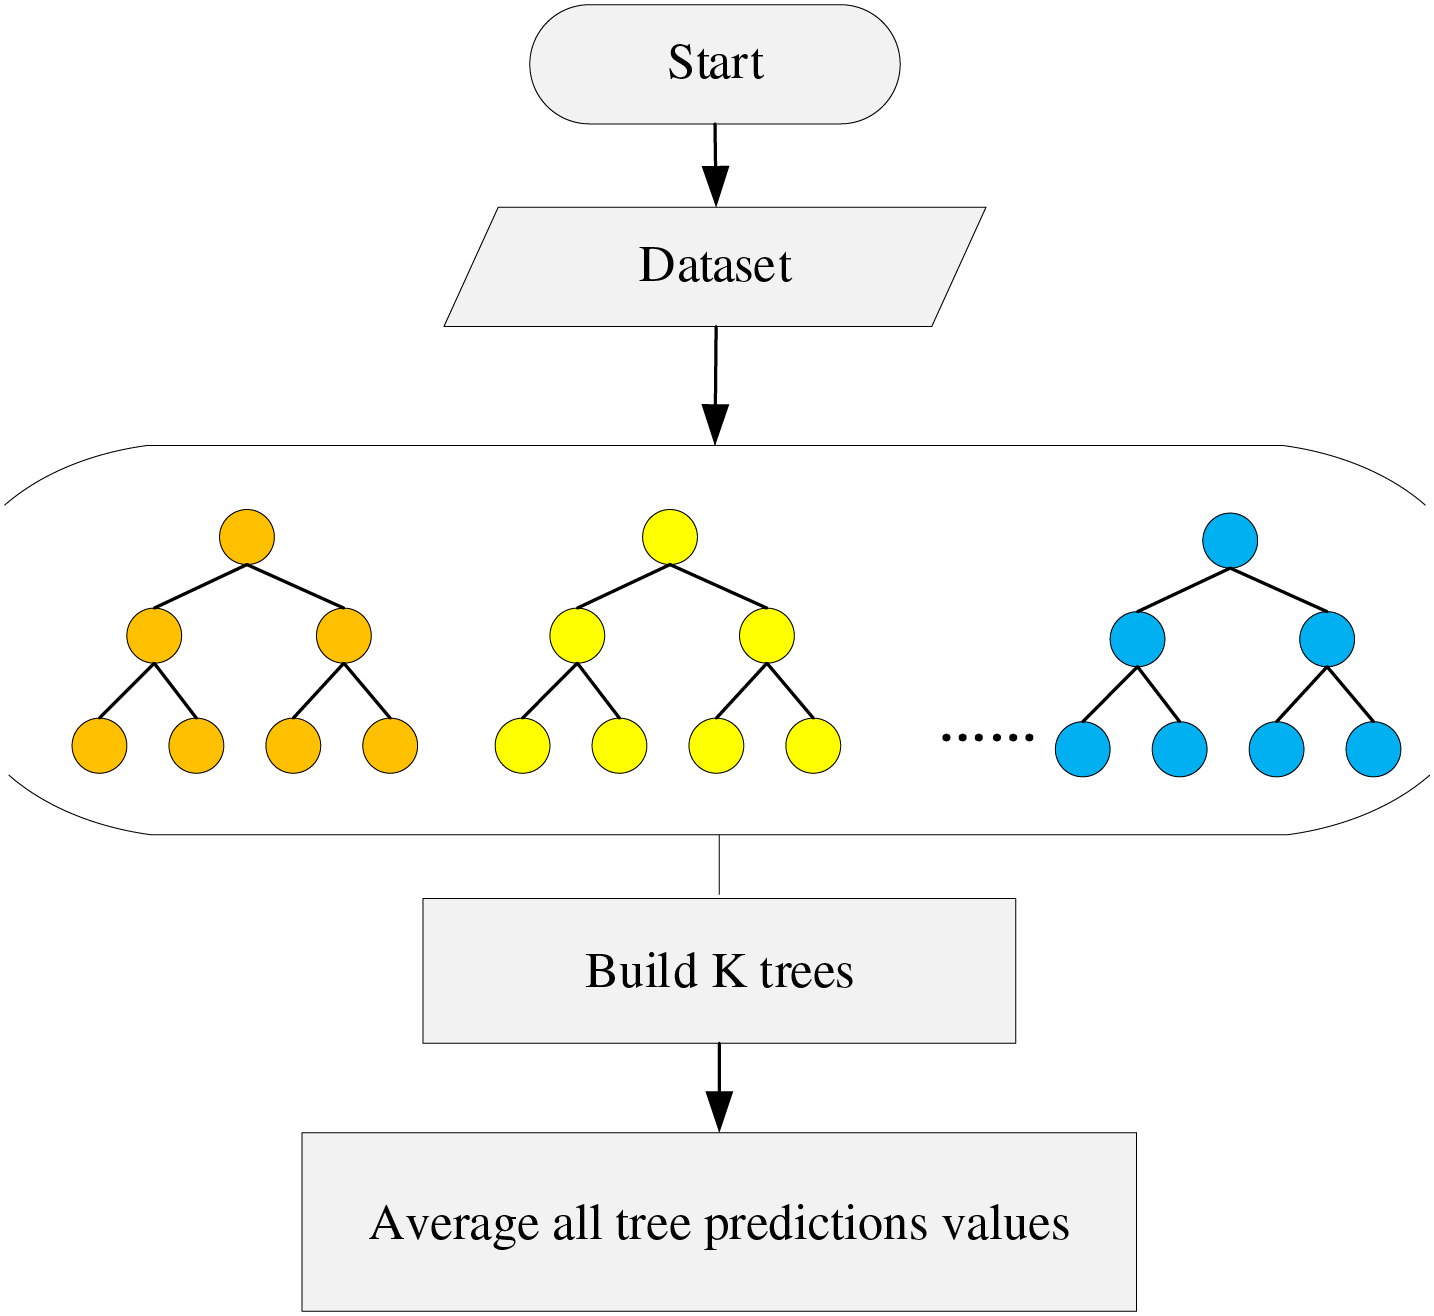
Figure 2: Key steps to build an ERT predictive model
While the prediction performance of a single tree in ERT may be subpar due to the random selection of optimal split attributes, integrating multiple trees can yield better prediction performance. Consequently, ERT excels in reducing variance compared to RF techniques.
For further insights into the background and modeling of ERT, interested readers are directed to additional studies [43].
3.3 Adaptive Boosting Machine (AdaBoost)
AdaBoost constructs a sequence of weak learners using training data and combines them into a robust model by adjusting the sample weight distribution [44]. Fig. 3 illustrates the process of developing the AdaBoost model. During the training process, the weights of samples with significant errors are enhanced, and the sample with the updated weight undergoes training in a new iteration. Consequently, subsequent learners focus on training samples with substantial errors in subsequent training iterations. However, when faced with noise, AdaBoost tends to prioritize the analysis of these complex samples. This can result in a significant increase in the weight of complex samples, ultimately leading to model degradation. Further details regarding the calculations underlying the AdaBoost model can be found elsewhere [45].
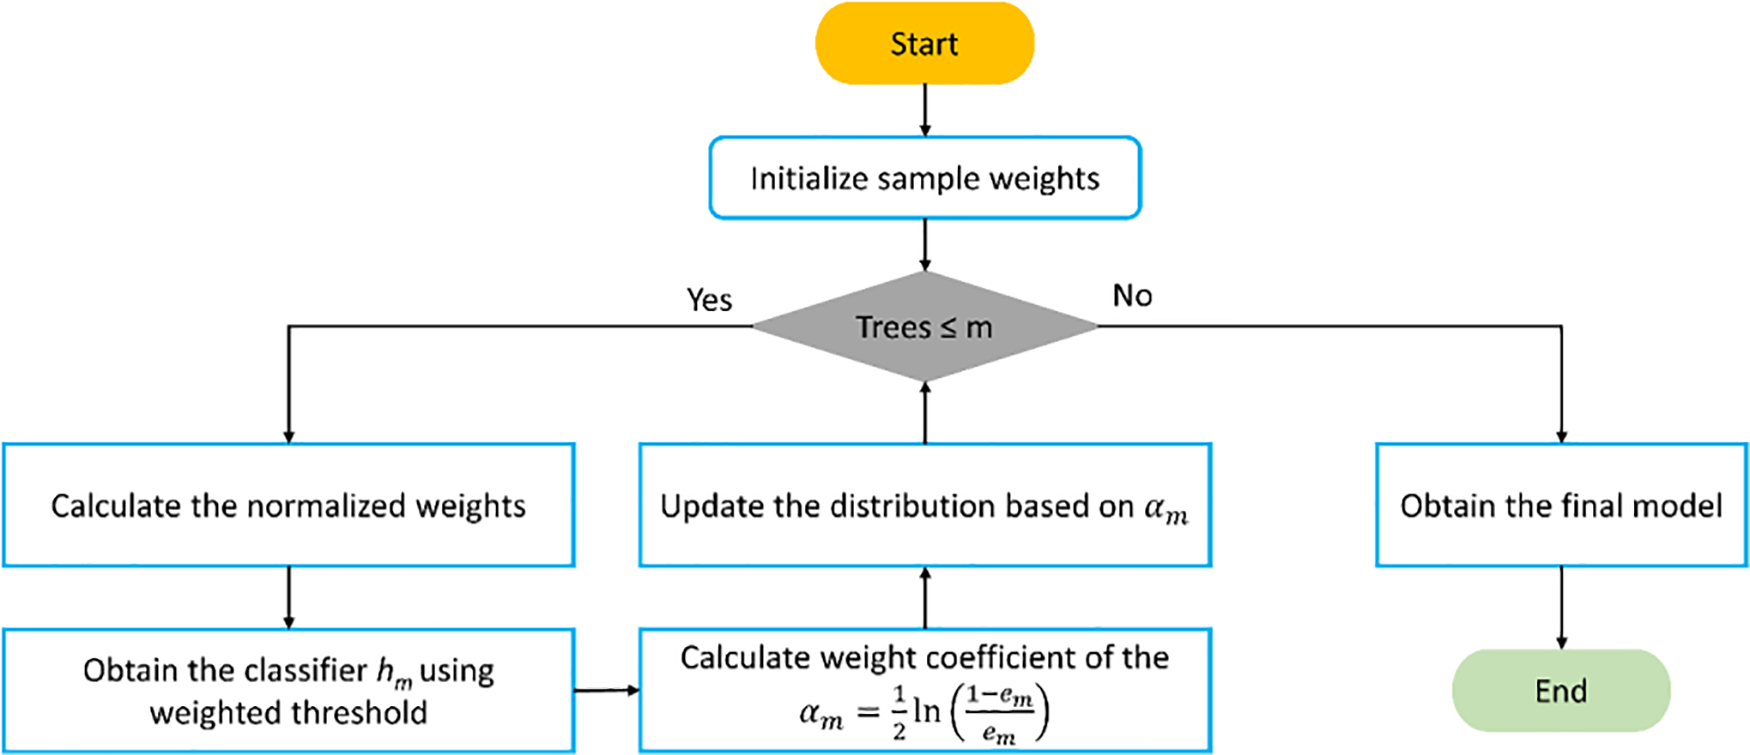
Figure 3: General flowchart to build an AdaBoost predictive model
3.4 Gradient Boosting Machine (GBM)
GBM represents an advancement in boosting algorithms [46]. While optimizing squared or exponential loss functions within the boosting framework can be relatively straightforward, challenges arise when dealing with other types of loss functions. In particular, optimizing for general loss functions poses a difficult task. To address this limitation, Schapire [47] introduced GBM as an approximation method that utilizes the steepest descent as its starting point. In the GBM model, we utilize the negative gradient of the loss function to estimate the residual value within the context of a regression problem. This value is derived from Eq. (1). Fig. 4 depicts the workflow of GBM. Initially, GBM identifies the constant value that minimizes the loss function, resulting in a tree with only one root node. Subsequently, we compute the negative gradient value of the loss function to estimate the residual. In the case of a squared loss function, this directly corresponds to the residual, while for a general loss function, it serves as an approximation. Next, we estimate the regression leaf node region (Rmj) to fit the approximations of residuals. Finally, the loss function is minimized, the regression tree is updated, and the complete model is output.
In Eq. (1),
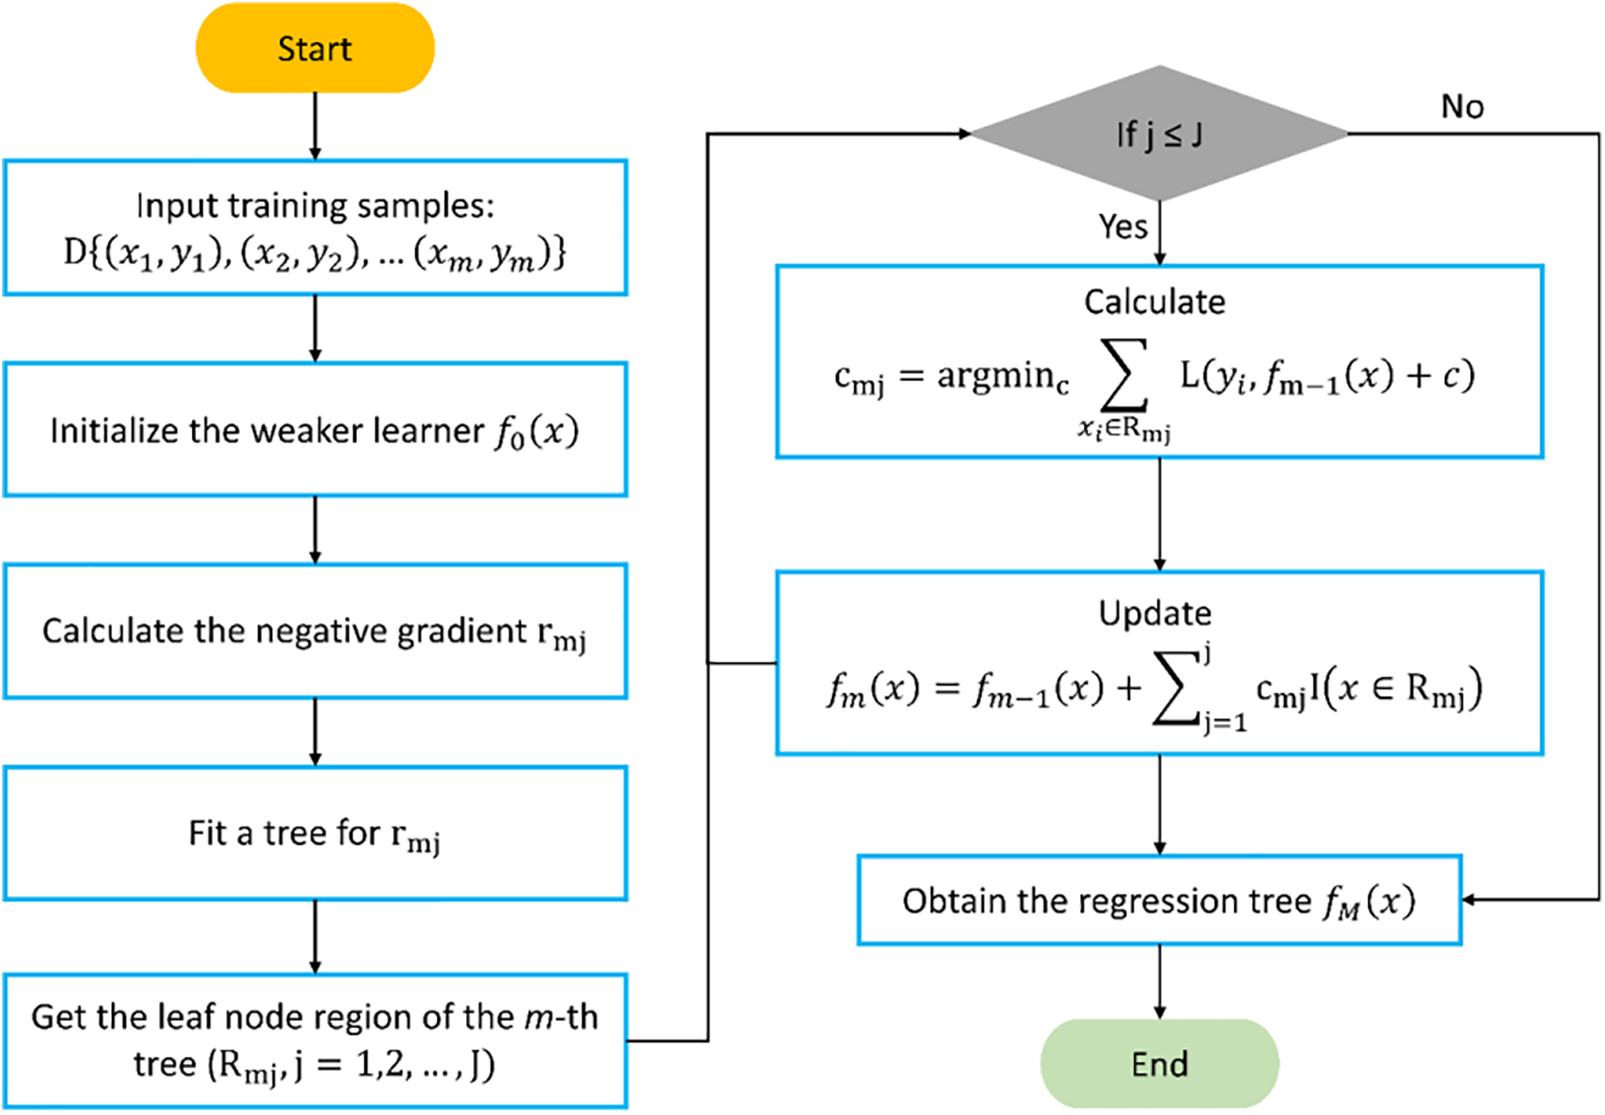
Figure 4: Step-by-step flowchart to develop a GBM predictive model
3.5 Light Gradient Boosting Machine (LightGBM)
LightGBM represents an advancement over the GBM technique. GBM can be computationally intensive and memory-consuming when dealing with large and complex datasets. Loading all training data into memory at once can reduce the total amount of data that can be stored, while frequent reading and writing of data from disk can lead to significant time overhead. To address these challenges, Ke et al. [48] introduced LightGBM in 2017. LightGBM utilizes the histogram optimization algorithm and more efficient leaf growth strategies to reduce memory overhead and speed up computation. Fig. 5 outlines the steps involved in building the LightGBM model. Further details on the formulations of the LightGBM model can be found in other studies [49].
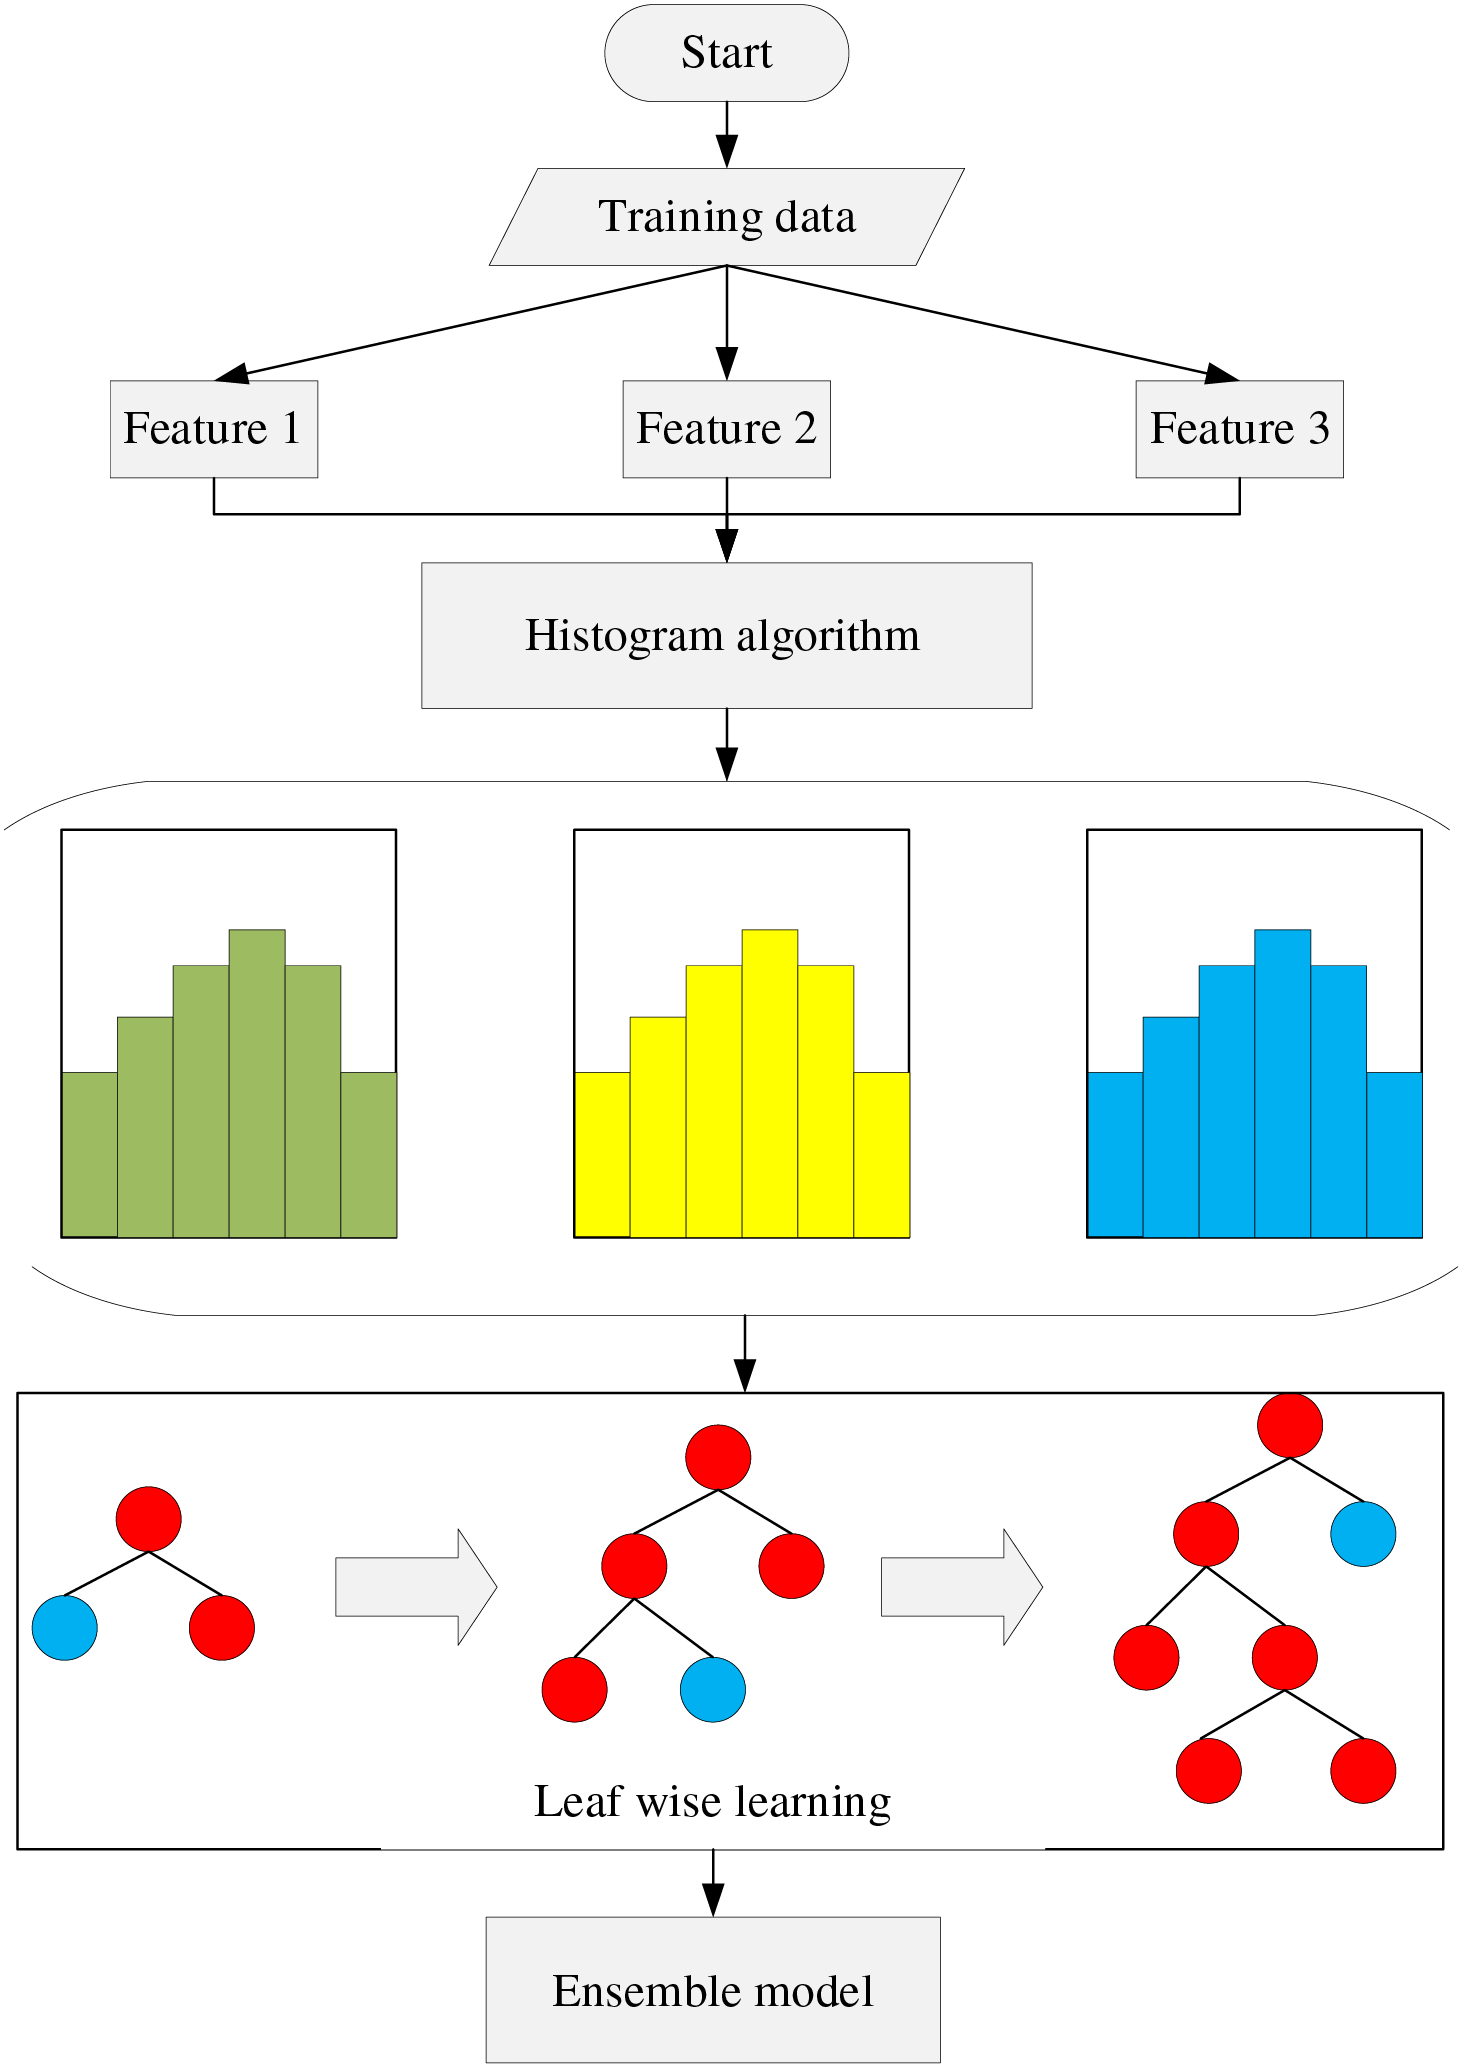
Figure 5: General flowchart of LightGBM technique
3.6 Extreme Gradient Boosting Machine (XGBoost)
Compared to GBM, XGBoost incorporates several enhancements. XGBoost employs second-order Taylor expansion on the loss function and facilitates convex optimization [50]. Additionally, distributed computing can be utilized to enhance speed. Fig. 6 illustrates the flowchart of XGBoost.
XGBoost offers the following advantages over GBM:
1. Support for Linear Learners: XGBoost supports linear learners in addition to tree-based models.
2. Utilization of Second-Order Taylor Expansion: XGBoost employs the second-order Taylor expansion of the cost function as its objective function, facilitating more efficient optimization.
3. Column Sampling and Regularization: To prevent overfitting and reduce computation, XGBoost introduces column sampling and regularization terms.
4. Dynamic Learning Rate Allocation: XGBoost allocates the learning rate to leaf nodes after each iteration, reducing the weight of the tree and providing a more effective learning space.
For further details on the calculations underlying XGBoost, interested readers are directed to additional studies [40,49].
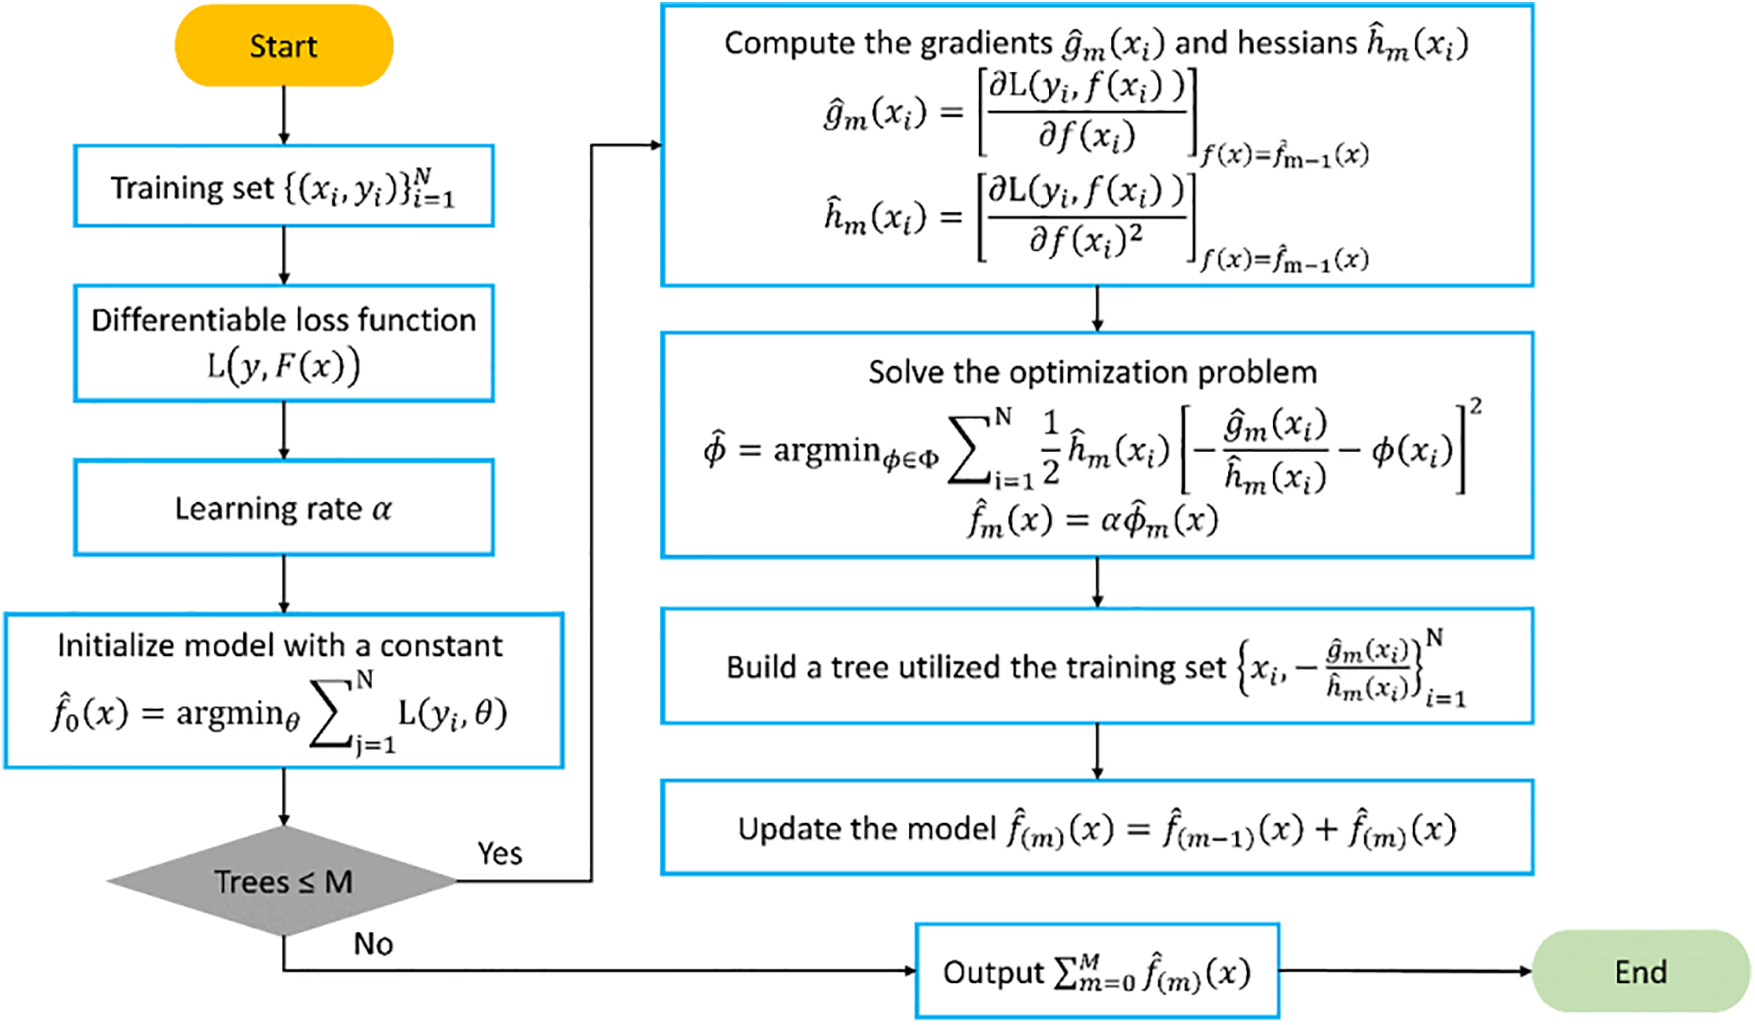
Figure 6: General flowchart of XGBoost in solving prediction problems
3.7 Category Gradient Boosting Machine (CatBoost)
CatBoost utilizes oblivious trees as base predictors, which are symmetrical and employ the same criteria for splitting nodes [51]. These balanced oblivious trees are not easily overfitted. Fig. 7 presents the flowchart of CatBoost. One of the distinguishing features of CatBoost is the replacement of the gradient estimation approach with ordered boosting. This substitution reduces the inherent bias of gradient estimation and enhances the model’s capacity for generalization. In CatBoost, unbiased estimation of gradient steps is utilized in the first stage, followed by a traditional Gradient Boosting Machine (GBM) scheme in the second stage. The primary optimization in CatBoost occurs during the first phase. During the construction phase, CatBoost operates in two boosting modes: ordered and plain. The plain mode applies the standard GBM algorithm after transforming categorical features using built-in ordered target statistics, while the ordered mode represents an optimization of the ordered boosting algorithm. CatBoost demonstrates robustness and reduces the need for hyperparameter tuning, thus lowering the risk of overfitting and enhancing model universality. Additionally, CatBoost can handle both categorical and numerical features, and it supports custom loss functions. For further insights into the mathematical formulations and modeling process of CatBoost, interested readers are encouraged to refer to additional studies [52].
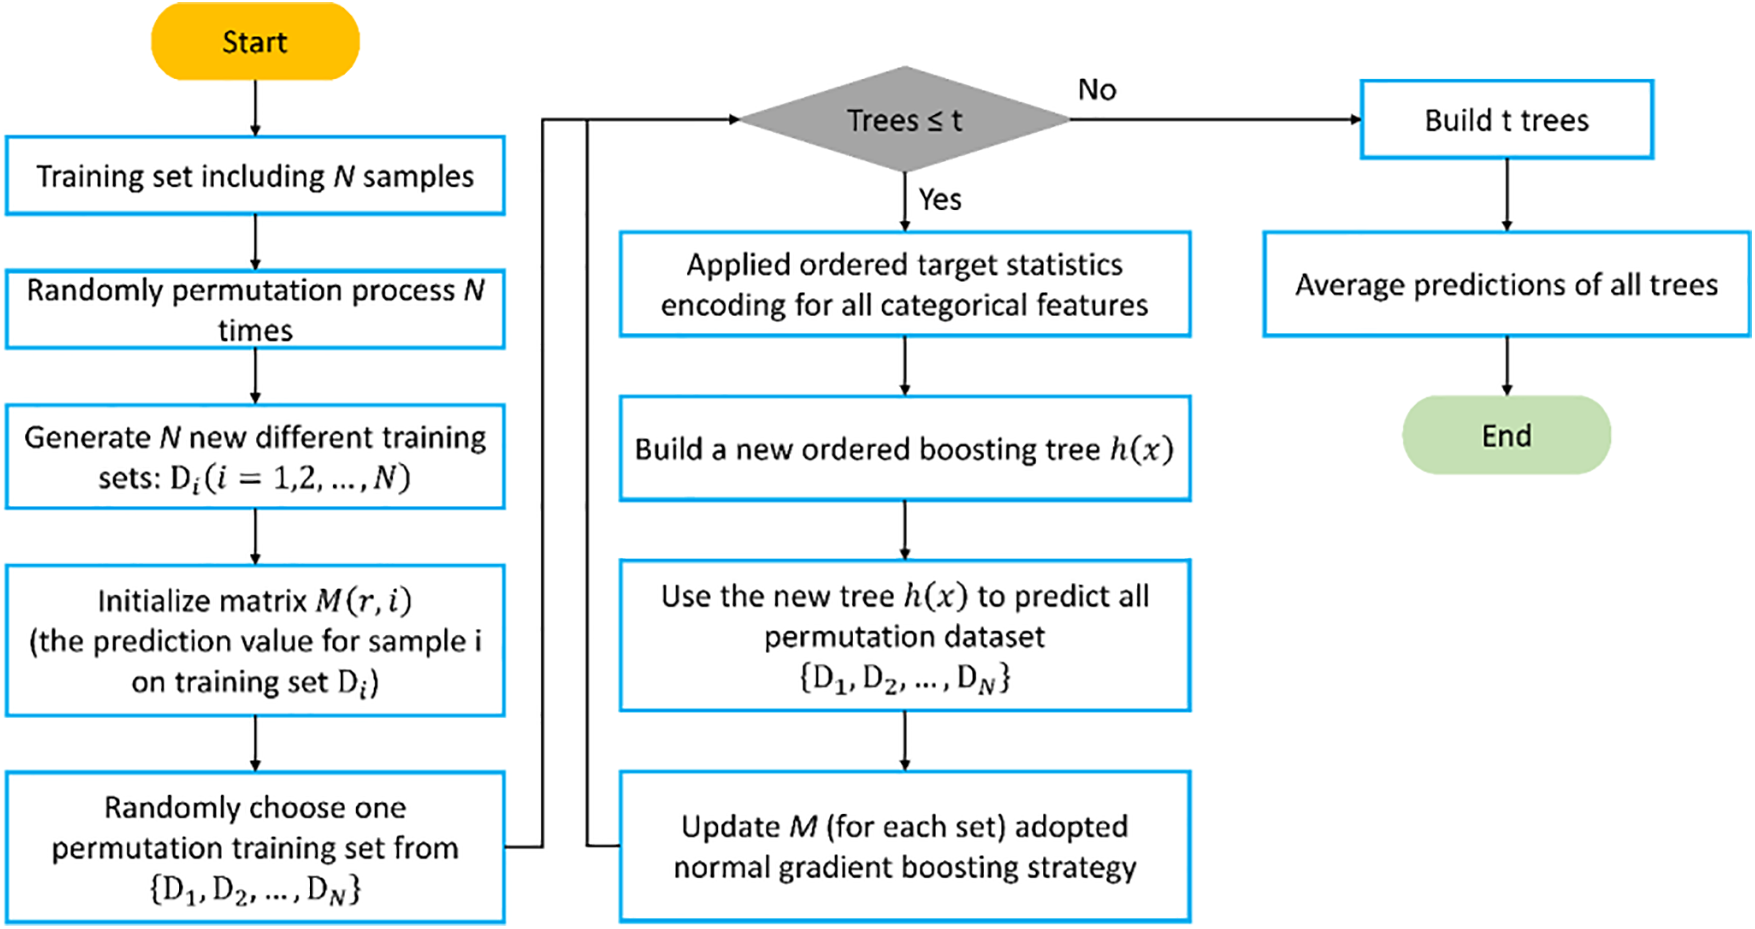
Figure 7: Key steps to construct a CatBoost predictive model
To address water shortages in the Selangor region of Malaysia, plans were made to transfer water from Pahang State to Selangor State. However, the presence of mountains between the two states posed a significant obstacle to the project. Consequently, the Pahang-Selangor Raw Water Transfer Tunnel was proposed to span the entire mountain range. The elevation of this mountain range ranges from 100 to 1400 meters. The tunnel is segmented into four sections based on rock types, with granite being the predominant rock type. Additionally, the tunnel traverses six faults characterized by poor rock-bearing capacity. The total length of the tunnel is approximately 45 km, with three TBMs responsible for excavating around 35 km, while the remaining 10 km are tackled by four drilling and blasting sections. For further details regarding the study area, additional descriptions are available elsewhere [25].
4.2 Input Parameters and Database
To facilitate simulation, a comprehensive database was compiled through field observations and laboratory experiments. This database comprises 1113 data samples collected from various WZs within a granitic rock mass. Benardos et al. [53] identified rock quality designation (RQD), rock mass WZ, RMR, and UCS as the most influential rock attributes affecting TBM performance. BTS, serving as a rock strength indicator, is preferred over UCS due to its ease of measurement in laboratory-prepared rock samples [54]. It has been widely utilized in recent TBM performance prediction models [25,27]. While some researchers [38,55] advocated for including TBM-related parameters such as thrust force, tunnel diameter, and revolutions per minute, others [56–60] argued that a predictive TBM performance model should solely rely on inputs representing rock mass and material properties. This approach is favored due to the unavailability of machine specifications during the project planning stage, which are typically only accessible after the machine is operational in a specific project. Thus, a predictive TBM performance model would be more applicable if it could be established before tunnel construction, or even before ordering the machine. Given that TBM performance prediction is crucial for managing and minimizing project costs, it appears that the only available parameters during the site investigation phase of a tunnel project are related to rock mass and material properties. Based on these considerations, this study selects RMR, WZ, and BTS as input parameters to predict TBM PR.
In this study, RMR, a rock mass classification proposed by Bieniawski [61], was obtained for each panel, roughly spanning 10 meters. RMR incorporates the effects of six different parameters: RQD, UCS, spacing and condition of discontinuities, groundwater condition, and joint orientation condition. By evaluating these parameters, the corresponding rates are calculated, leading to the determination of final RMR values. Notably, parameters such as UCS and RQD, suggested in the literature, are inherently considered within the RMR calculation. To incorporate another component related to rock material properties, BTS tests were conducted on rock samples collected from the tunnel face. While it wasn’t feasible to conduct BTS tests for every panel, over 150 rock samples were gathered from various tunnel locations and subjected to BTS testing. Subsequently, the obtained BTS values were assigned to the surrounding panels of the specific sample collection point.
Additionally, the WZ of each panel was observed and recorded in the prepared database. Three distinct WZs were included in the dataset: fresh, slightly weathered, and moderately weathered. The first two WZs were utilized for training and testing tree-based models, while the moderately weathered data was reserved for validation purposes. Finally, the TBM machine recorded PR values for each panel, serving as the output variable in this study.
After conducting a pre-processing analysis on the data, it was revealed that there were outliers present among the training and testing data samples, totaling 1113. These outliers were identified using statistical rules such as the median, 25th and 75th percentiles, and upper and lower bounds. Subsequently, a total of 70 data samples were flagged as outliers and removed from the training and testing database, resulting in a final dataset of 1043 samples used for modeling. Fig. 8 illustrates the distributions of input and output parameters utilized for training and testing analysis. As depicted in Fig. 9, the box plot demonstrates that the outliers have been successfully eliminated from the database through this process. To provide a clearer perspective of the data, a 3D scatter diagram depicting the relationship between RMR, BTS, and PR for different WZs is presented in Fig. 10. It is observed that similar properties are evident for rock mass and material in fresh and slightly weathered WZs. Furthermore, Fig. 11 illustrates the correlation between the variables by Pearson correlation coefficient (PCC). PCC can be calculated using the following equation:
where
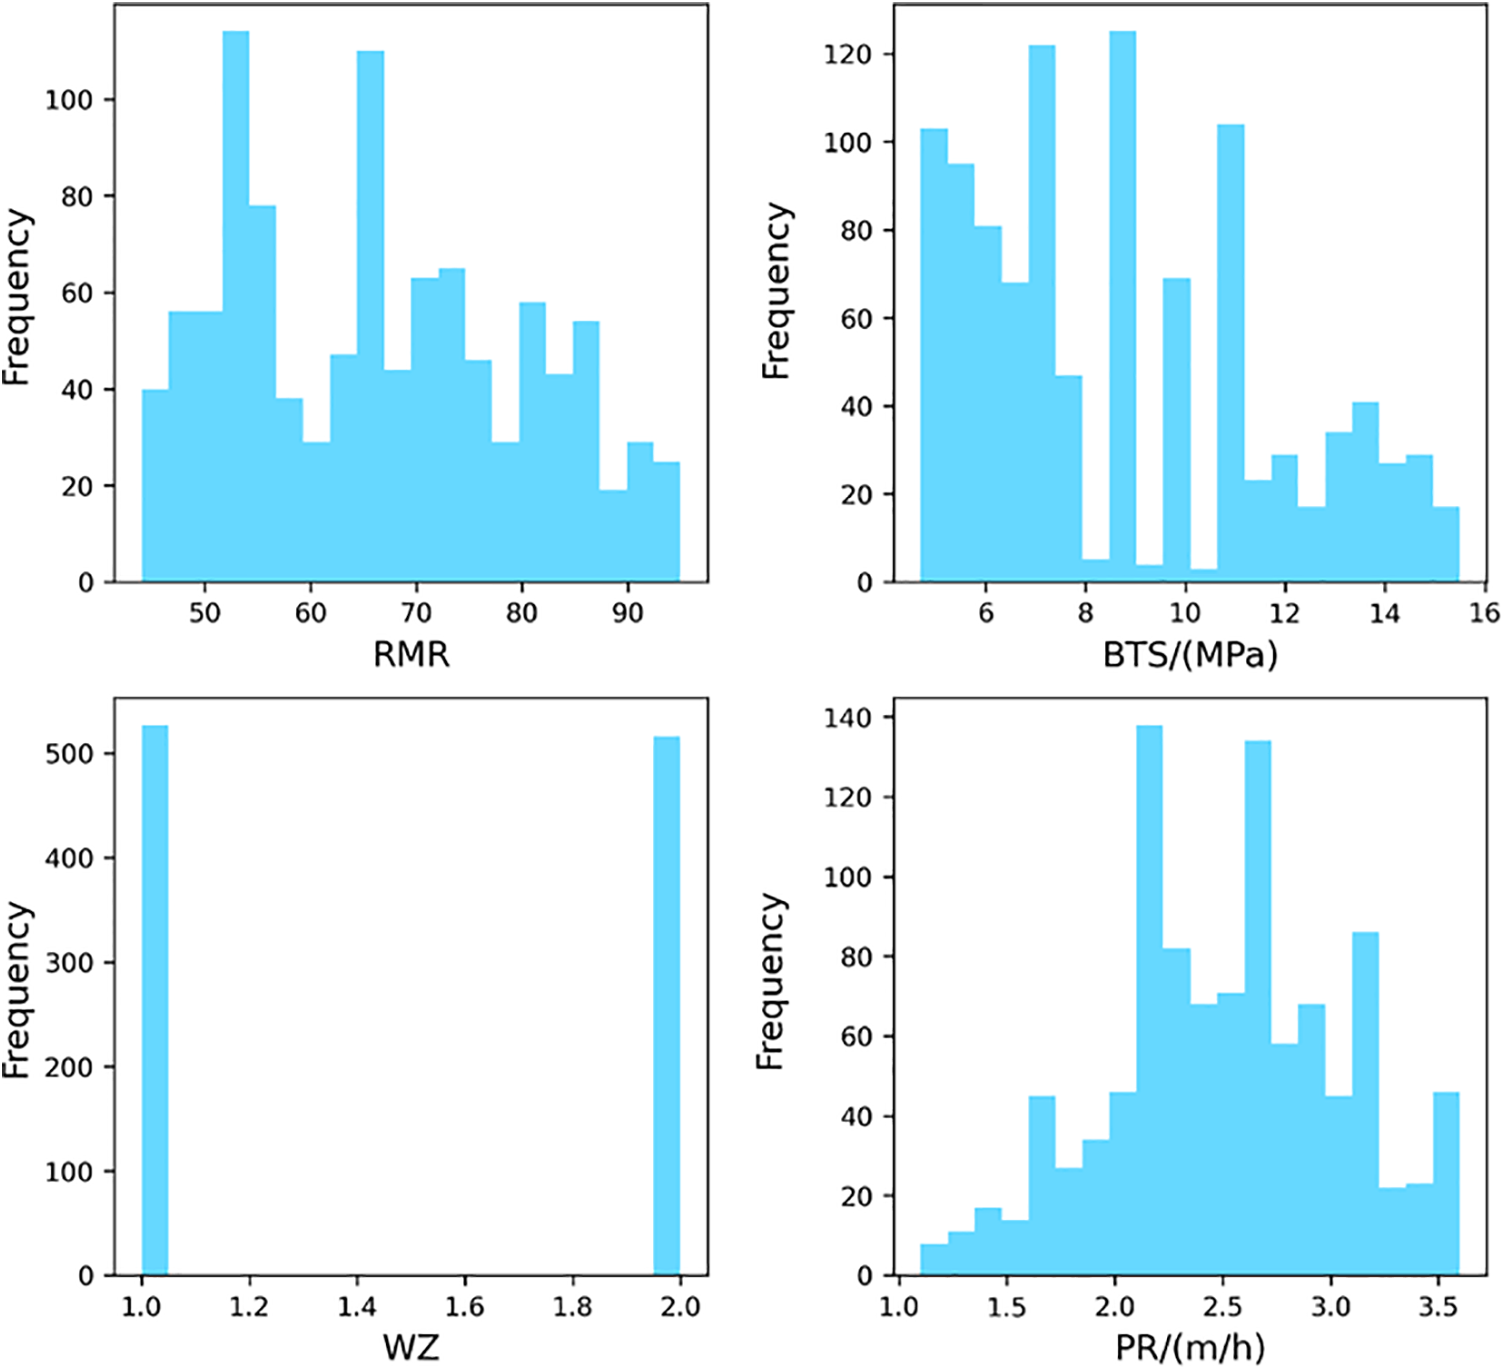
Figure 8: The histograms of input variables and the target variable
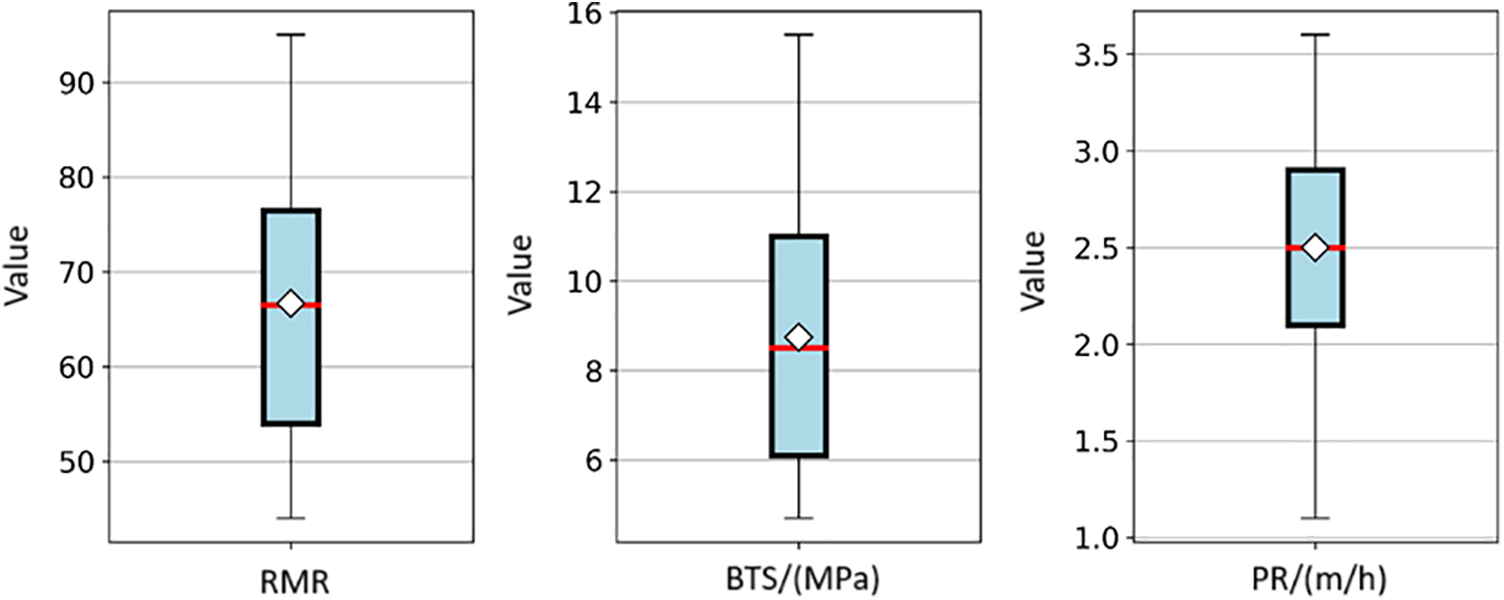
Figure 9: The boxplots of RMR, BTS, and PR
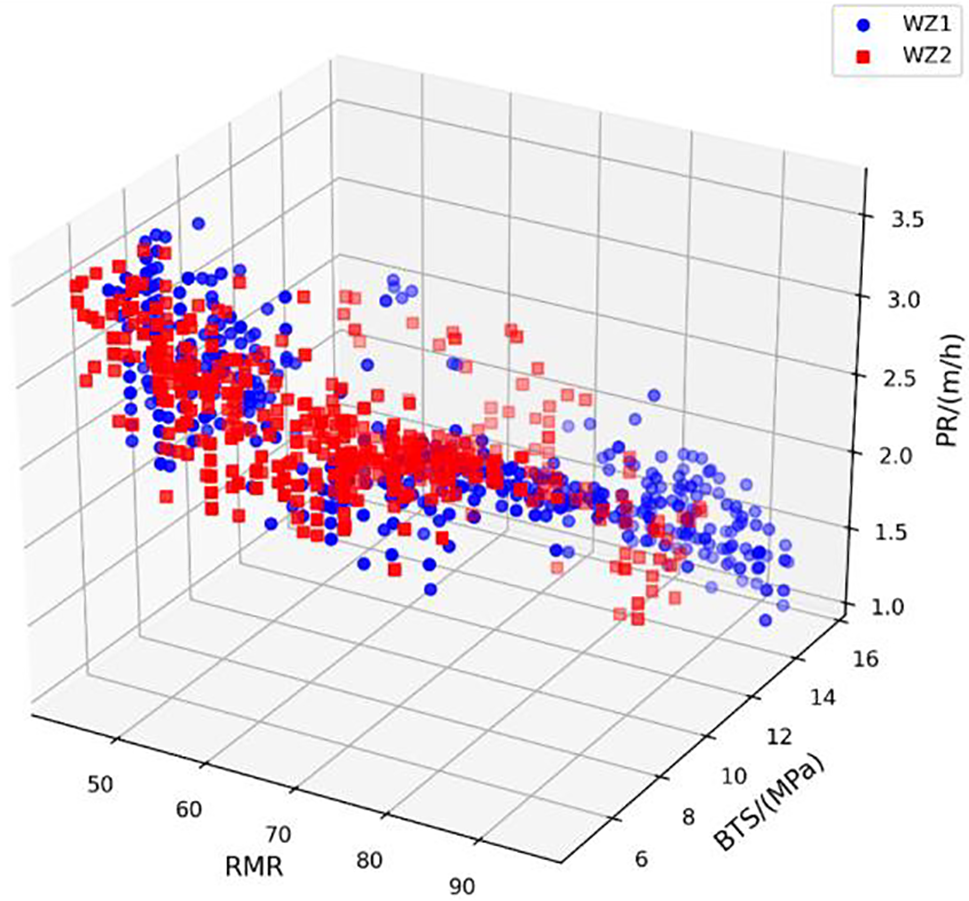
Figure 10: The 3D scatter plot of RMR, BTS, and PR in each WZ (WZ1: fresh, WZ2: slightly weathered)
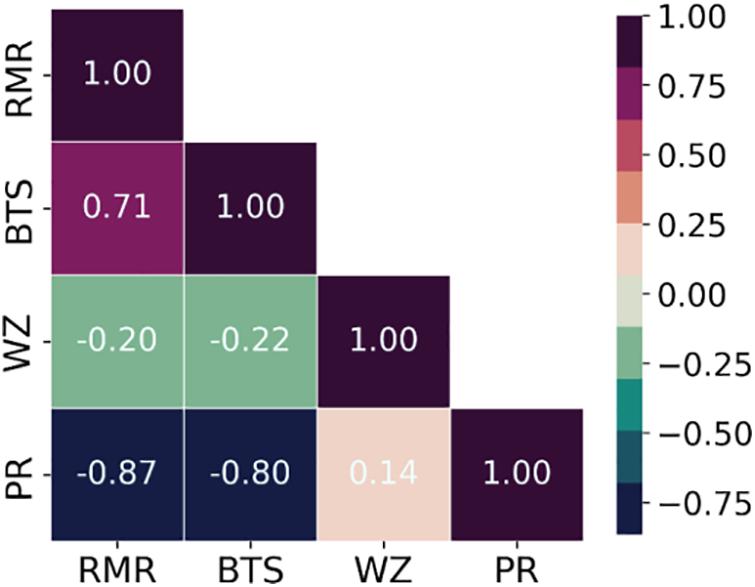
Figure 11: The correlation matrix of the training and testing database
According to the PCC values in the box plot, RMR and BTS exhibit a significantly negative correlation with PR, indicating their influence on the TBM Penetration Rate. Conversely, WZ demonstrates an insignificant correlation with PR.
4.3 Step-by-Step Study Flowchart
As illustrated in Fig. 12, the database underwent random partitioning, resulting in the creation of a training set comprising 80% of the data and a testing set containing the remaining 20%. The training set was then utilized to construct estimation models using seven ensemble trees. Within the tree-based models, the initial step involved crafting individual trees, followed by the application of multiple techniques to amalgamate these trees into the ultimate tree-based ensemble models. Upon the conclusion of the model development phase, five performance metrics were employed to assess the efficacy of the models during both the training and testing phases. Subsequently, the Taylor diagram and ranking system were adopted to compare and rank the performance of these seven tree-based models for predicting TBM performance. Finally, the best-performing tree-based model will be selected based on the aforementioned procedure. Furthermore, model validation will be conducted using a newly provided database to ascertain whether the developed models are suitable for practical use, especially under new geological conditions. This validation process aims to ensure the robustness and generalizability of the developed models in real-world applications.
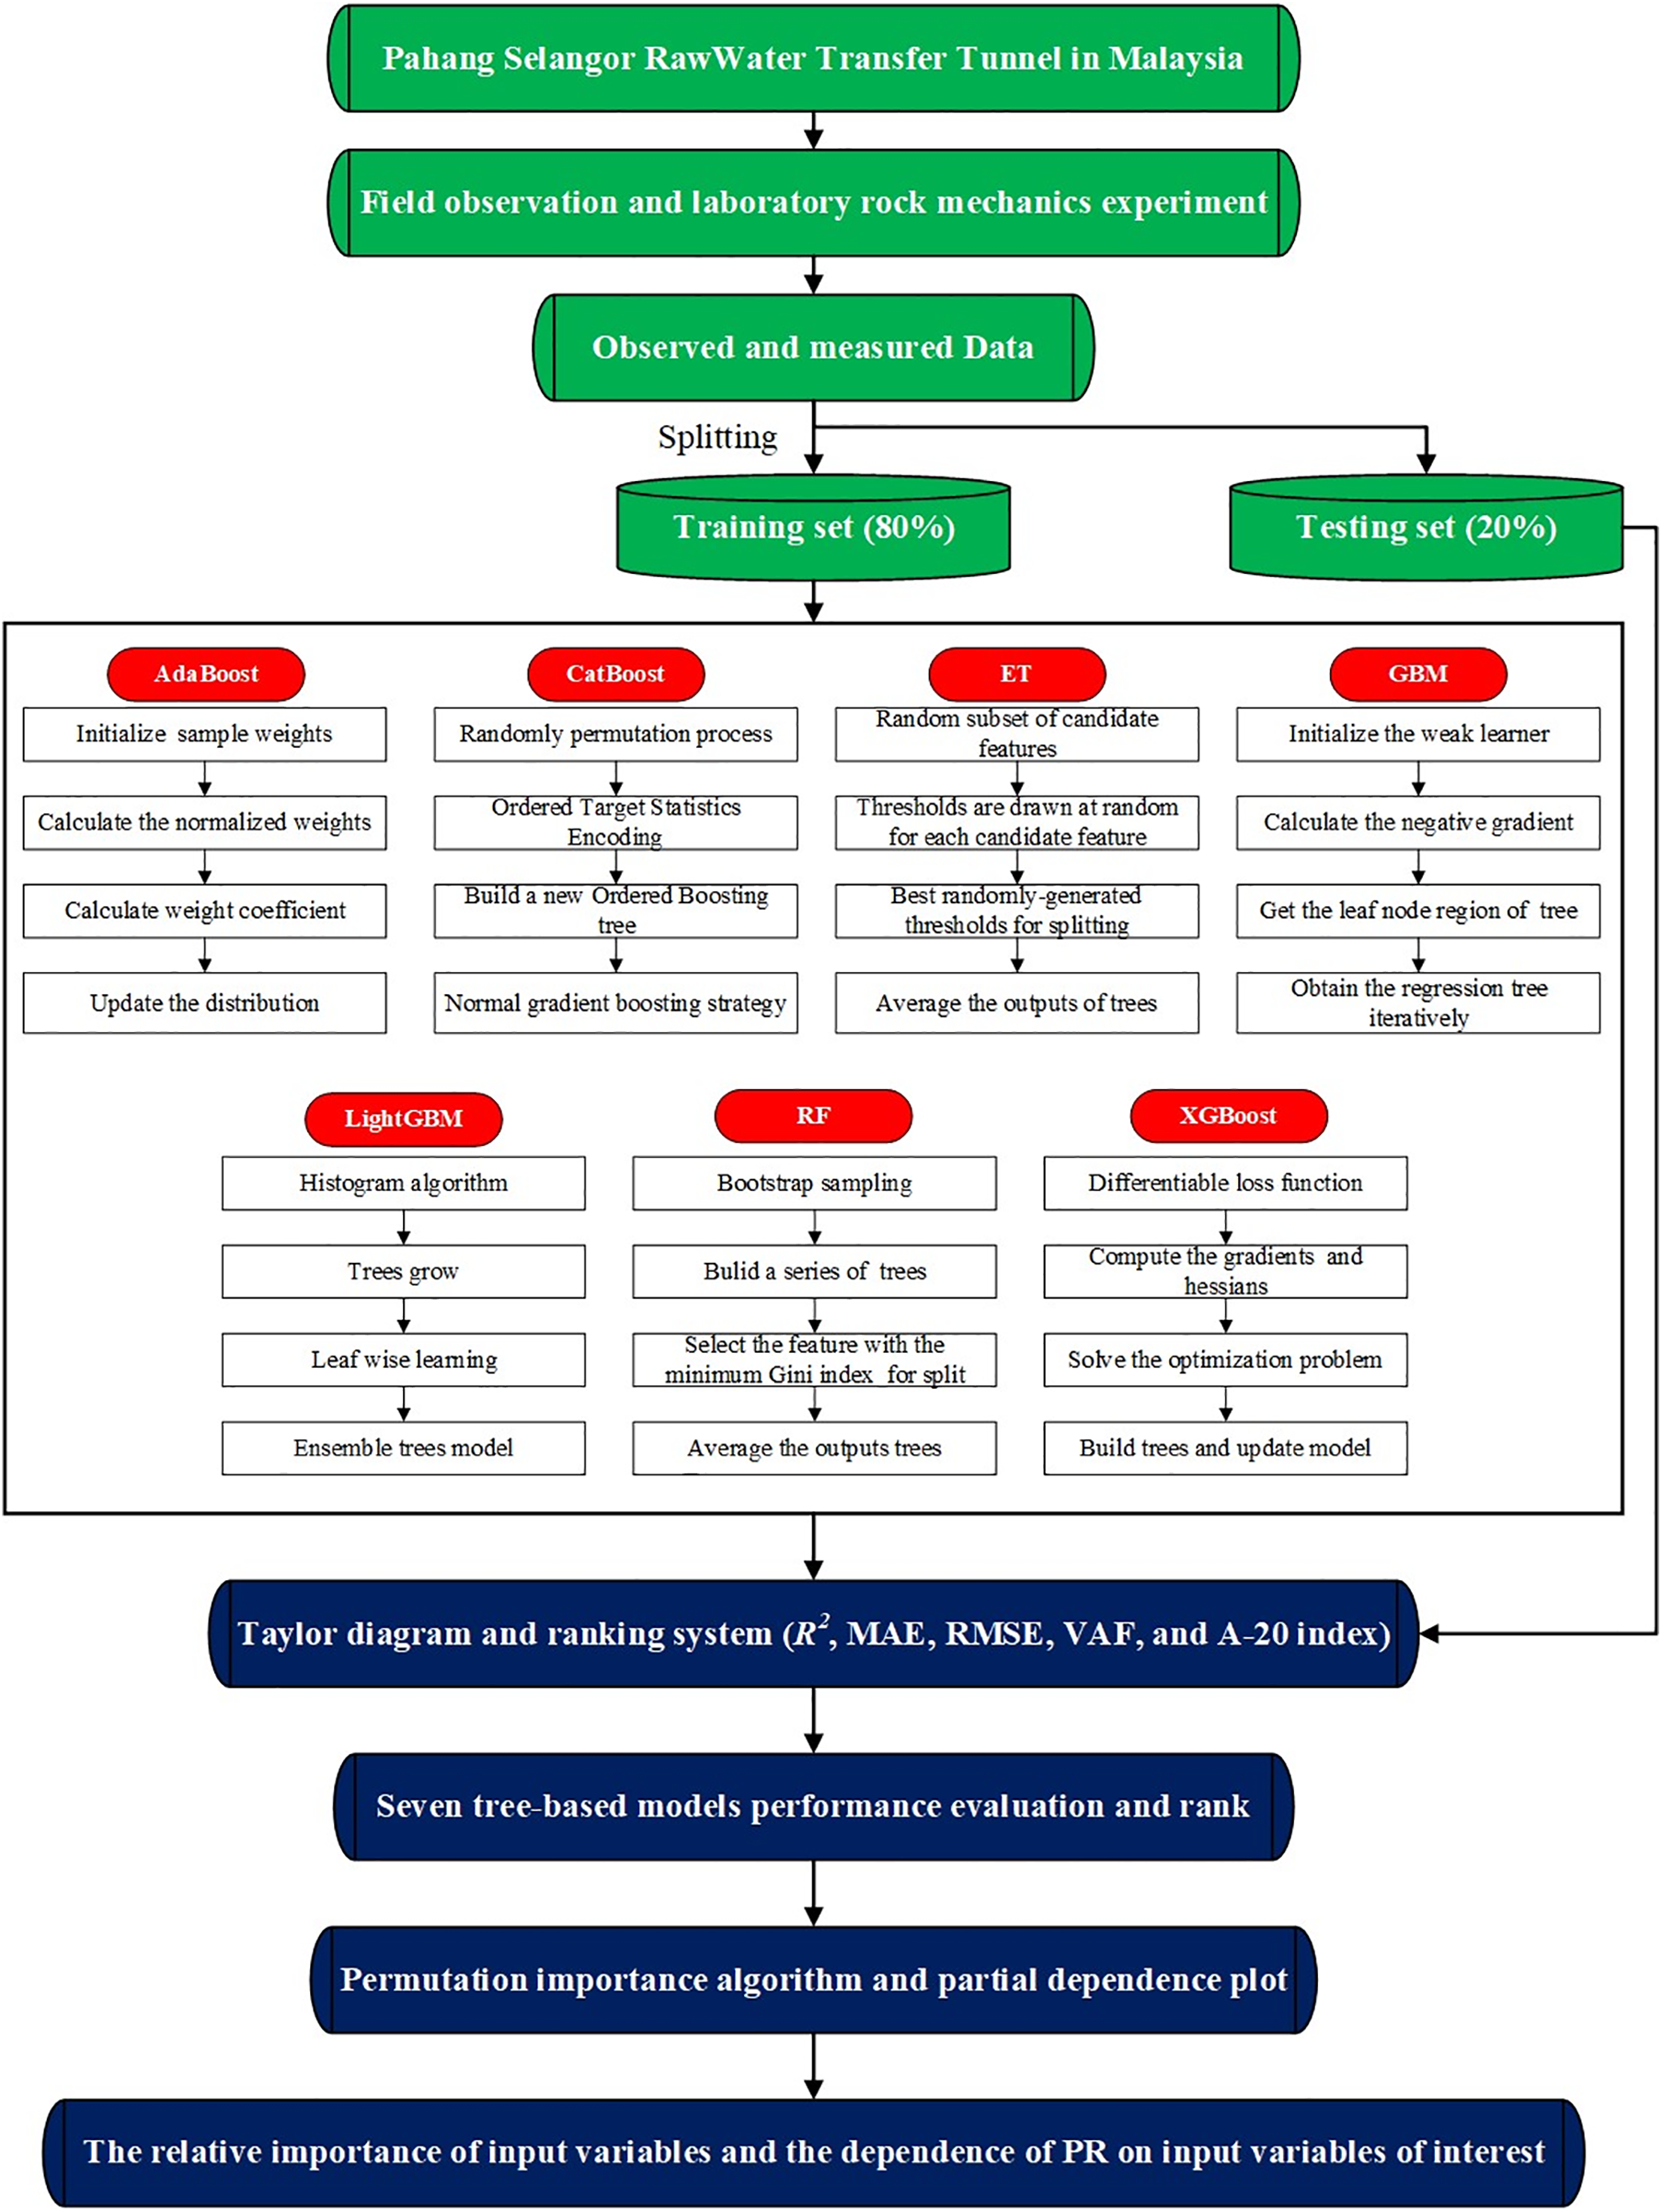
Figure 12: The flowchart of methodology employed in this research
In this section, a basic regression analysis was conducted to explore the connections between the target variable and the predictors. To assess the effectiveness of the predictive equation, five different trend-line types (exponential, linear, logarithmic, polynomial, and power) were applied to estimate TBM PR. The coefficient of determination (R2) was computed to compare the capacities of these equations, as shown in Table 1. Given the limited variability in the WZ variable, with only two values present, it was deemed unnecessary to include this variable in the simple analysis. Therefore, it was excluded from this analysis. The effects of changes in WZ can be observed in the properties of rock mass (e.g., RMR), making it more relevant to consider those parameters instead of WZ in proposing any empirical equation. From the results presented in Table 1, it was found that the exponential trend-line exhibited a better fit for establishing the relationship between PR and RMR (R2 = 0.752). Additionally, the polynomial trend-line was deemed more suitable for fitting the relationship between PR and BTS (R2 = 0.649). Figs. 13 and 14 illustrate the correlations between PR and the input variables. It is apparent that PR decreases with the increase of RMR and BTS, a trend supported by existing literature [13].
In Eq. (5),

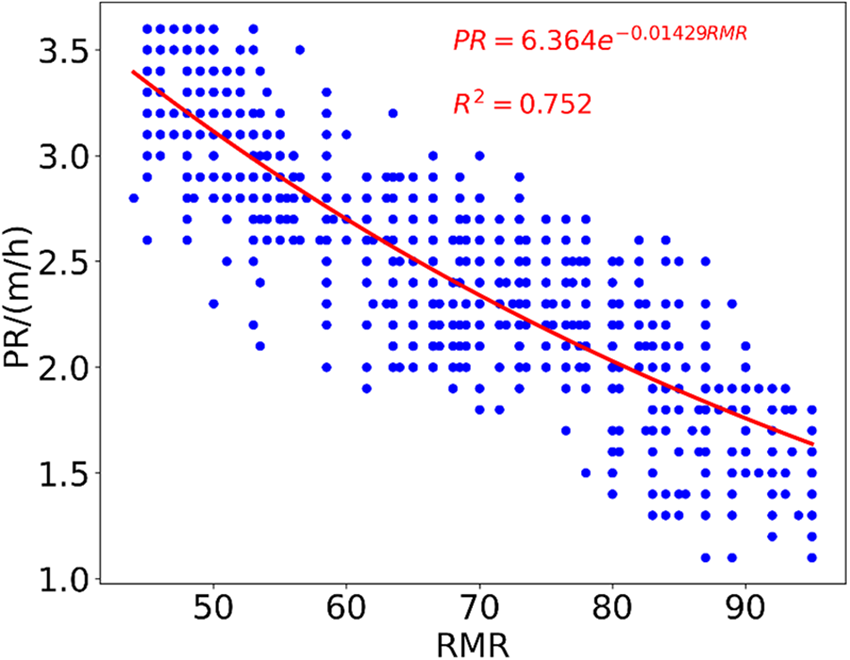
Figure 13: PR equation and its performance using RMR values
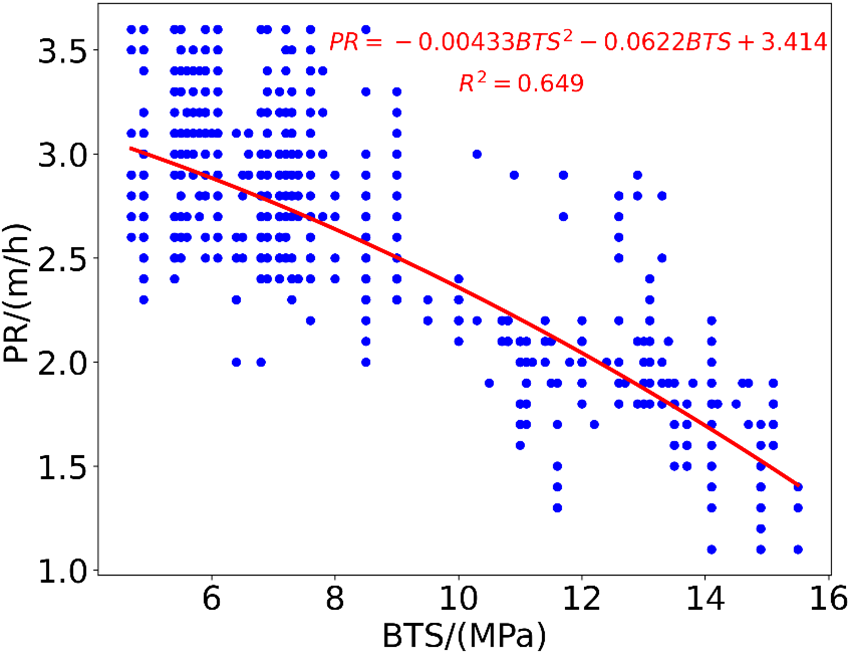
Figure 14: PR equation and its performance using BTS values
In general, mining and civil engineers often prefer to apply simple regression equations for problem-solving due to their ease of use. However, in the case of mechanized tunnel construction, which is a massive and expensive project, accuracy in prediction is crucial. Accurate prediction entails achieving R2 values closest to one. Therefore, based on the results obtained in this section, there is a clear need to explore and develop other techniques, such as tree-based models, to forecast TBM performance accurately. In the subsequent subsection, we will outline the procedure for introducing tree-based models in predicting TBM PR.
As mentioned earlier, the complete dataset, comprising 1043 samples after outlier elimination, was divided into training (80%) and testing (20%) segments. The training segments were used to construct ensemble tree-based models, while the testing segments were utilized to assess the models’ performance. Range standardization (Eq. (6)) was applied to preprocess the input parameters.
We utilized the open-source Python library, Scikit-learn [42], for developing RF, ERT, AdaBoost, and GBM models. Additionally, XGBoost [50], LightGBM [48], and CatBoost [51] were employed to construct the XGBoost, LightGBM, and CatBoost models, respectively. The number of trees is a crucial parameter in the tree-based models, significantly influencing model performance. In contrast to bagging models (RF and ERT), boosting models (AdaBoost, GBM, XGBoost, LightGBM, and CatBoost) featured an additional critical parameter known as the learning rate, which had a significant impact on the performance of these boosting models. In this research, all parameters were set to their default values in Python libraries. Table 2 presents the values of the main parameters in these seven tree-based models. Due to their similar training theory, the hyperparameter setting of RF was identical to that of ERT. The nodes in RF and ERT were expanded until all leaves were pure. The hyperparameter configuration in each boosting model was different because their training principles differed from each other. After determining the hyperparameters, the training samples were input into these models. The comprehensive nonlinear relationships between PR and RMR, BTS, and WZ were incorporated into seven tree-based models. Finally, seven models for TBM performance evaluation were obtained. The remaining testing set was utilized to assess the models’ capabilities. To compare and evaluate the tree-based models, we computed and utilized five regression task evaluation metrics. These metrics included mean absolute error (MAE), root mean square error (RMSE), variance accounted for (VAF), and the A-20 index. These indicators were extensively used as assessment methods in previous studies [25]. The following equations were implemented to compute MAE, RMSE, VAF, and the A-20 index:
where

Figs. 15–21 display the results of the training and testing phases for the seven tree-based models. In these figures, the red line represents the scenario where the estimated value equals the actual value, and points falling on it indicate perfect prediction. It is evident that many points are clustered near the red line, indicating a good prediction effect. The A-20 index is calculated as the ratio of the number of points falling within the two dotted purple lines to the total number of points. Consequently, all tree-based models exhibit good performance in both the training and testing phases. Further details regarding the assessment of these tree-based models will be provided in the next section.
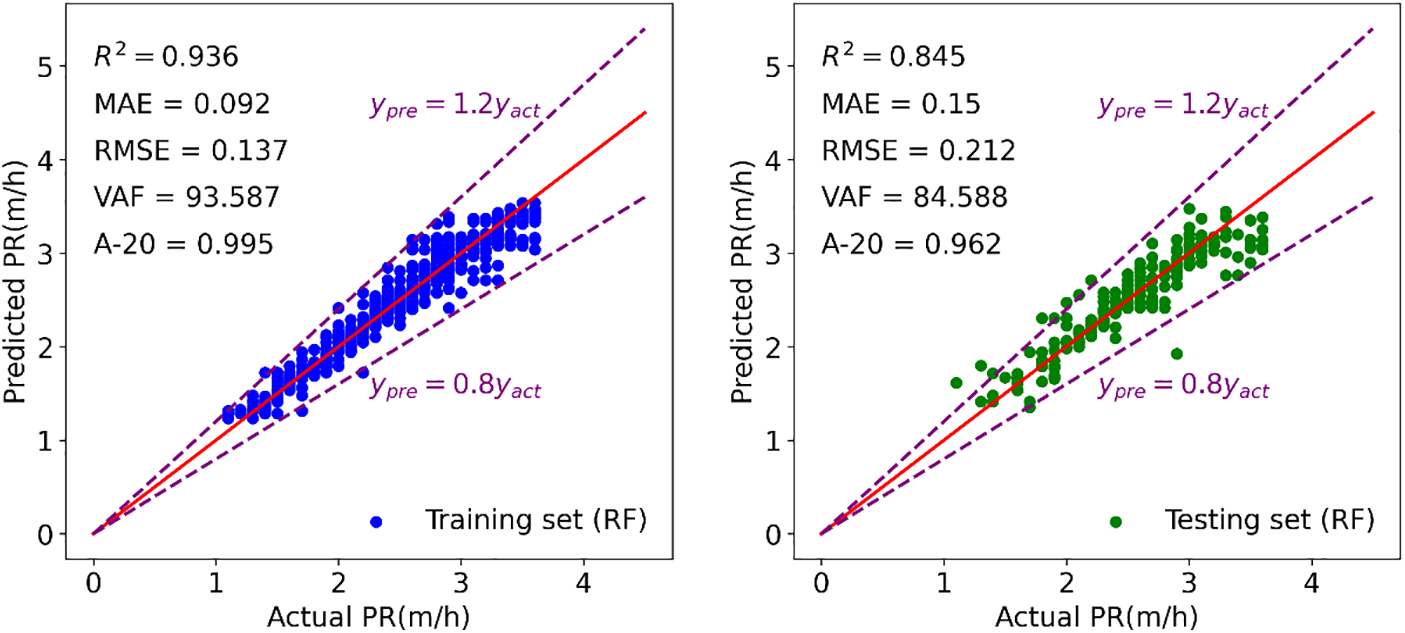
Figure 15: Modeling results of RF to forecast TBM PR
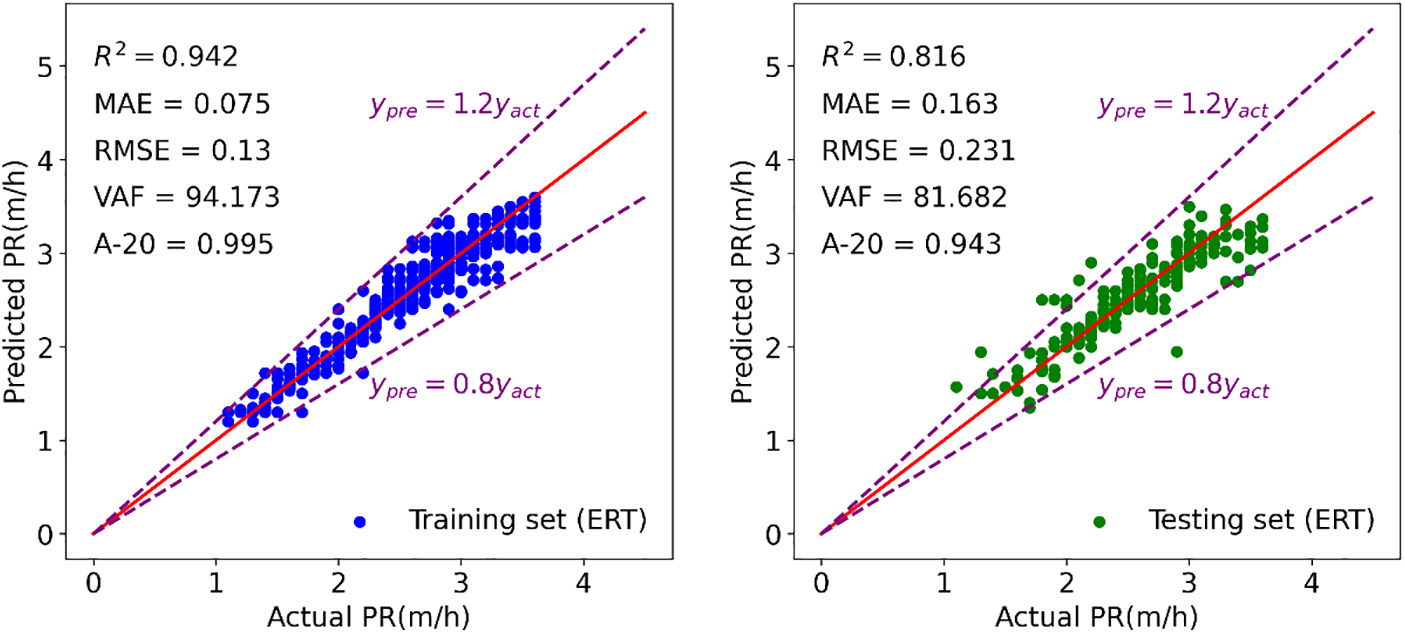
Figure 16: Modeling results of ERT to forecast TBM PR
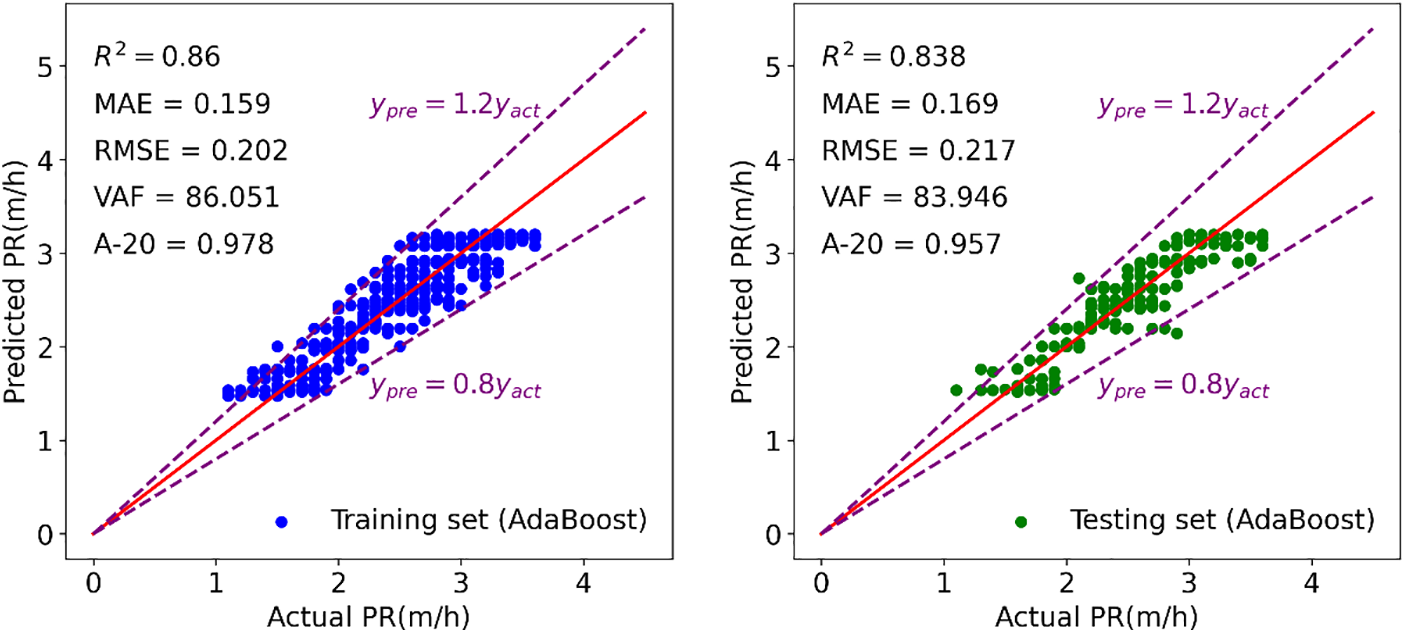
Figure 17: Modeling results of AdaBoost to forecast TBM PR
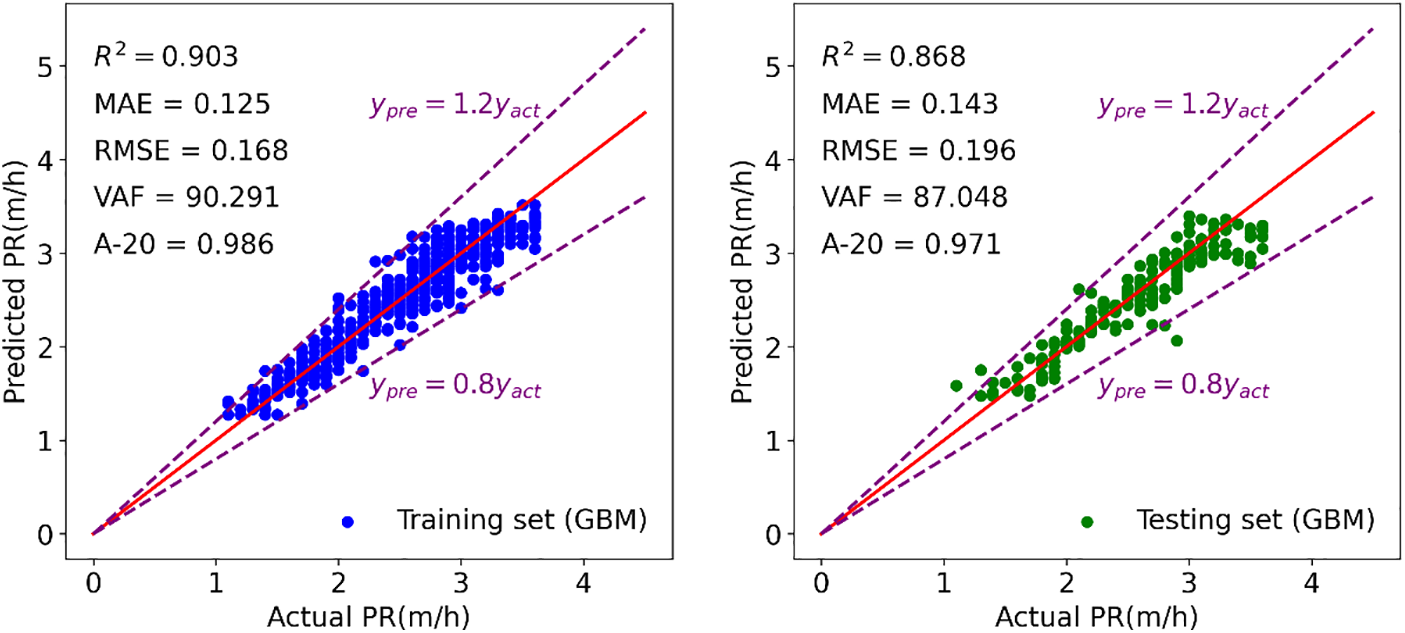
Figure 18: Modeling results of GBM to forecast TBM PR
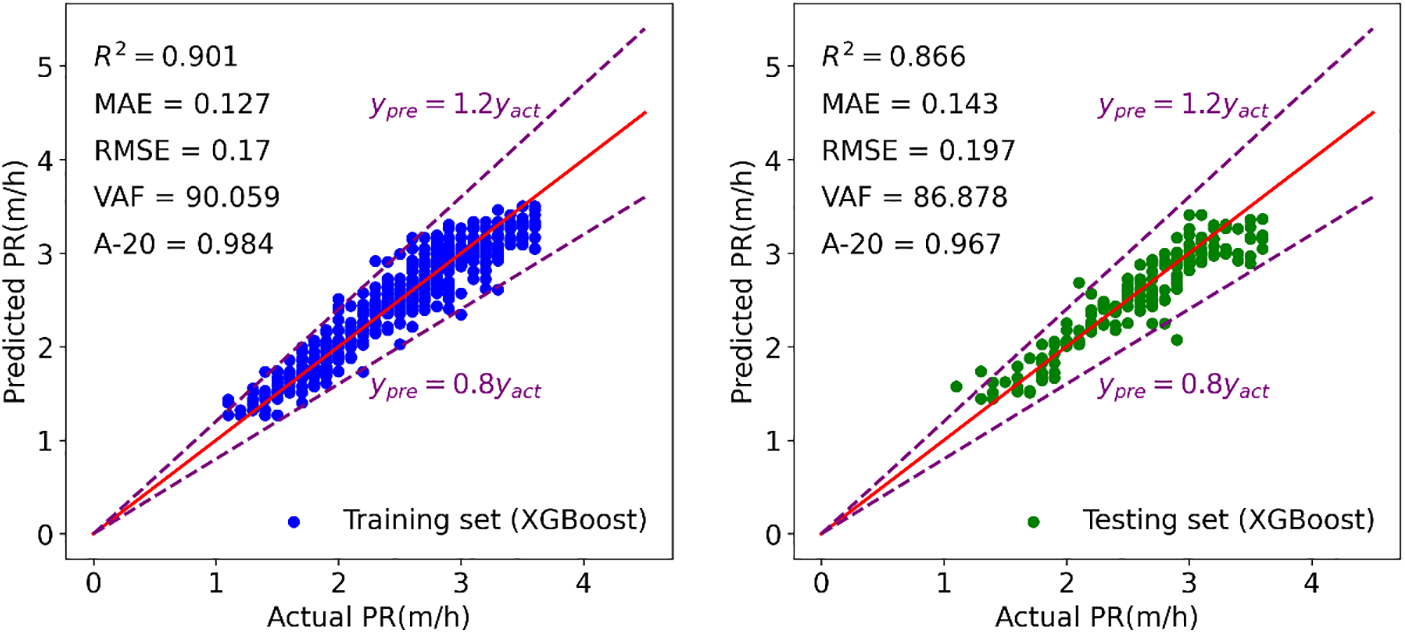
Figure 19: Modeling results of XGBoost to forecast TBM PR
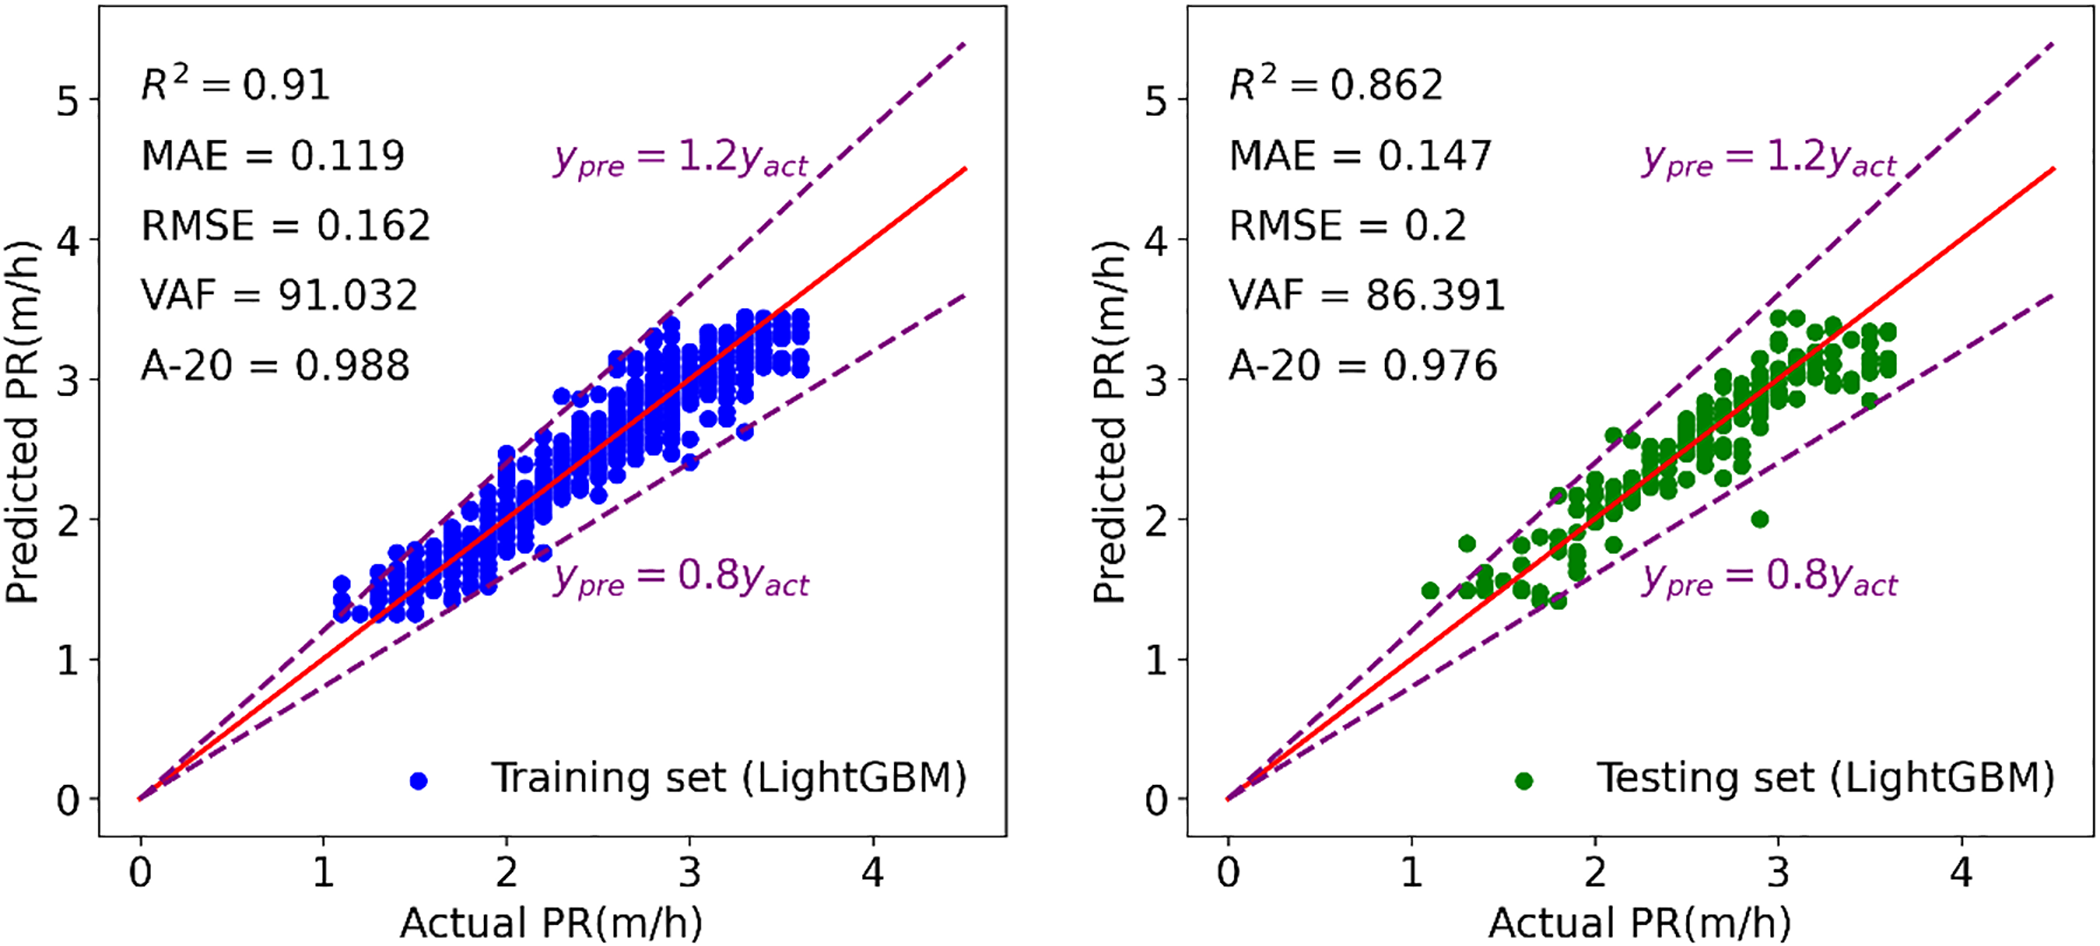
Figure 20: Modeling results of LightGBM to forecast TBM PR
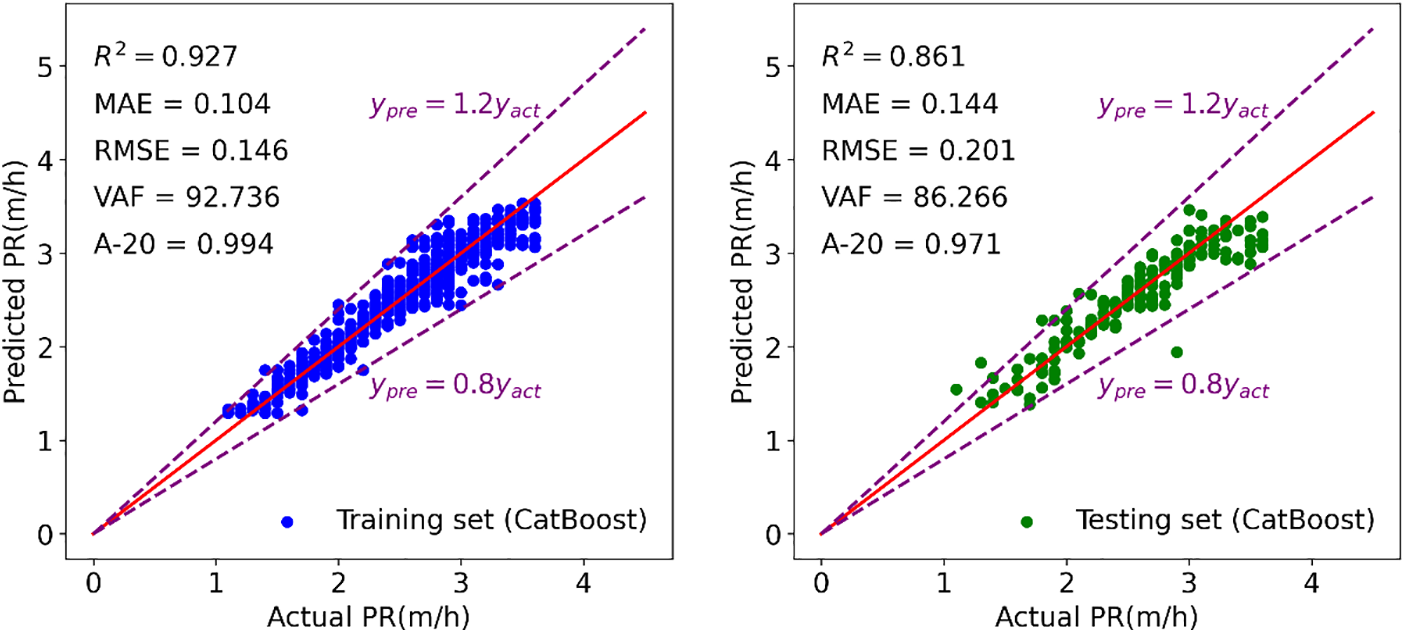
Figure 21: Modeling results of CatBoost to forecast TBM PR
In the discussion of the evaluation indicators, it was observed that the AdaBoost model exhibited inferior performance in both the training and testing sets compared to other tree-based models. To facilitate a more comprehensive comparison of these models, a Taylor diagram was employed in this study. The correlation coefficient, centered RMSE, and standard deviation exhibit a cosine relationship, as demonstrated in Eq. (11). This relationship was leveraged to construct the Taylor diagram, which integrates these elements into a polar chart, providing a visual representation of the model performance.
In Eq. (10),
Fig. 22 illustrates the Taylor diagrams showcasing the training and testing outcomes. In these diagrams, the distance from the model’s representation to the origin point signifies the standard deviation, while the clockwise ticks represent the correlation coefficient. The point ‘REF’ with a star shape on the x-axis represents the actual PR and the distance from the other points to the point ‘REF’ represents the centered RMSE. The position of points on the graph can be utilized to evaluate the potential of the corresponding model, with points closer to the ‘REF’ point indicating preferable capabilities. According to this principle, the ERT model exhibited optimal performance in the training set, while the GBM model outperformed others in the testing set. All seven tree-based models displayed points within the range of the black dotted line in both training and testing results, indicating that the standard deviation of their predicted PR values was smaller than the actual PR. It was observed that all models except AdaBoost demonstrated similar prediction capabilities in the training set.
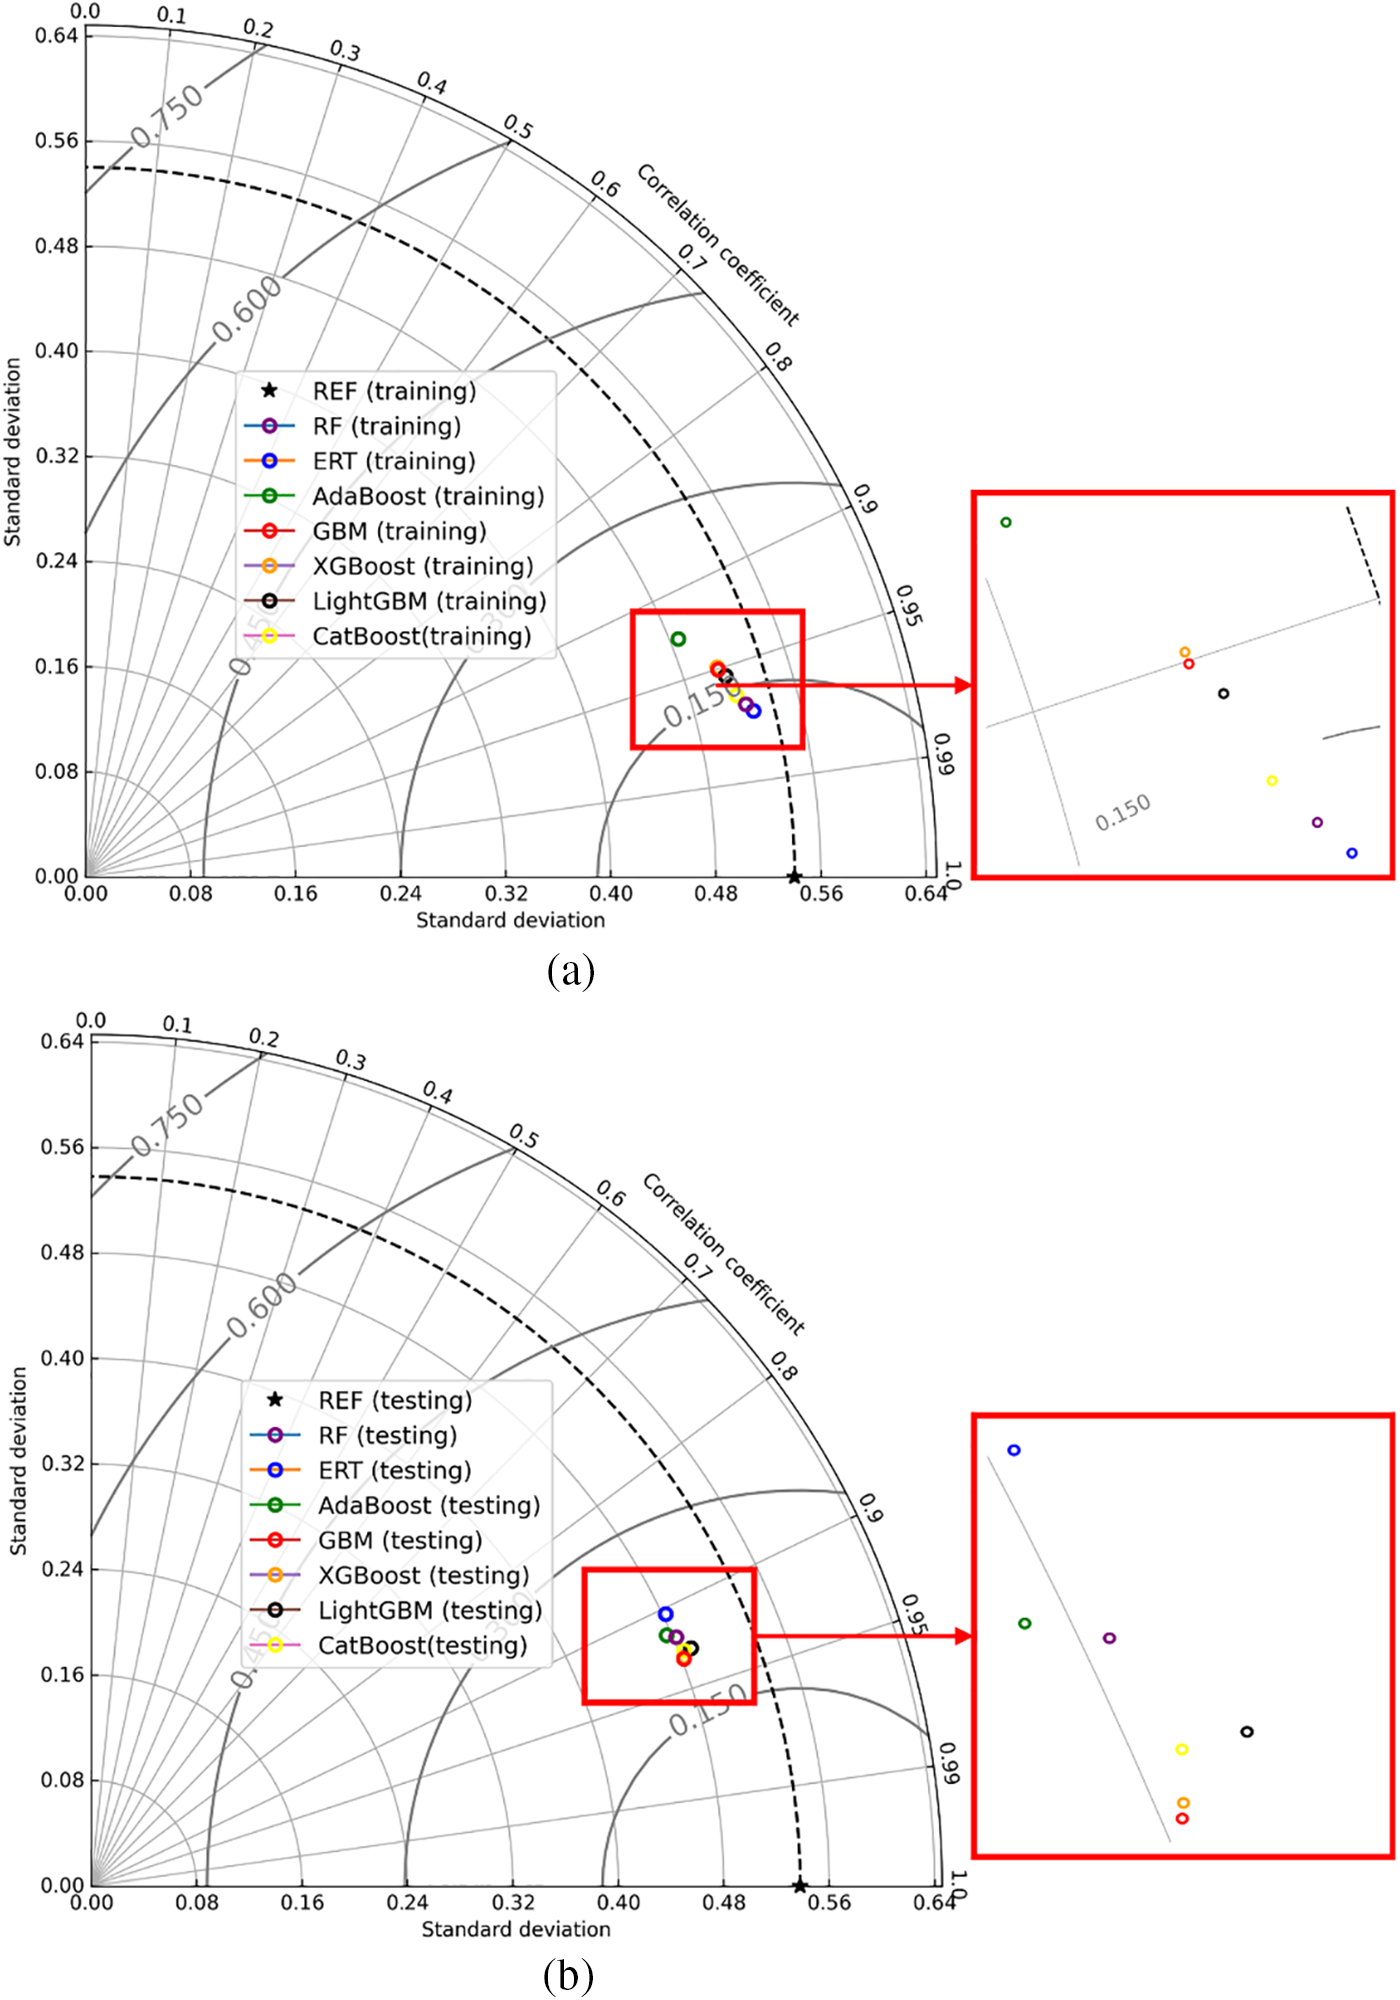
Figure 22: The results of all tree-based techniques based on Taylor diagram (a) training (b) testing
To provide a more comprehensive assessment of the tree-based models, a ranking system proposed by Zorlu et al. [62] was utilized. This ranking system combines the performance in the training and testing sets to reflect the comprehensive capacity of the model. Table 3 presents the ranking results for the seven tree-based models based on their performance in predicting PR. Each model was scored according to its performance in the training and testing datasets, with higher scores indicating superior capability. The final score, which is the sum of the total scores of the model for training and testing datasets, was used to rank the models (Fig. 23). The model ranking based on the final score was as follows: CatBoost = GBM > LightGBM = RF > ERT > XGBoost > AdaBoost. It is evident from the rankings that CatBoost and GBM emerged as the best-performing models among the seven. These tree-based models demonstrated satisfactory predictive capacity for estimating TBM PR. In the following section, we will explore their performance when applied to predict TBM PR with a new dataset.

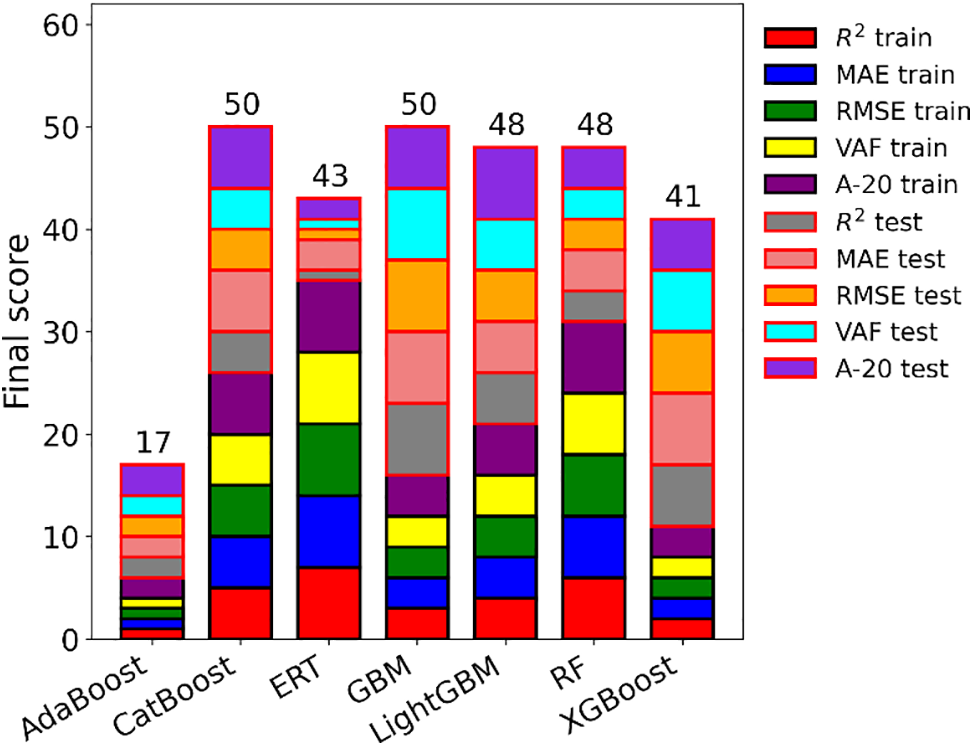
Figure 23: The obtained scores of ranking technique for all tree-based models
7 Practical Application of the Proposed Models
In the previous sections, all analyses and calculations were based on a database with 1043 data samples, which were split into training and testing portions. These data samples were based on two WZs: fresh and slightly weathered. However, it’s important to note that the properties of input and output parameters are very similar for these two WZs, making it difficult to discern any obvious differences between them. Given this, the aim of this section is to validate the developed tree-based models using another set of data related to a moderately weathered WZ. This new dataset, consisting of 149 data samples, allows us to assess the models’ performance under different conditions. Notably, the moderately weathered WZ exhibits distinct ranges of input parameters compared to the fresh and slightly weathered WZs. For instance, the average values of RMR and BTS for the moderately weathered WZ are 60.67 and 7.6 MPa, respectively, which differ from those of the fresh and slightly weathered WZs. After inputting the new data into the tree-based models, predicted PR values were obtained and compared with their measured values. Table 4 summarizes the results of the performance indices and ranks for the developed models during the validation phase. This provides insights into how well the models generalize to new data from different weathering zones. The findings strongly indicate that the constructed tree-based models are sufficiently effective in predicting TBM PR when confronted with new data. This reveals the applicability of these models in real conditions when being used in TBM construction. A range of (0.640–0.713) was obtained for R2 of these models during the validation phase, which confirms the right model development process for them. Throughout the training and testing stages, both the CatBoost and GBM models outperformed the other seven techniques. However, during the validation phase, the XGBoost model emerged as the top performer with an overall ranking of 35, surpassing all others in terms of prediction accuracy. It’s worth noting that the performance observed in the validation phase was slightly lower than that in the training and testing phases. Regarding the R2 values, CatBoost achieved 0.927 and 0.861 for the training and testing phases, respectively, while the best-performing tree-based model, XGBoost, achieved an R2 value of 0.713 during the validation phase, which is still considered acceptable for validation purposes. A possible reason for this difference can be attributed to the fact that some of the inputs and conditions in the validation phase are outside the ranges of inputs and conditions in the training phase. As a result, the number of performance indices used in the validation phase is still acceptable and can be used in future similar projects.

To elucidate the tree-based models, we employed the permutation importance algorithm to assess the relative significance of input parameters. This method measures the impact of an input parameter by removing the parameter on a score, such as R2. The detailed steps to perform the permutation importance algorithm could be referred to Debeer et al. [63]. Fig. 24 displays the importance scores of input parameters across the seven models. It becomes evident that RMR holds the highest importance among all tree-based models, closely followed by BTS. Conversely, WZ contributes the least to the prediction of TBM performance in all the tree-based models. To delve further into the relationship between PR and the parameters of interest, we utilized the partial dependence plot (PDP), which demonstrates the interdependence between target variables and a specific set of input parameters. The PDP exhibits the dependency between the target variables and a set of input parameters of interest. Fig. 25 shows the interaction between the PR and RMR. The PDP reflects the influence of RMR variation on the predicted PR when BTS and WZ remain unchanged. The markers at the bottom of the figure represent the deciles of the distribution of predicted PR, which can reveal the degree of predicted PR concentration. For example, the RMR, whose value ranges from 44 to 73, determines the top 70% of the predicted PR values. When the values of BTS and WZ are held constant, the PR value increases first as RMR increases. When RMR reaches 46, the predicted PR in models is at its maximum. Then the predicted PR starts to decrease. When the RMR varies between 73 and 95, the predicted PR in models changes little. According to Fig. 26, when RMR and WZ remain unchanged, the predicted PR in models increases when BTS increases from 4.69 to 5.94 MPa, and the maximum predicted PR is obtained when BTS equals 5.94 MPa. After that, the predicted PR decreased with the increase in BTS. When the BTS ranges from 10.0 to 15.5 MPa, and the predicted PR decreases rapidly. In Figs. 25 and 26, the curve describing the dependence of the predicted PR value on RMR is steeper than the BTS curve, which suggests the predicted PR in seven tree-based models has more dependence on RMR. The 3D partial dependency of RMR and BTS with respect to the PR is shown in Fig. 27, which can reflect the dependence of PR on one input variable when another changes. It is evident that the predicted PR in all models decreases with the simultaneous increase of RMR and BTS when the WZ does not vary. However, it is also clear that if WZ is changed, for example, from fresh to slightly weathered, some of the properties in the rock mass are accordingly changed.

Figure 24: The importance score of three input parameters in seven tree-based models
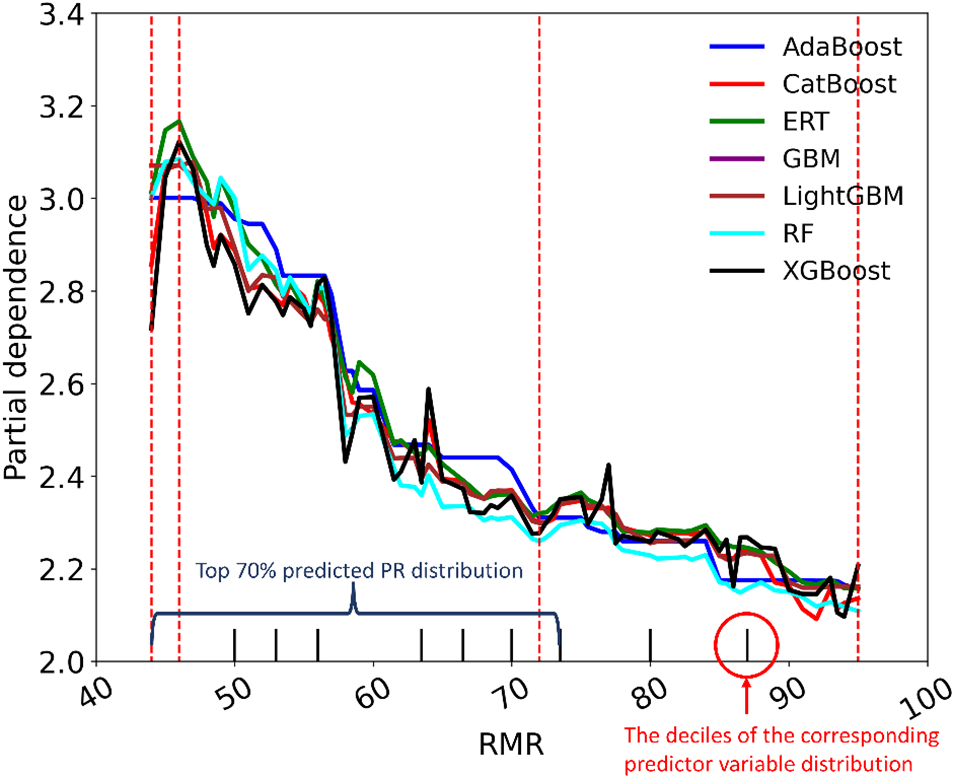
Figure 25: The partial dependency between RMR and PR
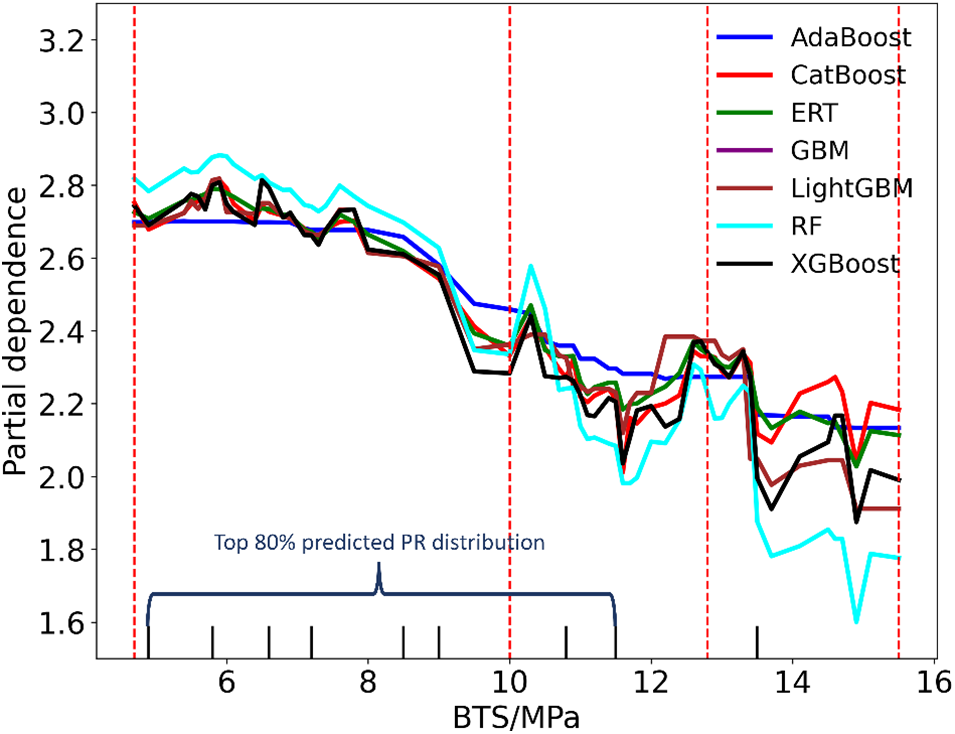
Figure 26: The partial dependency between BTS and PR

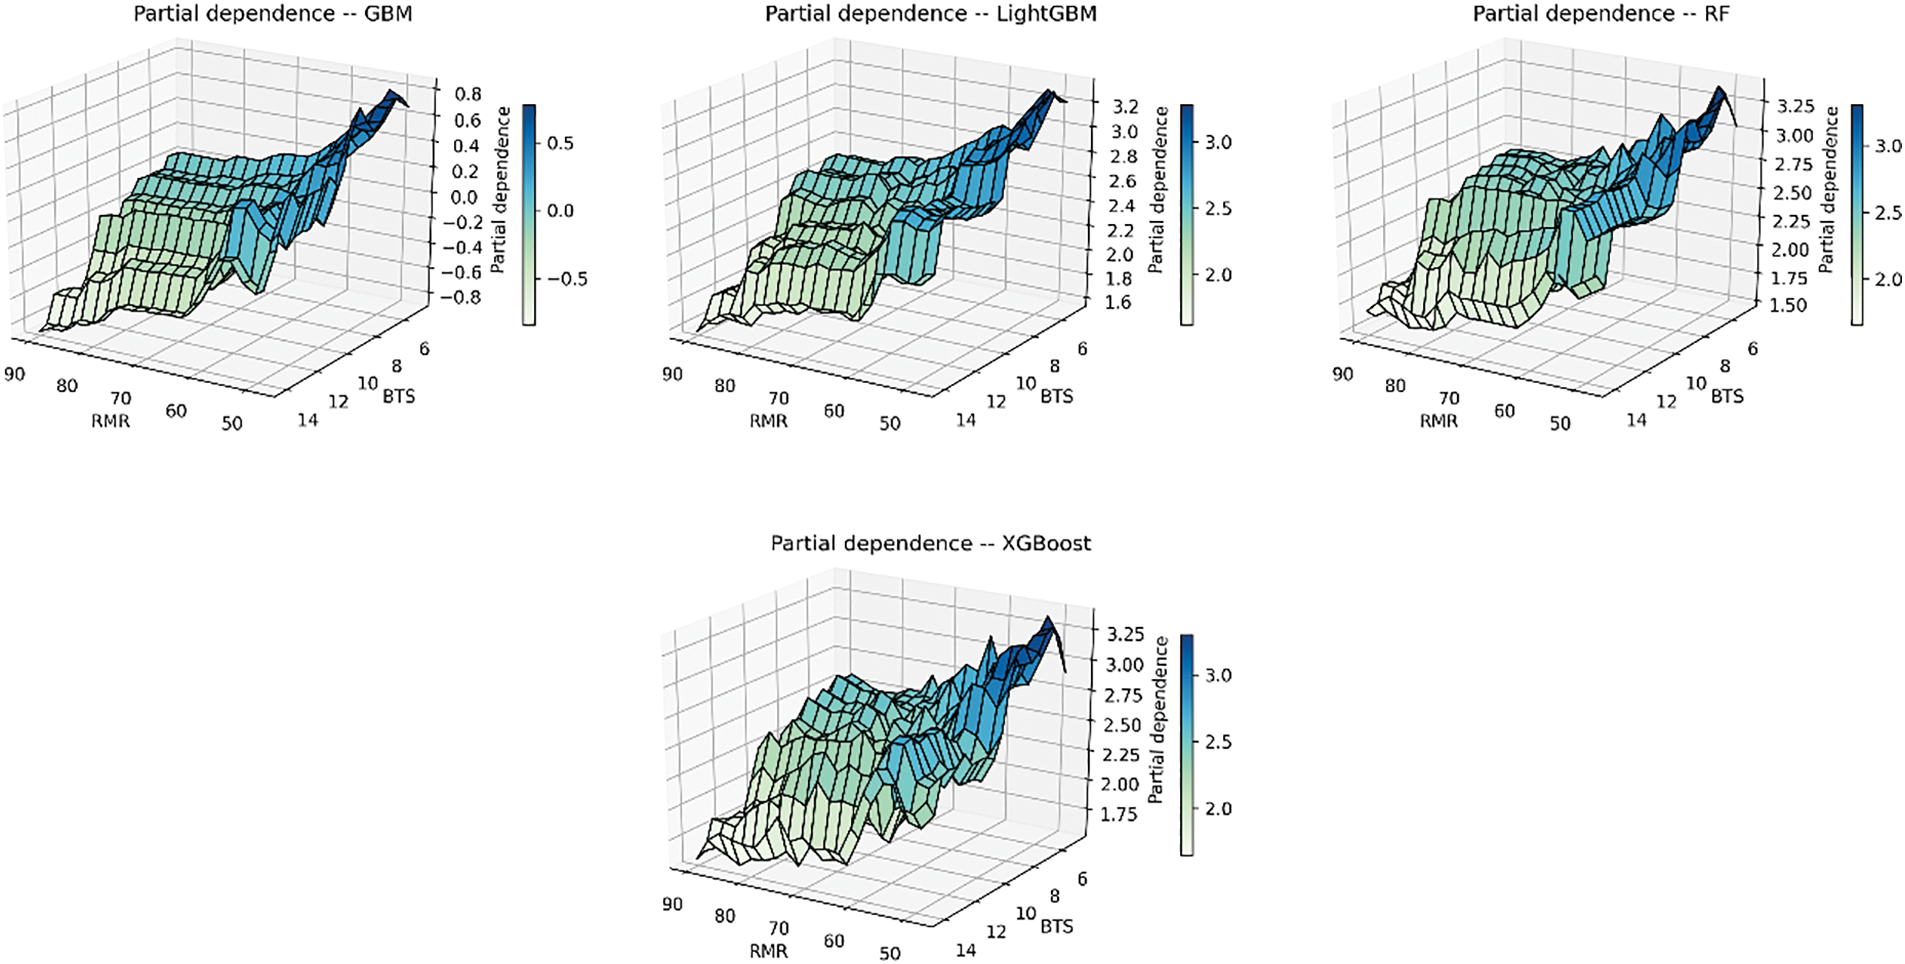
Figure 27: The 3D partial dependency of RMR and BTS with the PR
The predicted PR in AdaBoost did not decrease gradually with the decrease in BTS and RMR. There are some relatively flat areas in “Partial dependence–AdaBoost” where the predicted PR did not change with the value of RMR and BTS, which is consistent with the distribution of the predicted and actual PR in Fig. 17. Some steep regions in “Partial dependence–AdaBoost” imply that the predicted PR varies greatly with RMR and BTS in these areas. In contrast to other models, AdaBoost does not correctly construct the relationship between PR and input variables, which leads to its poor TBM estimation potential.
9 Limitations and Future Works
Indeed, the integration of theory-guided machine learning (TGML) methodologies holds great promise for enhancing the practical applicability of machine learning models in the field of tunneling and underground space technologies. By combining established theories and empirical equations from the field of tunneling with machine learning techniques, TGML offers a pathway to develop intelligent models that are not only accurate but also consistent with existing scientific knowledge. One of the key advantages of TGML is its ability to leverage vast volumes of scientific data while ensuring scientific consistency throughout the model development process. By incorporating domain-specific knowledge into the model-building process, TGML can address the limitations associated with traditional machine learning approaches, which often require extensive expertise in data science and machine learning methodologies. Furthermore, the hybrid approach proposed by TGML enables tunnel engineers and geotechnical designers to utilize the resulting models as practical tools in real-world projects. These models can provide valuable insights and predictions, helping to inform decision-making processes and optimize the design and construction of tunnels and underground structures. Overall, future research efforts in the field of tunneling and underground space technologies should consider adopting TGML methodologies to develop robust and practical machine-learning models. By combining scientific theories and empirical knowledge with advanced machine learning techniques, TGML has the potential to revolutionize the way tunneling projects are planned, designed, and executed.
Although this study successfully proposed high-performing tree-based models for the prediction of PR, there are some limitations worth noting. One significant issue is the absence of parameter tuning in this research. Instead of optimizing the hyperparameters for each model, all the tree-based models relied on their respective default parameter settings. This reliance on default parameters may lead to suboptimal performance and prevent the models from achieving their full predictive potential. Consequently, the generalizability and robustness of these models could be limited in diverse geological conditions or with varied datasets. For instance, hyperparameter tuning could significantly improve the performance of models like CatBoost or XGBoost, which are known to be sensitive to adjustments. Future research should prioritize comprehensive parameter optimization strategies, such as grid search or Bayesian optimization, to identify the best combinations that enhance predictive accuracy.
The following remarks describe the most important conclusion and limitation points extracted from this study:
• The study utilized rock mass and material properties such as RMR, BTS, and WZ to develop tree-based models for forecasting TBM performance. Two empirical formulas were proposed using RMR and BTS to predict the PR values of fresh and slightly weathered granite in TBM construction. The performance of these models, indicated by the R2, was found to be 0.752 for RMR and 0.652 for BTS. These R2 values fall within an acceptable range for empirical equations, demonstrating the effectiveness of using RMR and BTS as predictors for TBM performance forecasting in the context of fresh and slightly weathered granite.
• The tree-based models showcased commendable predictive capabilities in estimating TBM performance using rock mass and material properties. Particularly, CatBoost emerged as the most proficient among the seven tree-based techniques. It achieved remarkable R2 values of 0.927 and 0.861 for the training and testing datasets, respectively, focusing on fresh and slightly weathered granite. Additionally, CatBoost secured a ranking value of 50, signifying its superior performance compared to the other tree-based models.
• A new dataset representing a moderate WZ was introduced, with parameters falling outside the ranges of the original inputs. This dataset was employed to validate the developed tree-based models. Overall, the results affirmed the effectiveness of these techniques for handling new data. However, the top-performing model during the validation phase was XGBoost, achieving a total rank of 35. XGBoost exhibited the highest performance capacity (R2 = 0.713, MAE = 0.211, RMSE = 0.268, VAF = 71.467% and A-20 index = 0.953) in predicting TBM performance.
• The PDP analysis revealed that, among the seven tree-based models, RMR and BTS were the most influential factors in predicting TBM performance. When the other variables were held constant, the predicted PR in all tree-based models exhibited a trend of initially increasing and then decreasing with changes in RMR or BTS. This nonlinear relationship highlights the ability of tree-based models to capture and model complex interactions among input variables, which may not be adequately captured by simple regression analysis.
• The results obtained from both the model development and validation phases confirm the effectiveness of the developed tree-based models in providing accurate predictions of TBM PR. These models exhibit an acceptable level of accuracy and can be considered reliable tools for forecasting TBM performance in similar geological and geotechnical conditions. However, it’s important to note that the accuracy of the predictions may vary if different input parameters or conditions are used. Therefore, to achieve similar performance predictions, it’s essential to ensure consistency in the input parameters and geological/geotechnical properties used in the models.
Acknowledgement: The authors would like to express their heartfelt appreciation to the Pahang–Selangor Raw Water Transfer Project Team. Additionally, the authors like to express their gratitude to Universiti Teknologi Malaysia for enabling this work.
Funding Statement: The authors received no specific funding for this study.
Author Contributions: Study conception and design: Danial Jahed Armaghani, Zida Liu, Mohammad Afrazi; data collection: Danial Jahed Armaghani; analysis and interpretation of results: Danial Jahed Armaghani, Zida Liu, Diyuan Li; supervision: Hadi Khabbaz, Diyuan Li, Hadi Fattahi, draft manuscript preparation: Danial Jahed Armaghani, Zida Liu, Diyuan Li, Hadi Khabbaz, Hadi Fattahi, Mohammad Afrazi. All authors reviewed the results and approved the final version of the manuscript.
Availability of Data and Materials: The data is available upon request.
Ethics Approval: Not applicable.
Conflicts of Interest: The authors declare that they have no conflicts of interest to report regarding the present study.
References
1. Gong Q, Yin L, Ma H, Zhao J. TBM tunnelling under adverse geological conditions: an overview. Tunnel Undergr Space Technol. 2016;57:4–17. doi:10.1016/j.tust.2016.04.002. [Google Scholar] [CrossRef]
2. He M, Ding M, Yuan Z, Zhao J, Luo B, Ma X. Numerical simulation of rock bursts triggered by blasting disturbance for deep-buried tunnels in jointed rock masses. Comput Geotech. 2023;161:105609. doi:10.1016/j.compgeo.2023.105609. [Google Scholar] [CrossRef]
3. Delisio A, Zhao J, Einstein HH. Analysis and prediction of TBM performance in blocky rock conditions at the Lötschberg Base Tunnel. Tunn Undergr Sp Technol. 2013;33:131–42. doi:10.1016/j.tust.2012.06.015. [Google Scholar] [CrossRef]
4. Shan F, He X, Armaghani DJ, Zhang P, Sheng D. Success and challenges in predicting TBM penetration rate using recurrent neural networks. Tunn Undergr Sp Technol. 2022;130:104728. doi:10.1016/j.tust.2022.104728. [Google Scholar] [CrossRef]
5. Guo D, Li J, Jiang S-H, Li X, Chen Z. Intelligent assistant driving method for tunnel boring machine based on big data. Acta Geotechnica. 2022;17(4):1019–30. doi:10.1007/s11440-021-01327-1. [Google Scholar] [CrossRef]
6. Feng S, Chen Z, Luo H, Wang S, Zhao Y, Liu L, et al. Tunnel boring machines (TBM) performance prediction: a case study using big data and deep learning. Tunn Undergr Sp Technol. 2021;110:103636. doi:10.1016/j.tust.2020.103636. [Google Scholar] [CrossRef]
7. Graham PC. Rock exploration for machine manufacturers. In: Proceedings of Symposium on Exploration for Rock Engineering, 1976; p. 173–80. [Google Scholar]
8. Farmer IW, Glossop NH. Mechanics of disc cutter penetration. Tunnels Tunnell Int. 1980;12(6):22–5. [Google Scholar]
9. Hughes HM. The relative cuttability of coal-measures stone. Min Sci Technol. 1986;3(2):95–109. [Google Scholar]
10. Rostami J. Development of a force estimation model for rock fragmentation with disc cutters through theoretical modeling and physical measurement of crushed zone pressure. CO, USA: Colorado School of Mines Golden; 1997. [Google Scholar]
11. Bruland A. Hard rock tunnel boring advance rate and cutter wear. Trondheim: Norwegian Institute of Technology; 1999. [Google Scholar]
12. Salimi A, Rostami J, Moormann C, Delisio A. Application of non-linear regression analysis and artificial intelligence algorithms for performance prediction of hard rock TBMs. Tunn Undergr Sp Technol. 2016;58:236–46. [Google Scholar]
13. Armaghani DJ, Yagiz S, Mohamad ET, Zhou J. Prediction of TBM performance in fresh through weathered granite using empirical and statistical approaches. Tunn Undergr Sp Technol. 2021;118(2021):104183. doi:10.1016/j.tust.2021.104183. [Google Scholar] [CrossRef]
14. Goodarzi S, Hassanpour J, Yagiz S, Rostami J. Predicting TBM performance in soft sedimentary rocks, case study of Zagros mountains water tunnel projects. Tunn Undergr Sp Technol. 2021;109:103705. doi:10.1016/j.tust.2020.103705. [Google Scholar] [CrossRef]
15. Xu C, Liu X, Wang E, Wang S. Prediction of tunnel boring machine operating parameters using various machine learning algorithms. Tunn Undergr Sp Technol. 2021;109:103699. doi:10.1016/j.tust.2020.103699. [Google Scholar] [CrossRef]
16. Shahrour I, Zhang W. Use of soft computing techniques for tunneling optimization of tunnel boring machines. Undergr Sp. 2021;6(3):233–9. doi:10.1016/j.undsp.2019.12.001. [Google Scholar] [CrossRef]
17. Skentou AD, Bardhan A, Mamou A, Lemonis ME, Kumar G, Samui P, et al. Closed-form equation for estimating unconfined compressive strength of granite from three non-destructive tests using soft computing models. Rock Mech Rock Eng. 2023;56(1):487–514. doi:10.1007/s00603-022-03046-9. [Google Scholar] [CrossRef]
18. Koopialipoor M, Asteris PG, Mohammed AS, Alexakis DE, Mamou A, Armaghani DJ. Introducing stacking machine learning approaches for the prediction of rock deformation. Transp Geotech. 2022;34:100756. doi:10.1016/j.trgeo.2022.100756. [Google Scholar] [CrossRef]
19. Liu Z, Armaghani DJ, Fakharian P, Li D, Ulrikh DV, Orekhova NN, et al. Rock strength estimation using several tree-based ML techniques. Comput Model Eng Sci. 2022;133(3):799–824. doi:10.32604/cmes.2022.021165. [Google Scholar] [CrossRef]
20. Li C, Zhou J, Armaghani DJ, Cao W, Yagiz S. Stochastic assessment of hard rock pillar stability based on the geological strength index system. Geomech Geophys Geo-Energy Geo-Resour. 2021 May;7:1–24. doi:10.1007/s40948-020-00190-w. [Google Scholar] [CrossRef]
21. Yang H, Song K, Zhou J. Automated recognition model of geomechanical information based on operational data of tunneling boring machines. Rock Mech Rock Eng. 2022;55:1–18. doi:10.1007/s00603-021-02723-5. [Google Scholar] [CrossRef]
22. Li J, Li P, Guo D, Li X, Chen Z. Advanced prediction of tunnel boring machine performance based on big data. Geosci Front. 2021;12(1):331–8. doi:10.1016/j.gsf.2020.02.011. [Google Scholar] [CrossRef]
23. Wu Z, Wei R, Chu Z, Liu Q. Real-time rock mass condition prediction with TBM tunneling big data using a novel rock-machine mutual feedback perception method. J Rock Mech Geotech Eng. 2021;13(6):1311–25. doi:10.1016/j.jrmge.2021.07.012. [Google Scholar] [CrossRef]
24. Yang H, Wang Z, Song K. A new hybrid grey wolf optimizer-feature weighted-multiple kernel-support vector regression technique to predict TBM performance. Eng Comput. 2022;38:1–17. doi:10.1007/s00366-020-01217-2. [Google Scholar] [CrossRef]
25. Armaghani DJ, Mohamad ET, Narayanasamy MS. Development of hybrid intelligent models for predicting TBM penetration rate in hard rock condition. Tunn Undergr Sp Technol. 2017;63:29–43. doi:10.1016/j.tust.2016.12.009. [Google Scholar] [CrossRef]
26. Zhou J, Qiu Y, Zhu S, Armaghani DJ, Li C, Nguyen H, et al. Optimization of support vector machine through the use of metaheuristic algorithms in forecasting TBM advance rate. Eng Appl Artif Intell. 2021;97:104015. doi:10.1016/j.engappai.2020.104015. [Google Scholar] [CrossRef]
27. Li Z, Yazdani Bejarbaneh B, Asteris PG, Koopialipoor M, Armaghani DJ, Tahir MM. A hybrid GEP and WOA approach to estimate the optimal penetration rate of TBM in granitic rock mass. Soft Comput. 2021;25:11877–95. doi:10.1007/s00500-021-06005-8. [Google Scholar] [CrossRef]
28. Harandizadeh H, Armaghani DJ, Asteris PG, Gandomi AH. TBM performance prediction developing a hybrid ANFIS-PNN predictive model optimized by imperialism competitive algorithm. Neural Comput Appl. 2021;33(23):16149–79. doi:10.1007/s00521-021-06217-x. [Google Scholar] [CrossRef]
29. Ghahramani Z. Probabilistic machine learning and artificial intelligence. Nature. 2015;521(7553):452–9 [Google Scholar] [PubMed]
30. Zhang Q, Hu W, Liu Z, Tan J. TBM performance prediction with Bayesian optimization and automated machine learning. Tunn Undergr Sp Technol. 2020;103:103493. [Google Scholar]
31. Zhou Z-H. Ensemble methods: Foundations and algorithms. Boca Raton: CRC Press; 2012. [Google Scholar]
32. Zhou J, Qiu Y, Armaghani DJ, Zhang W, Li C, Zhu S, et al. Predicting TBM penetration rate in hard rock condition: a comparative study among six XGB-based metaheuristic techniques. Geosci Front. 2021;12(3):101091. [Google Scholar]
33. Guo D, Chen H, Tang L, Chen Z, Samui P. Assessment of rockburst risk using multivariate adaptive regression splines and deep forest model. Acta Geotechnica. 2022;17:1183–205. doi:10.1007/s11440-021-01299-2. [Google Scholar] [CrossRef]
34. Kardani N, Bardhan A, Gupta S, Samui P, Nazem M, Zhang Y, et al. Predicting permeability of tight carbonates using a hybrid machine learning approach of modified equilibrium optimizer and extreme learning machine. Acta Geotechnica. 2022;17:1239–55. doi:10.1007/s11440-021-01257-y. [Google Scholar] [CrossRef]
35. Bai X-D, Cheng W-C, Li G. A comparative study of different machine learning algorithms in predicting EPB shield behaviour: a case study at the Xi’an metro, China. Acta Geotechnica. 2021;16(12):4061–80. doi:10.1007/s11440-021-01383-7. [Google Scholar] [CrossRef]
36. Mahdevari S, Shahriar K, Yagiz S, Shirazi MA. A support vector regression model for predicting tunnel boring machine penetration rates. Int J Rock Mech Min Sci. 2014;72:214–29. doi:10.1016/j.ijrmms.2014.09.012. [Google Scholar] [CrossRef]
37. Eftekhari M, Baghbanan A, Bayati M. Predicting penetration rate of a tunnel boring machine using artificial neural network. New Delhi, India: ISRM; 2010. [Google Scholar]
38. Grima MA, Bruines PA, Verhoef PNW. Modeling tunnel boring machine performance by neuro-fuzzy methods. Tunnell Underground Space Technol. 2000;15(3):259–69. doi:10.1016/S0886-7798(00)00055-9. [Google Scholar] [CrossRef]
39. Breiman L. Random forests. Mach Learn. 2001;45:5–32. doi:10.1023/A:1010933404324. [Google Scholar] [CrossRef]
40. Zhang W, Wu C, Zhong H, Li Y, Wang L. Prediction of undrained shear strength using extreme gradient boosting and random forest based on Bayesian optimization. Geosci Front. 2021;12(1):469–77. doi:10.1016/j.gsf.2020.03.007. [Google Scholar] [CrossRef]
41. Zhou J, Li E, Wei H, Li C, Qiao Q, Armaghani DJ. Random forests and cubist algorithms for predicting shear strengths of rockfill materials. Appl Sci. 2019;9(8):1621. doi:10.3390/app9081621. [Google Scholar] [CrossRef]
42. Biau G, Scornet E. A random forest guided tour. Test. 2016;25:197–227. doi:10.1007/s11749-016-0481-7. [Google Scholar] [CrossRef]
43. Xie Y, Zhu C, Hu R, Zhu Z. A coarse-to-fine approach for intelligent logging lithology identification with extremely randomized trees. Math Geosci. 2021;53(5):859–76. doi:10.1007/s11004-020-09885-y. [Google Scholar] [CrossRef]
44. Freund Y, Schapire RE. A decision-theoretic generalization of on-line learning and an application to boosting. J Comput Syst Sci. 1997;55(1):119–39. doi:10.1006/jcss.1997.1504. [Google Scholar] [CrossRef]
45. Zhou L, Lai KK. AdaBoost models for corporate bankruptcy prediction with missing data. Comput Econ. 2017;50:69–94. doi:10.1007/s10614-016-9581-4. [Google Scholar] [CrossRef]
46. Natekin A, Knoll A. Gradient boosting machines, a tutorial. Front Neurorobot. 2013;7(21):1–21. [Google Scholar]
47. Schapire RE. A brief introduction to boosting. In: Proceedings of the Sixteenth International Joint Conference on Artificial Intelligence, 1999 Jul 31–Aug 6; Stockholm, Sweden; vol. 2, p. 1401–6. [Google Scholar]
48. Ke G, Meng Q, Finley T, Wang T, Chen W, Ma W, et al. LightGBM: a highly efficient gradient boosting decision tree (NIPS 2017). In: Advances in neural information processing systems, 2017; vol. 30, 3149–57. [Google Scholar]
49. Zhang W, Wu C, Tang L, Gu X, Wang L. Efficient time-variant reliability analysis of Bazimen landslide in the three gorges reservoir area using XGBoost and LightGBM algorithms. Gondwana Res. 2023;123:41–53. [Google Scholar]
50. Chen T, Guestrin C. Xgboost: A scalable tree boosting system; In: Proceedings of the 22nd ACM SIGKDD International Conference on Knowledge Discovery and Data Mining, 2016 Aug 13–17; San Francisco, CA, USA; p. 785–94. [Google Scholar]
51. Dorogush AV, Ershov V, Gulin A. CatBoost: gradient boosting with categorical features support. arXiv preprint arXiv:181011363. 2018. [Google Scholar]
52. Ibrahim B, Ahenkorah I, Ewusi A. Explainable risk assessment of rockbolts’ failure in underground coal mines based on categorical gradient boosting and Shapley additive explanations (SHAP). Sustainability. 2022;14(19):11843. [Google Scholar]
53. Benardos AG, Kaliampakos DC. Modelling TBM performance with artificial neural networks. Tunnel Underground Space Technol. 2004;19(6):597–605. [Google Scholar]
54. Iyare UC, Blake OO, Ramsook R. Estimating the uniaxial compressive strength of argillites using Brazilian tensile strength, ultrasonic wave velocities, and elastic properties. Rock Mech Rock Eng. 2021;54(4):2067–78. doi:10.1007/s00603-020-02358-y. [Google Scholar] [CrossRef]
55. Simoes MG, Kim T. Fuzzy modeling approaches for the prediction of machine utilization in hard rock tunnel boring machines. In: Conference Record of the 2006 IEEE Industry Applications Conference Forty-First IAS Annual Meeting, 2006 Oct 8–12; Tampa, FL, USA; vol. 2, p. 947–54. [Google Scholar]
56. Yagiz S, Gokceoglu C, Sezer E, Iplikci S. Application of two non-linear prediction tools to the estimation of tunnel boring machine performance. Eng Appl Artif Intell. 2009;22(4–5):808–14. doi:10.1016/j.engappai.2009.03.007. [Google Scholar] [CrossRef]
57. Yagiz S, Karahan H. Application of various optimization techniques and comparison of their performances for predicting TBM penetration rate in rock mass. Int J Rock Mech Min Sci. 2015;80:308–15. doi:10.1016/j.ijrmms.2015.09.019. [Google Scholar] [CrossRef]
58. Salimi A, Esmaeili M. Utilising of linear and non-linear prediction tools for evaluation of penetration rate of tunnel boring machine in hard rock condition. Int J Min Miner Eng. 2013;4(3):249–64. doi:10.1504/IJMME.2013.053172. [Google Scholar] [CrossRef]
59. Javad G, Narges T. Application of artificial neural networks to the prediction of tunnel boring machine penetration rate. Min Sci Technol (China). 2010;20(5):727–33. doi:10.1016/S1674-5264(09)60271-4. [Google Scholar] [CrossRef]
60. Oraee K, Khorami MT, Hosseini N. Prediction of the penetration rate of TBM using adaptive neuro fuzzy inference system (ANFIS); In: Proceeding of SME Annual Meeting and Exhibit, 2012 Feb 19–22; Seattle, WA, USA; p. 297–302. [Google Scholar]
61. Bieniawski ZT. Classification of rock masses for engineering: the RMR system and future trends. Compr Rock Eng. 1993;3:553e73. doi:10.1016/b978-0-08-042066-0.50028-8. [Google Scholar] [CrossRef]
62. Zorlu K, Gokceoglu C, Ocakoglu F, Nefeslioglu HA, Acikalin SJ. Prediction of uniaxial compressive strength of sandstones using petrography-based models. Eng Geol. 2008;96(3–4):141–58. doi:10.1016/j.enggeo.2007.10.009. [Google Scholar] [CrossRef]
63. Debeer D, Strobl C. Conditional permutation importance revisited. BMC Bioinform. 2020;21(1):307. doi:10.1186/s12859-020-03622-2 [Google Scholar] [PubMed] [CrossRef]
Cite This Article
 Copyright © 2024 The Author(s). Published by Tech Science Press.
This work is licensed under a Creative Commons Attribution 4.0 International License , which permits unrestricted use, distribution, and reproduction in any medium, provided the original work is properly cited.


 Submit a Paper
 Propose a Special lssue
 View Full Text
 Download PDF
 Downloads
 Citation Tools