
 Submit a Paper
 Propose a Special lssue
 Open Access
ARTICLE
Self-Attention Spatio-Temporal Deep Collaborative Network for Robust FDIA Detection in Smart Grids
College of Computer Science and Technology, Shanghai University of Electric Power, Shanghai, 201306, China
* Corresponding Author: Fengyong Li. Email:
Computer Modeling in Engineering & Sciences 2024, 141(2), 1395-1417. https://doi.org/10.32604/cmes.2024.055442
Received 27 June 2024; Accepted 22 August 2024; Issue published 27 September 2024
 View Full Text
 Download PDF
Abstract
False data injection attack (FDIA) can affect the state estimation of the power grid by tampering with the measured value of the power grid data, and then destroying the stable operation of the smart grid. Existing work usually trains a detection model by fusing the data-driven features from diverse power data streams. Data-driven features, however, cannot effectively capture the differences between noisy data and attack samples. As a result, slight noise disturbances in the power grid may cause a large number of false detections for FDIA attacks. To address this problem, this paper designs a deep collaborative self-attention network to achieve robust FDIA detection, in which the spatio-temporal features of cascaded FDIA attacks are fully integrated. Firstly, a high-order Chebyshev polynomials-based graph convolution module is designed to effectively aggregate the spatio information between grid nodes, and the spatial self-attention mechanism is involved to dynamically assign attention weights to each node, which guides the network to pay more attention to the node information that is conducive to FDIA detection. Furthermore, the bi-directional Long Short-Term Memory (LSTM) network is introduced to conduct time series modeling and long-term dependence analysis for power grid data and utilizes the temporal self-attention mechanism to describe the time correlation of data and assign different weights to different time steps. Our designed deep collaborative network can effectively mine subtle perturbations from spatiotemporal feature information, efficiently distinguish power grid noise from FDIA attacks, and adapt to diverse attack intensities. Extensive experiments demonstrate that our method can obtain an efficient detection performance over actual load data from New York Independent System Operator (NYISO) in IEEE 14, IEEE 39, and IEEE 118 bus systems, and outperforms state-of-the-art FDIA detection schemes in terms of detection accuracy and robustness.Keywords
With the advancement of smart sensor and wireless communication technologies, traditional power systems are gradually transitioning to intelligent grid cyber-physical systems to enhance energy utilization efficiency and system stability [1,2]. The advantages of smart grids are becoming increasingly apparent, as the cyber-physical systems in smart grids offer end-to-end bi-directional power flow, which allows the users to feedback energy into the grid, thus improving system scalability, efficiency, and stability [3,4]. However, the openness and diversity of cyber-physical systems make the smart grid more susceptible to diverse malicious network attacks [5], especially at the boundary of interaction between the public Internet and the power system private network. For example, denial of service attack [6], man-in-the-middle attack [7], network topology attack [8], channel measurement attack [9] and false data injection attack [10].
False Data Injection Attacks (FDIAs) have garnered increasing attention due to their destructive and covert nature [11]. Generally, in the cyber-physical systems of smart grids, crucial operations such as emergency analysis, Volt-VAR optimization, real-time pricing, etc., are always conducted using power system state estimators. Sensor measurements are utilized as inputs to these estimators, which then generate corresponding outputs including a range of voltage magnitudes and phase angles. Control signals are dispatched by Supervisory Control and Data Acquisition (SCADA) systems based on the output of state estimation, which is crucial for the efficient operation of smart grids [12]. Although the cyber-physical system can mitigate the information interference of the public Internet by deploying Bad Data Detection (BDD) algorithms in the state estimator, FDIAs can circumvent these checks by injecting carefully crafted attack vectors, thereby tampering with measurement data from SCADA systems and impacting the accuracy of state estimation. This could lead to severe consequences for grid computation, scheduling operations, and the overall stability of the system [13]. Fig. 1 presents a complete schematic diagram of an FDIA attack on a cyber-physical system.

Figure 1: Typical scenarios of FDIA in Smart Grid
In general, FDIA attack detection techniques mainly contain traditional machine learning model-based methods and data-driven methods [14]. Model-based detection methods rely on system modeling to compare with expected behavior to detect attacks. For example, Wei et al. [15] proposed a method using Forecast-Aided State Estimation (FASE) and Square Root Unscented Kalman Filter (SR-UKF) for FDIA detection, which involved Generalized Likelihood Ratio Test (GLRT). Qu et al. [16] suggested an FDIA detection approach that utilizes the Hellinger distance to track measurement value changes and determine attack presence. Shen et al. [17] introduced a detection method based on random matrix theory, utilizing random variables from load short-term forecasts to construct random matrices for FDIA detection.
Data-driven detection methods usually leverage large amounts of historical data and employ statistical analysis or machine learning techniques to find unusual patterns to detect potential attack behavior. These methods require no prior knowledge and can adapt to various complex attack scenarios. For instance, James et al. [18] utilized discrete wavelet transform (DWT) and deep neural networks (DNN) to analyze system states continuously over time, effectively capturing FDIAs. Habibi et al. [19] proposed a neural network based on time series analysis and the Nonlinear Autoregressive Exogenous model (NARX) for detecting network attacks using estimated errors. Lu et al. [20] introduced a convolutional neural network called representation learning CNN (RL-CNN) to capture local data features, exhibiting superior performance in locating network attacks as a multi-label classifier. With the gradual increase of time series data in the smart grid, the detection effect of FDIAs can be improved more effectively by using the measurement of time series dependence in time series data. For example, Wang et al. [21] introduced a two-level learner-based scheme for detecting FDIAs, integrating linear and nonlinear time series data from the power grid and employing a combination of Kalman filter and Recurrent Neural Network (KFRNN). To effectively capture long-term dependencies in the data. Ayad et al. [22] proposed a deep learning (DL) method based on Long Short-Term Memory (LSTM) framework to detect FDIAs. However, the above methods focus on the time characteristics of the measured data, but ignore the topology of the grid, resulting in the loss of many key information in the learning process. Furthermore, the researchers try to explore spatial correlations in grid topology to further address the FDIA detection problem. Boyaci et al. [23] proposed an FDIA identification method based on Graph Neural Network (GNN) using the graph topology of the power system and the spatial correlation of the measurement data. In order to better extract the spatial characteristics of power grid topology information and operation data, Li et al. [24] designed a detection method of FDIAs based on Gated Graph Neural Network (GGNN) to improve the detection accuracy under the change of power grid topology. Su et al. [25] proposed a Dual-Attention Multi-head Graph Attention Network (DAMGAT) for FDIAs detection to improve the interpretability of graph neural network model and the representation ability of power topology nodes. Considering the spatio-temporal dependence of power grid data, Zhang et al. [26] analyzed temporal correlation and spatial correlation by volumetric Kalman filter and Gaussian process regression to capture the dynamic characteristics of the state vector to evaluate and localize FDIAs. Han et al. [27] designed a multi-graph mechanism and a time correlation layer to mine the correlation features of power data, and constructed a graph topology for the detection of FDIAs.
Overall, existing FDIAs detection methods can already utilize data and power grid topology to achieve efficient attack detection. However, they rarely consider the spatio-temporal dependencies of power grid data, which limits the detection performance of FDIAs. First, in terms of spatial correlation, most methods only consider the influence between nodes connected by the power grid topology, ignoring the potential impacts from other nodes, significantly weakening the understanding of the overall correlation of the power grid topology. Second, in terms of temporal correlation, current works often overlook the long-term correlation of sequences and the correlation of data features with different time steps. Third, most methods hardly consider the subtle perturbations in spatiotemporal feature information, making it difficult for existing methods to distinguish between power grid noise and FDIA attacks, resulting in lower robustness of detection models.
Facing the aforementioned problems, we are thus motivated to design an efficient deep collaborative self-attention network in the context of robust FDIAs detection, which makes the following novel contributions:
• We design a deep collaborative self-attention network to achieve effective robust FDIA detection. Our proposed collaborative network model can effectively capture subtle perturbations from spatiotemporal feature information, efficiently distinguish power grid noise from FDIA attacks, and adapt to diverse attack intensities.
• We design a graph convolution module based on Chebyshev polynomials, which utilizes the characteristics of the graph convolution network to aggregate the node information in the power grid and introduces the spatial self-attention mechanism to adjust the degree of attention to different nodes. The proposed module can better adapt to different grid structures and characteristics, thus improving the robustness of the model to potential changes and anomalies in grid data.
• Bi-directional LSTM network with a self-attention mechanism is introduced to conduct time series modeling and long-term dependence analysis on power grid data and utilizes the temporal self-attention module to describe the time correlation of data and assign different weights to different time steps.
• Comprehensive experiments are performed over three standard datasets and demonstrate that our method can outperform state-of-the-art FDIA detection schemes in terms of detection accuracy and robustness.
The rest of this paper is organized as follows. Section 2 reviews the preliminary state estimation of smart gird and false data injection attacks. In Section 3, we propose a robust FDIA detection scheme by designing an efficient deep collaborative self-attention network. Extensive experiments are performed to evaluate the overall performance of the proposed scheme, and the corresponding results and discussions are presented in Section 4. Finally, Section 5 concludes the paper.
2.1 State Estimation and Bad Data Detection
In general, the control center estimates the state through the measurement information in the monitoring and data acquisition system to ensure the safety and stability of the power grid [15]. State estimation primarily uses the redundancy of measurement data to estimate the operating state of the grid, including bus voltage, transmission line power flow, and bus power [24]. In energy management systems, state estimation can enable the functions of power flow calculation and load forecasting and the DC power model is usually used to ensure the convergence of the state estimation. The unit voltage of each node in the system is assumed to be 1, and the effect of line resistance and ground branch is ignored, the active power between bus
where
where
where
where
In order to grasp the real-time operation status of the smart power grid, the SCADA system uses intelligent terminals and other devices to collect measurement data [25]. Since these measurements are easily affected by traditional power system faults, such as equipment aging, communication failure, and noise interference, the SCADA system introduces the bad data detection (BDD) module to identify and eliminate such independent and accidental natural faults, where the constructed residual vector
In the process of FDIA bad data detection, the Euclidean norm of the residual
2.2 False Data Injection Attack
During FDIAs, false data vector
Meanwhile, since the bad data detection module may fail to detect FDIAs, the control center is likely to make wrong decision instructions according to the estimated state
3.1 Overview of Proposed Detection Scheme
Our designed deep collaborative network mainly consists of two network branches. One branch is a graph convolution network based on Chebyshev polynomials, which aggregates the node information in the power grid, and adaptively adjusts the degree of attention to different nodes by introducing the spatio self-attention mechanism. Another branch is the bi-directional LSTM network, which can conduct time series modeling and long-term dependence analysis for power grid data describe the time correlation of data, and assign different weights to different time steps by introducing the temporal self-attention mechanism. The overall detection process can be described as follows. The operational data of sensors is first collected through the SCADA system, including the bus injection active power

Figure 2: The overall architecture of proposed robust FDIA detection scheme
3.2 High-Order Chebyshev Graph Convolution Network
Graph convolution network (GCN) is usually used in node classification, graph classification, link prediction, and other tasks [30,31]. In general, a traditional graph convolution network only calculates the result of Chebyshev graph convolution at
To be specific, we model the power grid topology as an undirected graph
where
where I is the identity matrix and
where
where
Although high-order Chebyshev GCN can effectively propagate information and control the propagation range, all nodes in each order polynomial only share one parameter, which makes it impossible to adaptively allocate neighbor node weights according to node differences. Therefore, we introduce the spatio self-attention mechanism to further improve its feature representation capability. The spatio self-attention mechanism can dynamically adjust the attention weight between nodes. Accordingly, the network model can accurately learn the importance of each node relationship and then pay more attention to the nodes that are crucial to FDIA detection task. The attention scoring for node
where
Furthermore, the attention scores of all adjacent nodes of node i are normalized by using the softmax function to obtain the attention coefficient
When the network aggregates the node information according to
Finally, after all node information is aggregated, each node can dynamically adjust the feature representation according to its influence in the power grid to better reflect its role in the whole detection model.
3.3 BiLSTM Network with Temporal Self-Attention Mechanism
Bidirectional Long Short-Term Memory (BiLSTM) is a variant of recurrent neural networks (RNNs). Compared to traditional unidirectional LSTMs, BiLSTM can simultaneously consider both past and future information in a sequence, thus better capturing the long-term dependencies and contextual information of sequences [32]. A BiLSTM consists of two opposing LSTM layers, combining forward and backward information flow to enhance the capture of sequence data features [33]. In forward propagation, the BiLSTM can process the entire time sequence to capture past-to-present temporal information.
while in backward propagation, it can process from the time sequence end and mainly focus on future-to-present temporal information. BiLSTM allows each time point to access contextual information, comprehensively understanding temporal dependencies.
where
where
In view of the dynamic and complexity of the time series data involved in the FDIAs detection task, we further introduce the temporal self-attention mechanism to enhance the performance and robustness of the BiLSTM model. Our goal is to improve the model’s perception of the dynamic characteristics of time series data, so as to more accurately find the possible abnormal data, and further improve the model’s robustness. Specifically:
where
3.4 Spatio-Temporal Feature Fusion
Considering the spatial correlation and temporal dependence, the features can be further fused to improve the representation capability of the features by combining self-attention and temporal self-attention features. To be specific, we use the pre-processed measurement data as the input
where LeakyReLU is nonlinear activation function,
Finally, the spatio correlation information and temporal dependence information can be effectively fused to improve the representation capability of the features.
where
where

Figure 3: Structure diagram of a deep collaborative network with spatiotemporal self-attention mechanism
In addition, it is necessary to construct the calculation error and back-propagation error of the loss function to guide the updating of network parameters during the training process of the neural network. In our network model, the cross entropy loss function is used to calculate the loss of the model, and the cosine annealing learning rate scheduler is also involved to dynamically adjust the learning rate and optimize the training process of the deep learning model.
where N is the input sequence length,
3.5 Robust FDIA Detection Procedure
Based on the above-mentioned the spatiotemporal feature fusion model, we can build the detailed FDIA detection procedure, which can be described detailedly as follows, e.g., Algorithm 1, which can be described detailedly as follows:
• Step 1: We conduct power flow calculations on the data collected from the power grid to obtain measurement data, which is then pre-processed to get input features
• Step 2: We further compute the adjacency matrix
• Step 3: The information of various nodes in the power grid is sequentially aggregated by using CGCN to get the feature representation
• Step 4: Input feature X into bidirectional LSTM units to capture its long-term dependencies. Then, the forward and backward hidden states
• Step 5: Finally, the spatio-temporal features are fully fused to output the model decision

4 Experimental Results and Discussions
In this section, we first introduced the experimental setup and evaluation metrics in Sections 4.1 and 4.2, respectively. Then, a series of comparisons and discussions aiming at overall detection performance were sequentially performed in Section 4.3. Furthermore, we discussed the robustness between our scheme and several state-of-the-art schemes in Section 4.4. Last but not least, the computation complexity of different detection schemes was tested in Section 4.5.
In our experiment, the load information of different regions of NYISO was utilized as the basic power gird data to generate normal measurement data. We simulated the measured data
In order to ensure the authenticity of the experiment, we added the standard Gaussian distribution noise with a variance of 0.01 and mean value of 0, which was applied to different datasets, IEEE 14 bus system, IEEE 39 bus system, and IEEE 118 bus system, to generate experimental data with varying degrees of noise interference. Our goal is to verify that our detection model can still efficiently and accurately identify FDIA attacks under different levels of noise interference. In addition, for each bus system, we generated 15,000 groups of measurement data, including 7500 groups of FDIA data and 7500 groups of normal data. We labeled FDIA data as 1 and normal data as −1 to facilitate model detection. Correspondingly, all data samples were divided the data set into
Moreover, in the process of model training, our network model can gradually update the weight parameters by calculating the loss value and gradient. In order to speed up the convergence speed of model training and prevent gradient explosion, we normalized the input data by the
To provide sufficient performance comparison in terms of detection performance, we introduced four evaluation metrics, i.e., accuracy, precision, recall and
4.3 Comparison with the State of the Arts
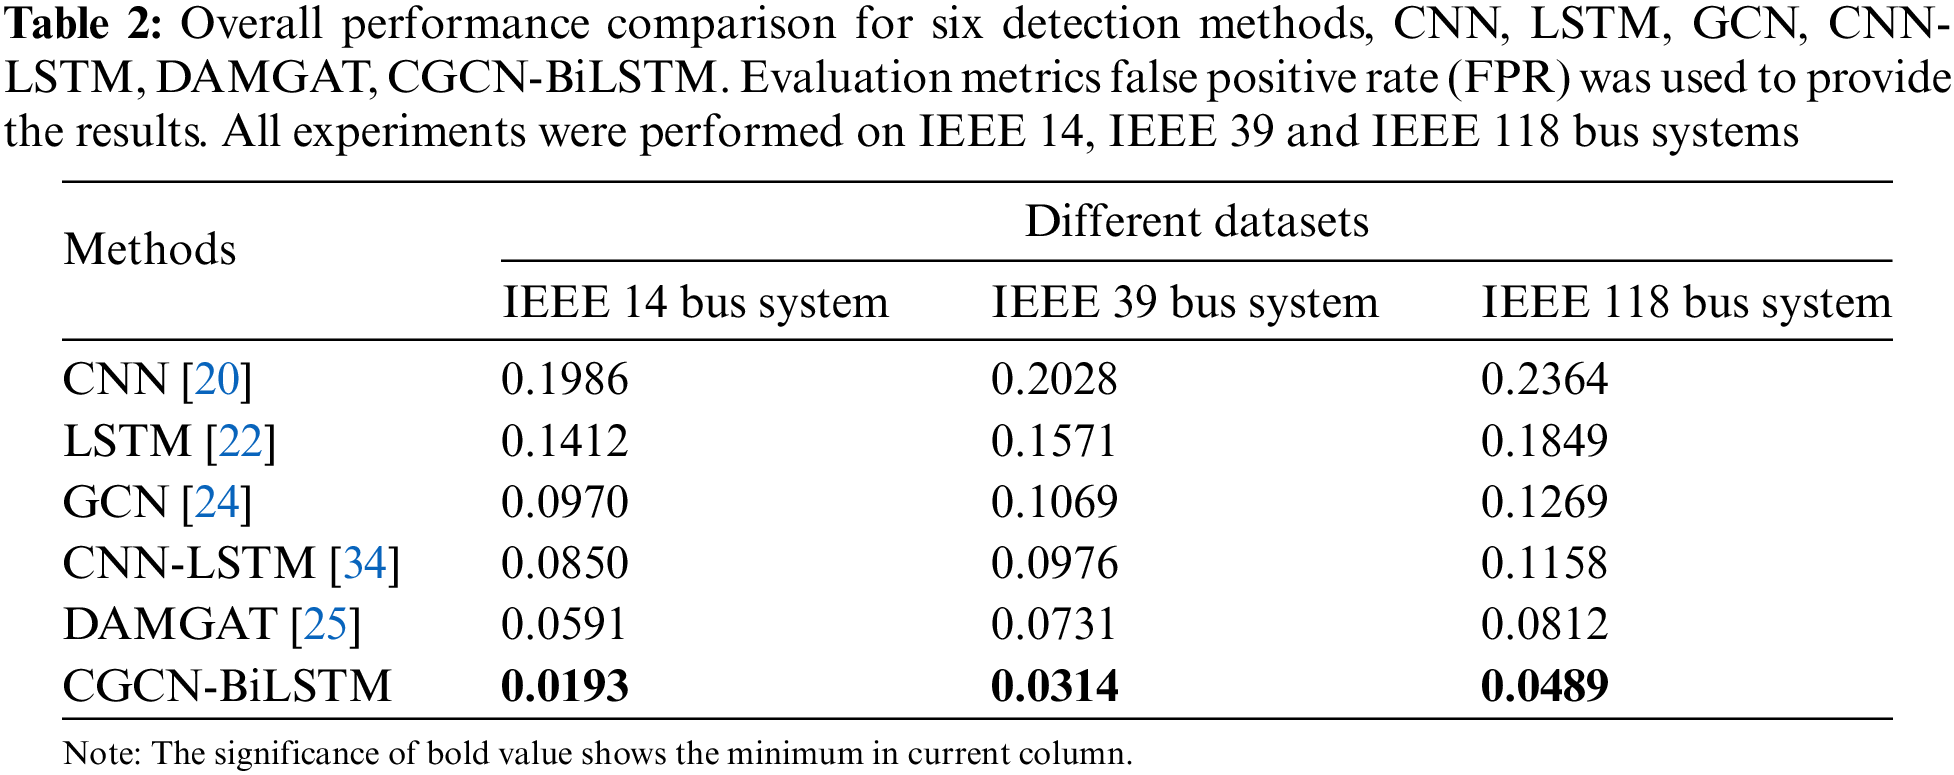
In this section, we conducted a series of experiments to compare the proposed scheme with existing state-of-the-art FDIA detection schemes, CNN [20], LSTM [22], GCN [24], CNN-LSTM [34] and DAMGAT [25]. In order to verify the effectiveness and reliability of the proposed FDIAs detection method, four different evaluation metrics, Accuracy, Precision, Recall,
The corresponding experimental results are shown in Table 1. As can be observed from this table, our scheme can obtain the best overall detection performance compared to other state-of-the-art schemes, no matter which dataset is used. To be specific, on IEEE 14 bus system, compared with the current best scheme DAMGAT [25], our scheme can obtain a significant performance gain with 3.25
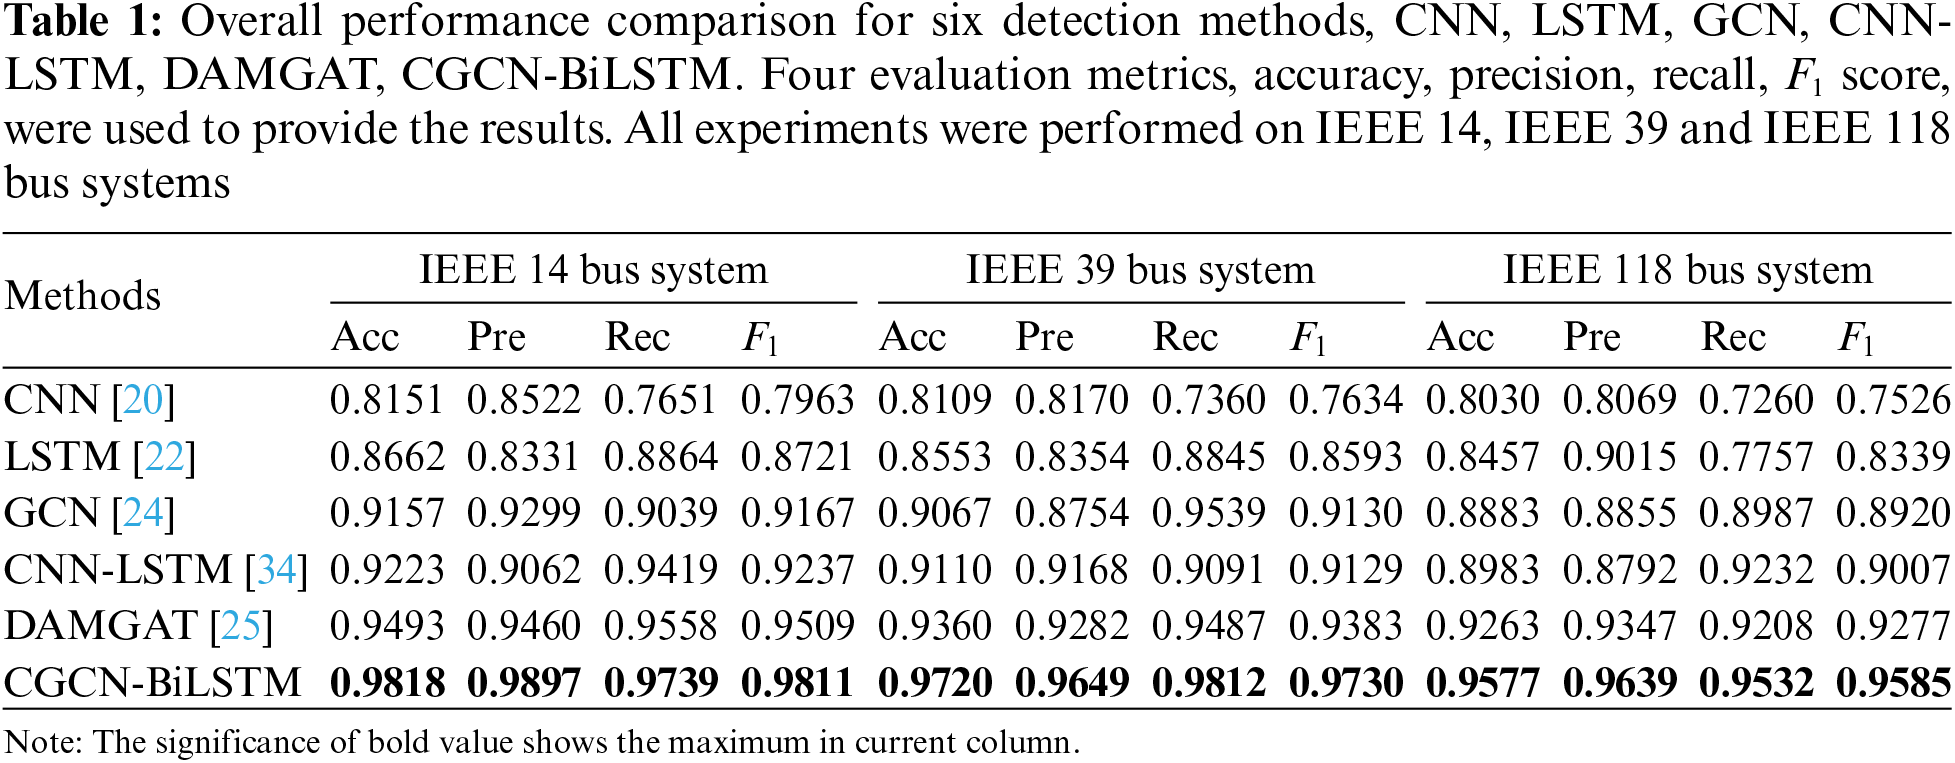
The above experimental results demonstrated that our scheme can achieve significant performance improvements on both small-scale and large-scale datasets. In fact, this phenomenon can be easily explained by the following two reasons. Firstly, our proposed deep collaborative network combined the characteristics of the graph convolution network and Bi-LSTM to optimize the network structure, which can better adapt to different power grid structures and effectively capture the difference between the slight changes and actual FDIA attacks in the power grid, thus improving the robustness of the model to potential FDIA attacks. Secondly, the self-attention mechanism was introduced in spatiotemporal feature construction, which can further enhance the representation capability of spatiotemporal features, thereby efficiently guiding detection features to pay more attention to the differences between FDIA attack samples and normal data, resulting in a significant improvement of detection accuracy.
Furthermore, we can observe an interesting phenomenon from Table 1, that is, the overall detection performance on the IEEE 118 bus system is slightly lower than that on the IEEE 39 and IEEE 14 bus systems. To be specific, for accuracy measurement, the average reductions for IEEE 118 bus system were approximately 2.41
In order to gain more insight, we further verified the applicability and robustness of the proposed detection scheme in the real power grid environment. In our experiments, a series of comparative experiments, including different attack intensities, different noise environments and different node attacks, were conducted over standard datasets from three bus systems, IEEE 14, IEEE 39 and IEEE 118 bus systems.
Attack intensity refers to the degree of deviation between the false data injected by the attacker and the actual measured data. A higher attack intensity means that there is a large deviation between the injected false data and the actual data, while a lower attack strength means that there is only a slight difference. Intuitively, FDIA attackers always hope that the attack data can bypass the detection model as much as possible while completing an effective attack, which forces the detection model to adapt to attack levels of different densities as much as possible. To give a more valid observation, we divided the generated FDIAs samples into the strong attack, medium attack, and weak attack [35] and observed the robustness of our proposed detection model under different levels of attack intensity, where strong attack is that the ratio of the average injection power deviation to the actual measurement is greater than 30
Figs. 4–6 present the experimental comparison of different attack intensities on IEEE 14, IEEE 39 and IEEE 118 bus systems, respectively. The abscissa in these figures shows the accuracy rate, accuracy rate, recall rate and
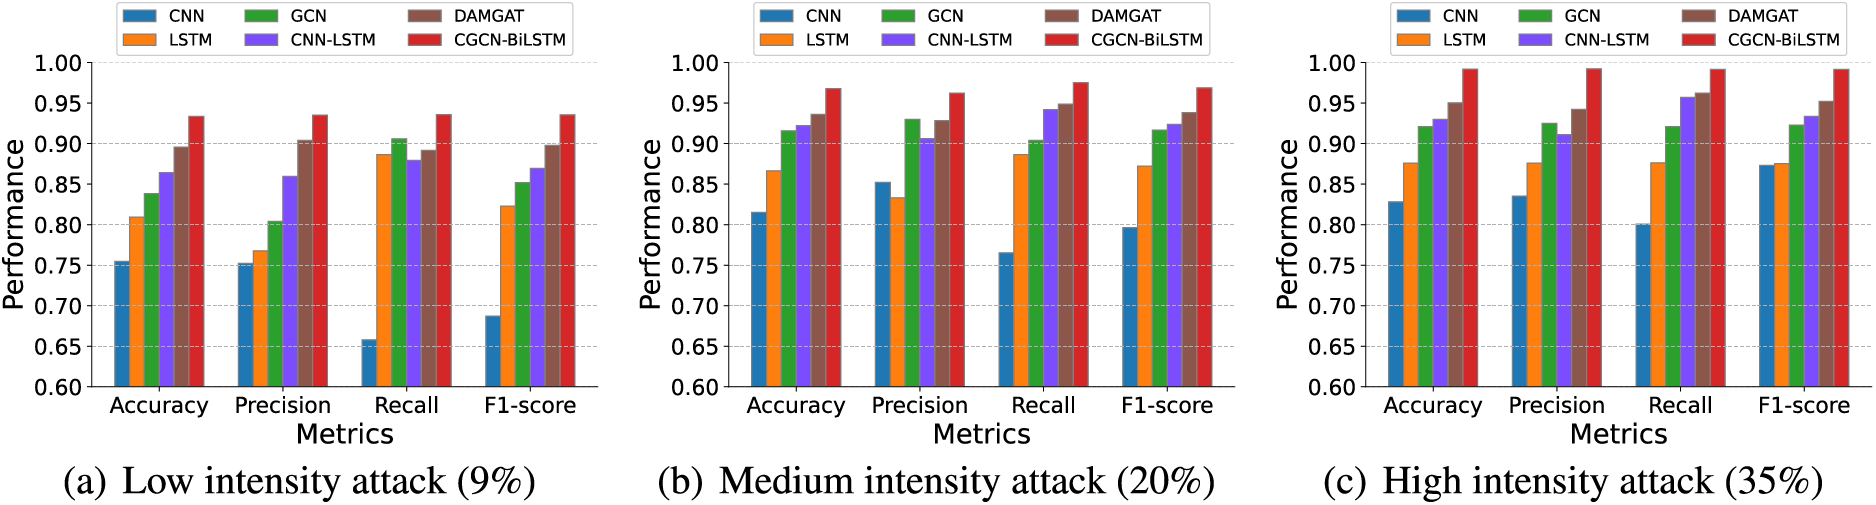
Figure 4: Performance comparison with four evaluation metrics for different attack intensities on IEEE 14 bus system. Three types of intensity attacks, Low (9

Figure 5: Performance comparison with four evaluation metrics for different attack intensities on IEEE 39 bus system. Three types of intensity attacks, Low (9

Figure 6: Performance comparison with four evaluation metrics for different attack intensities on IEEE 118 bus system. Three types of intensity attacks, Low (9
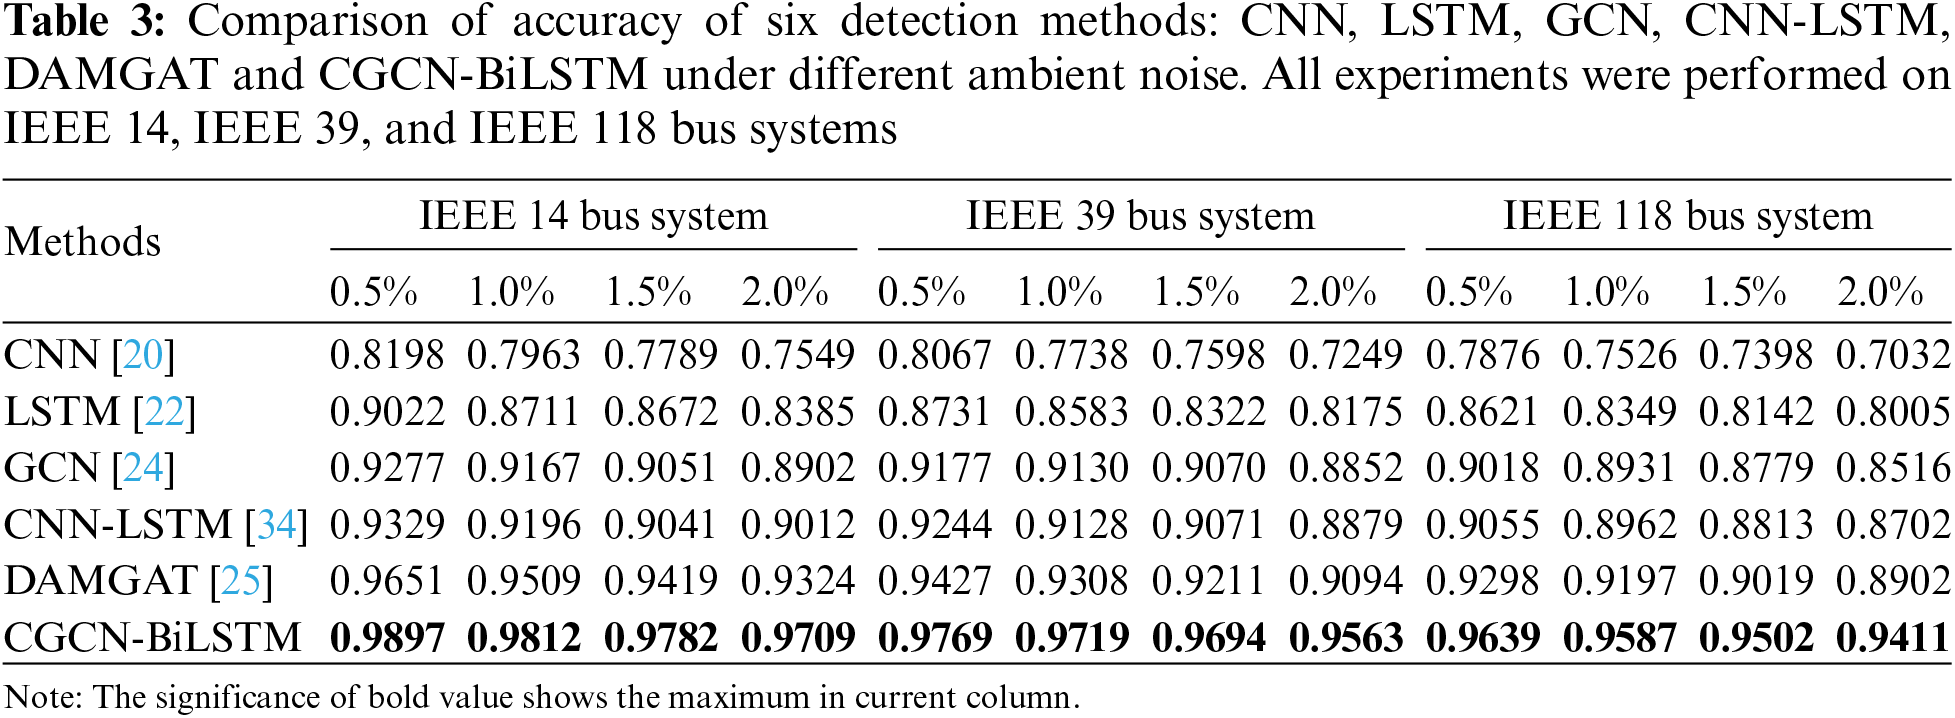
To give more insight, we implemented a series of experiments to further verify the robustness of the proposed method against measurement noise interference. Standard Gaussian noise with different variances were introduced into power grid measurement to simulate the real power grid environment, and performed specific experiments over IEEE 14, IEEE 39 and IEEE 118 bus systems.
The experimental results were shown in Fig. 7, where the abscissa represents the noise variance, while the ordinate is

Figure 7: Performance comparison under different noise environments. All experiments were performed over IEEE 14, IEEE 39 and IEEE 118 bus systems and standard Gaussian noises were used to simulate the real power grid environment
To accurately simulate real-world conditions in power grids, we further study the comparative experiments on single-node and multi-node attacks. In general, for FDIA attackers, single-node attacks can significantly reduce attack costs when the resources are limited. However, in some specific scenarios, the attackers may simultaneously implement FDIA attacks on multiple nodes to achieve maximum attack effectiveness.
We tested the detailed comparative experiments with different numbers of attack nodes on the IEEE 14, IEEE 39, and IEEE 118 test systems. The corresponding experimental results were shown in Tables 4–6, respectively. From these tables, the proposed method is significantly superior to the existing several detection methods on three bus systems, whether the single node or multiple nodes scenario was tested. Furthermore, the experimental results indicated that in single-node attack scenarios, the attack data are often limited to a very small number of data points, greatly increasing the difficulty of identifying FDIAs within a vast dataset of normal operations. In contrast, for multi-node attacks, due to strong inter-node relationships and the wide distribution of data, the model can obtain a richer set of data points for analysis, thereby generally achieving higher detection performance than single-node attacks. This observation further validates the effectiveness and high adaptability of the proposed scheme in complex attack scenarios.


4.5 Computational Complexity Analysis
To further demonstrate the superiority of our proposed scheme, we performed a detailed analysis of the complexity and compared the running time of different FDIA detection schemes. To estimate the complexity of each model, we compared the training times of different detection schemes. The running time of five existing state-of-the-art FDIA detection schemes, CNN [20], LSTM [22], GCN [24], CNN-LSTM [34] and DAMGAT [25], and our proposed scheme. The experiments were performed under identical environmental conditions to ensure a fair comparison. The training time per epoch was the average of ten epochs, while the total training time was the average of three complete model training. In addition, on IEEE 14 bus system, the total maximum execution time of the model is 158.12 s; On the larger IEEE 39 bus system, this time is extended to 491.49 s; On the most complex IEEE 118 bus system, the total maximum execution time reached 1472.16 s. In the self-attention mechanism we introduce, we use linear multiplication, the time complexity is mainly with the input node, its time complexity is maintained in
The corresponding experimental results were presented in Table 7. As can be seen from this table the average single training and total training time of our scheme were significantly lower than that of DAMGAT scheme, whichever IEEE bus system was used. Specifically, our scheme can reduce by 0.74 and 58.35 s for IEEE 14 bus system, 1.83 and 156.04 s for IEEE 39 bus system, and 8.49 and 623.72 s for IEEE 118 bus system. This is because the two-layer multi-head attention mechanism adopted by DAMGAT increases the computational complexity and leads to a long training time. Our proposed spatio-temporal self-attention mechanism simplifies the attention calculation and is more suitable for detection tasks, which significantly shortens the training time. In addition, compared to some traditional detection schemes, e.g., CNN, LSTM, our scheme got an obviously longer average single training and total training times. This is because the internal structure of traditional detection models is simpler, and their corresponding training process is thus faster. However, their feature extraction and representation capability is also correspondingly limited, which inevitably lowers their detection performance.

This paper proposed a deep collaborative self-attention network to achieve effective and robust FDIA detection. The proposed network designed a high-order Chebyshev polynomials-based graph convolution module to aggregate the node information in the power grid and introduced spatial self-attention mechanism to adjust the degree of attention given to different nodes. Furthermore, a bidirectional LSTM network with a self-attention mechanism was introduced to conduct time series modeling and long-term dependence analysis and assign different weights to different time steps. The proposed network model can effectively capture subtle perturbations from spatio-temporal feature information, efficiently achieving robust FDIA detection, and adapting to diverse attack intensities. Extensive experiments demonstrated that the proposed method outperformed existing state-of-the-art FDIA detection schemes in terms of detection accuracy and robustness.
While our scheme can improve the efficiency and robustness of FDIA detection, it should be noted that the training of the proposed network model may be more complex and time-consuming, especially for power grid topology with dynamic changes. In terms of future work, we aim to refine our new scheme in two ways. First, we intend to investigate FDIA detection method applied to dynamic topology changes in the power grid, which may be more practical for new power systems. Second, we intend to explore the lightweight of the deep collaborative network model by optimizing the self-attention structure. These two issues are left for our future work.
Acknowledgement: The authors would like to thank anonymous reviewers for their valuable suggestions which helped to improve this article.
Funding Statement: This work was supported in part by the Research Fund of Guangxi Key Lab of Multi-Source Information Mining & Security (MIMS21-M-02).
Author Contributions: The authors confirm contribution to the paper as follows: data collection: Tong Zu; analysis and interpretation of results: Tong Zu; draft manuscript preparation: Tong Zu; study conception and design: Fengyong Li; supervision and revision: Fengyong Li. All authors reviewed the results and approved the final version of the manuscript.
Availability of Data and Materials: All data used or analyzed during this study are included in this article and its references.
Ethics Approval: Not applicable.
Conflicts of Interest: The authors declare that they have no conflicts of interest to report regarding the present study.
References
1. Ghiasi M, Niknam T, Wang Z, Mehrandezh M, Dehghani M, Ghadimi N. A comprehensive review of cyber-attacks and defense mechanisms for improving security in smart grid energy systems: past, present and future. Elect Power Syst Res. 2023;215:108975. doi:10.1016/j.epsr.2022.108975. [Google Scholar] [CrossRef]
2. Islam MS, Rahman MA, Bin Ameedeen MA, Ajra H, Ismail ZB, Zain JM. Blockchain-enabled cybersecurity provision for scalable heterogeneous network: a comprehensive survey. Comput Modeling Eng Sci. 2024;138(1):43–123. doi:10.32604/cmes.2023.028687. [Google Scholar] [CrossRef]
3. Reda HT, Anwar A, Mahmood AN, Tari Z. A taxonomy of cyber defence strategies against false data attacks in smart grids. ACM Comput Surv. 2023;55(14s):1–37. doi:10.1145/3592797. [Google Scholar] [CrossRef]
4. Ghiasi M, Wang Z, Niknam T, Dehghani M, Ansari HR. Cyber-physical security in smart power systems from a resilience perspective: concepts and possible solutions. In: Power systems cybersecurity: methods, concepts, and best practices. Cham, Switzerland: Springer International Publishing, 2023. p. 67–89. [Google Scholar]
5. An D, Zhang F, Yang Q, Zhang C. Data integrity attack in dynamic state estimation of smart grid: attack model and countermeasures. IEEE Trans Autom Sci Eng. 2022;19(3):1631–44. doi:10.1109/TASE.2022.3149764. [Google Scholar] [CrossRef]
6. Elsisi M, Altius M, Su S-F, Su C-L. Robust kalman filter for position estimation of automated guided vehicles under cyberattacks. IEEE Trans Instrum Meas. 2023;72:1–12. doi:10.1109/TIM.2023.3250285. [Google Scholar] [CrossRef]
7. Zhang J, Zhou J, Gu Z, Zhang Z, Wang L, Yu ZL, et al. CS-LeCT: chained secure and low-energy consumption data transmission based on compressive sensing. IEEE Trans Instrum Meas. 2023;72:1–10. doi:10.1109/TIM.2023.3280495. [Google Scholar] [CrossRef]
8. Wang Z, He H, Wan Z, Sun Y. Coordinated topology attacks in smart grid using deep reinforcement learning. IEEE Trans Ind Inform. 2020;17(2):1407–15. doi:10.1109/TII.2020.2994977. [Google Scholar] [CrossRef]
9. Selvam R, Tyagi A. Residue number system (RNS) and power distribution network topology-based mitigation of power side-channel attacks. Cryptography. 2023;8(1):1. doi:10.3390/cryptography8010001. [Google Scholar] [CrossRef]
10. Ning C, Xi Z. Improved stealthy false data injection attacks in networked control systems. IEEE Syst J. 2024;18(1):505–15. doi:10.1109/JSYST.2024.3350179. [Google Scholar] [CrossRef]
11. Guo H, Sun J, Pang Z-H, Liu G-P. Event-based optimal stealthy false data-injection attacks against remote state estimation systems. IEEE Trans Cybern. 2023;53(10):6714–24. doi:10.1109/TCYB.2023.3255583. [Google Scholar] [PubMed] [CrossRef]
12. Bhattar PL, Pindoriya NM. False data injection attack with max-min optimization in smart grid. Comput Secur. 2024;140:103761. doi:10.1016/j.cose.2024.103761. [Google Scholar] [CrossRef]
13. Habib AA, Hasan MK, Alkhayyat A, Islam S, Sharma R, Alkwai LM. False data injection attack in smart grid cyber physical system: issues, challenges, and future direction. Comput Electr Eng. 2023;107:108638. [Google Scholar]
14. Li X, Hu L, Lu Z. Detection of false data injection attack in power grid based on spatial-temporal transformer network. Expert Syst Appl. 2024;238:121706. doi:10.1016/j.eswa.2023.121706. [Google Scholar] [CrossRef]
15. Wei S, Xu J, Wu Z, Hu Q, Yu X. A false data injection attack detection strategy for unbalanced distribution networks state estimation. IEEE Trans Smart Grid. 2023;14(5):3992–4006. [Google Scholar]
16. Qu Z, Yang J, Wang Y, Georgievitch PM. Detection of false data injection attack in power system based on hellinger distance. IEEE Trans Ind Inform. 2023;20(2):2119–28. doi:10.1109/TII.2023.3286895. [Google Scholar] [CrossRef]
17. Shen Y, Qin Z. Detection, differentiation and localization of replay attack and false data injection attack based on random matrix. Sci Rep. 2024;14(1):2758. doi:10.1038/s41598-024-52954-z. [Google Scholar] [PubMed] [CrossRef]
18. James J, Hou Y, Li VO. Online false data injection attack detection with wavelet transform and deep neural networks. IEEE Trans Ind Inform. 2018;14(7):3271–80. doi:10.1109/TII.2018.2825243. [Google Scholar] [CrossRef]
19. Habibi MR, Baghaee HR, Dragičević T, Blaabjerg F. Detection of false data injection cyber-attacks in DC microgrids based on recurrent neural networks. IEEE J Emerg Sel Top Power Electron. 2020;9(5):5294–310. doi:10.1109/JESTPE.2020.2968243. [Google Scholar] [CrossRef]
20. Lu K-D, Zhou L, Wu Z-G. Representation-learning-based CNN for intelligent attack localization and recovery of cyber-physical power systems. IEEE Trans Neural Netw Learn Syst. 2023;35(5):6145–55. doi:10.1109/TNNLS.2023.3257225. [Google Scholar] [PubMed] [CrossRef]
21. Wang Y, Zhang Z, Ma J, Jin Q. KFRNN: an effective false data injection attack detection in smart grid based on kalman filter and recurrent neural network. IEEE Internet Things J. 2021;9(9):6893–904. doi:10.1109/JIOT.2021.3113900. [Google Scholar] [CrossRef]
22. Ayad A, Khalaf M, Salama M, El-Saadany EF. Mitigation of false data injection attacks on automatic generation control considering nonlinearities. Elect Power Syst Res. 2022;209(6):107958. doi:10.1016/j.epsr.2022.107958. [Google Scholar] [CrossRef]
23. Boyaci O, Narimani MR, Davis KR, Ismail M, Overbye TJ, Serpedin E. Joint detection and localization of stealth false data injection attacks in smart grids using graph neural networks. IEEE Trans Smart Grid. 2021;13(1):807–19. doi:10.1109/TSG.2021.3117977. [Google Scholar] [CrossRef]
24. Li X, Wang Y, Lu Z. Graph-based detection for false data injection attacks in power grid. Energy. 2023;263(5):125865. doi:10.1016/j.energy.2022.125865. [Google Scholar] [CrossRef]
25. Su X, Deng C, Yang J, Li F, Li C, Fu Y, et al. Damgat based interpretable detection of false data injection attacks in smart grids. IEEE Trans Smart Grid. 2024;15(4):4182–95. doi:10.1109/TSG.2024.3364665. [Google Scholar] [CrossRef]
26. Zhang G, Li J, Bamisile O, Cai D, Hu W, Huang Q. Spatio-temporal correlation-based false data injection attack detection using deep convolutional neural network. IEEE Trans Smart Grid. 2021;13(1):750–61. doi:10.1109/TSG.2021.3109628. [Google Scholar] [CrossRef]
27. Han Y, Feng H, Li K, Zhao Q. False data injection attacks detection with modified temporal multi-graph convolutional network in smart grids. Comput Secur. 2023;124:103016. doi:10.1016/j.cose.2022.103016. [Google Scholar] [CrossRef]
28. Feng H, Han Y, Si F, Zhao Q. Detection of false data injection attacks in cyber-physical power systems: an adaptive adversarial dual autoencoder with graph representation learning approach. IEEE Trans Instrum Meas. 2024;73:1–11. doi:10.1109/TIM.2023.3331398. [Google Scholar] [CrossRef]
29. Li F, Shen W, Bi Z, Su X. Sparse adversarial learning for FDIA attack sample generation in distributed smart srids. Comput Model Eng Sci. 2024;139(2):2095–115. doi:10.32604/cmes.2023.044431. [Google Scholar] [CrossRef]
30. Zhao S, Peng R, Hu P, Tan L. Heterogeneous network embedding: a survey. Comput Model Eng Sci. 2023;137(1):83–130. doi:10.32604/cmes.2023.024781. [Google Scholar] [CrossRef]
31. Liao L, Hu Z, Zheng Y, Bi S, Zou F, Qiu H, et al. An improved dynamic Chebyshev graph convolution network for traffic flow prediction with spatial-temporal attention. Appl Intell. 2022;52(14):16104–116. doi:10.1007/s10489-021-03022-w. [Google Scholar] [CrossRef]
32. Liu X, Zhou H, Guo K, Li C, Zu S, Wu L. Quantitative characterization of shale gas reservoir properties based on BiLSTM with attention mechanism. Geosci Front. 2023;14(4):101567. doi:10.1016/j.gsf.2023.101567. [Google Scholar] [CrossRef]
33. Rahim MA, Farid FA, SalehMusaMiah A, Puza AK, Alam MN, Hossain MN, et al. An enhanced hybrid model based on CNN and BiLSTM for identifying individuals via handwriting analysis. Comput Model Eng Sci. 2024;140(2):1689–710. doi:10.32604/cmes.2024.048714. [Google Scholar] [CrossRef]
34. Dao F, Zeng Y, Qian J. Fault diagnosis of hydro-turbine via the incorporation of bayesian algorithm optimized CNN-LSTM neural network. Energy. 2024;290:130326. doi:10.1016/j.energy.2024.130326. [Google Scholar] [CrossRef]
35. Wu Y, Zu T, Guo N, Zhu Z, Li F. Laplace-domain hybrid distribution model based FDIA attack sample generation in smart grids. Symmetry. 2023;15(9):1669. doi:10.3390/sym15091669. [Google Scholar] [CrossRef]
Cite This Article
 Copyright © 2024 The Author(s). Published by Tech Science Press.
This work is licensed under a Creative Commons Attribution 4.0 International License , which permits unrestricted use, distribution, and reproduction in any medium, provided the original work is properly cited.
 Downloads
 Citation Tools