
 Submit a Paper
 Propose a Special lssue
 Open Access
ARTICLE
Numerical Simulation and Entropy Production Analysis of Centrifugal Pump with Various Viscosity
1 National Research Center of Pumps, Jiangsu University, Zhenjiang, 212013, China
2 School of Energy and Power Engineering, Jiangsu University, Zhenjiang, 212013, China
3 Shandong Xinchuan Mining Equipment Co., Ltd., Jining, 272300, China
* Corresponding Authors: Ling Bai. Email: ; Ling Zhou. Email:
Computer Modeling in Engineering & Sciences 2024, 141(2), 1111-1136. https://doi.org/10.32604/cmes.2024.055399
Received 26 June 2024; Accepted 29 August 2024; Issue published 27 September 2024
 View Full Text
 Download PDF
Abstract
The fluid’s viscosity significantly affects the performance of a centrifugal pump. The entropy production method and leakage are employed to analyze the performance changes under various viscosities by numerical simulation and validated by experiments. The results showed that increasing viscosity reduces both the pump head and efficiency. In addition, the optimal operating point shifts to the left. Leakage is influenced by vortex distribution in the front chamber and boundary layer thickness in wear-ring clearance, leading to an initial increase and subsequent decrease in leakage with increasing viscosity. The total entropy production inside the pump rises with increasing viscosity. The different mechanisms dominate under varying conditions: Turbulent dissipation dominates at low viscosity. Under high-viscosity conditions, energy loss is primarily caused by direct dissipation and wall entropy production . This study provides a deeper and more objective understanding of the energy characteristics of centrifugal pumps handling fluids of various viscosity, potentially aiding in optimizing pump design and improving energy conversion efficiency.Keywords
A centrifugal pump is extensively employed for fluid transportation [1]. In practical applications, the medium to be conveyed is normally viscous [2], such as petroleum development [3–5], fluid food [6,7], and sewage treatment [8–10]. The viscosity of the fluid significantly affects the performance of a centrifugal pump [11]. Therefore, studying the effects of fluid viscosity on a centrifugal pump’s performance is paramount.
However, despite the wide application of centrifugal pumps in conveying viscous liquids, centrifugal pump heads and efficiencies for conveying viscous liquids are still low, especially for low specific speed centrifugal pumps. Similarly, low-viscosity media are widely available in the industry; for example, the viscosity of pesticides is generally from 2 to 30 mPa·s, and the transportation of low-viscosity media has been somewhat neglected in current research. Jia et al. [12] investigated the impact of liquid viscosity on the interior flow field of a pump. In addition, the external characteristics, pressure pulsation, radial force, and entropy generation distributions were compared in a transfer pump for four fluid foods with various viscosity (water, glycerol, wild date juice, and hawthorn juice). The study found that with liquid viscosity rises, the energy loss and
A certain clearance must exist between the pump body and the rotor to accommodate structural needs. When the pressure on the two sides of the clearance is different, the fluid moves from the elevated pressure side towards the lesser pressure region. The energy gained by the liquid from the impeller is consumed to overcome the clearance resistance. The leakage at wear-ring clearance is the main component of the total leakage of the pump, and volumetric loss significantly affects the performance. If numerical simulations ignore the leakage at wear-ring clearance, the accuracy of the numerical simulation will be significantly affected. Some studies ignored the effect of wear-ring clearance and did not analyze the full flow field. Yousefi et al. [17] investigated the performance of centrifugal pumps when conveying high-viscosity fluids. They analyzed the influence of geometric parameters such as the inlet and outlet angles of the impeller and the shape and thickness of the vane edges on the pump’s performance and proposed an optimized model. Numerical simulations were carried out and compared with experimental results. The article indicates that by changing the geometrical parameters, the head and efficiency of the pump can be increased when conveying high-viscosity oils, and the swirl losses and pressure pulsations can be reduced. Shojaeefard et al. [18] analyzed the impact of the geometrical features of the impeller of a centrifugal pump on the conveying of viscous fluids. Numerical simulations and experimental validation were conducted. The study also investigated the effect of impeller outlet angle and passage width on pump performance and gave the optimum combination of parameters. The study concluded by presenting the pressure and velocity distributions inside the pump. The results indicated that the increase in pump head and efficiency for the optimal parameter combination is due to the reduction of vortex losses at the channel and impeller outlet. However, the research did not consider the effect of interstitial flow between the impeller and the worm casing on the pump performance. It also did not analyze the variation of vortex volume at various viscosity and the effect of viscosity on the loss mechanism and vortex generation. Zhu et al. [19] conducted experiments and simulations on a 7-stage electric submersible pump conveying oil of various viscosity. The head decreased by 30%–40% at the highest efficiency point when the oil viscosity increased from 10 to 100 cp. The electric submersible pump fails when the oil viscosity exceeds 200 cp. Accordingly, most of the current related research ignored the impact of the impeller and the pump casing between the mouth ring clearance, leakage loss with the change of viscosity change rule, and the reason is unclear. Therefore, a complete flow field simulation of the centrifugal pump is needed to investigate the flow at the wear-ring clearance.
The entropy production loss method can intuitively reflect energy loss characteristics and has been applied by many scholars in the energy loss assessment. In 2004, Kock et al. [20] first proposed the calculation method of local entropy production in the turbulent shear flow through the derivation of formulas and simplification of the model, which laid a theoretical foundation for the use of entropy production theory to analyze the energy loss in the fluid machinery. Ji et al. [21] examined the influence of impeller edge clearance on the internal fluid dynamics and hydraulic inefficiency of a mixed-flow pump, employing entropy generation principles. They indicated that a rise in leakage at the tip can escalate the impeller’s energy dissipation. Kan et al. [22] investigated the mechanism of energy dissipation arising from the tip leakage flow in an axial flow pump operating as a turbine, utilizing entropy generation theory. The study revealed that varying operational scenarios give rise to distinct energy loss mechanisms, with turbulent dissipation primarily contributing to this phenomenon. Employing the CFD approach, Gong et al. [23] evaluated flow field parameters across a spectrum of viscosities and rotational velocities. Applying entropy production theory, then scrutinized the turbine rig. The investigation unveiled that the primary energy depletion modes at low fluid viscosities were turbulent entropy generation and wall friction-induced entropy production. In contrast, direct entropy production and turbulent entropy generation dominated at high viscosities. Drawing from entropy production principles, the researchers analyzed energy dissipation in diverse fluid machinery, pinpointing both the loci and magnitudes of these losses. However, the medium viscosity makes the energy loss mechanism change significantly; the same different specific rotation speed pump energy loss mechanism is also different; the lower the specific rotation number of the pump wall entropy production proportion is higher; the lower the specific rotation number centrifugal pump various viscosity entropy production analysis research at present less, so need to perform further research.
This study conducts experimental and numerical simulations of various viscosity centrifugal pumps, and the simulation’s precision is inspected. The change of the external characteristic curves with the viscosity change is found by comparing the energy characteristic curves of various viscosity. The change mechanism of leakage of the wear-ring clearance with the viscosity change is analyzed, and the factors affecting the leakage loss are explored. Finally, the influence of viscosity on the distribution of entropy production is found through the statistics of different types of entropy production in different fluid domains under various viscosity.
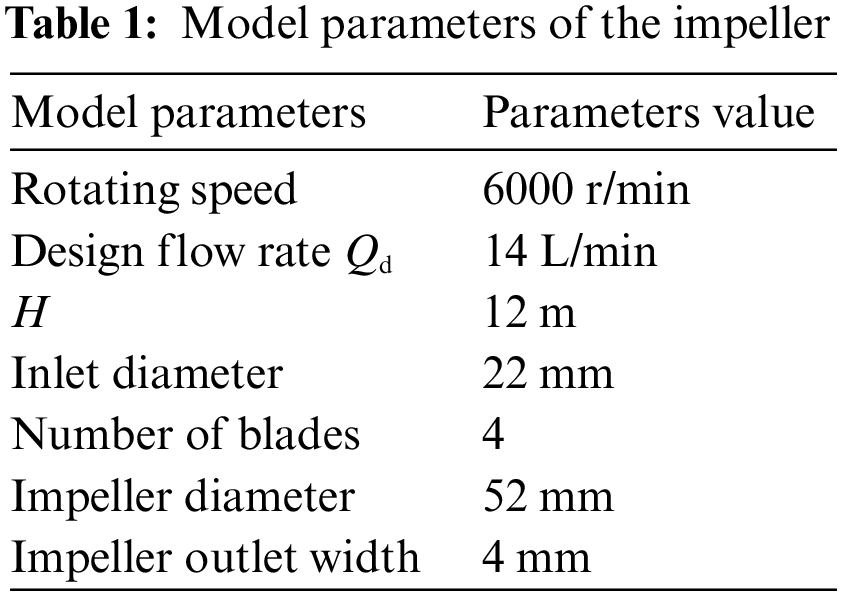
In this study, the research object is a typical centrifugal pump. Table 1 indicates that the design flow rate is
The SpaceClaim software is employed for three-dimensional solid modeling. The fluid field model is split into five parts: inlet pipe, impeller, front chamber, back chamber, and volute, and the entire flow field fluid domain is obtained by extracting the volume to get the actual fluid domain, which helps the numerical simulation results to be closer to the actual value. The three-dimensional structure of the fluid domain is shown in Fig. 1.
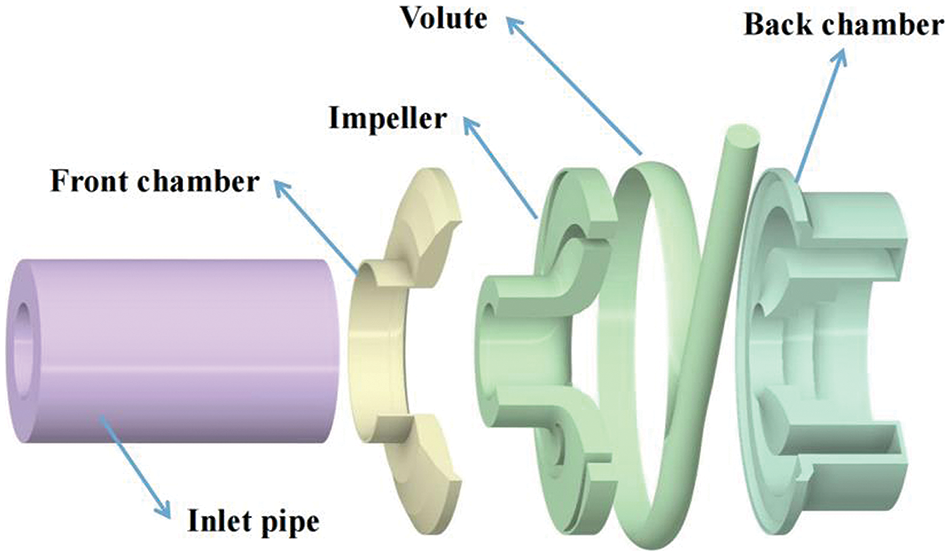
Figure 1: Three-dimensional structure of the fluid domain of centrifugal pump
Since the set of fluid equations of motion often cannot be solved analytically, numerical simulation of fluids by the finite volume method requires discretization of the fluid domain, i.e., continuously varying flow field parameters are approximated by data at a finite number of discrete points. In this study, the ANSYS-ICEM software is employed to perform structural meshing, and the advantages of structured hexahedral grid cells are the small number of meshes, high quality, and good fitting of the regional boundaries, which makes it easier to converge during numerical computation. The mesh quality is controlled above 0.34, the near-wall mesh is encrypted, and the overall Y-plus is less than 30. The hexahedral meshes of the impeller and volute are shown in Fig. 2.
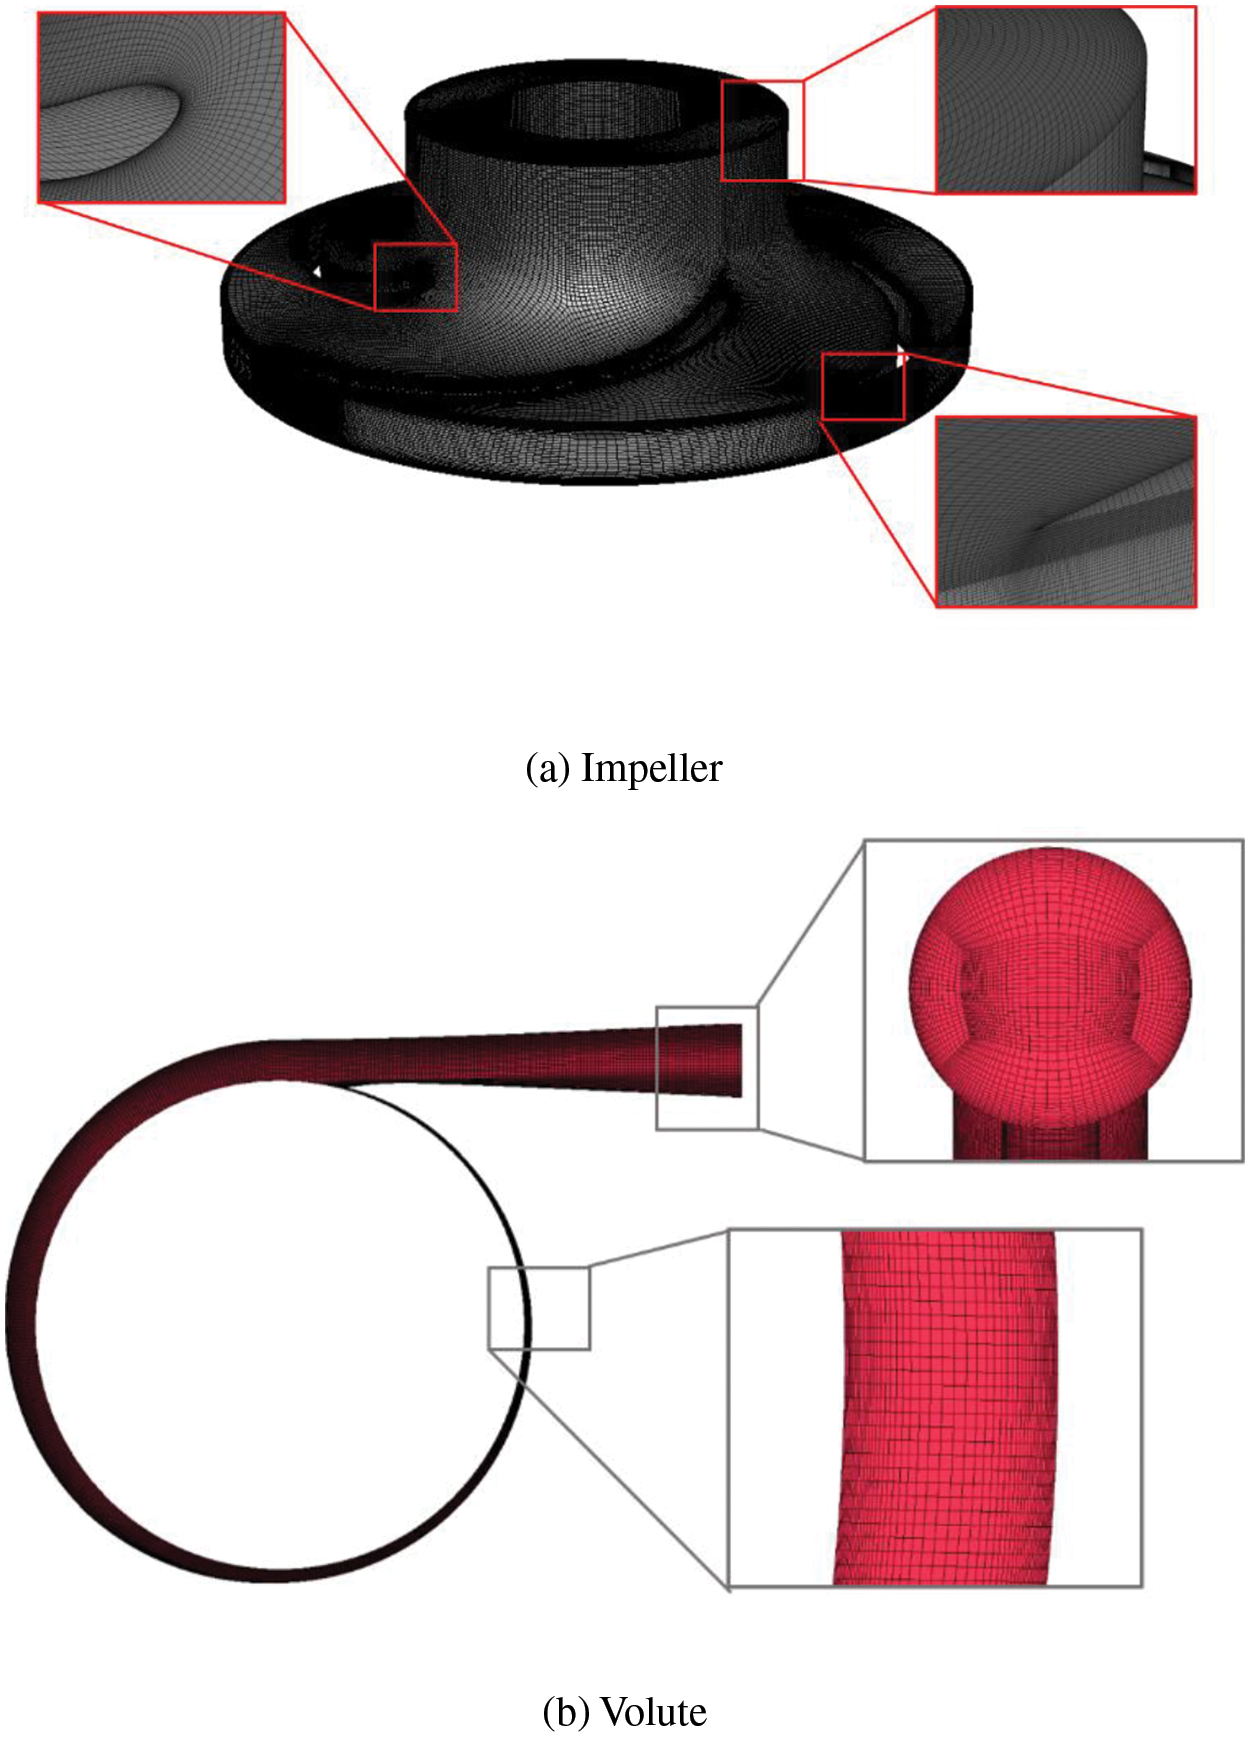
Figure 2: Grid generations of the primary fluid domain
Six distinct calculation schemes varying in grid count for result analysis were chosen to ensure grid independence. Table 2 and Fig. 3 indicate that head and efficiency converge toward stability as grid numbers escalate. At a grid count of 3.66 million, the calculation results closely align with experimental data, with relative errors remaining minimal (head error < 1%, efficiency error < 1%). This indicates that a certain degree of grid independence was achieved. As the grid count rises to 4.6 million, the relative error between the calculation results and the experimental data does not improve significantly but leads to increased calculation time and memory consumption. Therefore, this study concludes that the number of 3.66 million grids is a more reasonable and cost-effective choice.

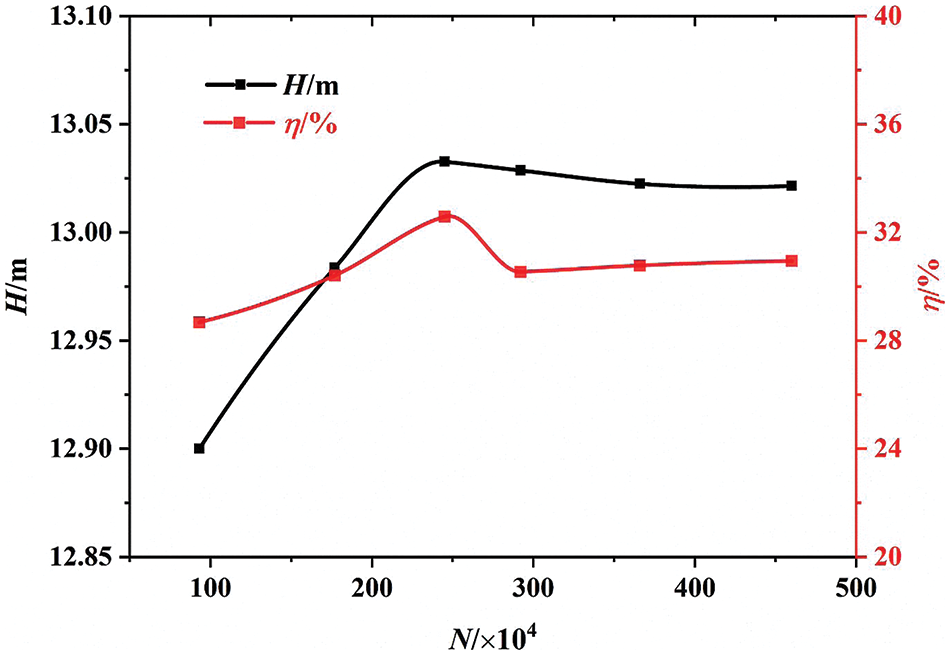
Figure 3: Validation of grid independence
2.4.1 Governing Equations and Turbulence Model
An incompressible single-phase flow can be described by a governing equation consisting [24] of the continuity and conservation of momentum equations. The governing equation is as follows:
where
This study uses the Shear-Stress Transport (SST) k-ω turbulence model [25,26]. The SST k-ω turbulence model is a two-equation approach that fuses the strengths of the k-ε model for far-field applications with the k-ω model’s benefits near walls. It excels in simulating turbulent flows within boundary layers and under pressure gradients. Considering shear stress transport enhances the accuracy of separated flow predictions. In addition, this model enables improved forecasting of wall flows and vortices encountered in pumps.
The following equations are for the SST k-ω turbulence model:
where
Effective diffusion term equations:
where
where
where
2.4.2 Entropy Production Theory
Entropy production reveals the zones of flow losses and quantifies energy dissipation within the flow field [20,27]. In pumps, it stems primarily from time-averaged velocity, pulsation velocity, and wall influence. Within the centrifugal pump’s computational domain, the total entropy production
The entropy production rate generated by the time-averaged velocity, also called the direct dissipation entropy production rate, is calculated as follows:
where μ is the hydrodynamic viscosity; u, v, and w are the components of the velocity V in the x, y, z direction of the right-angle coordinate system; T is the temperature.
The turbulent dissipation-induced entropy yield, synonymous with the entropy output from pulsating velocity, is computed as detailed below:
In the SST k-ω turbulence model, the turbulent dissipative entropy yield [28] can be calculated by the following equation:
where
where
The total entropy production is calculated as follows:
2.4.3 Omega Vortex Identification Method
Liu et al. [29] decomposed
where
where
2.5 Settings of Simulation and Medium Properties
Numerical simulations are conducted to ensure computational precision, employing Fluent 2019 R3, a commercial software. The threshold for residual convergence is established at 10−4. steady-state three-dimensional numerical simulations are performed to predict the flow field and pump performance characteristics under pure water conditions. The initial liquid medium in the calculation area is liquid water with a density of 998.2 kg/m3, and the gravitational acceleration is set to 9.81 m/s2. The SST k-ω turbulence model is selected as the turbulence model. The impeller was set to rotate at 6000 r/min, and all other computational domains are set to be stationary.
If the boundary conditions are not properly selected, it will affect the convergence process and the correctness of the calculation, so it is necessary to select appropriate initial conditions as well as boundary conditions. The inlet adopts velocity conditions derived from flow rate, while the outlet employs pressure conditions. Wall surfaces adhere to no-slip conditions. Standard pressure difference format is selected alongside SIMPLEC for pressure-velocity coupling. Momentum, turbulence kinetic energy, and dissipation rate utilize second-order upwind discretization [30]. Refer to Fig. 4 for the simulation flowchart.
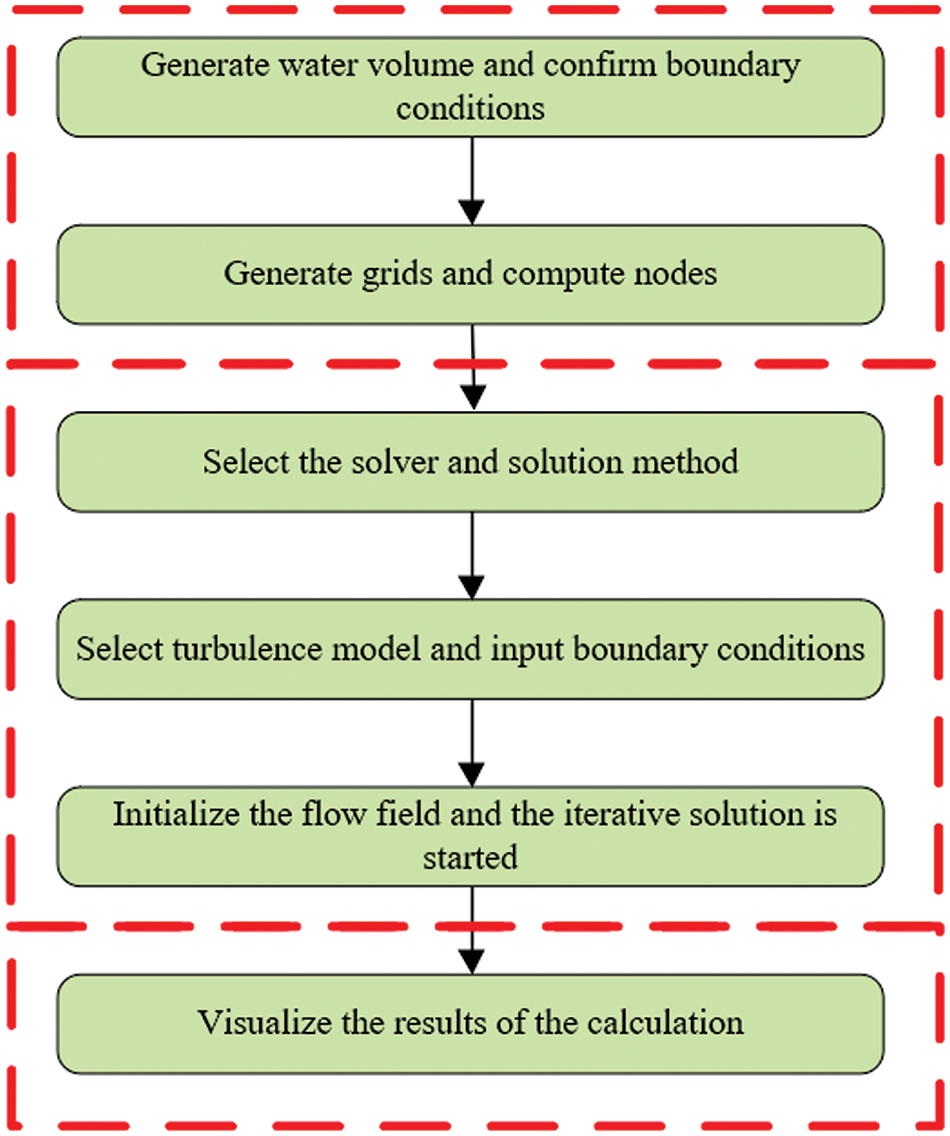
Figure 4: The flow chart of the simulations
With pure water and different kinds of glycerin aqueous solution as the medium, the centrifugal pump external characteristics of the experiment, measuring the working speed of the centrifugal pump pumping glycerin aqueous solution of the external characteristics of the parameter, set up a centrifugal pump performance experiment bench, the experimental bench is mainly composed of centrifugal pump models, motors, imports and exports piping, tanks and microcontroller controller and so on, the suction pipeline is installed with a vacuum gauge and gate valves, the export pipeline is equipped with pressure gauges, gate valves, electromagnetic The outlet pipeline is equipped with pressure gauge, gate valve, electromagnetic flow meter and others. The experimental setup’s schematic illustration is depicted in Fig. 5.
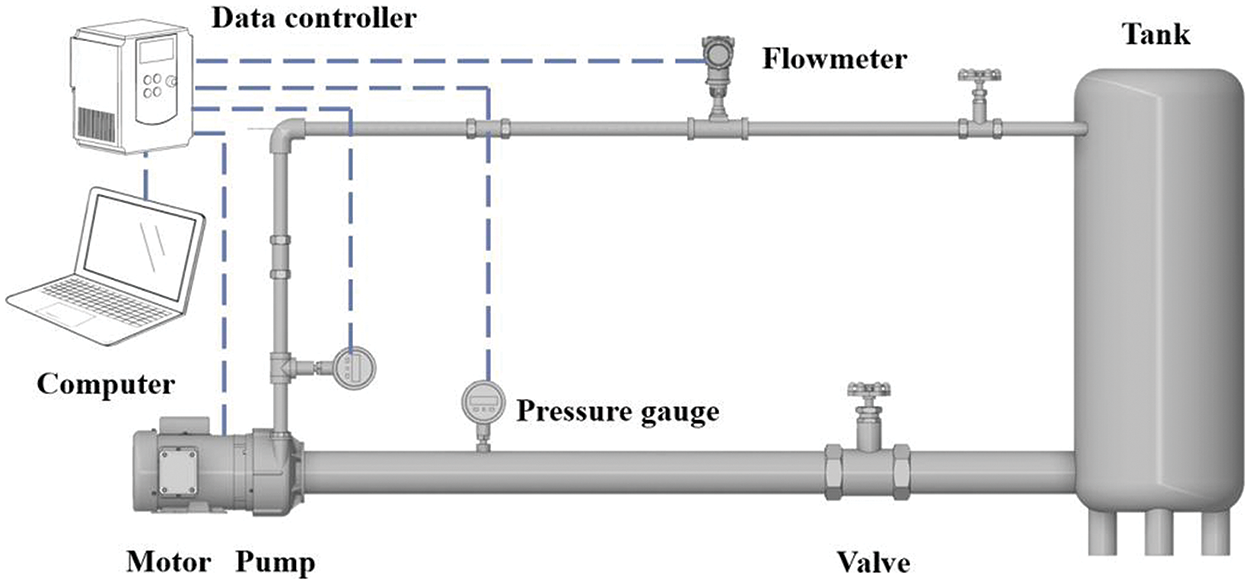
Figure 5: Experiment bench
The centrifugal pump consists of a centrifugal pump impeller, pump body, and motor. The pump casing and impeller are made of engineering plastic injection molding to ensure the strength and precision of the impeller. This experiment adheres to the bench’s experimental protocol for external characteristic parameter measurement. Readings for centrifugal pump flow rate (η), inlet-outlet pressure difference (∆P), current (U), and voltage (I) are directly obtained using an electromagnetic flow meter, inlet/outlet pressure gauges, a constant voltage power supply, and associated instruments. In the experimental process, the centrifugal pump flow rate can be adjusted by adjusting the control valve of the inlet and outlet pipelines, and the microcontroller can modify the rotational speed to observe the change of the external characteristics in the process of working under various viscosity under different working conditions.
3.2 Validation of Simulation Results
Numerical simulations and experimental measurements were conducted to pump pure water and two aqueous glycerol solutions with various viscosities. Figs. 6–8 depict simulated experimental comparisons of the centrifugal pump’s external characteristic curves for freshwater, 9.55 mPa·s viscosity, and 24.4 mPa·s viscosity, respectively. The experiments under these conditions align closely with the simulated head efficiency curve, maintaining an overall error within 5%. This underscores the practical value of numerical simulation in investigating the pump’s external characteristics and internal flow dynamics across various viscosities. Therefore, it is of practical significance to use numerical simulation to study the external characteristics and internal flow of the centrifugal pump, which also verifies the reliability of CFD simulation.
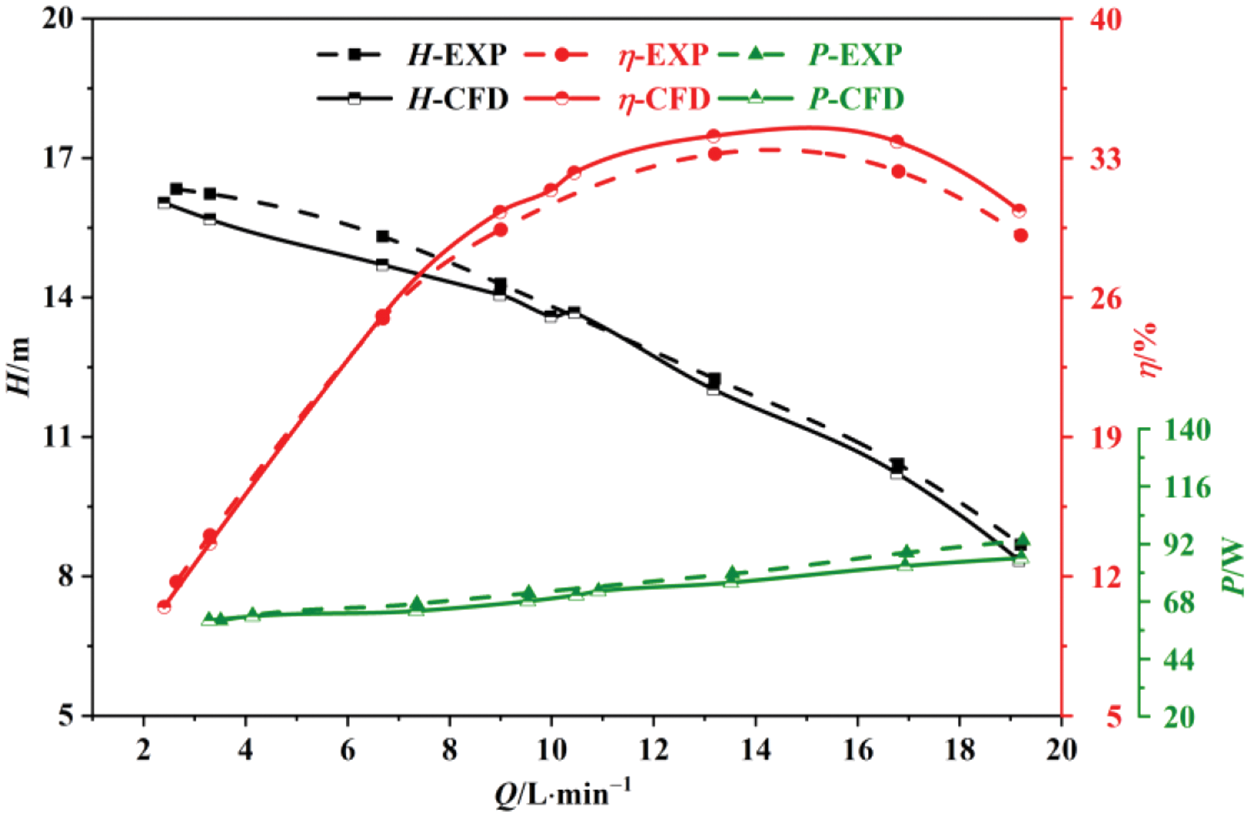
Figure 6: Simulated and experimental external characteristic curves at 1 mPa·s
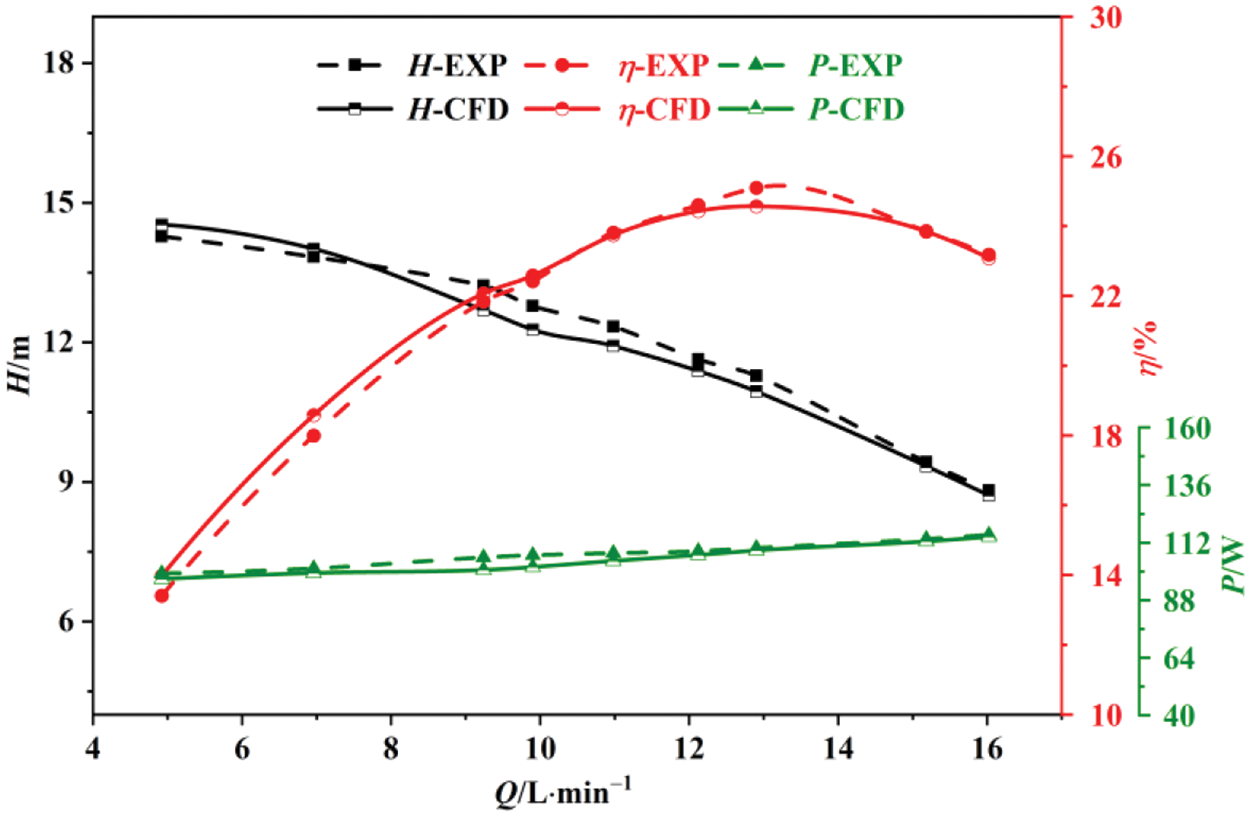
Figure 7: Simulated and experimental external characteristic curves at 9.55 mPa·s
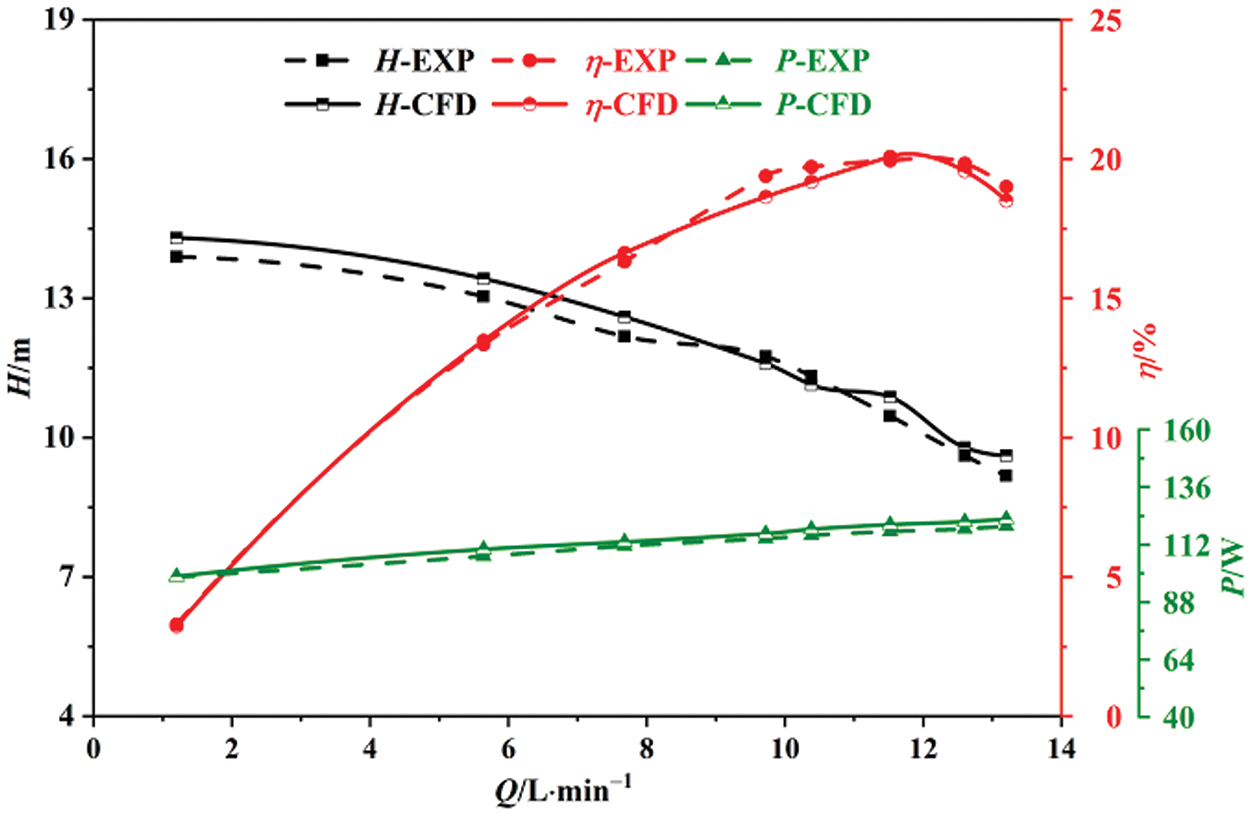
Figure 8: Simulated and experimental external characteristic curves at 24.4 mPa·s
4.1 Influence of Viscosity on Pump Performance
The performance curves of centrifugal pumps with various viscosity were obtained by numerical simulations for liquids with viscosity of 1, 5, 10, 15, 20, 25, and 30 mPa·s, respectively. Fig. 9 illustrates the relationship between pump head and viscosity. As the viscosity increases, the pump head shows a decreasing trend. The viscous fluid’s flow results in the development of a sticky boundary layer on the flow path’s surface, leading to this phenomenon. The boundary layer creates surface adhesion and inhibits fluid movement. As a result, the outflow velocity from the impeller decreases. In addition, increases in viscosity lead to a more significant drop in speed. Hence, the head of the centrifugal pump diminishes progressively as the medium’s viscosity rises. Also, when the flow rate rises, the head gradient decreases and becomes larger. On the other hand, the slip coefficient rises when the viscosity increases. This leads to an increase in the theoretical head of the pump. In addition, the increase in viscosity also reduces the pump leakage, so the theoretical volumetric flow decreases, and the theoretical head increases. However, due to the increase in viscosity, the hydraulic losses increase significantly more than the slip reduction and leakage reduction brought about by the theoretical head increase. Thus, the actual head decreases. This causes the head curve to become steeper as the viscosity increases.
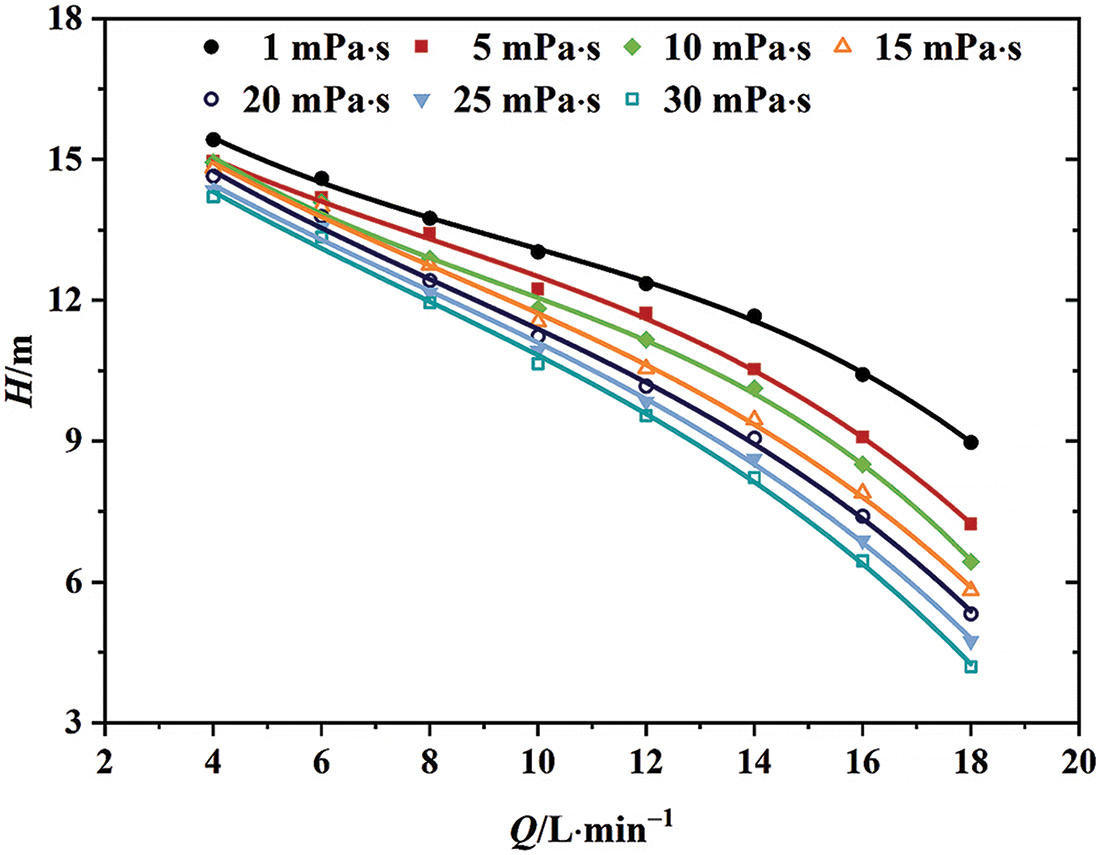
Figure 9: External characteristic curves of flow head at various viscosity
Fig. 10 depicts the efficiency of a centrifugal pump plotted against flow rate Q for seven liquids of varying viscosities. It indicates that the pump attains peak efficiency with pure water and minimal efficiency with a 30 mPa·s viscosity liquid. The higher viscosity of the liquid intensifies friction between its interior and flow channel walls, augmenting energy loss within the pump and diminishing its efficiency. In addition, with increasing viscosity, the highest efficiency point will also be shifted to the direction of the small flow. For example, in water transmission, the highest efficiency point is 14 L/min, and in the transmission of 30 mPa·s liquid, the highest efficiency point is 12 L/min. This shows that the viscosity of the medium affects not only the pump’s efficiency but also the highest efficiency point. This can be due to the thickening of the boundary layer on the surface of the flow channel and the increase of the internal crowding effect of the fluid. In contrast, efficiency will initially rise under high-flow conditions as flow increases before declining. In addition, the greater the deviation, the more significant the decrease in efficiency. This can be due to the influence of the liquid viscosity and the hydrodynamic loss generated during the deviation conditions such as de-fluxing, impact, and others. Accordingly, the viscosity of the liquid significantly influences the efficiency of a centrifugal pump, causing a decline in efficiency, broadening the high-efficiency range, and shifting the highest efficiency point towards lower flow rates.
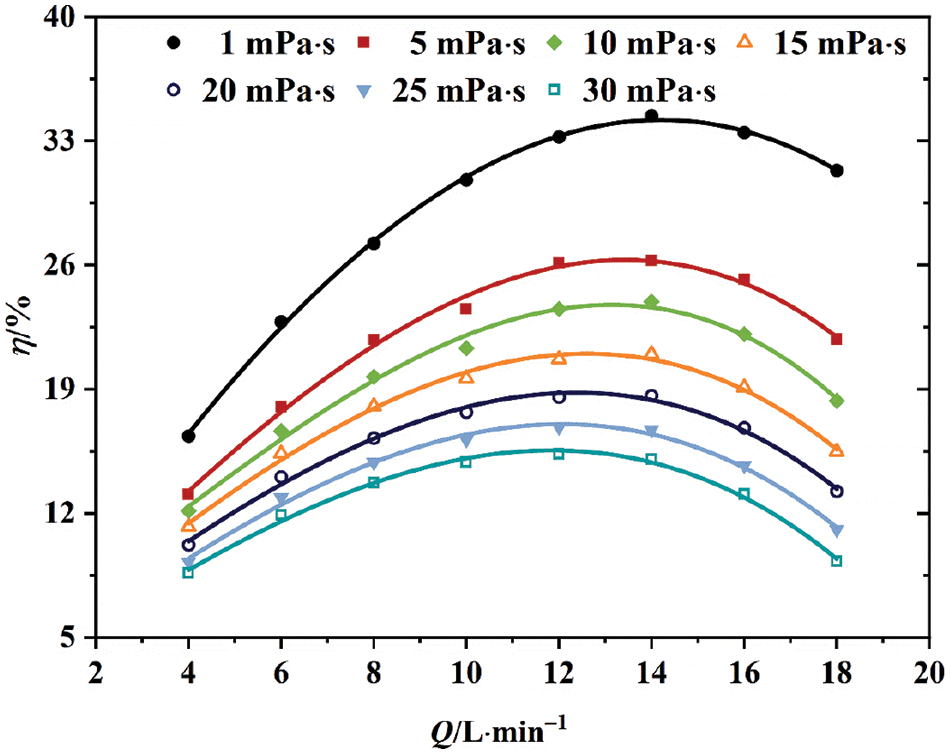
Figure 10: External characteristic curves of flow efficiency at various viscosity
Fig. 11 indicates that the graph demonstrates the relationship curve between the shaft power P and the flow rate Q when the centrifugal pump conveys liquids of various viscosity. It shows that in a specific range of flow conditions, the viscosity of the working medium from 1 mPa·s gradually increases to 30 mPa·s, and the shaft power also increases. This indicates that the change in liquid viscosity affects the shaft power. This phenomenon is because the higher the viscosity, the centrifugal pump impeller rotation in the impeller before and after the cover plate, and the vane and fluid friction loss between the greater the disc friction loss. This requires more mechanical energy to be consumed, which leads to an increase in shaft power.

Figure 11: External characteristic curves of flow power at various viscosity
4.2 Wear-Ring Clearance Leakage Flow Analysis
The front cover plate of the impeller constitutes the rotating disk in the front chamber, compared against the solid pump casing wall, creating a dynamic-static chamber configuration. The impeller’s speed influences the rotating disk’s rotation. High-pressure fluid exiting the impeller stage permeates the wear-ring clearance via the front chamber, generating leakage flow. This leakage flow, a forced overflow from the front chamber, enters proximal to the impeller outlet and exits through the wear-ring clearance. Although the pressure disparity between the front chamber and impeller inlet prompts leakage, the primary determinant of leakage volume surpasses mere pressure level. It is intimately tied to the flow dynamics within the front chamber and the flow pattern within the wear-ring clearance.
4.2.1 Effect of Flow Rate on Leakage Flow
At flow rates of 0.6, 0.8, 1.0, 1.2, and 1.4 Qd, the flow rate at wear-ring clearance and the flow rate is shown in Fig. 12. As the flow rate escalates, the pressure differential between the front chamber and impeller inlet diminishes progressively. However, the leakage through the wear-ring clearance does not exhibit a consistent upward or downward trend, which indicates that the pressure difference is not the main cause of the change in the leakage of wear-ring clearance. Under the minor flow condition, wear-ring clearance leakage flow is 42% of the total flow. At 1.4 Qd flow, wear-ring clearance leakage accounts for 23% of total flow, emphasizing its significance in pump performance. As the flow rate rises, the leakage flow ratio diminishes, correspondingly reducing leakage loss’s share in overall energy loss.
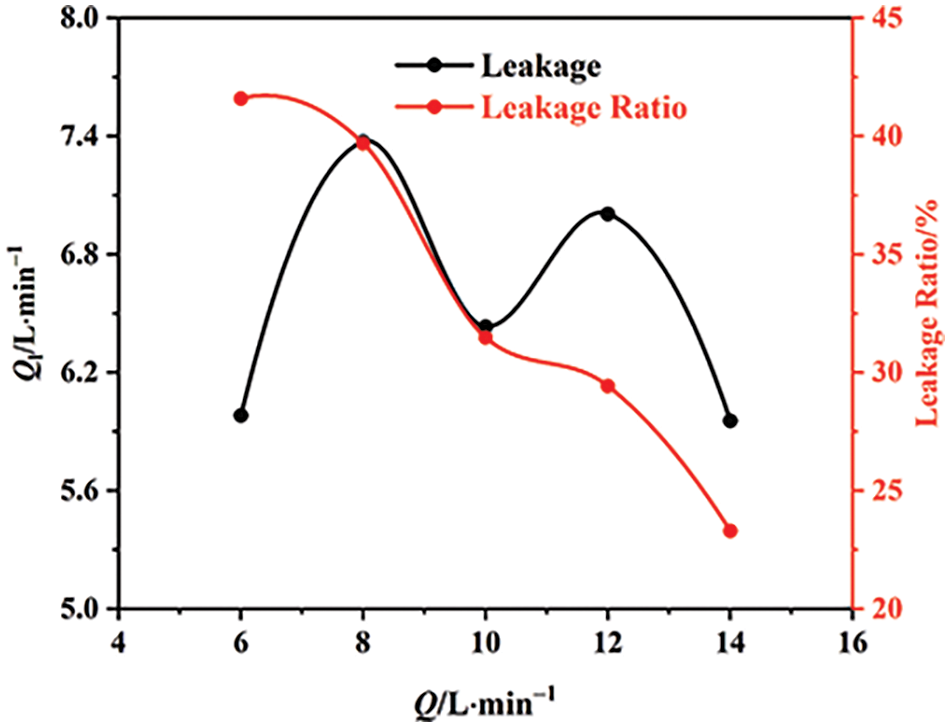
Figure 12: Wear-ring clearance leakage and leakage ratio at different flow rates
4.2.2 Effect of Viscosity on Leakage Flow
Fig. 13 depicts wear-ring clearance leakage flow rates alongside flow rate examples for 1.0 Qd flow and viscosities spanning 1 to 100 mPa·s. Leakage flow rates rise from 1 to 30 mPa·s, contrasting the literature. Fig. 11 shows head decline with increased viscosity, reducing the pressure differential between the front chamber and impeller inlet. This indicates that the pressure difference is not the sole determinant of leakage flow rate; it is intricately linked to front chamber flow dynamics and wear-ring clearance flow patterns. Leakage flow rates decrease from 30 to 100 mPa·s viscosity range.
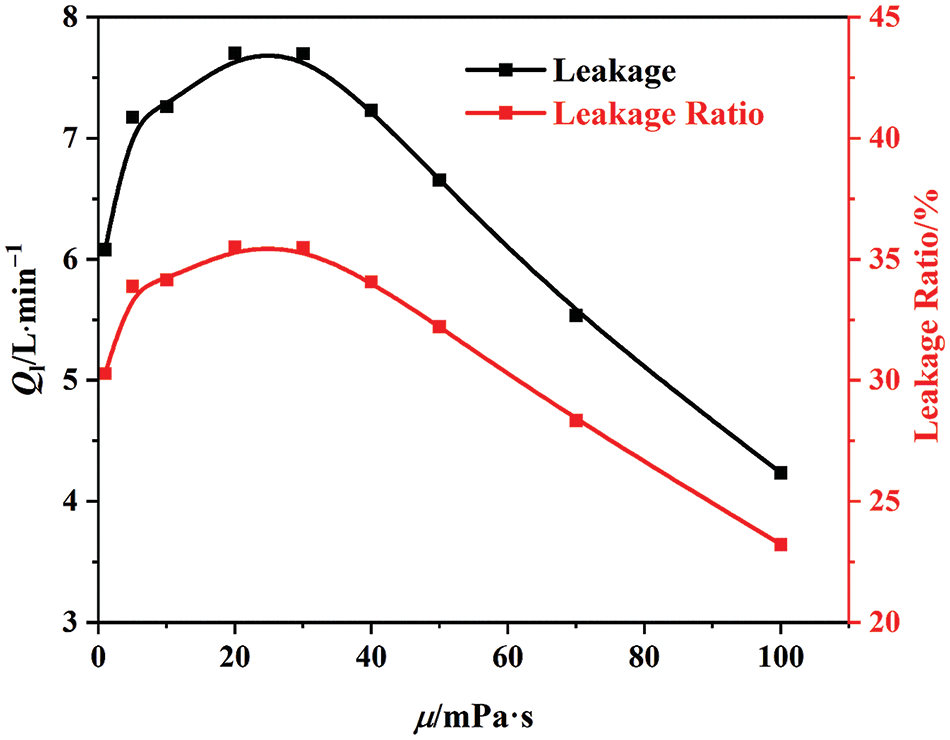
Figure 13: Leakage and leakage ratio at wear-ring clearance at various viscosity
Fig. 14 illustrates Omega and streamline distributions in the front chamber across viscosities from 1 to 100 mPa·s. At 1 mPa·s, three distinct vortices emerge in the chamber’s inlet, midsection, and junction with wear-ring clearance. These vortices hinder forced overflow, mitigating wear-ring clearance leakage and reducing leakage losses. As viscosity climbs, vortex intensity and extent diminish. At 20 mPa·s, the vortex at the chamber inlet vanishes; at 30 mPa·s, the vortex at the chamber-wear-ring clearance junction disappears. This explains the continuous rise in leakage flow rate from 1 to 30 mPa·s viscosity range.
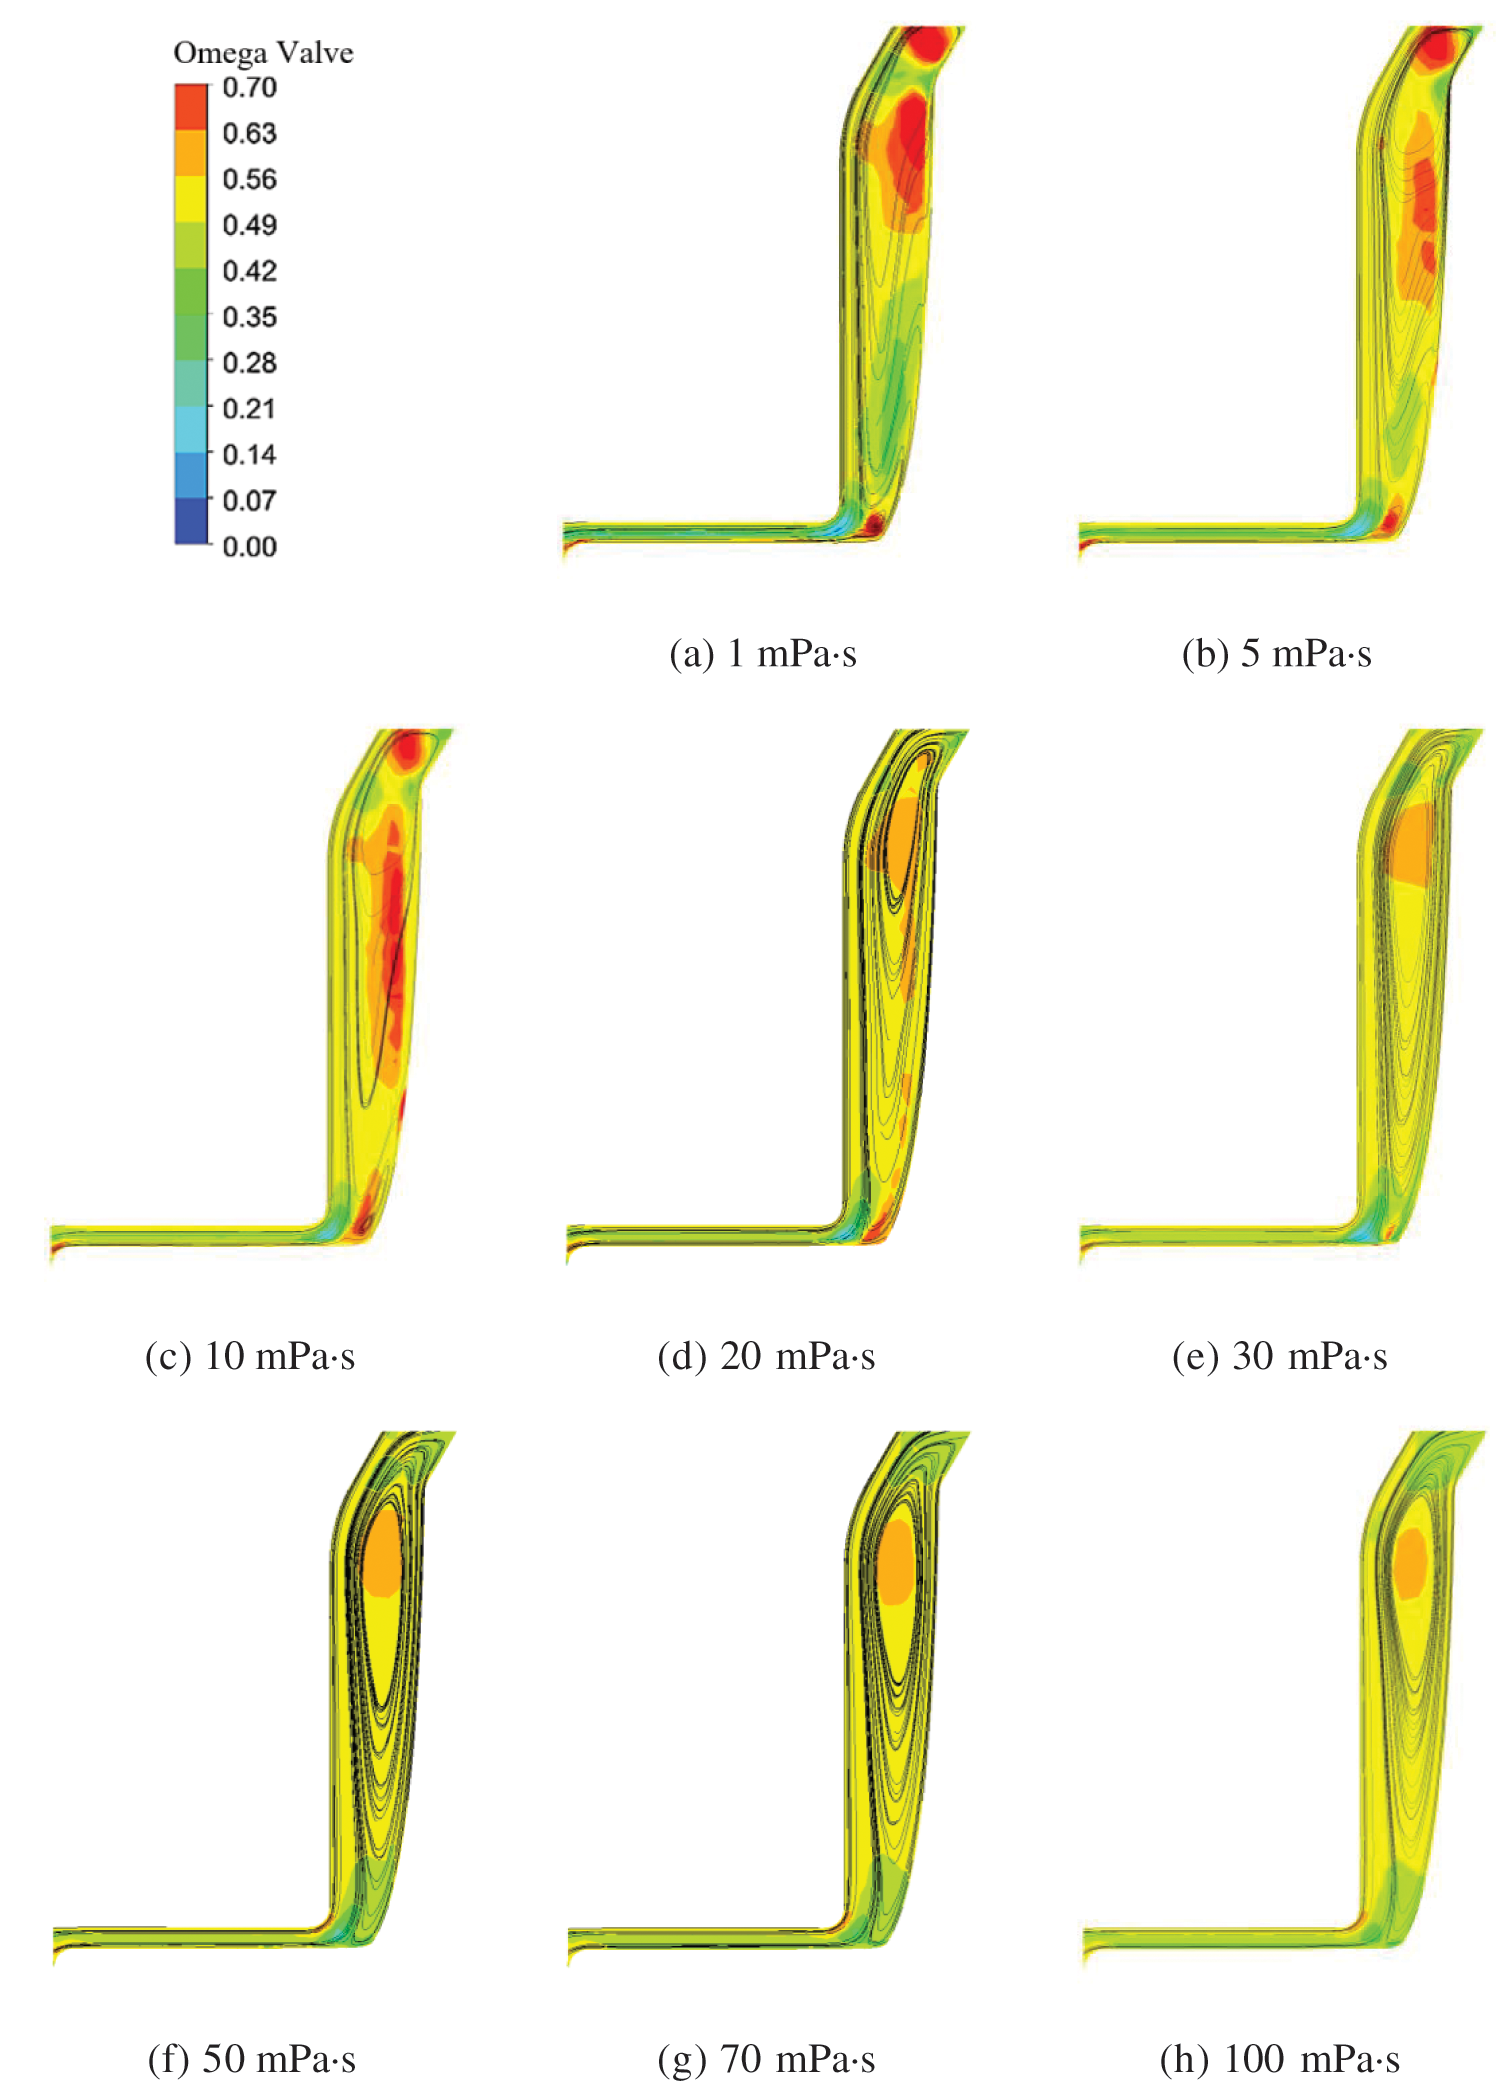
Figure 14: Omega and streamline distribution in the front chamber at various viscosity
Fig. 15 displays Z-direction velocity distribution in wear-ring clearance across 1 to 100 mPa·s viscosities. The boundary layer is distinct, with a 0.5 mm gap. A scale (0–2.5 m/s) quantifies boundary layer thickness. Fig. 16 depicts this thickness profile within the same viscosity range. As viscosity rises, Z-direction boundary layer thickness in wear-ring clearance expands. High viscosity leads to an enlarged low-velocity zone, thickening the boundary layer until it blocks clearance, diminishing leakage and leakage losses.
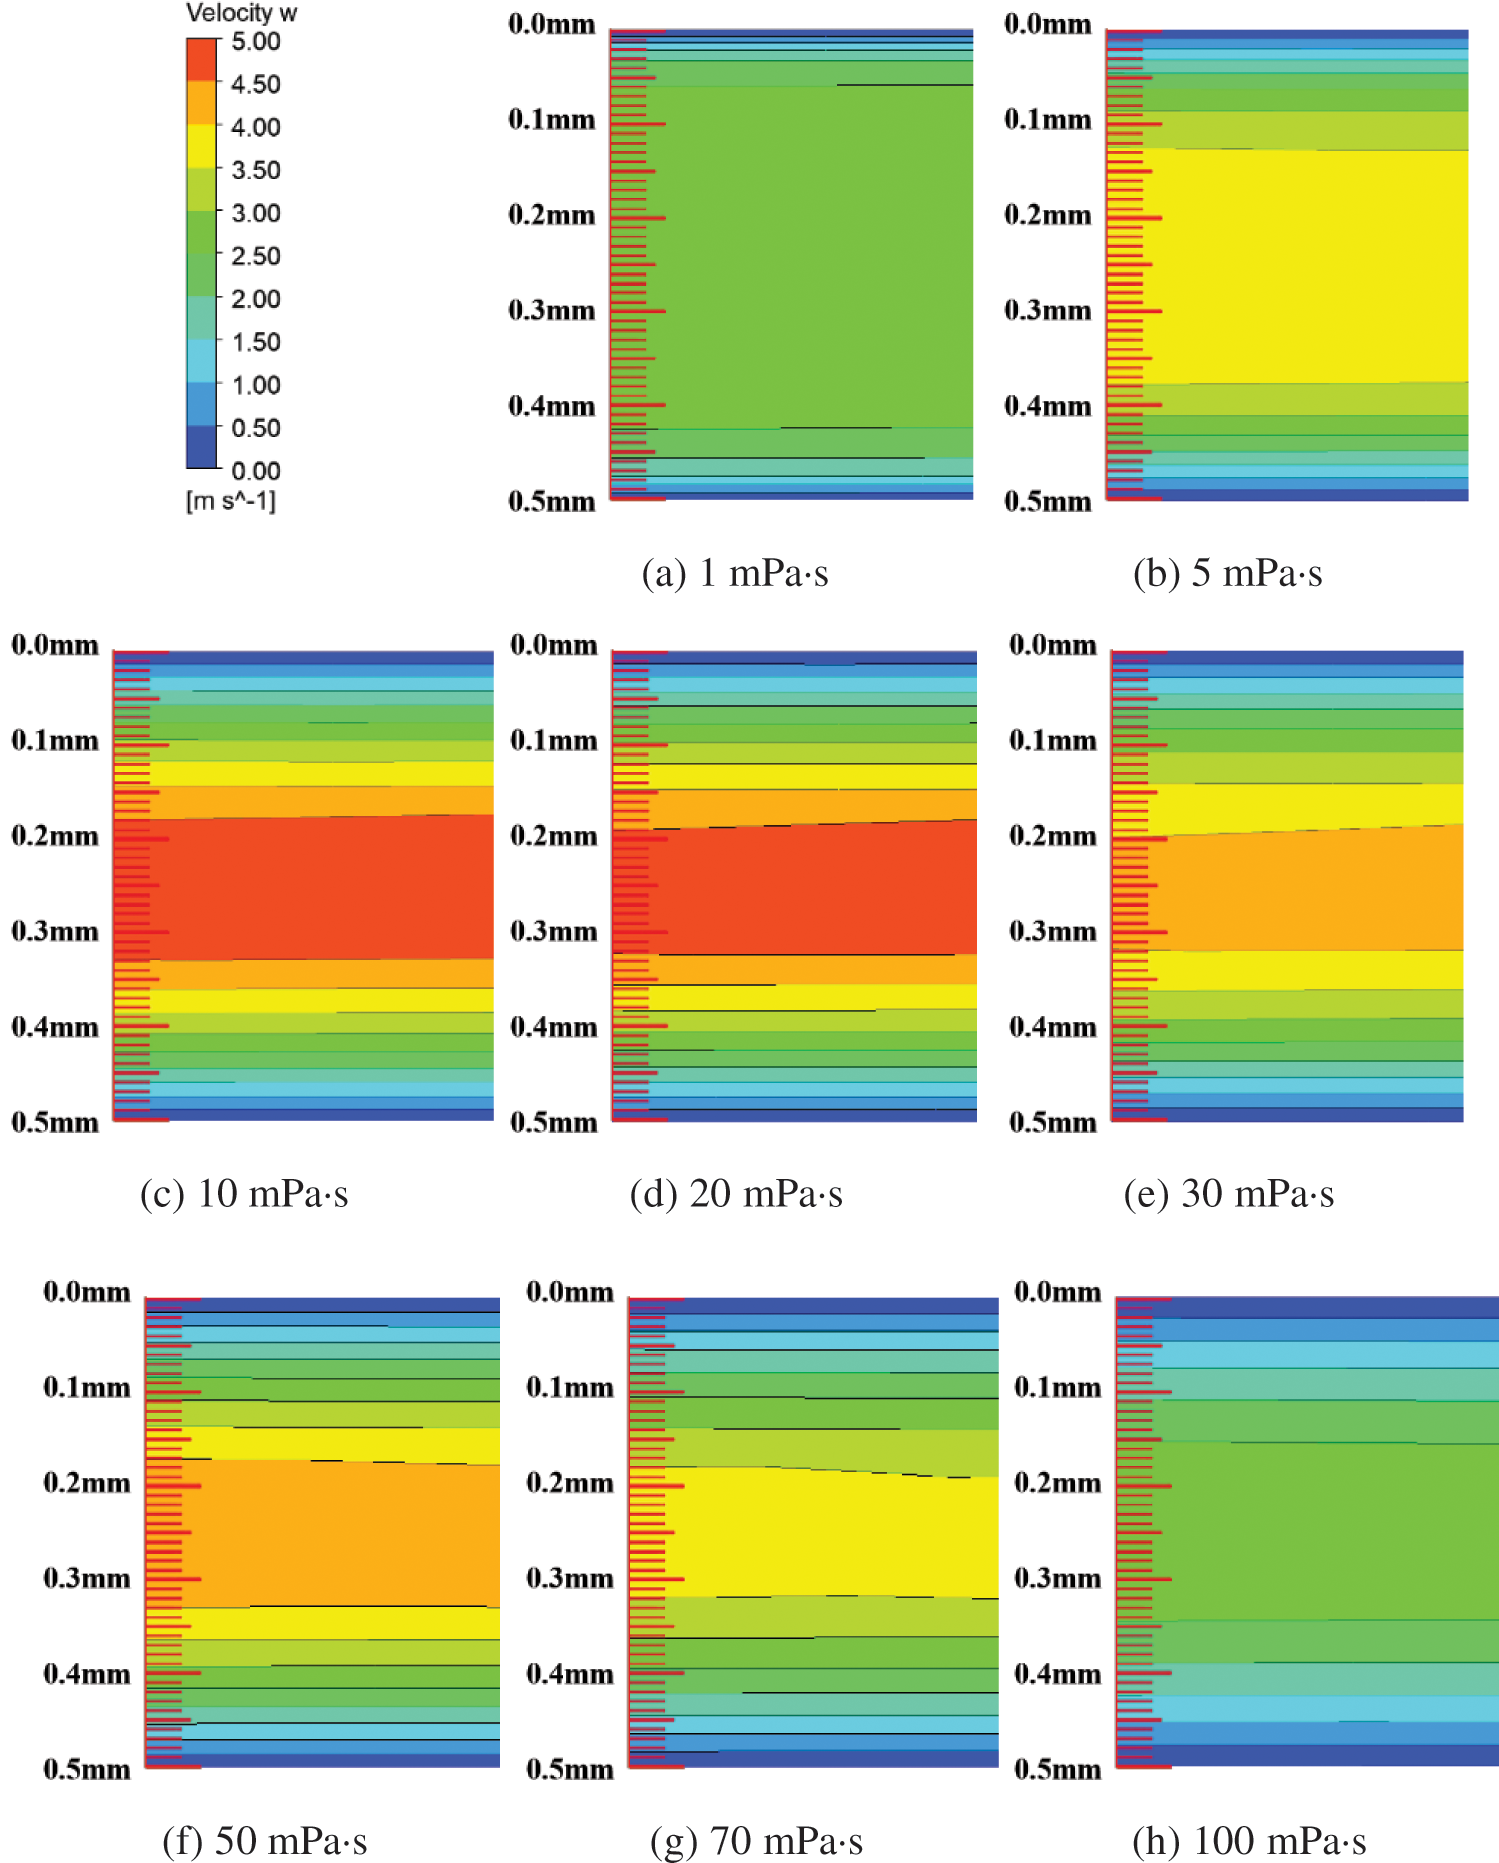
Figure 15: Z-direction velocity distribution at wear-ring clearance at various viscosity
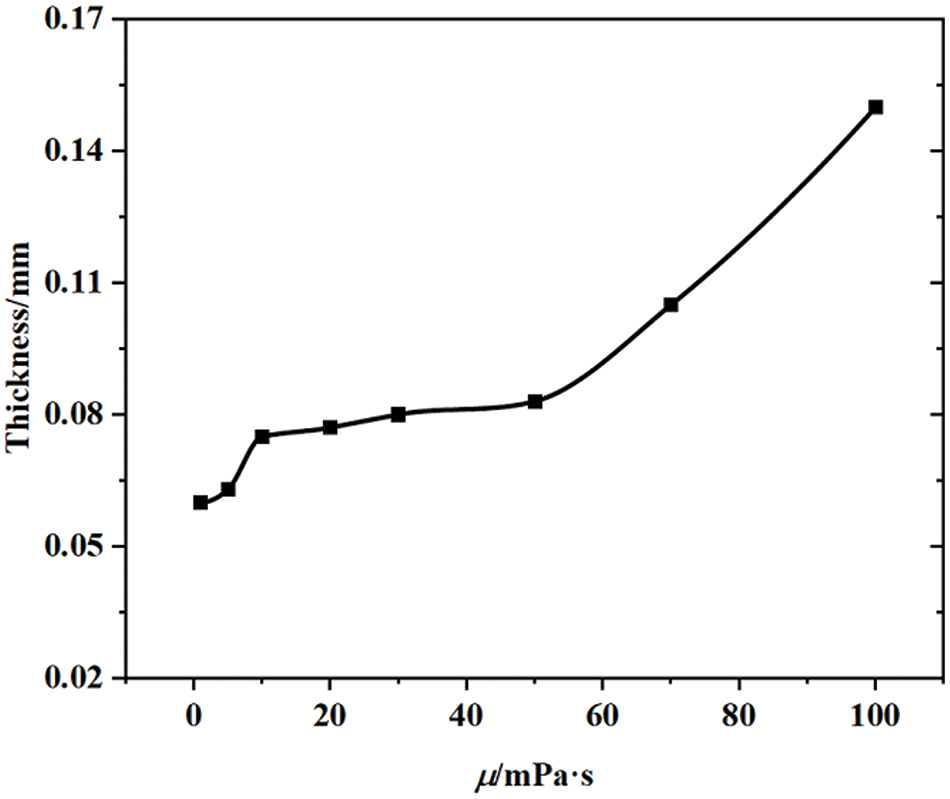
Figure 16: Thickness in the velocity region from 0 to 2.5 m/s at the wear-ring clearance at various viscosity
Accordingly, the root cause of the leakage of wear-ring clearance is the pressure difference between the front chamber and the impeller inlet out, but the main factor that determines the leakage is not the height of the pressure difference. There are two main reasons: in the low viscosity range, the strength of the vortex of the front chamber as well as the range of the dominant factor; in the high viscosity range, with the increase in viscosity, the thickness of the boundary layer of wear-ring clearance gradually becomes thicker, so that the low-speed region becomes more, blocking wear-ring clearance caused by the leakage is reduced.
4.3 Entropy Production Analysis
4.3.1 Analysis of the
Fig. 17 indicates that the maximum error in hydraulic losses computed by both methods across viscosities does not exceed 10%, which is deemed acceptable in engineering. This stems from the intricate nature of high-speed rotating flow fields, where the SST turbulence model lacks precision for such complexities, contributing to elevated errors in flow field parameter estimations.
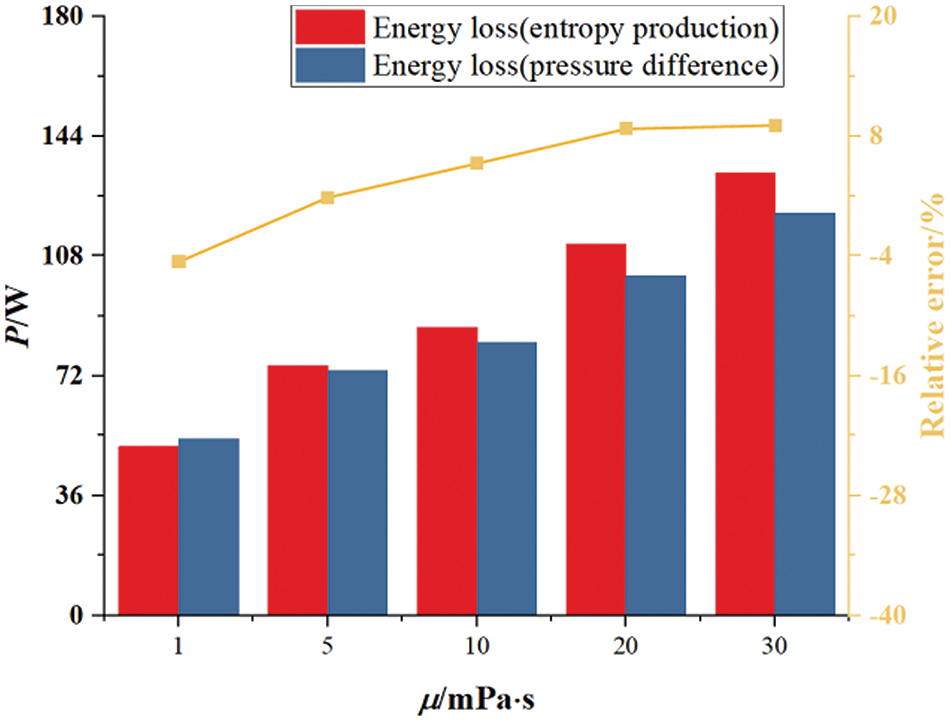
Figure 17: Comparison of energy losses calculated by differential pressure method and entropy production method
Fig. 18 depicts entropy production types in centrifugal pumps across viscosities. Key findings:
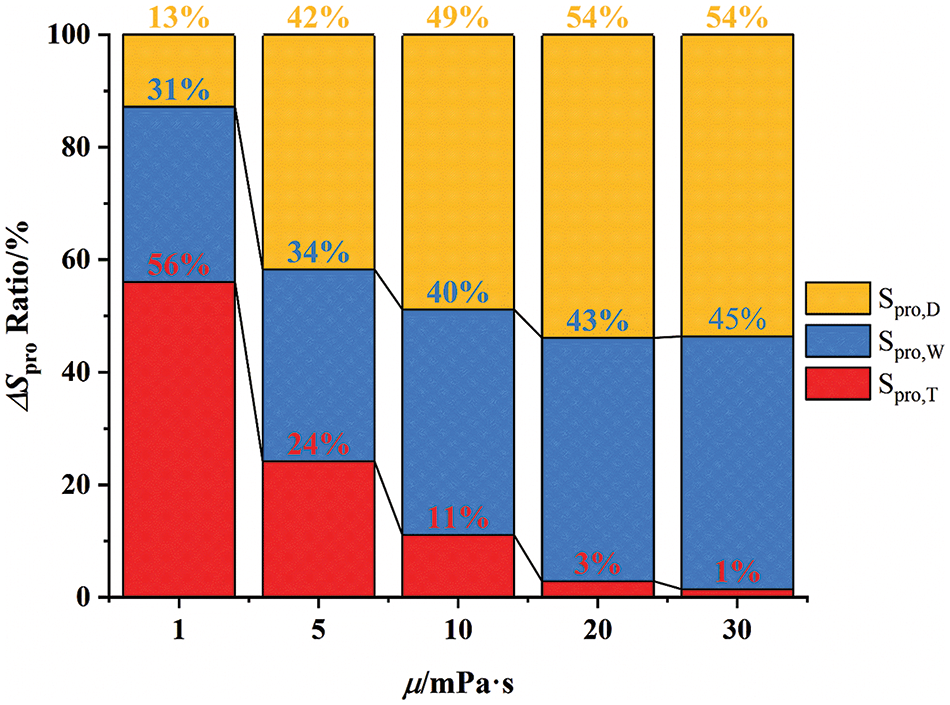
Figure 18: Percentage of entropy production for three types of entropy at various viscosity
Fig. 19 displays entropy production types in a centrifugal pump across viscosities. Key insight: At 1.0 Qd flow, the
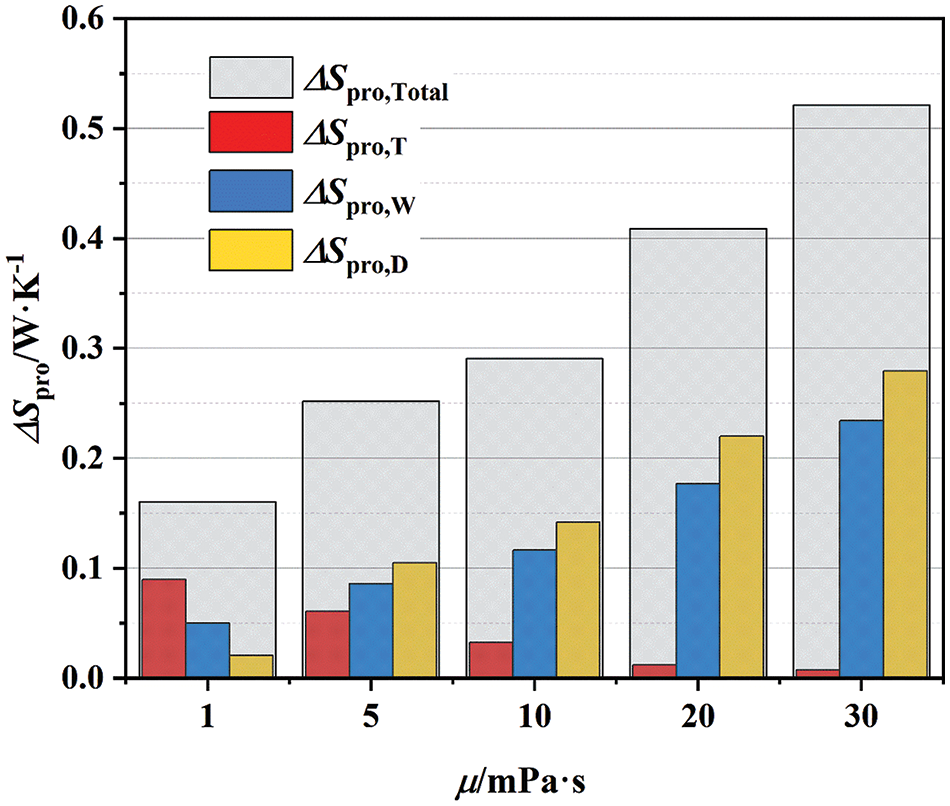
Figure 19: Three types of entropy production at various viscosity
As viscosity increases, the pump’s
Fig. 20 reveals that vortices in the front chamber focus on its inlet and the wear-ring clearance’s entry. The impeller’s vortices concentrate near the blade’s leading edge, suction side between blades, and trailing edge region. Volute vortices gather close to the tongue. As viscosity increases, vortex sizes across these regions diminish.
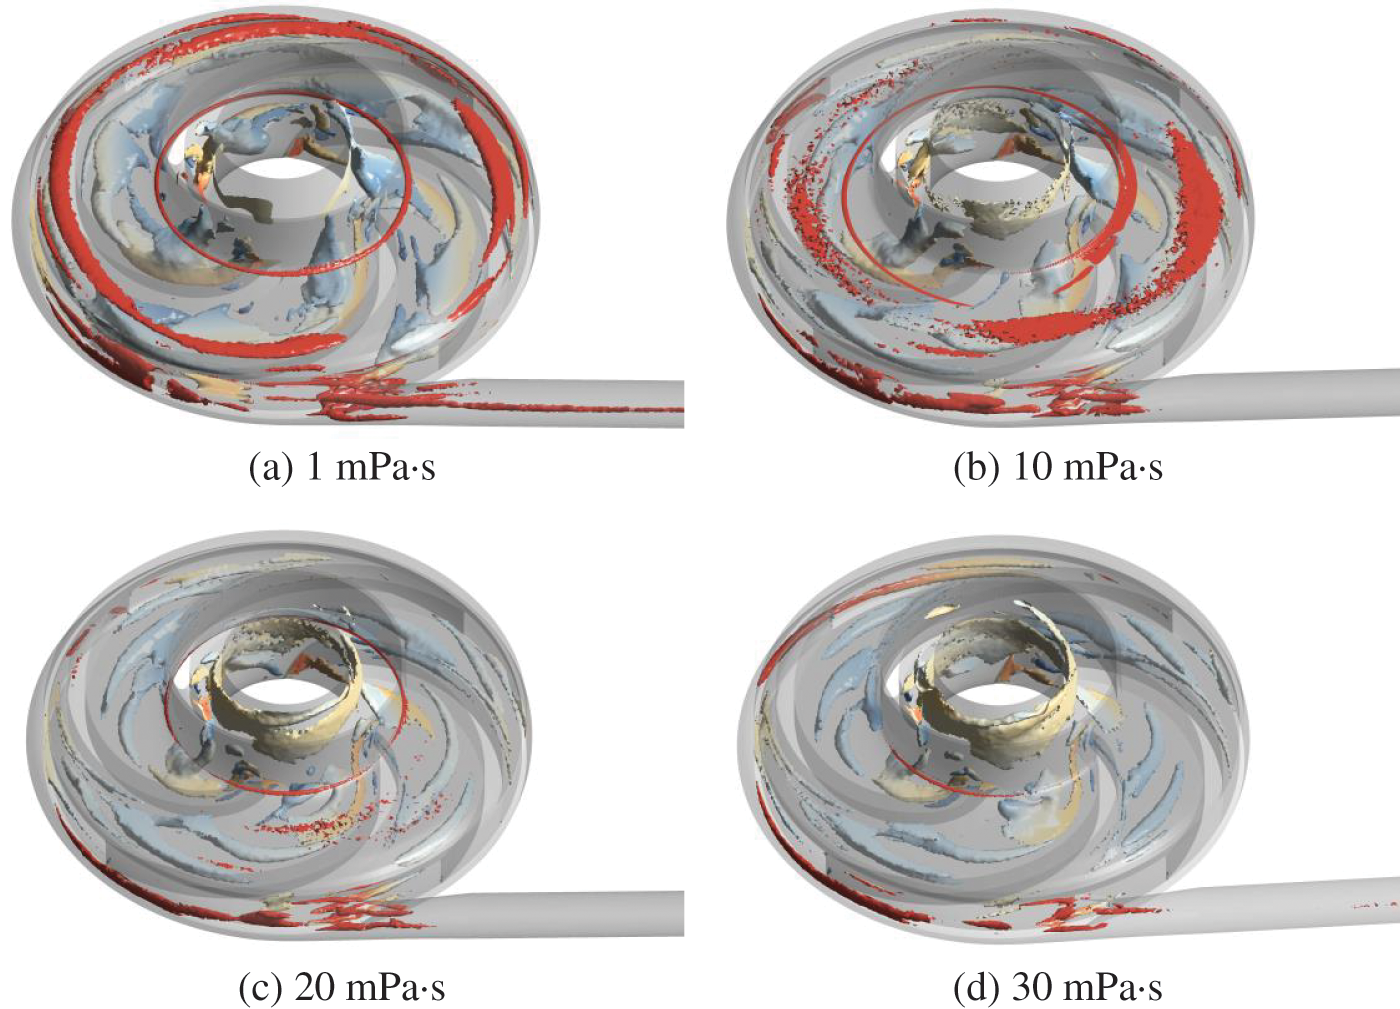
Figure 20: Vortex structures defined by the Omega at various viscosity
4.3.2 Analysis of
From Fig. 21, the percentage of the
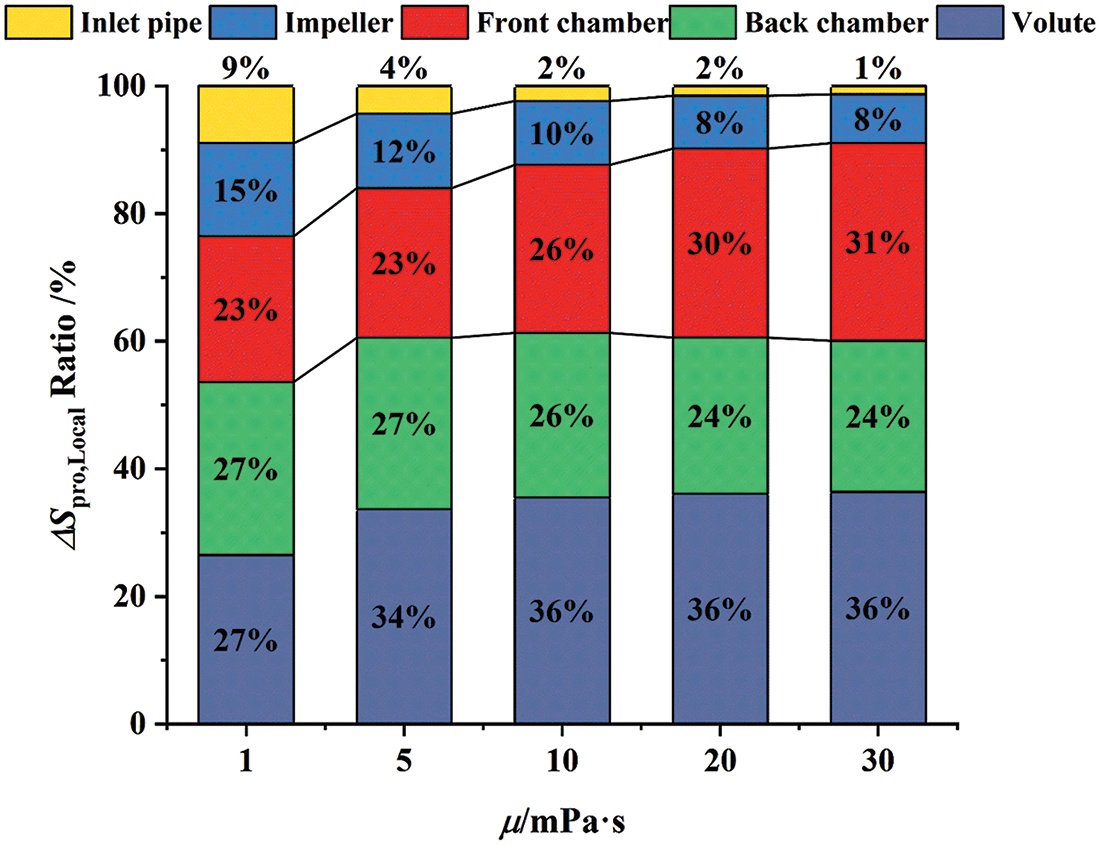
Figure 21: Percentage of the
Fig. 22 shows that the
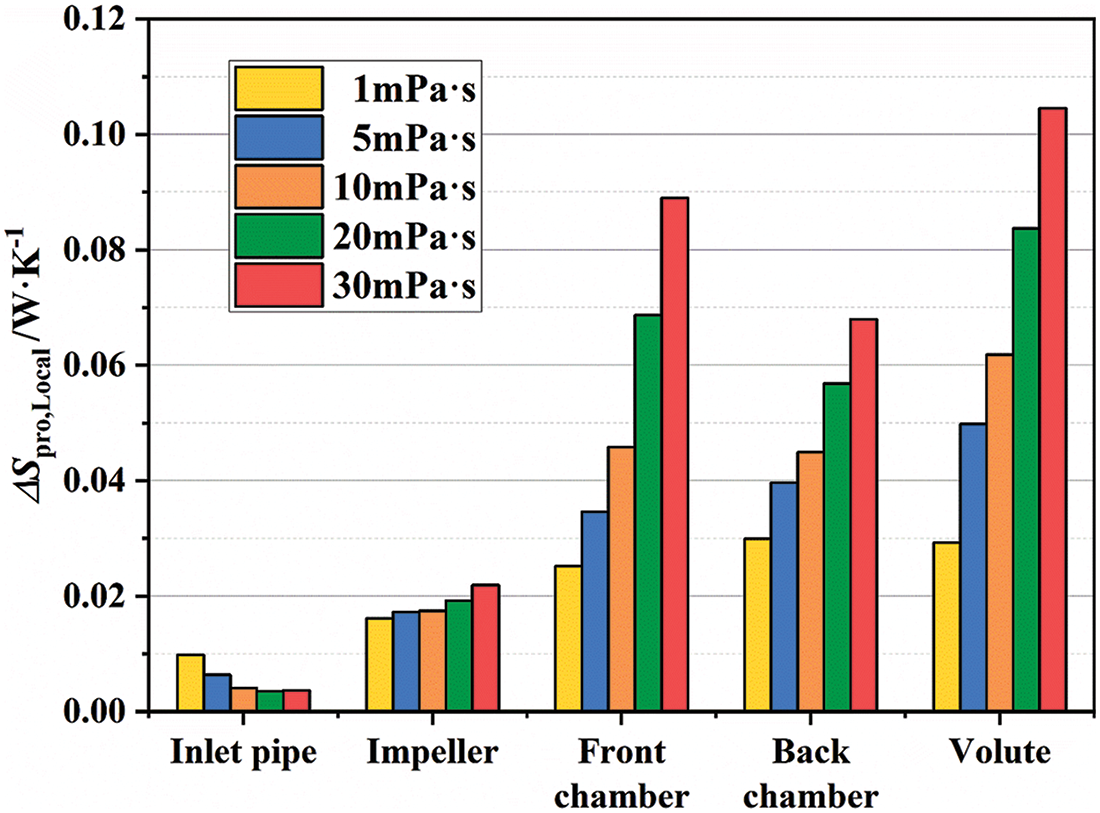
Figure 22: The
The
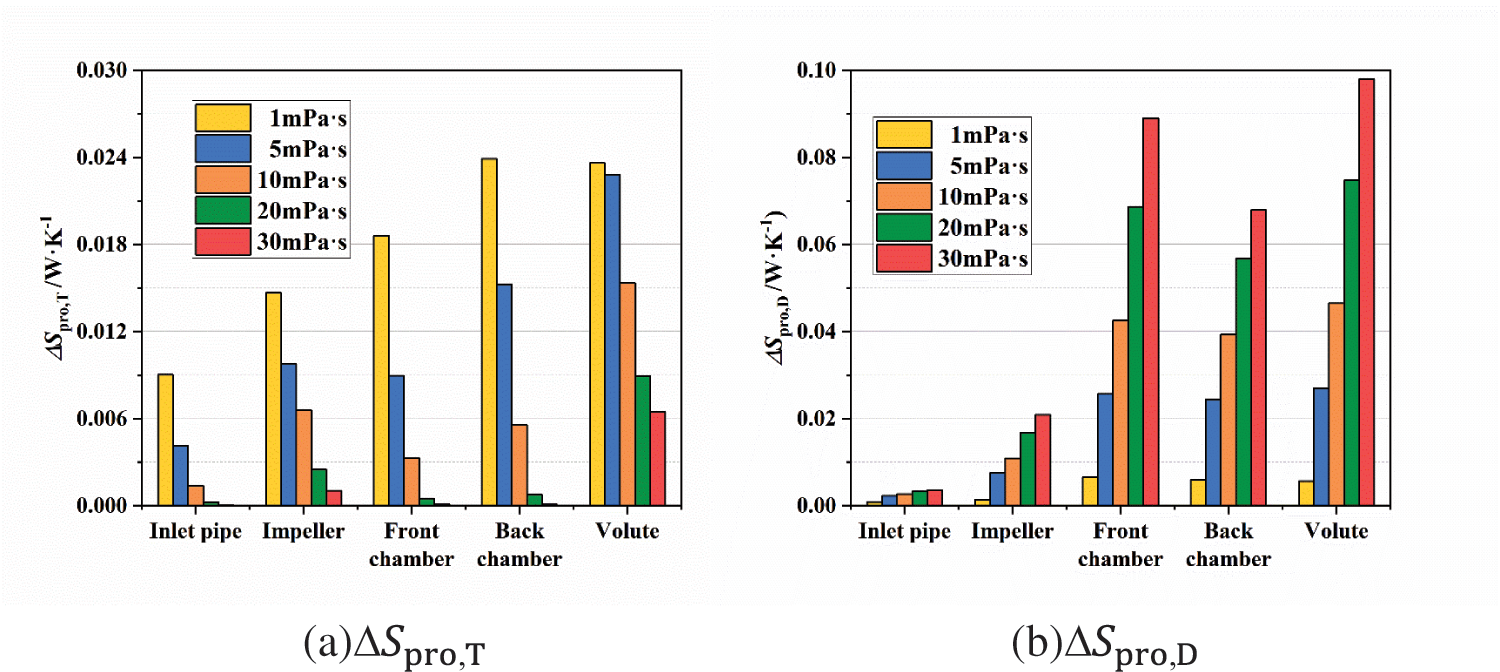
Figure 23: The
This study conducts simulations and experiments on a low specific speed centrifugal pump under various viscosity to investigate changes in its external and energy characteristics. It compares the head and efficiency of the simulations and experiments under various viscosity, with an error margin of less than 5%, to ensure the accuracy of the numerical simulations.
The main conclusions are as follows:
As viscosity increases, the pump head and efficiency decrease due to increased energy loss from friction inside the fluid and on the walls of the flow channel. The high-efficiency zone widens, and the highest efficiency point shifts towards a lower flow rate due to the thickening of the boundary layer and increased internal crowding of the fluid. Greater disc friction loss also leads to higher pump shaft power.
With increasing viscosity, wear-ring clearance leakage initially rises and then falls. This is due to vortex variation in the front chamber and changes in the boundary layer thickness in the wear-ring clearance.
The increase in the
Overall, this study offers an objective insight into the energy characteristics of centrifugal pumps under various viscosities, potentially aiding in the optimization of pump design and enhancing head and energy conversion efficiency for media with different viscosities.
There are some limitations in the study of this paper, the most critical of which are as follows: 1) The vortex changes in the front chamber analyzed qualitatively, it is difficult to intuitively obtain the effect of the vortex in the front chamber on the clearance of the wear-ring. In this regard, quantitative analysis can be used to obtain more in-depth conclusions. 2) The entropy production calculation method in the literature is adopted, and it is not clear whether the viscosity will have an effect on the entropy production calculation, and the source of the error between the entropy production method and the differential pressure method is not clear. These aspects will be addressed in future works.
Acknowledgement: None.
Funding Statement: This work was supported by the National Natural Science Foundation of China (Grant Nos. 52079058 and 52209113), the Natural Science Foundation of Jiangsu Province (Grant Nos. BK20230011 and BK20220544), China Postdoctoral Science Foundation (Grant No. 2023M731367), and Postgraduate Research & Practice Innovation Program of Jiangsu Province (Grant No. KYCX23_3698).
Author Contributions: The authors confirm their contribution to the paper as follows: Zhenjiang Zhao: Conceptualization; Data curation; Writing—original draft: Software; Writing—review & editing; Formal analysis. Lei Jiang: Software; Visualization; Formal analysis. Ling Bai: Software; Visualization. Bo Pan: Investigation; Writing—review & editing. Ling Zhou: Visualization; Investigation; Software. All authors reviewed the results and approved the final version of the manuscript.
Availability of Data and Materials: The data presented in this article are available upon request from the corresponding author.
Ethics Approval: Not applicable.
Conflicts of Interest: The authors declare that they have no conflicts of interest to report regarding the present study.
References
1. Gülich J. Pumping highly viscous fluids with centrifugal pumps—part 1. World Pumps. 1999;1999(395):30–4. [Google Scholar]
2. Stoffel B. Tests on centrifugal pumps for handling viscous liquids. Institute of Chemical Engineers; 1980. vol. 3, p. 153–9. [Google Scholar]
3. Zhou L, Hang J, Bai L, Krzemianowski Z, El-Emam M, Yasser E, et al. Application of entropy production theory for energy losses and other investigation in pumps and turbines: a review. Appl Energy. 2022 Jul;318:119211. [Google Scholar]
4. Li W. Influence of the number of impeller blades on the performance of centrifugal oil pumps. World Pumps. 2002;427:32–5. [Google Scholar]
5. Amaral G, Estevam V, Franca F. On the influence of viscosity on ESP performance. SPE Prod Oper. 2009;24(2):303–11. [Google Scholar]
6. Buratto C, Pinelli M, Spina P, Vaccari A, Verga C. CFD study on special duty centrifugal pumps operating with viscous and non-Newtonian fluids. In: Proceedings of 11th European Conference on Turbomachinery Fluid dynamics & Thermodynamics, 2015 Mar 23–26; Madrid, Spain. [Google Scholar]
7. Fadlalla D, Rosettani J, Holagh S, Ahmed W. Airlift pumps characteristics for shear-thinning non-Newtonian fluids: an experimental investigation on liquid viscosity impact. Exp Therm Fluid Sci. 2023;149:110994. doi:10.1016/j.expthermflusci.2023.110994. [Google Scholar] [CrossRef]
8. Li X, Zheng S, Shao Z, Xu M, Li Y, Huang Q, et al. Research on the flow characteristics of power-law fluids in self-priming sewage pumps. Water. 2024 Jun;16(11):1526. [Google Scholar]
9. Wu ZP, Mou J, Wu D, Zheng S, Gu Y. Effect of reflux hole on the transient flow characteristics of the self-priming sewage centrifugal pump. J Appl Fluid Mech. 2019 May;12(3):689–99. [Google Scholar]
10. Zhu ZD, Ren Y, Gu Y, Zhou P. Influence of blade profile on energy loss of sewage self-priming pump. J Braz Soc Mech Sci. 2019 Oct;41(10):1–14. [Google Scholar]
11. Li WG. Effects of viscosity of fluids on centrifugal pump performance and flow pattern in the impeller. Int J Heat Fluid Flow. 2000 Apr;21(2):207–12. doi:10.1016/S0142-727X(99)00078-8. [Google Scholar] [CrossRef]
12. Jia X, Chu Q, Zhu Z, Ding Q, Gao P. Influence of fluid food viscosity on internal flow characteristics of conveying pump. Front Nutr. 2022 Jun 9;9:910589. doi:10.3389/fnut.2022.910589. [Google Scholar] [PubMed] [CrossRef]
13. Li W, Zhang Y. The vortex pump under highly viscous liquid flow conditions. Arab J Sci Eng. 2018 Sep;43(9):4739–61. doi:10.1007/s13369-018-3112-7. [Google Scholar] [CrossRef]
14. Shao C, Zhou J, Cheng W. Experimental and numerical study of external performance and internal flow of a molten salt pump that transports fluids with different viscosities. Int J Heat Mass Tran. 2015 Oct;89:627–40. doi:10.1016/j.ijheatmasstransfer.2015.05.087. [Google Scholar] [CrossRef]
15. Li W. Effects of viscosity on turbine mode performance and flow of a low specific speed centrifugal pump. Appl Math Model. 2016 Jan;40(2):904–26. doi:10.1016/j.apm.2015.06.015. [Google Scholar] [CrossRef]
16. Li W. Mechanism for onset of sudden-rising head effect in centrifugal pump when handling viscous oils. J Fluids Eng. 2014 Jul 1;136(7):74501. doi:10.1115/1.4026882. [Google Scholar] [CrossRef]
17. Yousefi H, Noorollahi Y, Tahani M, Fahimi R, Saremian S. Numerical simulation for obtaining optimal impeller’s blade parameters of a centrifugal pump for high-viscosity fluid pumping. Sustain Energy Tech. 2019 Aug;34:16–26. [Google Scholar]
18. Shojaeefard M, Tahani M, Ehghaghi M, Fallah H, Beglari M. Numerical study of the effects of some geometric characteristics of a centrifugal pump impeller that pumps a viscous fluid. Comput Fluids. 2012 Jul;64:157. [Google Scholar]
19. Zhu J, Banjar H, Xia Z, Zhang H. CFD simulation and experimental study of oil viscosity effect on multi-stage electrical submersible pump (ESP) performance. J Petrol Sci Eng. 2016 Oct;146:735–45. [Google Scholar]
20. Kock F, Herwig H. Local entropy production in turbulent shear flows: a high-Reynolds number model with wall functions. Int J Heat Mass Tran. 2004;47(10–11):2205–15. [Google Scholar]
21. Ji L, Li W, Shi W, Chang H, Yang Z. Energy characteristics of mixed-flow pump under different tip clearances based on entropy production analysis. Energy. 2020;199:117447. [Google Scholar]
22. Kan K, Li H, Chen H, Xu H, Gong Y, Li T, et al. Effects of clearance and operating conditions on tip leakage vortex-induced energy loss in an axial-flow pump using entropy production method. J Fluids Eng. 2023 Mar 1;145(3):31201. doi:10.1115/1.4056119. [Google Scholar] [CrossRef]
23. Gong Y, Liu Y, Peng C. Hydraulic loss analysis of turbodrill blade cascades based on entropy production theory. Geoenergy Sci Eng. 2024 Oct;241(4):213093. doi:10.1016/j.geoen.2024.213093. [Google Scholar] [CrossRef]
24. Yang Y, Zhou L, Shi W, He Z, Han Y, Xiao Y. Interstage difference of pressure pulsation in a three-stage electrical submersible pump. J Petrol Sci Eng. 2021 Jan;196(4):107653. doi:10.1016/j.petrol.2020.107653. [Google Scholar] [CrossRef]
25. Zhang Y, Zhang J, Lin X, Wang R, Zhang C, Zhao J. Experimental investigation into downstream field of a horizontal axis tidal stream turbine supported by a mono pile. Appl Ocean Res. 2020 Aug 1;101:102257. doi:10.1016/j.apor.2020.102257. [Google Scholar] [CrossRef]
26. Speziale C, Abid R, Anderson E. Critical evaluation of two-equation models for near-wall turbulence. AIAA J. 1992 Feb 1;30(2):324–31. [Google Scholar]
27. Ghasemi E, McEligot D, Nolan K, Crepeau J, Tokuhiro A, Budwig RS. Entropy generation in a transitional boundary layer region under the influence of freestream turbulence using transitional RANS models and DNS. Int Commun Heat Mass. 2013 Feb 1;41(6):10–6. doi:10.1016/j.icheatmasstransfer.2012.11.005. [Google Scholar] [CrossRef]
28. Monte W, Biazussi J, Sassim N, Bannwart A. Experimental study of gas-liquid two-phase flow patterns within centrifugal pumps impellers. Exp Therm Fluid Sci. 2017 Jul 1;85(110):37–51. doi:10.1016/j.expthermflusci.2017.02.019. [Google Scholar] [CrossRef]
29. Liu C, Wang Y, Yang Y, Duan Z. New omega vortex identification method. Sci China Phys Mech. 2016;59(8):1–9. doi:10.1007/s11433-016-0022-6. [Google Scholar] [CrossRef]
30. Wen H, Yao Z, Zhong Q, Tian Y, Sun Y, Wang F. Energy partitioning in laser-induced millimeter-sized spherical cavitation up to the fourth oscillation. Ultrason Sonochem. 2023 May;95:106391. doi:10.1016/j.ultsonch.2023.106391. [Google Scholar] [PubMed] [CrossRef]
Cite This Article
 Copyright © 2024 The Author(s). Published by Tech Science Press.
This work is licensed under a Creative Commons Attribution 4.0 International License , which permits unrestricted use, distribution, and reproduction in any medium, provided the original work is properly cited.
 Downloads
 Citation Tools