
 Submit a Paper
 Propose a Special lssue
 Open Access
ARTICLE
Robust Particle Swarm Optimization Algorithm for Modeling the Effect of Oxides Thermal Properties on AMIG 304L Stainless Steel Welds
1 Department of Mechanical Engineering, College of Engineering in Al-Kharj, Prince Sattam bin Abdulaziz University, P.O. Box 655, Al-Kharj, 16273, Saudi Arabia
2 Department of Computer and Network Engineering, College of Computer Science and Engineering, University of Jeddah, Jeddah, 21959, Saudi Arabia
3 Laboratory of Mechanics of Sousse (LMS), National Engineering School of Sousse, University of Sousse, Sousse, 4054, Tunisia
4 Center of Excellence for Research in Engineering Materials (CEREM), King Saud University, P.O. Box 800, Al-Riyadh, 11421, Saudi Arabia
5 Department of Metallurgical and Materials Engineering, Faculty of Petroleum and Mining Engineering, Suez University, Suez, 43512, Egypt
* Corresponding Author: Rachid Djoudjou. Email:
(This article belongs to the Special Issue: Swarm and Metaheuristic Optimization for Applied Engineering Application)
Computer Modeling in Engineering & Sciences 2024, 141(2), 1809-1825. https://doi.org/10.32604/cmes.2024.053621
Received 06 May 2024; Accepted 12 August 2024; Issue published 27 September 2024
 View Full Text
 Download PDF
Abstract
There are several advantages to the MIG (Metal Inert Gas) process, which explains its increased use in various welding sectors, such as automotive, marine, and construction. A variant of the MIG process, where the same equipment is employed except for the deposition of a thin layer of flux before the welding operation, is the AMIG (Activated Metal Inert Gas) technique. This study focuses on investigating the impact of physical properties of individual metallic oxide fluxes for 304L stainless steel welding joint morphology and to what extent it can help determine a relationship among weld depth penetration, the aspect ratio, and the input physical properties of the oxides. Five types of oxides, TiO2, SiO2, Fe2O3, Cr2O3, and Mn2O3, are tested on butt joint design without preparation of the edges. A robust algorithm based on the particle swarm optimization (PSO) technique is applied to optimally tune the models’ parameters, such as the quadratic error between the actual outputs (depth and aspect ratio), and the error estimated by the models’ outputs is minimized. The results showed that the proposed PSO model is first and foremost robust against uncertainties in measurement devices and modeling errors, and second, that it is capable of accurately representing and quantifying the weld depth penetration and the weld aspect ratio to the oxides’ thermal properties.Keywords
Welding is the primary spread fabrication method to join parts. Fusion welding is used in several emerging applications, such as power generation and the chemical, petrochemical, nuclear, aerospace, and transportation industries. In addition, a modern and environment-friendly solid-state joining process is employed to join a relatively lighter family of materials [1,2]. Material selection and the development of joining techniques are continuously progressing to provide solutions to industries.
Metal inert gas welding (MIG) is a process in which a consumable wire electrode is fed into a weld pool at an adjustable rate while a continuous protective inert gas flows out around the wire and shields the weld from contamination by the atmosphere. The main advantages of MIG welding can be summarized as the continuous wire feed, eliminating the need to change electrodes and the fast travel speed at which MIG welding can be done. There is a smaller heat-affected zone where MIG welding joints can be performed faster.
Nowadays, stainless steel is widespread in many industry fields. More than 10% of chromium steel becomes stainless steel. The main alloying elements of this class are 0.015%–0.25% C, 16%–26% Cr, 6%–25% Ni, 0%–4% Mo, and 2% Mn. Austenitic stainless steels (2xx and 3xx series) constitute most of the stainless steel usage. Adding nickel, a strong austenite stabilizer, overcomes the ferrite-stabilizing effect of chromium, and all of these steels have the FCC structure [3]. The structure contains a few percent ferrites; hence, good resistance to intergranular corrosion for low carbon embrittlement can occur after long exposures between 550°C and 900°C due to the decomposition of the ferrite to sigma phase [4]. Different applications cover several areas, such as food and kitchen uses, catering, and hospital equipment. They are also used for chemical industries and household items, especially kitchen appliances and fixtures.
Metal Inert Gas weld process modeling is often formulated as an optimization problem. However, this problem can present many irregularities, such as the non-trivial analytic solutions and the high probability of local solutions, causing the risk of missing global solutions due to non-convex objective functions to be minimized. To overcome the above problems, researchers and welders have resorted to many methods that can be optimized to obtain optimal parameters to achieve the target outcomes. Many works have been dedicated to optimizing the welding parameters to improve the weld morphology [5–7]. In addition, other studies have been conducted to predict the mechanical properties as output parameters for given input parameters such as gas rate, current, and speed in the MIG welding process [8–10]. Shah et al. [11] developed an Artificial Neural Network (ANN) model, which was reported to provide accurate results. The comparison between predicted mechanical properties and actual values showed minor variations in results. The work presented the effect of welding parameters such as welding current, welding voltage, gas flow rate, wire feed rate, and others on weld strength, ultimate tensile strength, and hardness of weld joint using the design of experiments method. For this purpose, a prediction model was also developed using ANN. Based on the experimental results, the ANN model was established to predict the ultimate tensile strength and hardness of welding. The particle swarm optimization (PSO) method was also employed to minimize the angular distortion in 202-grade stainless steel gas tungsten arc-welded plates [12]. The optimal process parameters achieve a value of 0.0305° for angular distortion, demonstrating the relevance of the PSO model developed. Other studies were dedicated to improving the hardness of welds using the Taguchi Method [13].
Much work has been performed to keep pace with the developments and needs of modern industry. Accordingly, numerous technological modifications and advancements have been suggested and integrated into available welding techniques. MIG welding is one such type, which primarily falls under the domain of arc welding. AMIG welding is a variant of the MIG welding process. The same equipment shall be used in the AMIG process as in the MIG process, except that a thin layer of flux shall be deposited on the edges of the parts to be assembled during the preliminary welding. Flux can be a single component [14], a binary component [15], a ternary component [16], and even more than three components [17]. The advantages of AMIG welding are its low energy consumption and low cost since 8 mm thickness can be achieved in a single pass [18,19]. The literature shows that the primary mechanism leading to the increase in the penetration of the depth of the weld bead is related to the inverse Marangoni effect [20]. Active fluxes have been tested to improve the form factor of a weld bead. The effects of three different active fluxes on the form factor of the MIG welded stainless steel 202 have been studied. Three different flux materials (ammonium ferro-sulfate, sodium bicarbonate, and ammonium carbonate) have been applied to three plates, and the weld bead geometry has been analyzed. The results reflected that the activated flux material significantly impacts the depth of penetration, the bead width, and the weld quality [21,22]. Many studies highlighted the beneficial effect of oxides in the AMIG welding technique, but to the best of the authors’ knowledge, no work has been conducted to indicate the role of oxides’ thermal properties on the AMIG weld morphology.
Metaheuristics (as alternatives to classical techniques) were extensively used in many fields, including welding process optimization, to find optimal solutions to modeling problems that are usually challenging to solve using classical techniques [23–25]. The main advantage of metaheuristics is their effectiveness and pertinence, simple coding schemes, and relatively easy implementation. Metaheuristics is also applied to design and develop pearlitic steels for application in heavy-haul rails. Qiao et al. [26] reported that hardness is a critical point in studying the mechanical and tribological properties, which are theoretically related to the alloying composition of steel. With the aid of the machine learning (ML) method, the PSO-improved generalized regression neural network (GRNN) is utilized to model the relationship between the composition and hardness of pearlitic steel. Metaheuristics is the multidisciplinary tool employed again to develop the PSO-SVR(Support Vector Regression) model to optimize the hot deformation behavior of Fe2Ni2CrAl1.2 multi-principle element alloys (MPEAs) [27].
The main aim of this study is to use a robust PSO algorithm to optimally tune the parameters of the model, which relates the oxides’ thermal properties to the MIG weld morphology. Considering many constraints, the achieved results can be adopted as preliminary tools for investigators and industries to select oxides based on the type of materials to be welded. This study aims to investigate the effect of the selected physical properties of five oxides on AMIG morphology. The developed model is tested for its robustness against modeling uncertainties, measurement device errors, and human errors that can occur during experimentation. The obtained model offers consistent values through a robustness check even if the welding parameters coefficients provided by the PSO algorithm are perturbed.
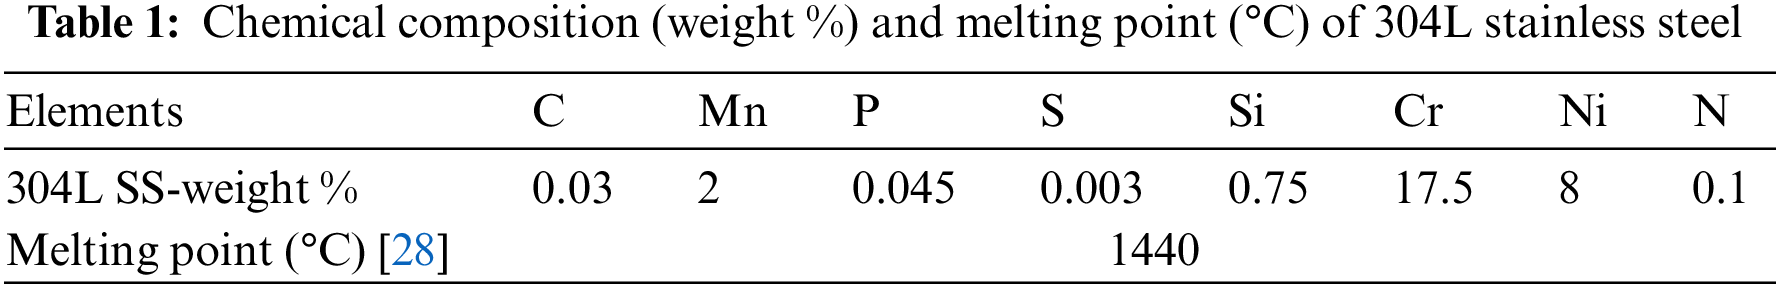
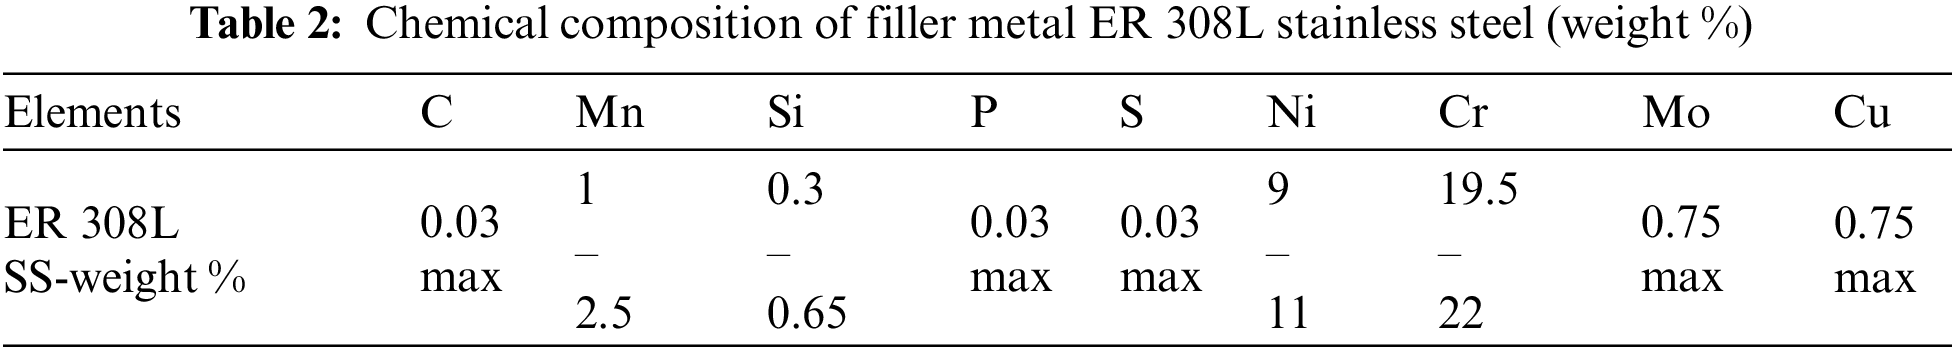
Table 1 depicts the chemical composition and the melting point of stainless steel-grade 304L. Table 2 shows the chemical composition of filler metal ER 308L stainless steel.
The welding machine employed is the MIG from ESAB manufacturer with a motorized carriage that allows automatic welding to be approached to ensure that the weld is performed at the constant speed and length of arc welding, as shown in Fig. 1. The shielding gas used is argon.
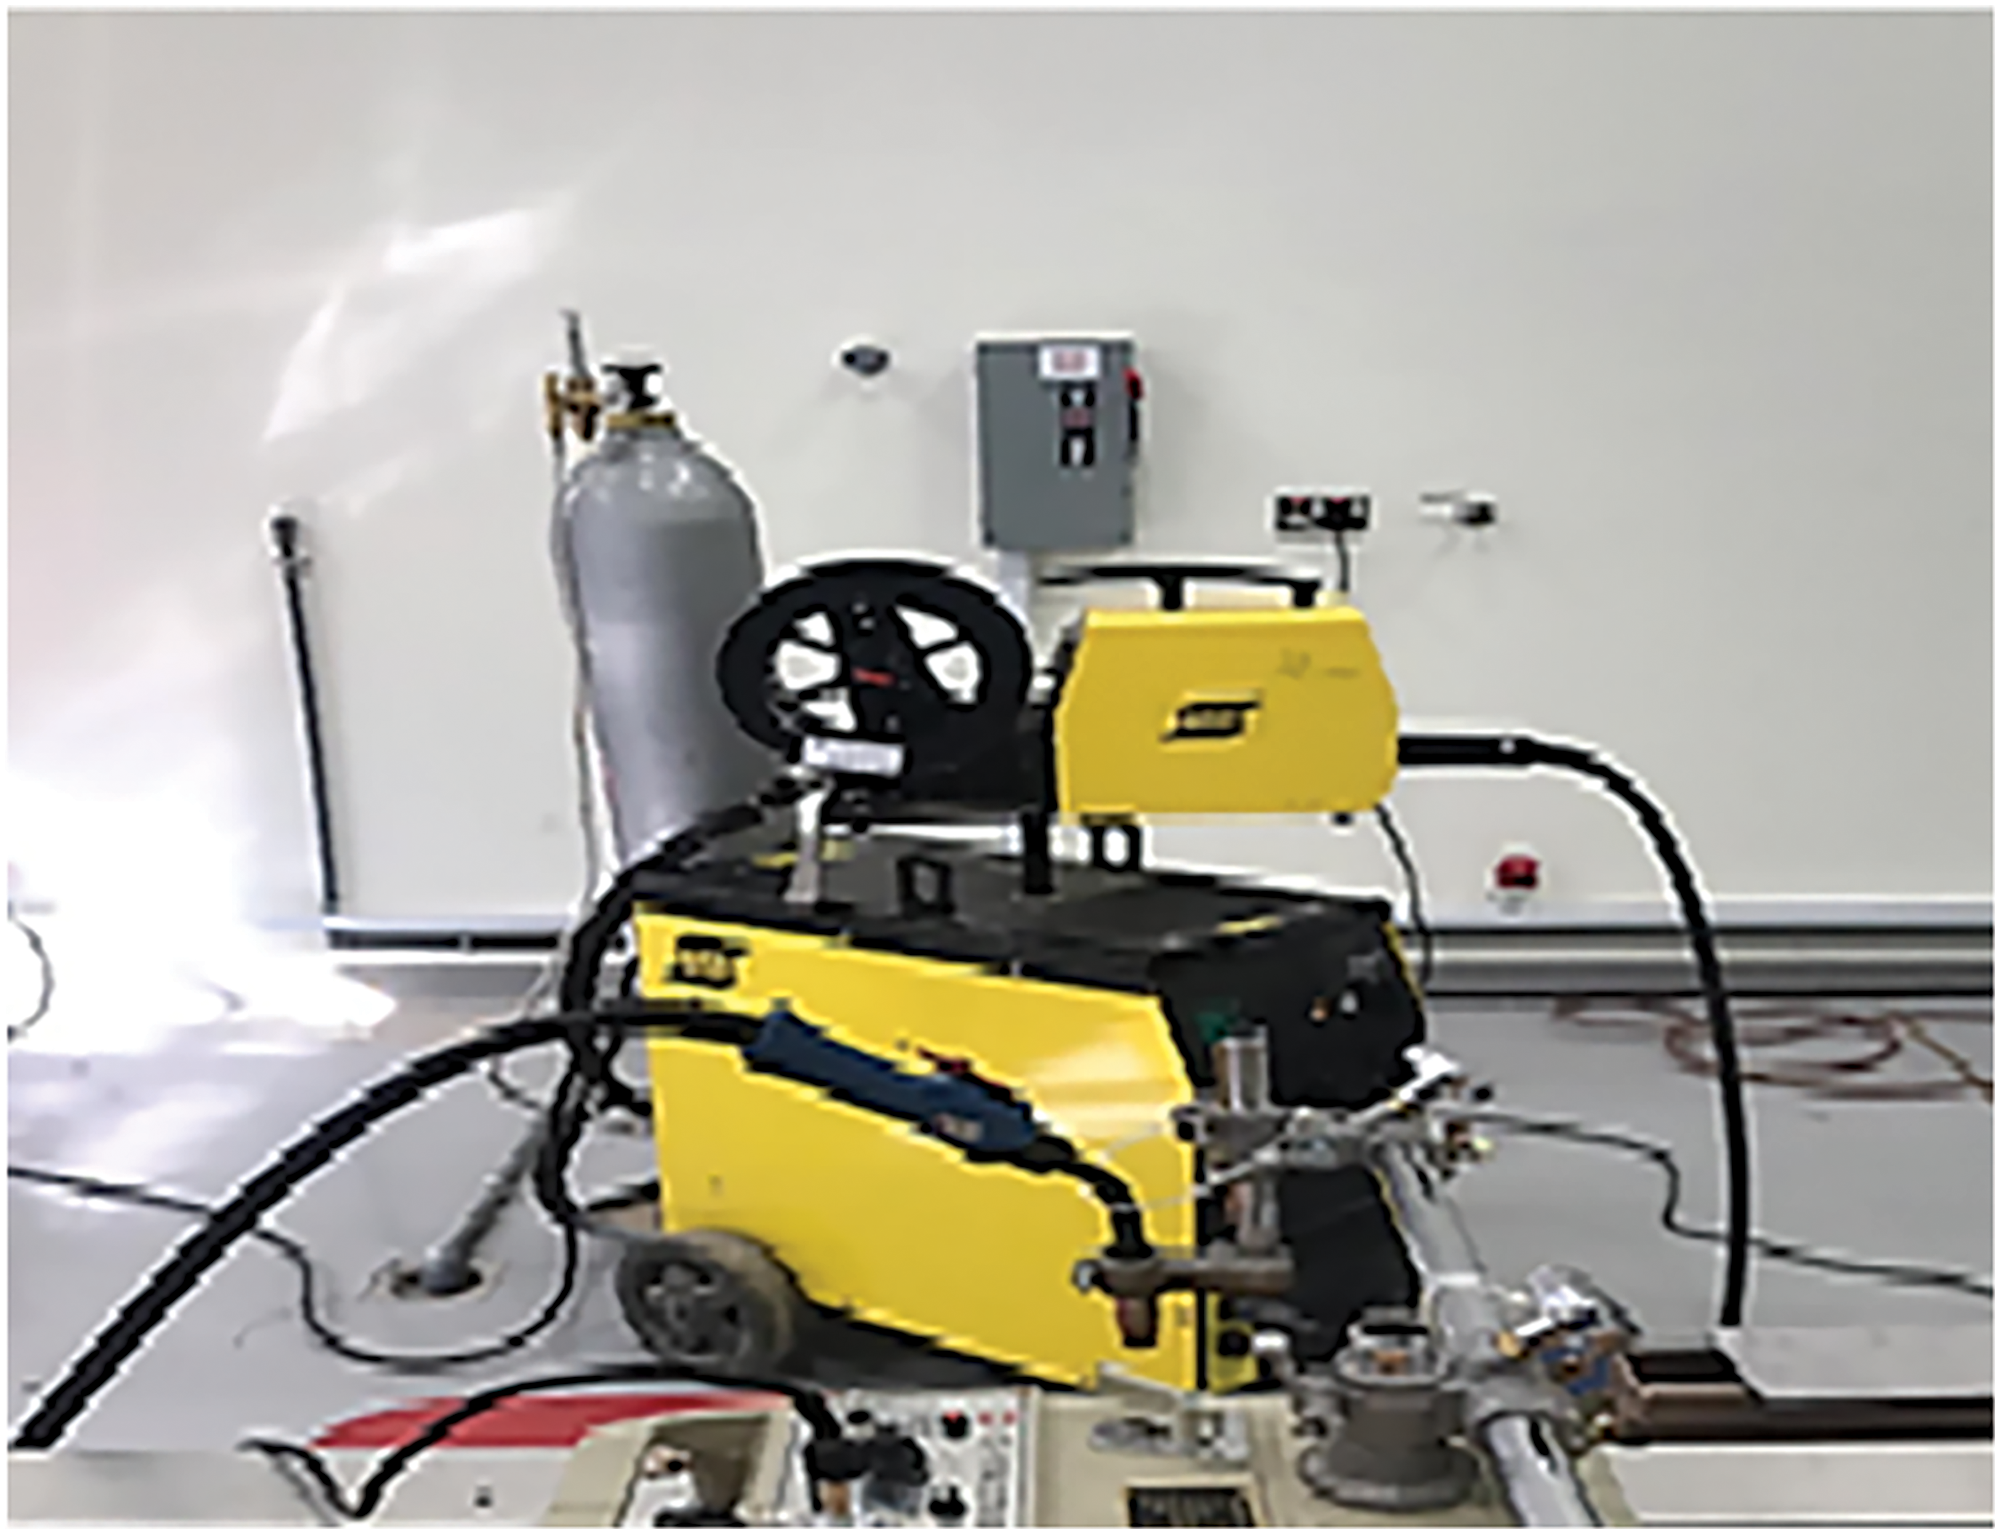
Figure 1: MIG welding machine with a motorized carriage
Experiments consist of welding a 20 cm line on a rectangular plate of 6 mm thickness. Before welding, the plates of 100 mm × 200 mm × 6 mm were cleaned with acetone. Powders have been heated separately in a furnace at 100°C for 1 h to eliminate humidity. Flux in powder form has been mixed with acetone in the proportion of (1 ÷ 1) and made in the form of paste; a brush was utilized to apply the mixture on plain edges to be joined, as shown in Fig. 2. The mean coating density of flux was about 4–5 mg/cm2.
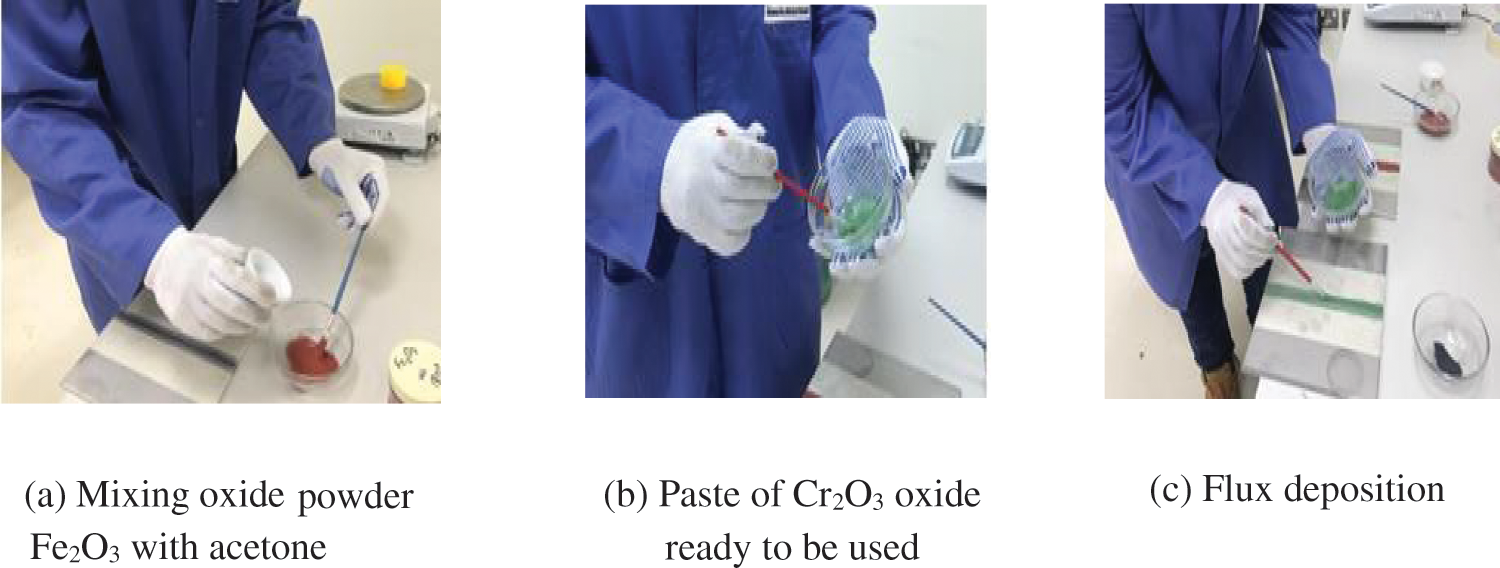
Figure 2: Flux preparation (a) and (b), and flux deposition before welding (c)
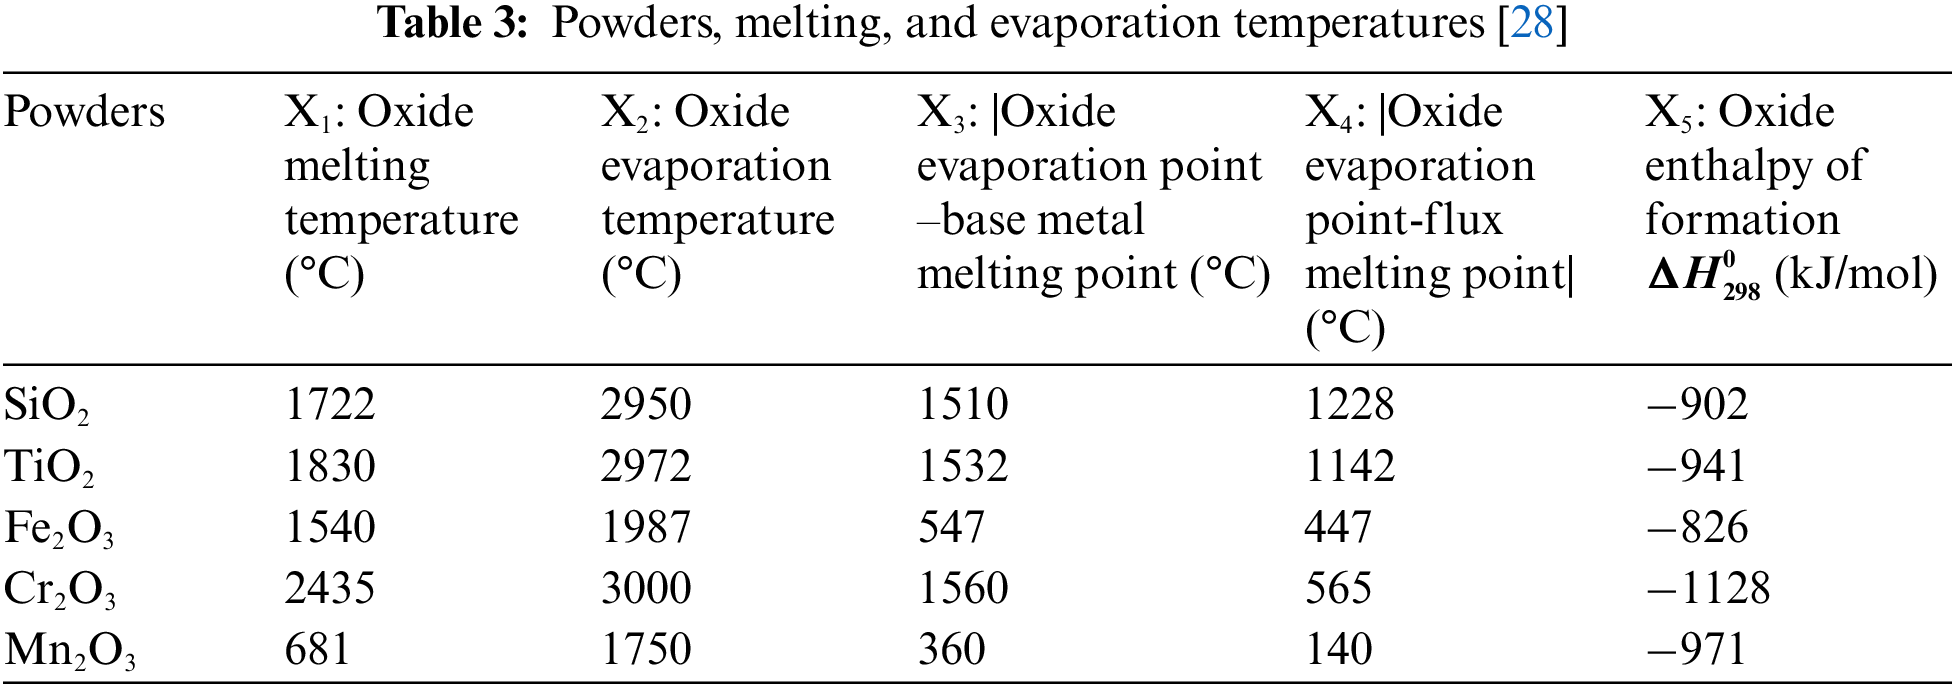
The selected physical properties of the deposited powders tested are listed in Table 3.
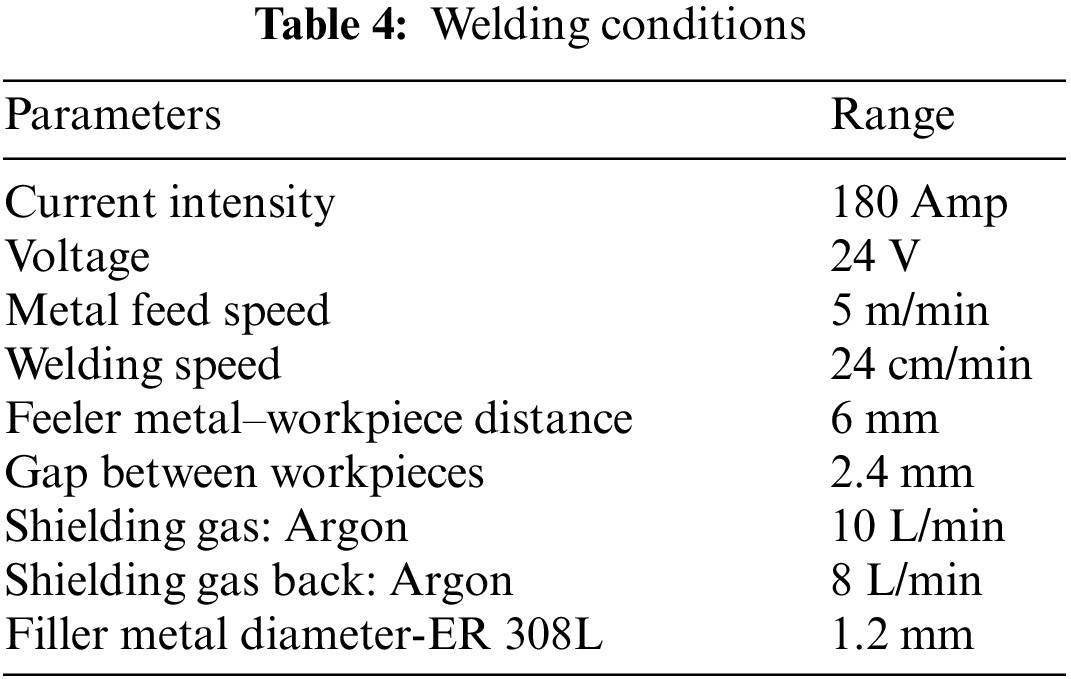
The joints were executed with a square butt weld design without edge preparation. Both plates were clamped with a 2.4 mm gap distance. The welding parameters are listed in Table 4.
After welding, the samples were cut far from the welding starting point to be sure that the arc welding was stabilized, as shown in Fig. 3a. The weld morphology of both MIG and AMIG welding has been analyzed. The 304L SS weld zone was etched using Glyceregia solution (15 cc HCl + 5 cc HNO3 + 10 cc glycerol). The weld aspect was checked using Motic software integrated with an optical microscope for welds of AMIG and conventional MIG, as depicted in Fig. 3b.
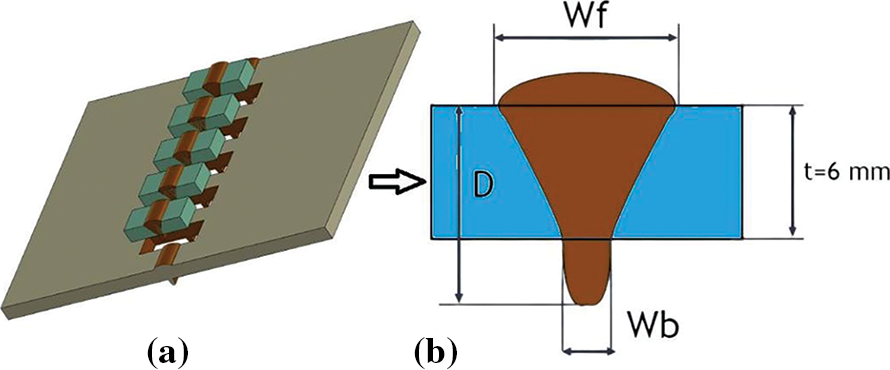
Figure 3: Specimens for morphological analysis (a) and morphology parameters of fully penetrated weld bead (b)
This study investigated the most important physical properties affecting the weld bead shape of filler metal 308L SS using a complete procedure. The procedure included a correlation study and an optimization process based on the PSO algorithm. The objective of the correlation study was to determine which parameters were likely to affect the physical parameters of the welding process. After selecting the explanatory variables, a PSO modeling procedure was developed for two explained variables: the depth (D) and the ratio of depth (R). Five input variables were used in this study. It is technically difficult to conduct experiments to model the welding processes due to time, cost, and logistical considerations. Therefore, there are a relatively low number of input variables; see details of the welding procedure in Section 2.2. The selected variables were respectively x1: oxide boiling point (°C), x2: oxide surface tension (mN/m), x3: oxide melting point (°C), x4: |oxide boiling point-Melting point of BM SS304L| (°C) and x5: oxide enthalpy energy (
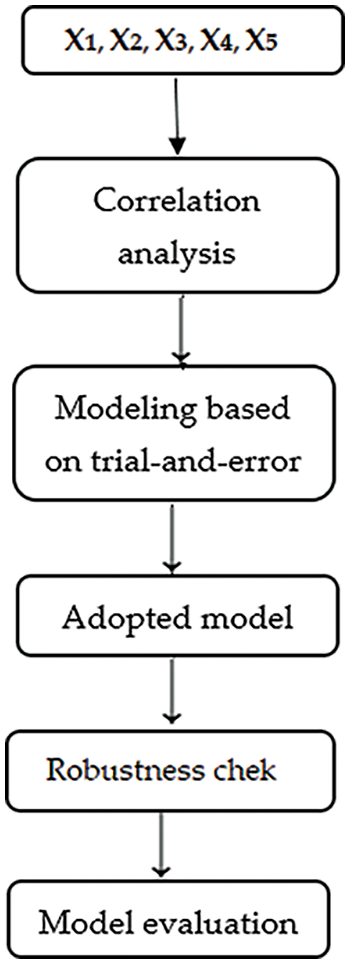
Figure 4: Methodology flowchart
Y is the model output (D, R).
X1: Oxide melting temperature (°C),
X2: Oxide evaporation temperature (°C),
X3: |Oxide evaporation point–Base metal melting point| (°C),
X4: |Oxide evaporation point– oxide melting point| (°C),
X5: Oxide enthalpy of formation
x1 Max = 2435°C, x2 Max = 3000°C, x3 Max = 1560°C, x4 Max = 1228°C, x5 Max = −1128 kJ/mol.
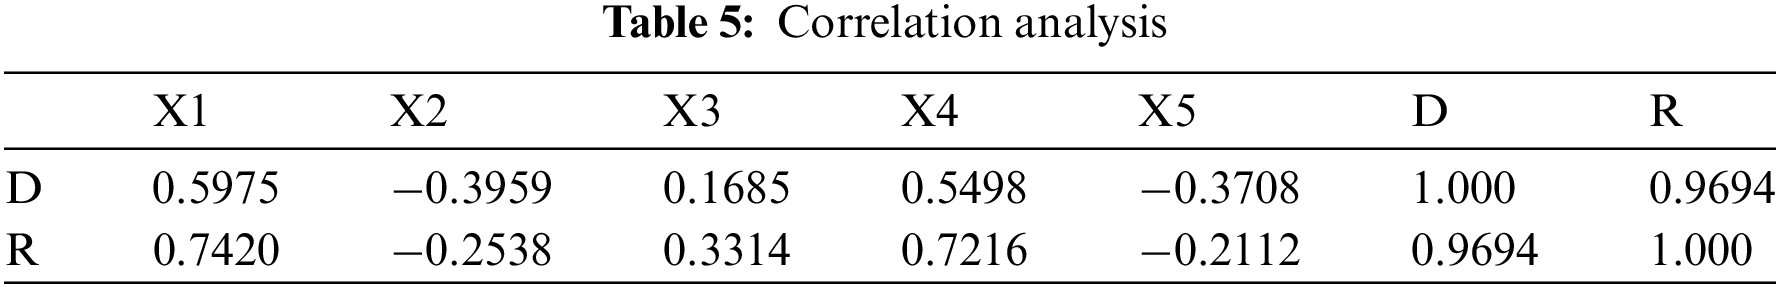
Fig. 4 indicates that the PSO was applied to optimally determine the models’ parameters, such as the quadratic error between the observed (measured) outputs and the predicted (estimated by the models) outputs, which was minimized [30,31]. The procedure included a correlation study and an optimization process based on the PSO [32]. The objective of the correlation study was to determine to what extent the input parameters were likely to affect the physical properties of the welding process. After studying the effect of the explanatory variables (input variables) on the physical parameters, a modeling procedure using PSO was developed for two explained variables: the depth (D) and the ratio of depth (R). Table 5 demonstrates that the Pearson correlation coefficients between the depth (D) and the ratio of depth (R) and, respectively, the input parameters (X1–X5) range at different levels. For the depth (D), the magnitude of the correlation ranged from 0.5975 (effect of X1) to −0.3959 (effect of X3). X1, X3, and X4 showed positive correlations with D. However, X2 and X5 showed negative correlations. The ratio of depth (R) is highly correlated with X1 (0.7420) and X4 (0.7216), respectively. However, the correlations with the remaining variables (X2, X3, and X5) were medium. D and R are mutually and strongly correlated (a coefficient of correlation equal to 0.9694 is calculated). All five cited variables were considered for modeling depth and proportion of depth based on the abovementioned correlation study results.
Based on a trial-and-error technique, three types of models were investigated:
– A purely linear model
– A linear with quadratic components model
– A model includes three components: a linear component, a quadratic component, and a component relating to the interaction between the input variables.
Only linear models were investigated in depth due to the limited number of measurements and because model accuracy is not much improved.
PSO is a nature-inspired meta-heuristic optimization algorithm. At its first discovery, it was used as a simulation tool. Later, researchers from various fields applied it as an optimization technique, including flux-cored arc welding parameters optimization, tuning neural networks in a MIG welding process, and Activated flux tungsten inert gas welded 316L austenitic stainless steel [17]. The PSO belongs to a sub-field of artificial intelligence (AI) known as swarm intelligence. Swarm intelligence is the term for a family of techniques that use groups of solutions, which move toward a solution to optimization problems gradually and collectively. In the PSO paradigm, a set of candidate solutions
where k is the iteration index;
As a common practice in prediction, the quality of a model is measured through some performance metrics. This study uses the mean absolute percentage error (MAPE) and the root mean squared error (RMSE). Those two performance measures are evaluated in the following formulas [33]:
Mean Absolute Percentage Error (MAPE (%))
Root Mean Square Error (RMSE)
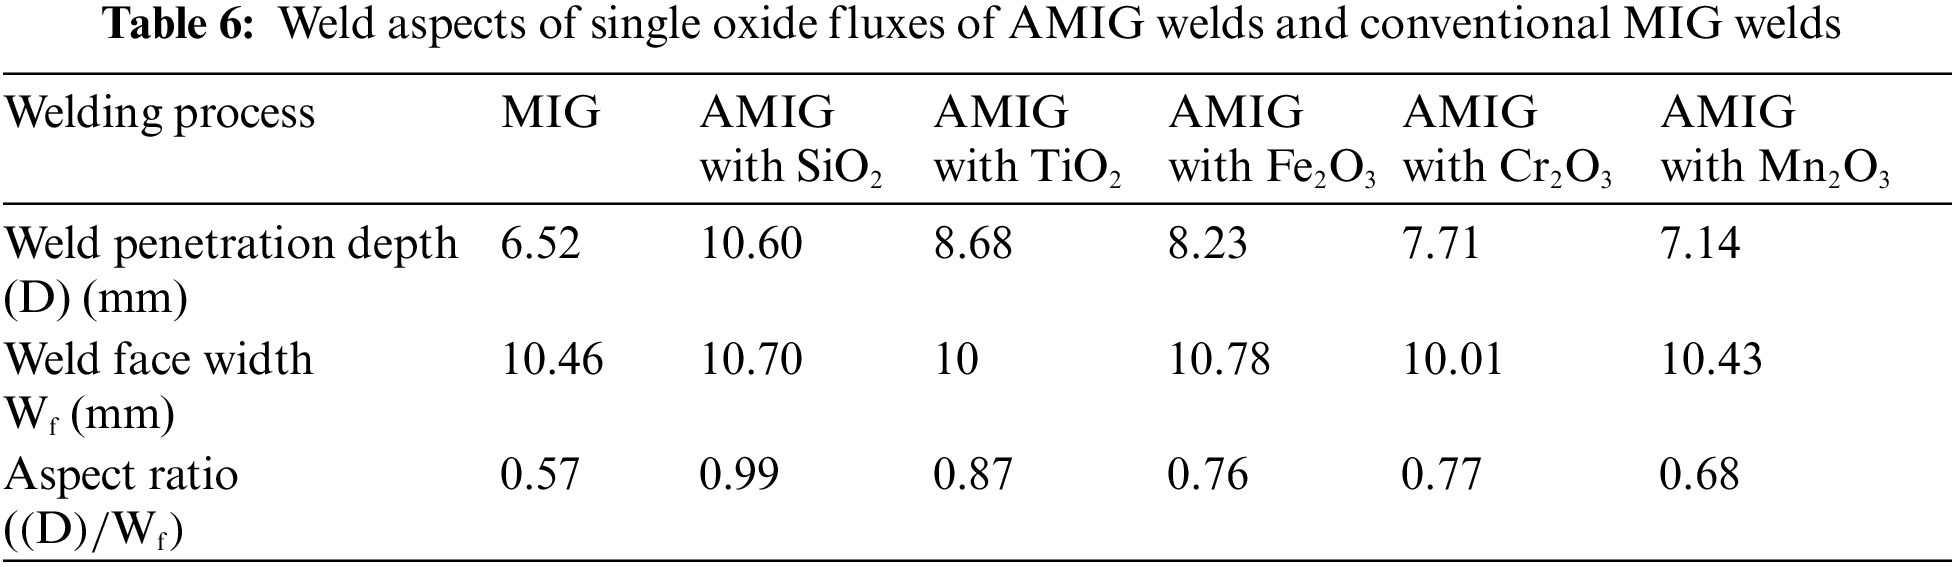
Five oxides were tested to carry out this study. The weld lines were executed using a butt-join design with a 1 mm gap between the parts to be joined. Table 6 indicates that the highest value of depth penetration is 10.60 mm, which was obtained for a sample welded with SiO2 flux. The penetrations are full for all welds. AMIG weld penetrations decrease respectively from SiO2, TiO2, Fe2O3, and Cr2O3, and have larger penetrations than the MIG weld. AMIG with Mn2O3 presents the lowest penetration.
Macrographs of the weld bead transverse sections of the 304L stainless steel with a thickness of 6 mm produced with conventional MIG and AMIG welding processes are shown in Fig. 5.
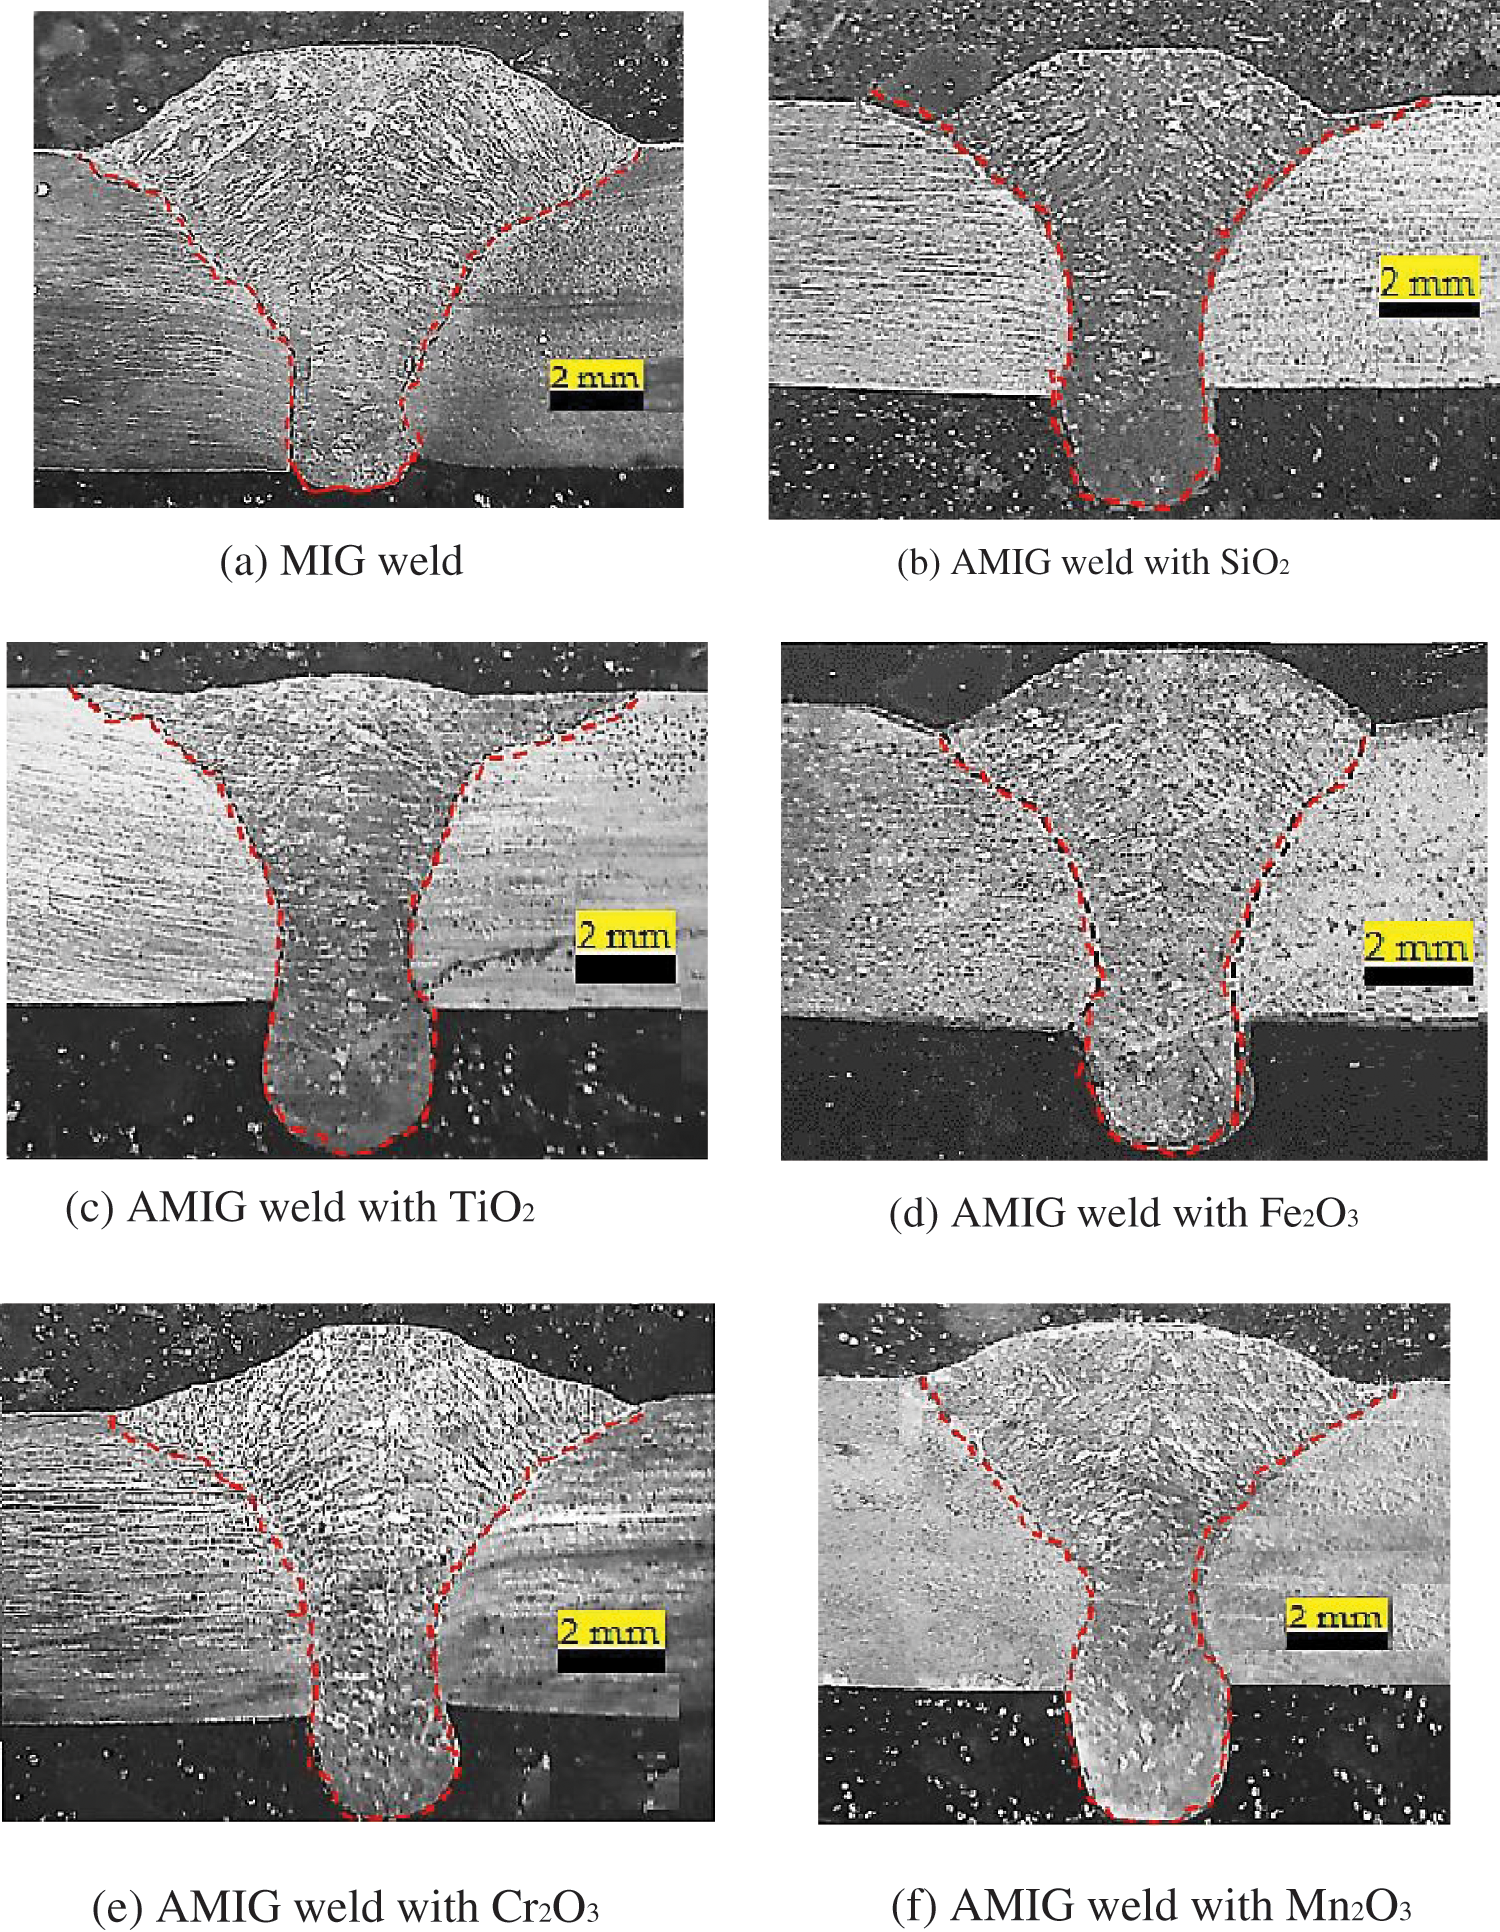
Figure 5: Macrographs of the weld bead transverse sections for conventional MIG (a) and AMIG with the different oxide fluxes (b–f) welding processes
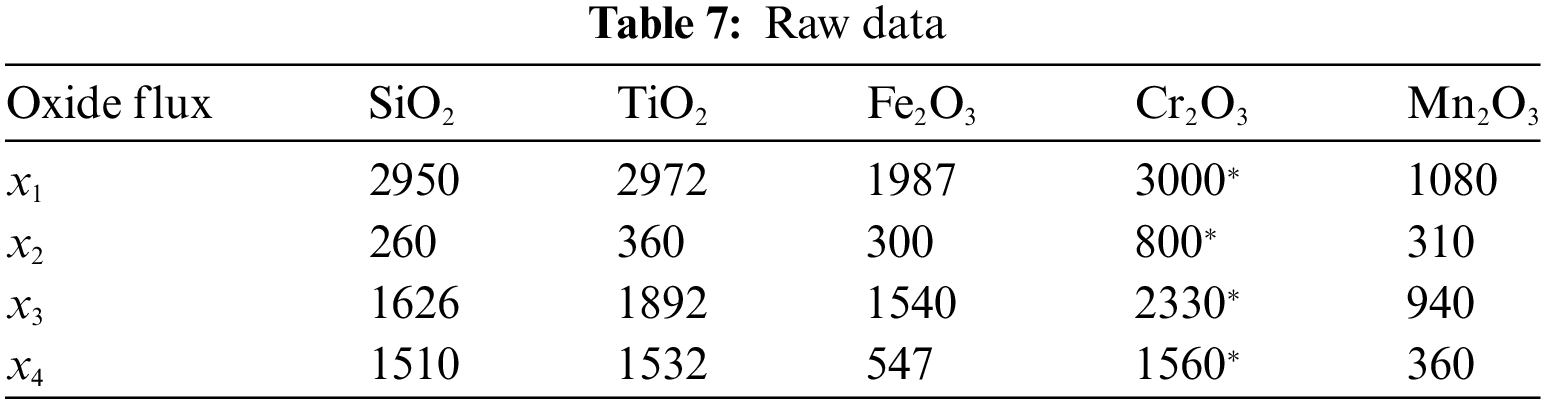
The original/raw explanatory variables of each flux are listed in Table 7. As depicted before, normalized values are determined by dividing the original values by the maximum values of the same variables. This operation is performed to ensure the rescaling of the effects of those variables since the raw values were found to be of different scales of magnitude.
The three interaction factors model without transformation gives the best fit for the output response D. The obtained mathematical formulation for D can be represented as follows:
Table 8 shows the predicted values of D. The predicted and real outputs were observed to be relatively close. Those results can be considered good since they were obtained by a limited number of measurements. However, performing more experiments to extract more data seems to be problematic in the case of welding processes. Performing one experiment is time-consuming and requires much effort.
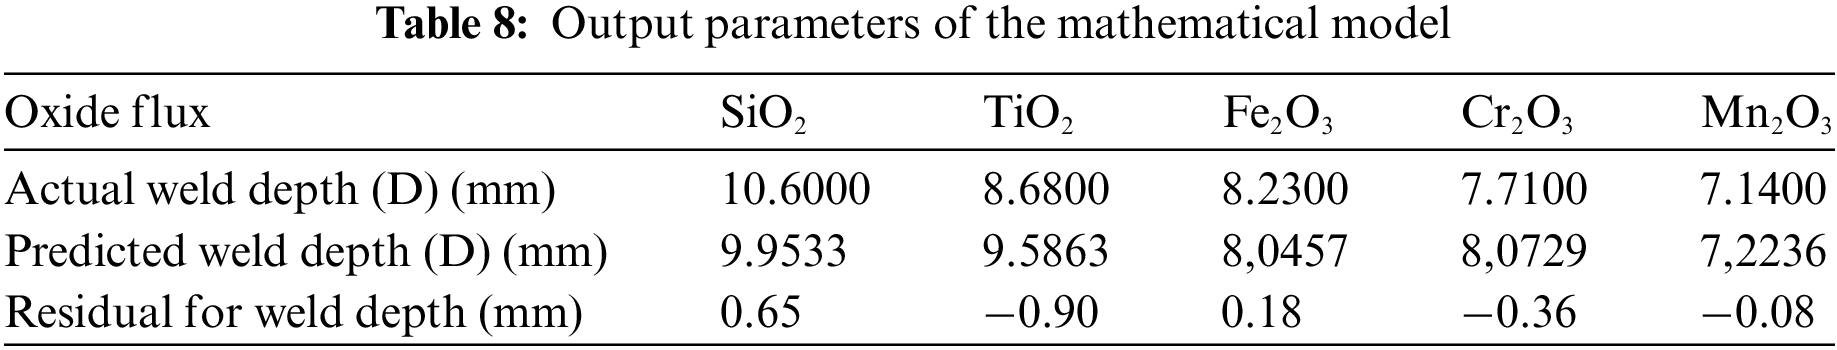
Table 8 also shows the calculation of residues to validate the found-out D mathematical models. It shows that the aspect ratio mathematical equations developed for input parameters welding are fully compatible with the actual output values.
Table 9 shows the performance metrics of the developed models. MAPE is commonly used because it is easy to interpret. A MAPE value of 5.1556% means that the average difference between predicted and actual values is acceptable. The coefficient of determination is 0 < R2 < 1 and expresses the linear correlation intensity between actual weld depth and predicted weld depth. The size R2 ranging from 0.7 to 1.0 indicated a very strong correlation. Given the limited number of samples/observations used to perform this modeling task, the obtained value of these performance metrics can be considered strong.
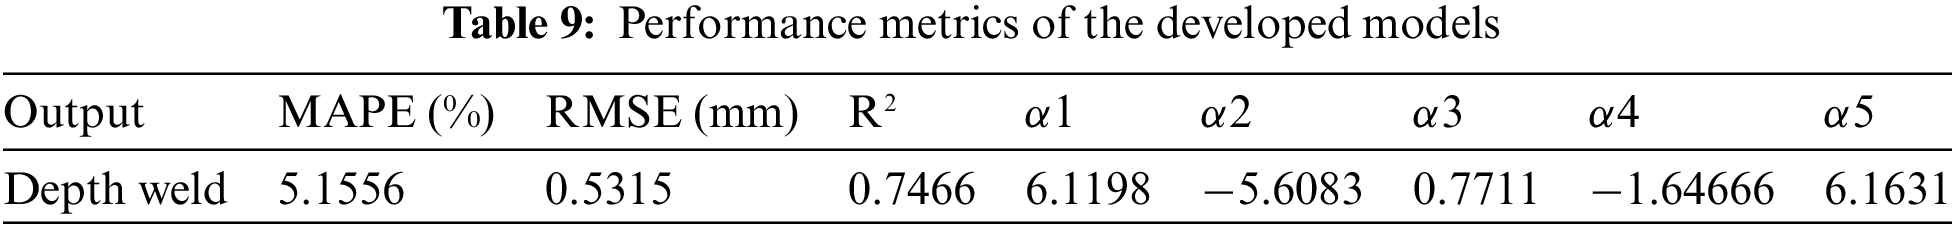
Fig. 6 shows a satisfactory distribution of the actual depth against the predicted depth. In addition, this distribution indicates the goodness of the regression model. Four simulation scenarios were considered by including positive (+) and negative (−) disturbances of ±1% to the models’ coefficient values to check the robustness of the previously developed model. Those disturbances are assumed to consider the effect of modeling errors that can be caused by fluctuations in measurement devices or errors coming from the modeling technique (the PSO). Tables 10 and 11 show clearly that all positively and negatively disturbed models for both D remain in a good-fit range even under the disturbances reported to the model parameters.
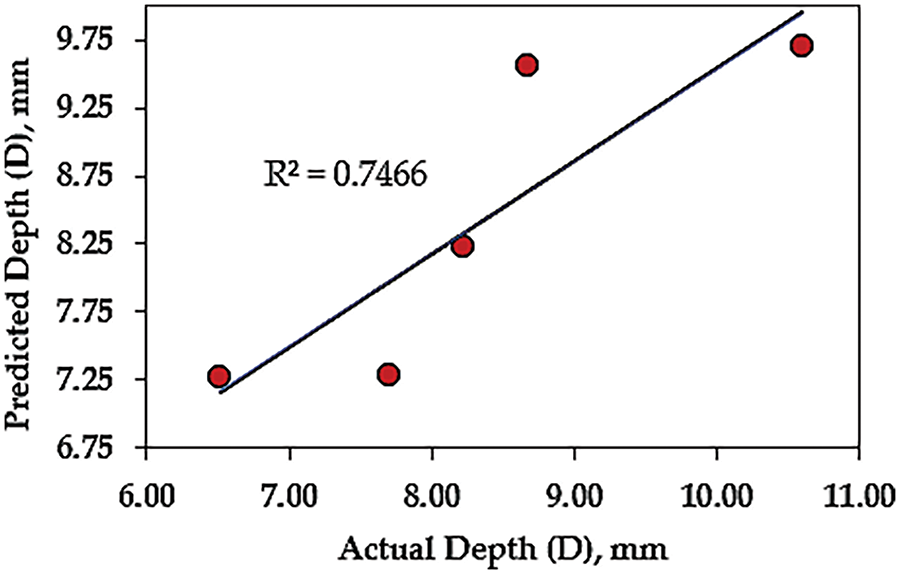
Figure 6: Actual vs. predicted values for weld bead depth (D)
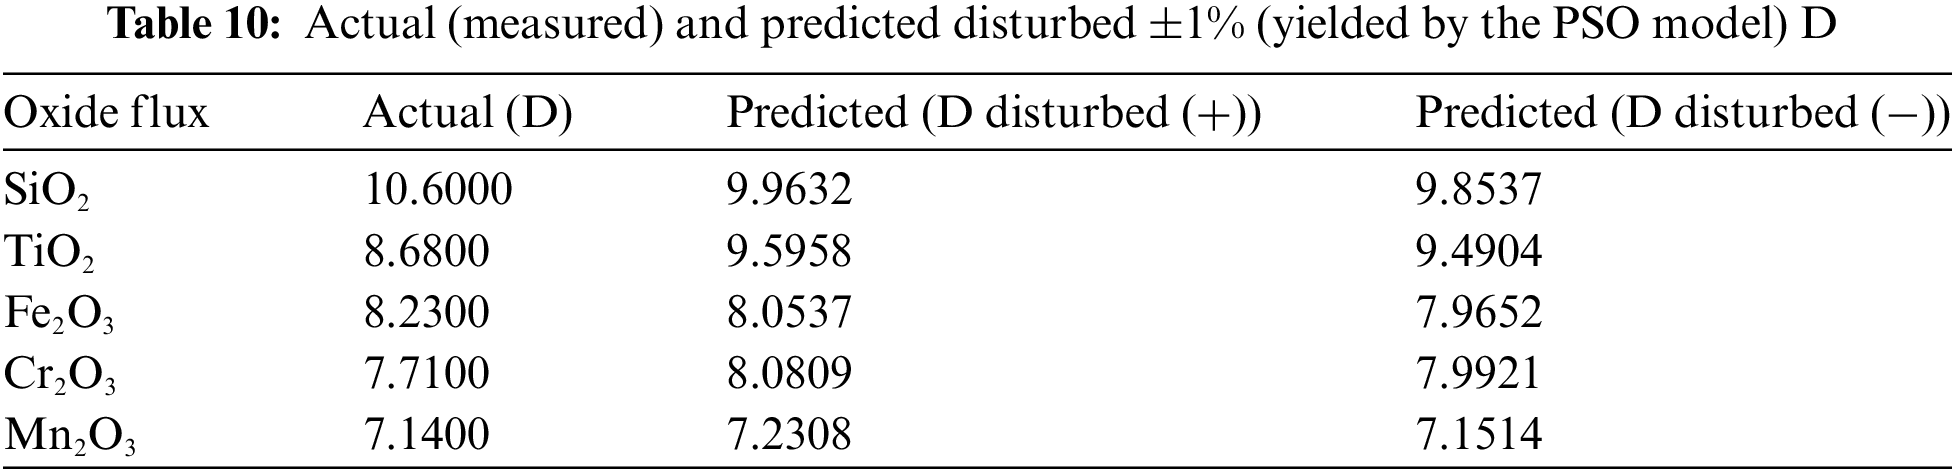
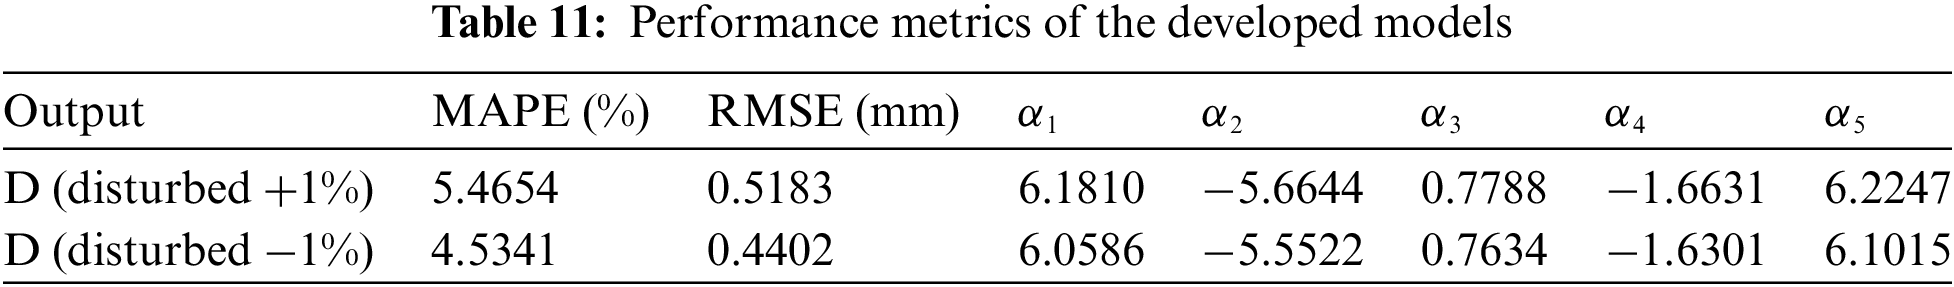
The accuracy of the obtained results can be confirmed by the values of the performance metrics (Table 11).
MAPE for depth (D) is 4.5341% for a negative disturbance of 1% and 5.4654% for a positive disturbance of 1%. These performance indicators can be considered suitable for welding process modeling. In addition, the RMSE for depth (D) is 0.4402 mm for a negative disturbance of 1% and 0.5183 mm for a positive disturbance of 1%.
3.3 Weld Aspect Ratio (R) Modeling
The three factors interaction model without transformation best fits the output response R. The obtained mathematical formulation for R can be represented as Eq. (9).
Table 12 lists the residue calculation for validation of the R mathematical models. It shows that the aspect ratio mathematical equations developed in terms of input parameters for welding are fully compatible with the actual output values.
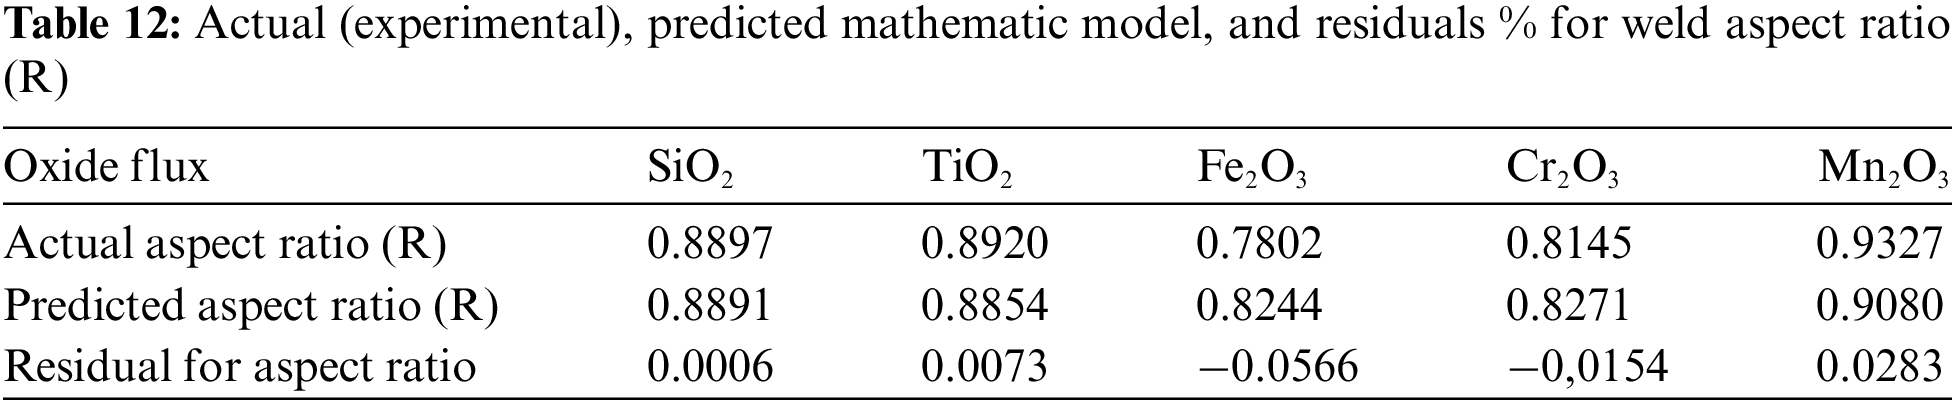
As R2 is 96.27% for R, this performance metric can be considered good for welding process modeling. The small residuals of the models confirm the fit quality between the parameters estimated by the PSO model and the measured ones.
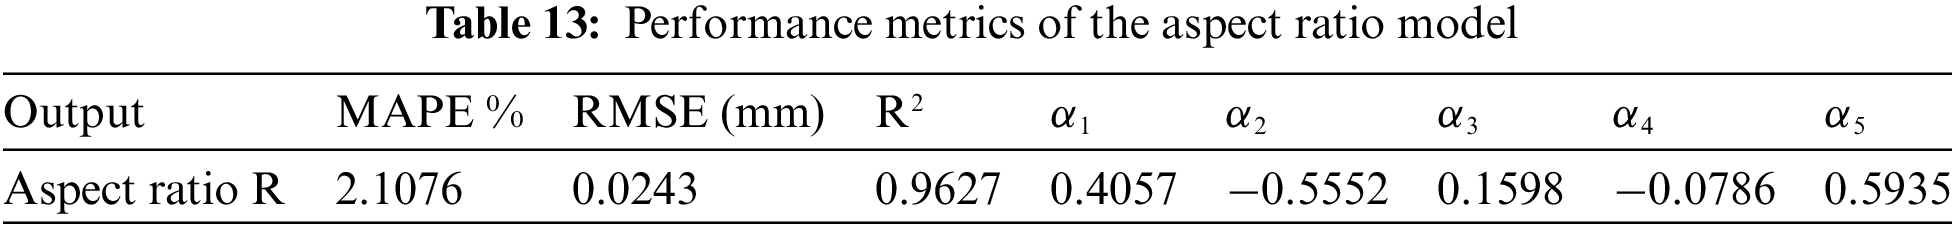
The accuracy of the obtained results can be confirmed by the values of the performance metrics depicted in Table 13. Thus, the MAPE was close to 2.1076% for the weld aspect ratio. This performance metric can be considered good for welding process modeling. In addition, the obtained RMSE reminds us that the RMSE indicates how concentrated the data is around the line of best fit; in other words, RMSE is the standard deviation of the residuals. The RMSE of 0.0243 mm can be considered good, considering the size of the datasets used.
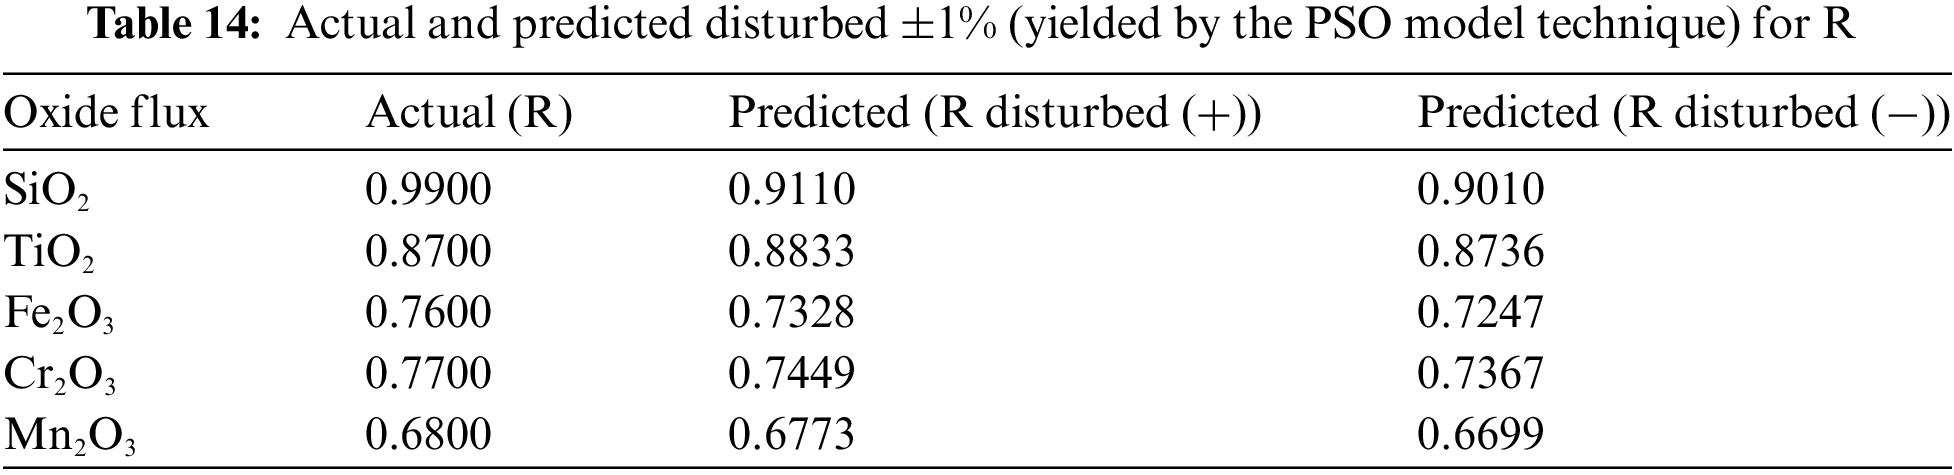
The statistical indicators specify the significance of the proposed mathematical model, as shown in Fig. 7. It noticed that R2 is up to 96.27%, which attests to a satisfactory distribution of the actual weld aspect ratio against the predicted weld aspect ratio. In addition, this distribution indicates the goodness of the regression model. The effect of modeling errors that can be caused by fluctuations in measurement devices or errors resulting from the PSO modeling technique is expected to be considered in these disturbances. Table 14 shows clearly that all positively and negatively disturbed R models provide acceptable accuracy of predicted values.
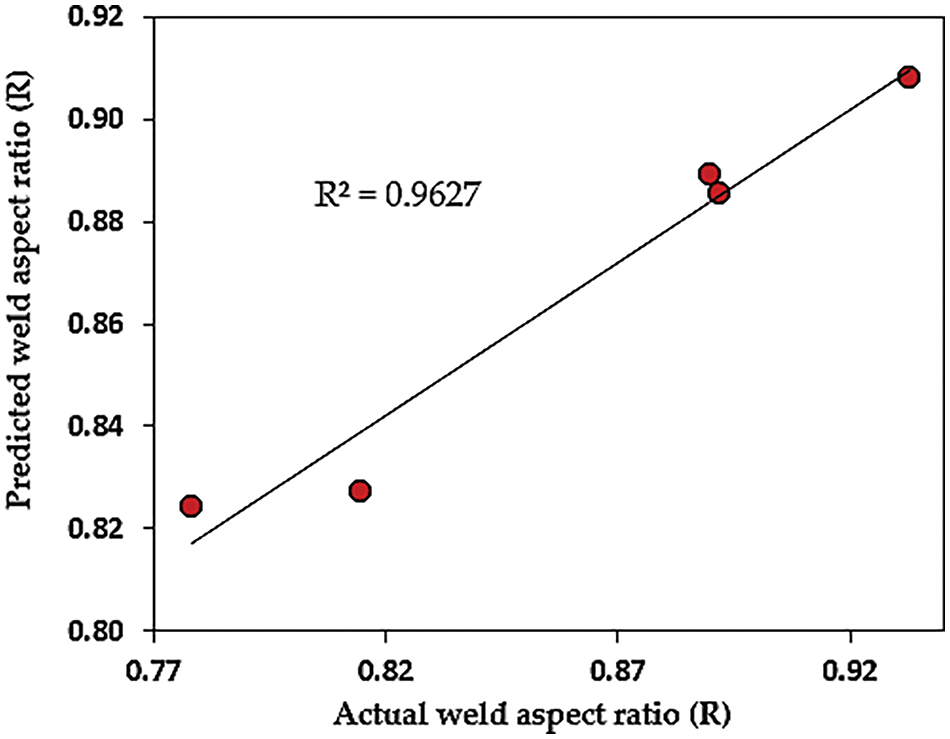
Figure 7: Actual vs. predicted values for weld aspect ratio (R)
The study focuses on the thermophysical properties of five metallic oxides that influence the morphology of welded joints made from 304L stainless steel plates 6 mm thick by AMIG welding. In the AMIG process, an intelligent model based on the PSO algorithm is successfully employed to optimize the depth weld penetration and weld aspect ratio. The main findings can be summarized as follows:
(i) To match the desired morphology of weld beads with the thermal properties of metallic oxides, a PSO model has been developed based on experiments. PSO models are capable of making optimization of weld bead geometry with acceptable accuracy. The results showed that PSO models can be used as an alternative tool based on conventional calculation methods.
(ii) To cope with the uncertainties of measurement devices, human error, and the PSO technique modeling capabilities, the robustness of the developed models must be checked carefully. The penetration depth and aspect ratio models remain consistent and robust against the included variations by adding perturbations to the models’ parameters. The accuracy of the weld depth penetration and weld aspect ratio predictions were over 74% and 96%, respectively. The standard deviation of the residuals for aspect ratio was 0.0243 and is up to 0.5315 for the depth model, which can be considered good based on the size of the used datasets.
As a future perspective, the results of this study can be applied to other materials. Therefore, under the technical and computational constraints, there will be a contribution to the modeling efficiency and the characterization of new oxides when using more observations and other techniques in the field of AI. It is possible to target several applications with a view to the quality of the welding oxides and maximizing profitability.
Acknowledgement: None.
Funding Statement: The authors received no specific funding for this study.
Author Contributions: The authors confirm their contribution to the paper as follows: study conception and design: Kamel Touileb, Sahbi Boubaker and Abdeljlil Chihaoui Hedhibi; data collection: Kamel Touileb and Rachid Djoudjou; analysis and interpretation of results: Kamel Touileb; draft manuscript preparation and editing: Kamel Touileb, Rachid Djoudjou, Abousoufiane Ouis and Hany Said Abdo. All authors reviewed the results and approved the final version of the manuscript.
Availability of Data and Materials: The data used to support the findings of this study are included within the article.
Ethics Approval: Not applicable.
Conflicts of Interest: The authors declare that they have no conflicts of interest to report regarding the present study.
References
1. Guo ZG, Ma TJ, Yang XW, Li J, Li WY, Vairis A. Multi-scale analyses of phase transformation mechanisms and hardness in linear friction welded Ti17(α+β)/Ti17(β) dissimilar titanium alloy joint. Chin J Aeronaut. 2024;37(1):312–24. doi:10.1016/j.cja.2023.08.018. [Google Scholar] [CrossRef]
2. Guo ZG, Ma TJ, Yang XW, Tao J, Li J, Vairis A. In-situ investigation on dislocation slip concentrated fracture mechanism of linear friction welded dissimilar Ti17(α+β)/Ti17(β) titanium alloy joint. Mater Sci Eng A. 2023;872:144991. doi:10.1016/j.msea.2023.144991. [Google Scholar] [CrossRef]
3. Campbell FC. Elements of metallurgy and engineering alloys. ASM Int. 2008. doi:10.31399/asm.tb.emea.9781627082518. [Google Scholar] [CrossRef]
4. Cunat PJ. The welding of stainless steels. In: Materials and applications series; 2007. vol. 3. Available from: https://bssa.org.uk/wp-content/uploads/2021/07/The-Welding-of-Stainless-Steels.pdf [Accessed 2024]. [Google Scholar]
5. Vijaya SB, Daniel LI, Jayabal S. Experimental study and analysis of weld parameters by GRA on MIG welding. Mater Today: Proc. 2018;5:14309–16. [Google Scholar]
6. Mezaache M, Benaouda OF, Chaouch S, Babes B, Amraoui R. Optimization MAG welding input variables to maximize penetration depth using particle swarm optimization algorithm. Eng Proc. 2022;14:5. doi:10.3390/engproc2022014005. [Google Scholar] [CrossRef]
7. Ran L, Manshu D, Hongming G. Prediction of bead geometry with changing welding speed using artificial neural network. Materials. 2021;14:1494. doi:10.3390/ma14061494. [Google Scholar] [PubMed] [CrossRef]
8. Tafarroj MM, Moghaddam MA, Dalir H, Kolahan F. Using hybrid artificial neural network and particle swarm optimization algorithm for modeling and optimization of welding process. J Adv Manuf Syst. 2021;20:783–99. doi:10.1142/S0219686721500384. [Google Scholar] [CrossRef]
9. Aghakhani M, Mehrdad E, Hayati E. Parametric optimization of gas metal arc welding process by taguchi method on weld dilution. Int J Model Optim. 2011;4:2213–21. doi:10.7763/IJMO.2011.V1.38. [Google Scholar] [CrossRef]
10. Ma XY, Sun ZL, Zhang YB, Zang X. Optimization of welding process parameters based on kriging-PSO intelligent algorithm. J Northeast Univ (Nat Sci). 2019;40:370–5. doi:10.12068/j.issn.1005-3026.2019.03.013. [Google Scholar] [CrossRef]
11. Shah J, Patel G, Makwana J, Chauhan P. Optimization and prediction of MIG welding process parameters using ANN. JETIR. 2018;5:1011–6. [Google Scholar]
12. Sudhakaran R, Murugan VV, Sivasakthivel PS. Optimization of process parameters to minimize angular distortion in gas tungsten arc welded stainless steel 202 grade plates using particle swarm optimization. J Eng Sci Technol. 2012;7:195–208. [Google Scholar]
13. Harkal A, Kulkarni S, Madavi K, Agwan N. Experimental analysis and optimization of A-MIG welding process for hardness of SS 316 by Taguchi method. Int J Res Appl Sci Eng Technol. 2019;7:2680–4. doi:10.22214/ijraset.2019.6455. [Google Scholar] [CrossRef]
14. Pavan GC, Priyank BP, Jaksan DP. Evaluation of MIG welding process parameter using activated flux on SS316L by AHP-MOORA method. Mater Today: Proc. 2018;5:5208–20. [Google Scholar]
15. Albaijan I, Hedhibi AC, Touileb K, Djoudjou R, Ouis A, Alrobei H. Effect of binary oxide flux on weld shape, mechanical properties and corrosion resistance of 2205 duplex stainless steel welds. Adv Mater Sci Eng. 2020;2020(1):5842741. doi:10.1155/2020/5842741. [Google Scholar] [CrossRef]
16. Patel NP, Sharma DK, Upadhyay GH. Effect of activated fluxes on weld penetration and mechanism responsible for deeper penetration of stainless steels—a review. In: Current advances in mechanical engineering. Singapore: Springer; 2021. p. 737–46, doi:10.1007/978-981-33-4795-3_67. [Google Scholar] [CrossRef]
17. Chihaoui HA, Touileb K, Ouis A, Djoudjou R, Ahmed MZ. Mechanical properties and microstructure of TIG and ATIG welded 316L austenitic stainless steel with multicomponent flux optimization using mixing design method and particle swarm optimization (PSO). Materials. 2021;14:7139. [Google Scholar]
18. Madavi KR, Jogi BF, Lohar GS. Investigational study and microstructural comparison of MIG welding process for with and without activated flux. Mater Today: Proc. 2022;51(5):212–6. doi:10.1016/j.matpr.2021.05.240. [Google Scholar] [CrossRef]
19. Zote BP, Madavi KR. Investigational study and enhancement of MIG welding process with applying activated flux by utilizing Taguchi method. Int J Res Appl Sci Eng Technol. 2020;8:124–9. doi:10.22214/ijraset.2020.32422. [Google Scholar] [CrossRef]
20. Rawat R, Manchanda S, Chopra M, Sharma VK. Effects of active fluxes on form factor of weld bead in metal inert gas welding. In: International Conference on New Frontiers in Engineering, Science & Technology, 2018 Jan 8–12; New Delhi, India. [Google Scholar]
21. Chakraborty A, Sharma C, Rathee S, Srivastava M. Influence of activated flux on weld bead hardness of MIG welded austenitic stainless steel. Mater Today: Proc. 2021;47:6884–8. doi:10.1016/j.matpr.2021.05.168. [Google Scholar] [CrossRef]
22. Katherasan D, Elias Jiju V, Sathiya P, Noorul Haq A. Simulation and parameter optimization of flux cored arc welding using artificial neural network and particle swarm optimization algorithm. J Intell Manuf. 2014;25:67–76. doi:10.1007/s10845-012-0675-0. [Google Scholar] [CrossRef]
23. Yusof MFM, Ishak M, Ghazali MF. Weld depth estimation during pulse mode laser welding process by the analysis of the acquired sound using feature extraction analysis and artificial neural network. J Manuf Process. 2020;6(3):163–78. [Google Scholar]
24. Li H, Ma Y, Duan M, Wang X, Che T. Defects detection of GMAW process based on convolutional neural network algorithm. Sci Rep. 2023;13:21219. [Google Scholar] [PubMed]
25. Chen Z, Cao H, Ye K, Zhu H, Li S. An improved particle swarm optimization(IPSO)–based form-finding method for suspension bridge installation analysis. ASCE J Comput Civil Eng. 2015;29:04014047. doi:10.1061/(ASCE)CP.1943-5487.0000354. [Google Scholar] [CrossRef]
26. Qiao L, Zhu J. Machine learning-guided design of pearlitic steel with promising mechanical and tribological properties. Adv Eng Mater. 23(12):2100505. doi:10.1002/adem.202100505. [Google Scholar] [CrossRef]
27. Qiao L, Inouea J, Zhu J. Machine learning guided constitutive model and processing map for Fe2Ni2CrAl1.2 multi-principle element alloys. J Mater Res Technol. 2024;29:353–63. doi:10.1016/j.jmrt.2024.01.119. [Google Scholar] [CrossRef]
28. Mills KC. Recommended values of thermophysical properties for selected commercial alloys. Cambridge, England: National Physical Laboratory and ASM International, Woodhead Publishing Limited; 2002. [Google Scholar]
29. Malviya R, Pratihar DK. Tuning of neural networks using particle swarm optimization to model MIG welding process. Swarm Evol Comput. 2011;1:223–35. doi:10.1016/j.swevo.2011.07.001. [Google Scholar] [CrossRef]
30. Srinivas K, Vundavilli PR, Manzoor Hussain M. Weld Quality Prediction of PAW by Using PSO Trained RBFNN. In: Advanced Materials Science and Engineering Lecture Notes in Mechanical Engineering, Springer, Singapore: 2020. p. 433–9. doi:10.1007/978-981-15-1307-7_48. [Google Scholar] [CrossRef]
31. Das D, Pratihar DK, Roy G, Pal AR. Phenomenological model-based study on electron beam welding process, and input-output modeling using neural networks trained by back-propagation algorithm, genetic algorithms, particle swarm optimization algorithm and bat algorithm. Appl Intell. 2018;48:2698–718. doi:10.1007/s10489-017-1101-2. [Google Scholar] [CrossRef]
32. Chen H, Zhang B, Fuhlbrigge T. Welding process optimization methods: a review. In: Chen S, Zhang Y, Feng Z, editors. Transactions on intelligent welding manufacturing. Singapore: Springer; 2020. [Google Scholar]
33. Eazhil KM, Sudhakaran R, Venkatesan EP, Aabid A, Baig M. Prediction of angular distortion in gas metal arc welding of structural steel plates using artificial neural networks. Metals. 2023;13:436. [Google Scholar]
Cite This Article
 Copyright © 2024 The Author(s). Published by Tech Science Press.
This work is licensed under a Creative Commons Attribution 4.0 International License , which permits unrestricted use, distribution, and reproduction in any medium, provided the original work is properly cited.
 Downloads
 Citation Tools