
 Submit a Paper
 Propose a Special lssue
 Open Access
ARTICLE
The Machine Learning Ensemble for Analyzing Internet of Things Networks: Botnet Detection and Device Identification
System Security Research Center, Chonnam National University, Gwangju, 61186, Republic of Korea
* Corresponding Author: Ieck-Chae Euom. Email:
(This article belongs to the Special Issue: Advanced Security for Future Mobile Internet: A Key Challenge for the Digital Transformation)
Computer Modeling in Engineering & Sciences 2024, 141(2), 1495-1518. https://doi.org/10.32604/cmes.2024.053457
Received 30 April 2024; Accepted 24 July 2024; Issue published 27 September 2024
 View Full Text
 Download PDF
Abstract
The rapid proliferation of Internet of Things (IoT) technology has facilitated automation across various sectors. Nevertheless, this advancement has also resulted in a notable surge in cyberattacks, notably botnets. As a result, research on network analysis has become vital. Machine learning-based techniques for network analysis provide a more extensive and adaptable approach in comparison to traditional rule-based methods. In this paper, we propose a framework for analyzing communications between IoT devices using supervised learning and ensemble techniques and present experimental results that validate the efficacy of the proposed framework. The results indicate that using the proposed ensemble techniques improves accuracy by up to 1.7% compared to single-algorithm approaches. These results also suggest that the proposed framework can flexibly adapt to general IoT network analysis scenarios. Unlike existing frameworks, which only exhibit high performance in specific situations, the proposed framework can serve as a fundamental approach for addressing a wide range of issues.Keywords
The advancement of Internet of Things (IoT) technology and the resulting increase in connectivity have sparked a surge in demand for IoT devices [1]. This expansion has enabled the deployment of the IoT in various industries, leading to the emergence of new automation-driven services such as smart grids, smart farming, and healthcare. However, this increased demand for IoT devices has also resulted in a significant increase in cyberattacks. Since the notorious Mirai botnet targeted the IoT in 2016, numerous other botnets have arisen that have disrupted the normal functioning of devices and caused unauthorized data breaches, including breaches of personal information. Botnets are characterized by their ability to connect devices to command-and-control (C&C) servers for remote control communications, and they have facilitated large-scale cyberattacks, including distributed denial of service (DDoS) attacks [2]. Therefore, it is imperative to take prompt action to mitigate and prevent further damage from such attacks.
Establishing international standards for addressing IoT breaches is challenging due to the wide range and diversity of IoT devices. Standard practices involve developing response strategies tailored to each IoT environment based on guidelines such as NIST SP 800-86, which is intended for incident response and digital forensics in traditional network environments [3]. Additionally, NIST SP 800-86 highlights the impor of collecting evidence or relevant data during security incidents. Typically, IoT devices have limited storage capacity, and the heterogeneity and distributed nature of data storage can greatly influence the data collected from each device, meaning it is extremely difficult to gather pertinent information from their internal storage. Thus, the analysis of network traffic from device communications becomes equally crucial.
Fig. 1 presents statistics from a study conducted in 2023 on cyberattacks against the IoT [4]. According to this data, the damage caused by botnets has increased by more than five times and accounts for over 40% of the total DDoS-related damage. In this study, the proposed IoT network analysis framework is applied to two issues: detecting botnet infections through communication with C&C servers and identifying the sources of collected network traffic data.

Figure 1: Ratio of all DDoS attacks involving IoT botnets
The significance of analyzing network traffic has been increasing, with research trends in IoT network traffic analysis shifting towards methods that utilize artificial intelligence (such as machine learning or deep learning) rather than simple rule-based approaches. Specifically, traffic analysis methods that involve decrypting encrypted traffic can induce legal and regulatory concerns regarding the violation of personal information [5], which is why this trend is gaining further momentum. However, IoT devices cannot be expected to possess such high levels of computing performance, constraining network traffic analysis to the devices themselves [6]. Consequently, not participating in the network renders it improbable that a meaningful payload can be obtained from encrypted communications. Hence, this study suggests a framework for analyzing network activities using machine and deep learning, following the gathering of encrypted network traffic from outside the IoT network.
This paper presents an IoT network traffic analysis framework that employs machine learning. In particular, a versatile analysis framework is introduced that concurrently applies machine learning algorithms and deep learning algorithms, followed by an ensemble decision-maker. Unlike other frameworks designed to achieve high performance solely in specific scenarios, the suggested IoT network traffic analysis framework capitalizes on universally applicable features to enable fundamental analyses. Consequently, it can serve as a primary tool for incident investigation, such as in digital forensics.
The remainder of the paper is structured as follows: Section 2 examines relevant studies on botnet detection and device identification through IoT network analysis. Subsequently, Section 3 outlines the proposed IoT network traffic analysis framework. Section 4 presents the experimental setup and analysis of results to validate the framework’s efficacy, and Section 5 provides the discussion and conclusions.
According to the ISO 27400 standard for IoT device communication, encryption of communication data is recommended [7]. However, this data encryption can present challenges for conventional rule-based analysis methods. Consequently, a significant amount of current research on network traffic analysis focuses on the implementation of machine learning or deep learning techniques to manage encrypted payloads. The objective of this study was to perform experiments in two primary domains: the detection of C&C server interactions for botnet mitigation and the identification of network traffic. In this section, we review recent literature on the analysis of IoT network traffic. Table 1 presents the keywords that were employed to search for relevant studies. These keywords were used to locate research that employed machine learning for botnet detection or device identification through IoT network analysis. An additional requirement was imposed to restrict the search to studies published since 2022.
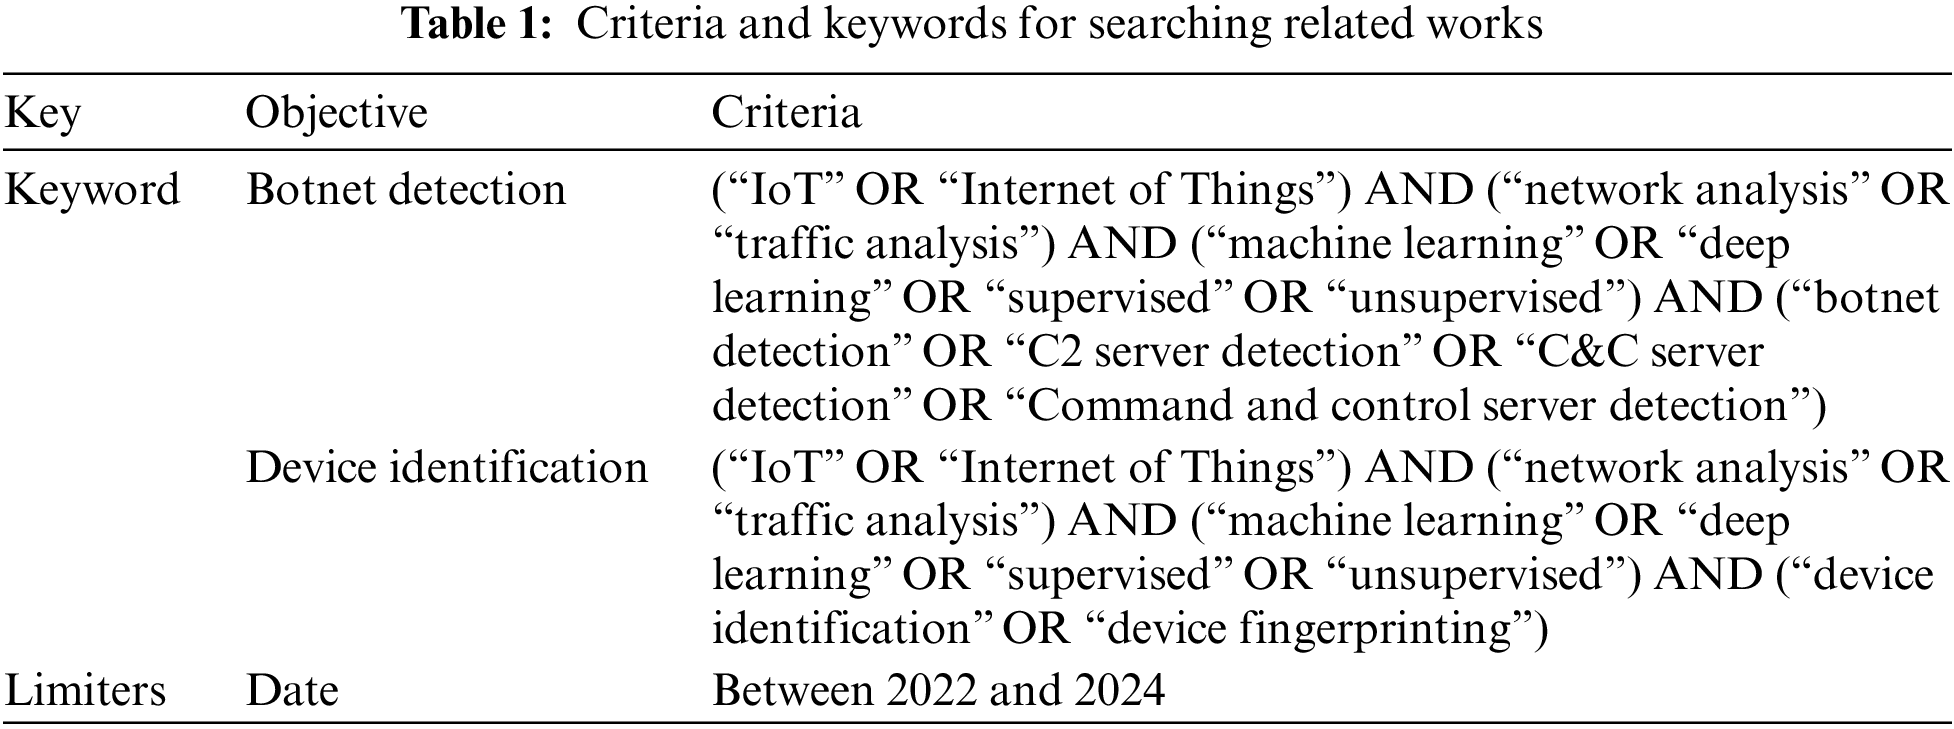
A total of 1671 studies met the search criteria specified in Table 1. Among these, a notable subset of 979 studies focused on botnet detection, while 692 studies were associated with device identification. All collected studies were then subjected to a screening process, and only those that met the following criteria were selected for further analysis:
• Did the study include concrete experiments and validate performance using appropriate evaluation metrics?
• Were the features used for model training described explicitly?
• Is it the public study that positions highest for search results sorted by relevance?
Kumar et al. proposed a solution entitled Early Detection of IoT Malware Scanning and CnC Communication Activity (EDIMA) to identify IoT botnets using eight features [8]. The experiments employed three classifiers: random forest (RF), support vector machine (SVM), and Gaussian Naïve Bayes (GNB). The results indicated that RF achieved exceptional performance, with an accuracy and F1 score of 1.0.
Geetha et al. developed and implemented a botnet detection model utilizing bidirectional long-short term memory (Bi-LSTM) [9]. The model was trained on 21 features and achieved an overall accuracy of 84.8%. However, due to the imbalanced nature of the training dataset, the F1 score was recorded as only 0.356.
Moorthy et al. extracted 9 features from a dataset consisting of 14 features and compared the performance of 7 detection models, including a decision tree (DT) [10]. The experiments revealed that the DT-based model achieved a final accuracy of 92.21%. Conversely, the model with the lowest performance was SVM, with an accuracy of 51.86%.
Duan et al. devised a resampling technique and botnet detection model by combining DT and an autoencoder. They selected 20 high-performing features for botnet detection [11]. The experiments demonstrated that botnets could be detected with 99.20% accuracy and an F1 score of 0.991 was achieved by addressing noise removal and data imbalances through resampling.
Wei et al. extracted a total of 21 statistical features and converted them into 3-channel RGB images to develop a network intrusion detection system for botnet detection [12]. The experiments were conducted using a convolutional neural network (CNN)-based model and revealed that normal traffic could be detected with an F1 score of 0.9999. Moreover, the analysis of botnet-related anomalous traffic achieved an average F1 score of 0.9945.
Thom et al. proposed an academic approach in which they utilized the multi-layer perceptron (MLP) model along with the Nilsimsa hash function to effectively classify and identify 22 distinct types of IoT devices [13]. As part of their methodology, the researchers extracted 32 integer values from the 32-byte hash values produced by the aforementioned hash function for training purposes. The results of their experiments indicated a promising device identification accuracy rate of 96.9%.
Salman et al. constructed a device identification model by extracting 16 features from network information collected from 7 IoT devices, using Recurrent Neural Network (RNN), CNN, and a residual neural network (ResNet) [14]. The experiments displayed an accuracy of 87.4% in identifying all seven devices. Furthermore, an additional experiment based on manufacturers’ information about the products improved the accuracy to 94.47%.
Wang et al. conducted experiments to identify 13 types of IoT devices based on 83 features using 4 classifiers: SVM, logistic regression (LR), DT, and RF [15]. The results indicated that the SVM-based model could classify with an accuracy of 78.27%. They also conducted re-experiments focusing on the top 10 features with the highest feature importance, resulting in a decreased accuracy of 65.43%.
Osei et al. performed IoT device fingerprinting using DT and an autoencoder for 27 types of IoT devices [16]. The model was trained on 14 features and successfully classified devices with an accuracy of 97%. Additionally, the authors demonstrated that the number of features could be reduced to five while maintaining accuracy.
Koball et al. built and validated a fingerprinting model to identify eight types of IoT devices [17]. They extracted 100 features from a total of 242 and constructed an unsupervised learning model based on K-means and density-based spatial clustering of applications with noise (DBSCAN). The model achieved an identification accuracy of up to 96.5% for each device.
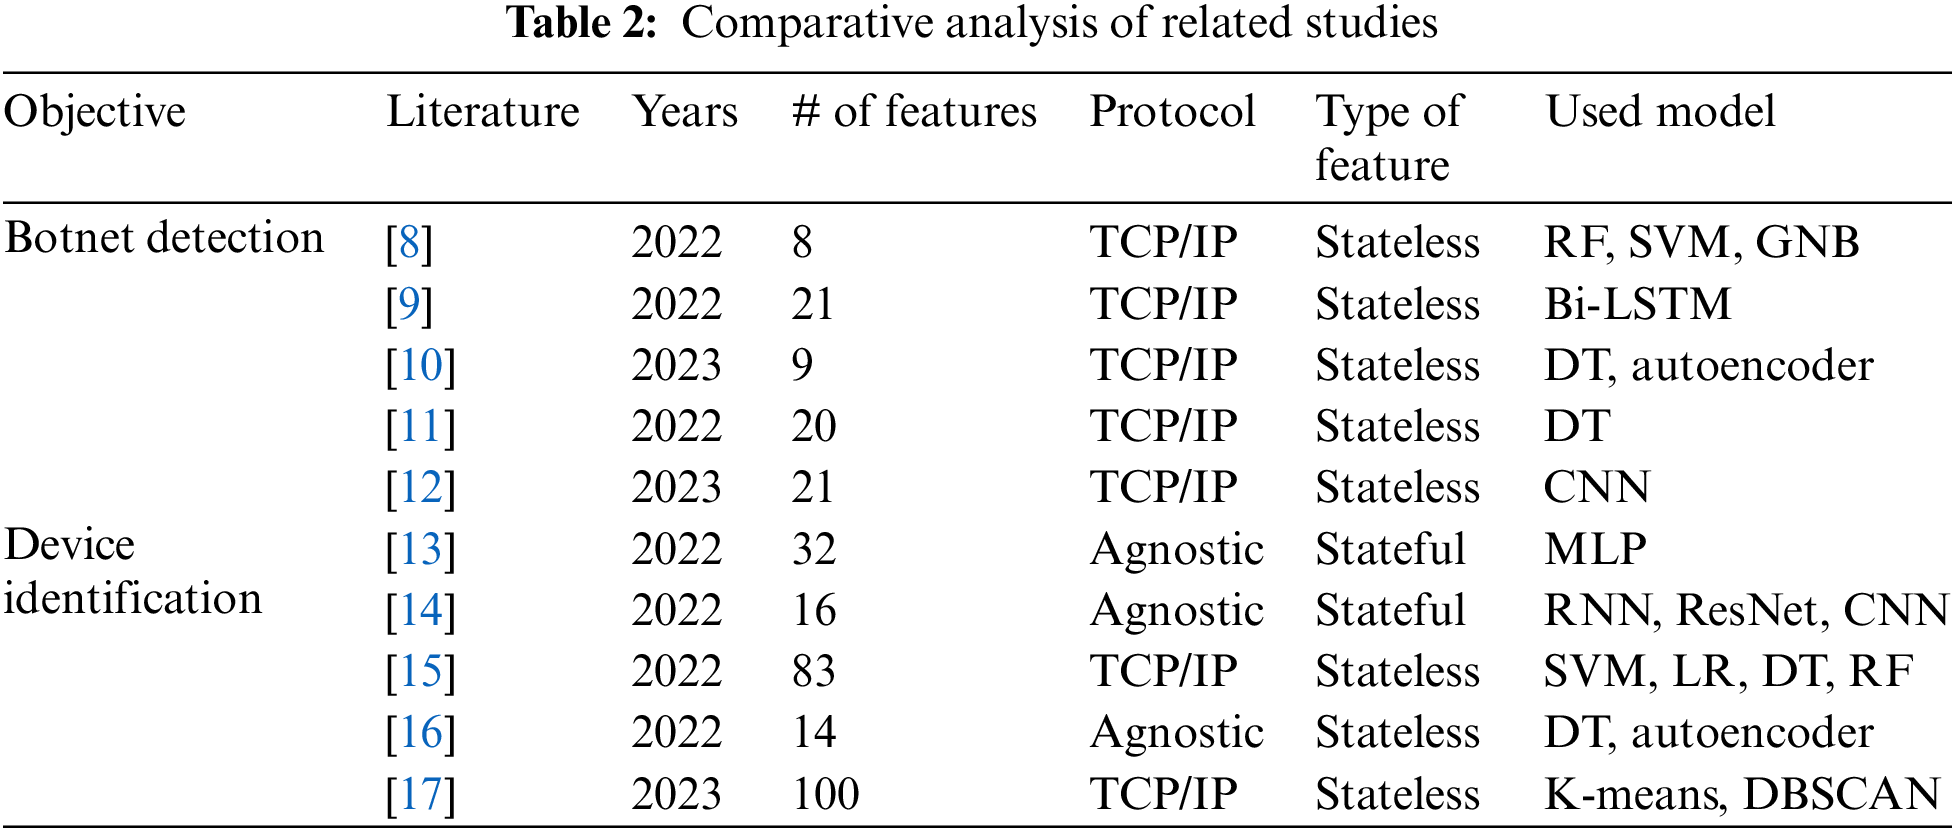
In Table 2, previously proposed frameworks are compared with the framework proposed in this paper. In most cases, the suggested analysis methods depended on protocols. Furthermore, previous research mainly focused on addressing specific situations, with few attempts to transfer one model to another completely. This is because the selection of features and preprocessing of values from the input data depend on the specific problem context. In contrast, the proposed framework includes features that can be extracted from basic header information, resulting in very low protocol dependency. The proposed framework is also designed to address a wide range of traffic analysis problems. In this study, two types of features (stateful and stateless) were combined, which previous studies have typically used independently. This approach allows for the analysis of a broader range of problem scenarios compared to existing research. Stateful features can be extracted from packet sequences and are designed to capture the time-series aspects of traffic, providing a detailed, micro-level view of traffic activity through a limited set of values. In contrast, stateless features consist of overall session statistics that do not delve deeply into traffic activity. However, they enable a macro-level analysis of session information and provide a more comprehensive overview. Therefore, a combination of stateful and stateless features was applied in this study to present a network analysis framework with low protocol dependency, and the performance was subsequently evaluated.
In this paper, we introduce a framework that aims to address the challenges of botnet detection and source identification. Machine and deep learning techniques are employed to analyze two types of features. Subsequently, a thorough analysis of the findings is presented, resulting in comprehensive insights. Fig. 2 illustrates the proposed framework for IoT network analysis.

Figure 2: Proposed framework for IoT network analysis
First, traffic data collected from outside the IoT network are preprocessed and converted into the JSON format. In cases where a substantial number of packet capture files are obtained, the files can be divided into training and testing data, which could include communication between the same devices. Consequently, the JSON data consistently contain metadata that denotes session information, training data, testing data, and labels. The architecture of the resulting JSON file is illustrated in Fig. 3.

Figure 3: Architecture of the generated JSON file
The proposed framework employs both stateful and stateless features, as elaborated upon in Section 2. Table 3 provides an inventory of the stateless features, encompassing data distribution attributes such as packet size or capture time. These stateless features can be derived from three primary sources: the packet count, packet size, and time interval between packets.
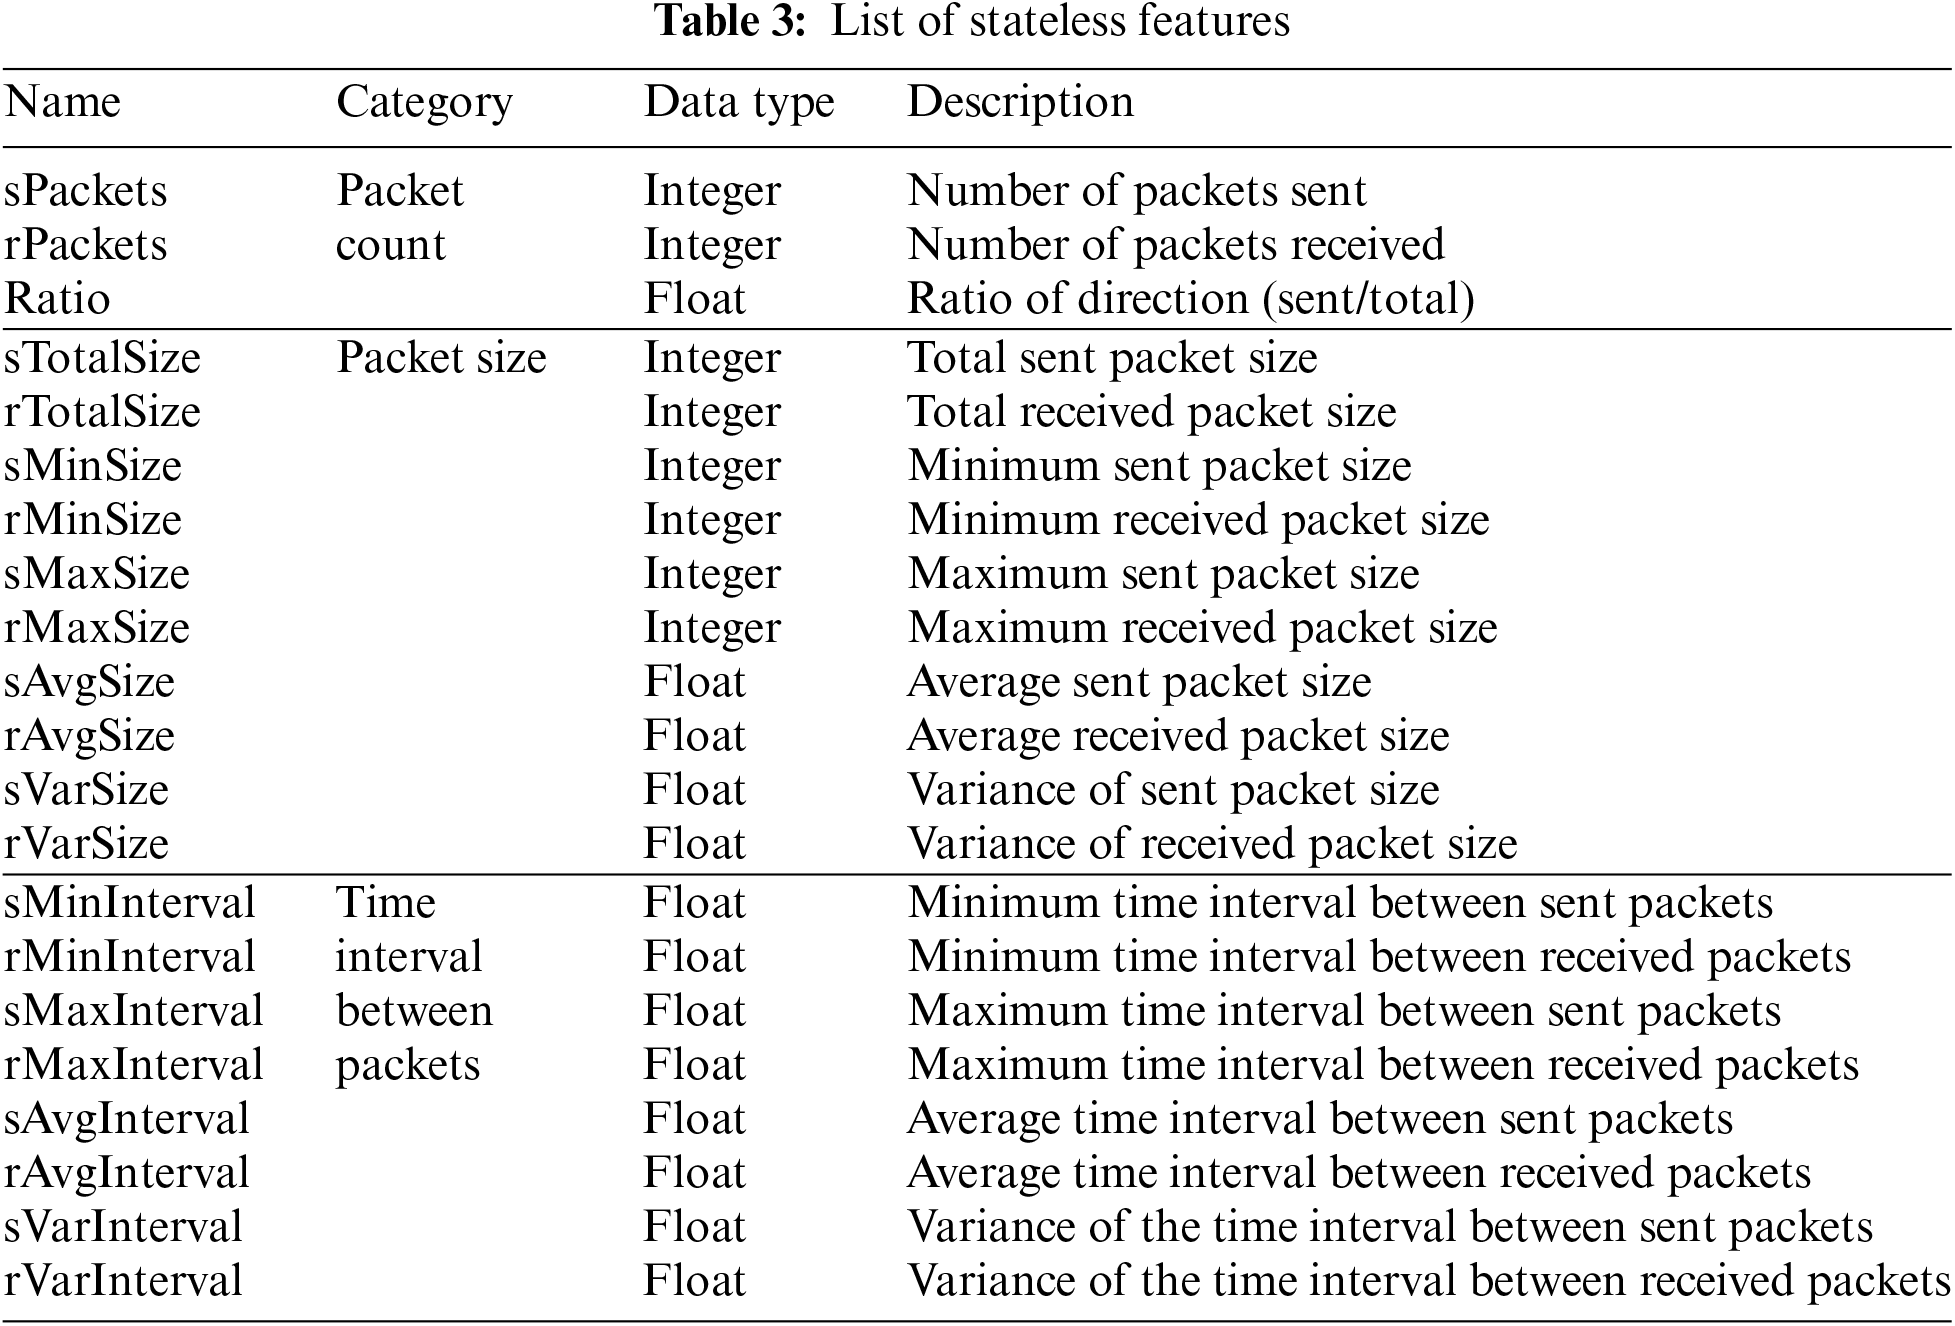
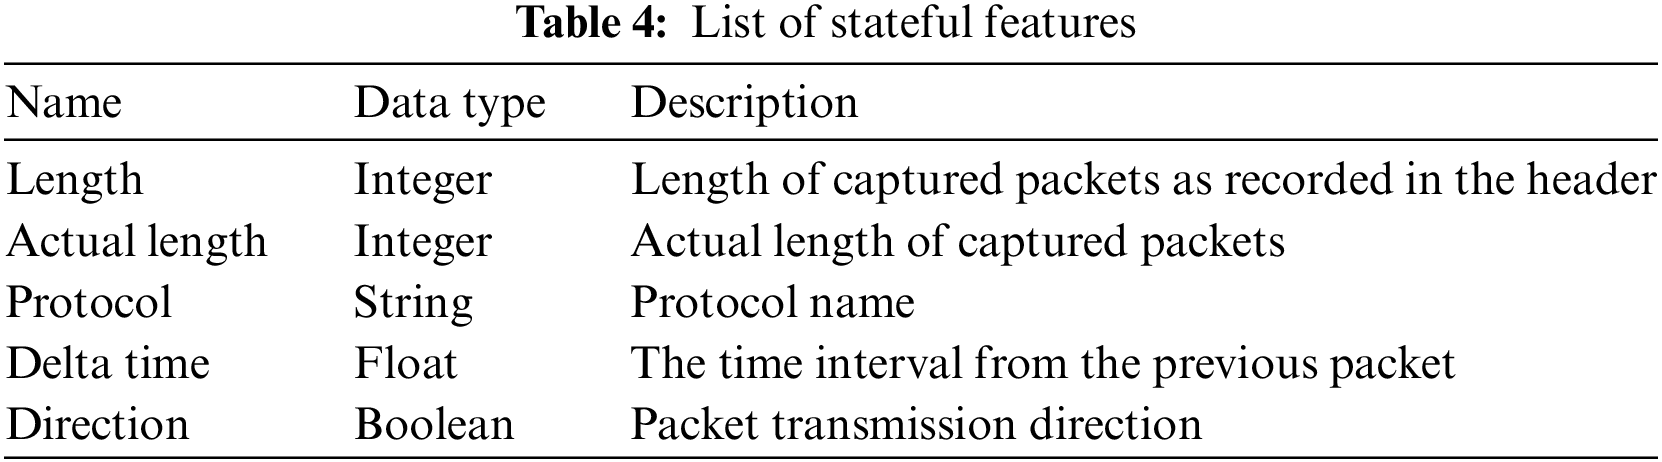
Table 4 provides an enumeration of the stateful features. Although there are fewer stateful features than stateless features, they can facilitate a more comprehensive analysis due to the time-series attributes of certain features. It should be noted that both the proposed stateful and stateless features exhibit a limited reliance on specific protocols, allowing applicability in diverse network environments.
Gathering data from all packets within a session is deemed superfluous when extracting packet-based features for the purpose of training and testing data. As indicated by Lopez-Martin et al., the collection of only 5 to 15 packets per session does not significantly impede the performance of network analysis [18]. Consequently, this research focuses solely on extracting packet features from the initial eight packets of each file. In instances where a file contains fewer than eight packets, the feature count is preserved by padding the remaining spaces with null, zero, or one, based on their inherent characteristics. The extraction process of stateful features is illustrated in Fig. 4.

Figure 4: Process of stateful feature extraction
Algorithm 1 presents the pseudocode for a preprocessing module designed to extract features in an academic context. Each packet from a network traffic file is classified and stored based on similar sessions using the session classifier module. The classification of a packet into a session is determined by comparing four factors: the protocol, source identifier, destination identifier, and additional identifier. If the target packet is found to belong to a previously identified session, it is added to that session in chronological order. However, if the packet is not recognized as part of an existing session, it is recorded as the initial communication of a new session. After classifying all the packets, both stateful and stateless features are extracted from each session.

3.3 Analysis Using Machine Learning
Various algorithms were trained on two different types of features obtained through preprocessing. The stateful features, collected from each of the eight packets within a session, are represented as 2D data due to their time-series nature. Consequently, deep learning algorithms specifically designed to manage time-series data (such as RNN or CNN) are suitable for training. In comparison, the stateless features lack time-series characteristics and can be represented as 1D data for each session. This renders them suitable for analysis using machine learning algorithms such as RF or extreme gradient boosting (XGBoost), which have a simpler structure compared to deep learning.
The proposed framework involves a decision-making process based on the outcomes derived from these features. Algorithm 2 presents the pseudocode for an ensemble process that combines the results from these two types of features. If the labels indicated by the two results are the same, they are selected as the outcome. If the labels differ, an ensemble is performed using the soft voting technique, which involves both models. The mathematical expression for this concept is articulated as follows: Given

The conclusions derived from the results of the network analysis play a crucial role in determining the outcome. In this study, a range of metrics were employed to assess the effectiveness of the proposed framework, including accuracy, precision, recall, and the F1 score. Accuracy measures the proportion of correct predictions to total predictions and is a commonly used performance metric. However, this should not be the sole basis for evaluation because it can be influenced by true negatives and could result in exaggerated accuracy values. To address this limitation, precision and recall are used as complementary performance metrics, placing significant emphasis on true positives. Consequently, a comprehensive evaluation of these metrics is required. Finally, the F1 score is derived from a consideration of precision and recall and is particularly sensitive to cases where either precision or recall approaches zero.
A confusion matrix is employed to calculate accuracy, precision, recall, and the F1 score. The confusion matrix is a machine learning performance evaluation metric, represented in a tabular format. It includes the following components: True Positives (TP), which is the count of instances where the model correctly identifies positive input data as positive; True Negatives (TN), which is the count of instances where the model correctly identifies negative input data as negative; False Positives (FP), which is the count of instances where the model incorrectly identifies negative input data as positive; and False Negatives (FN), which is the count of instances where the model incorrectly identifies positive input data as negative. Eqs. (2)–(5) illustrate the calculations for accuracy, precision, recall, and the F1 score based on these values of TP, TN, FP, and FN.
The experiments were conducted in two categories: proactive detection of IoT botnet attacks targeting C&C servers and identifying network traffic data sources to validate the framework efficacy proposed in Section 3.
This experiment was conducted to detect botnet attacks targeting IoT devices, as illustrated in Fig. 5.

Figure 5: Botnet identification experiment flow
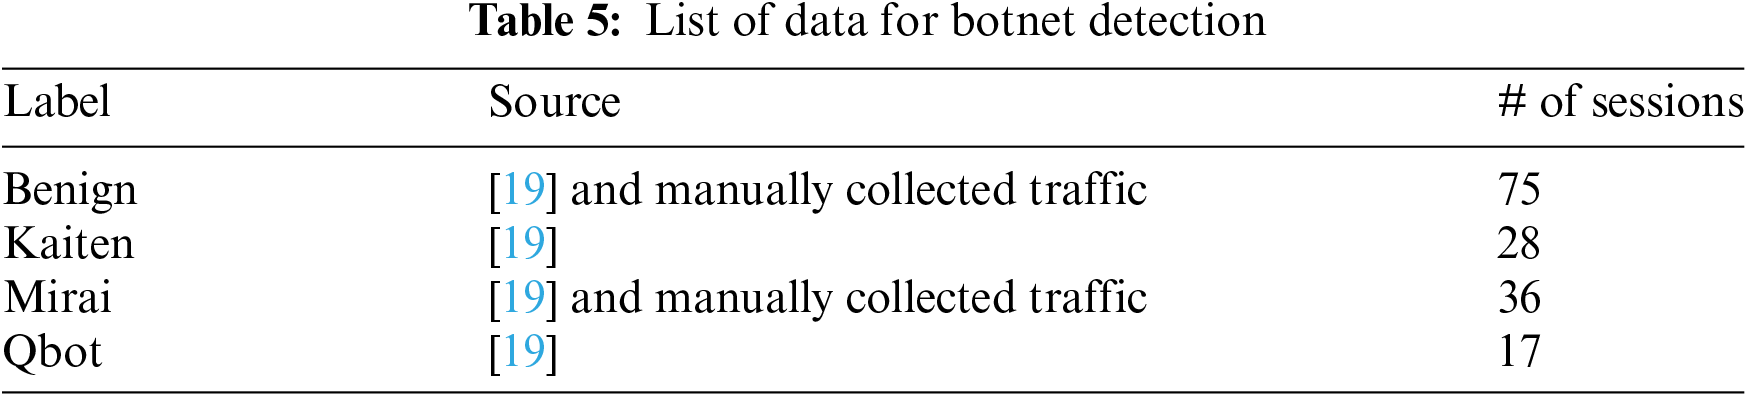
Network traffic data collected from three different types of botnets (Kaiten, Mirai, and Qbot) were employed to identify botnet infections by analyzing their communication with C&C servers [19]. This dataset consisted of communication traffic data between IoT devices that had been infected by the aforementioned botnets and C&C servers, but this dataset only provides preprocessed data and does not provide information about the detailed behavior of the C&C server. A proportion of the communication data was obtained from a securely isolated virtual sandbox environment for training and testing. The malware and C&C server code used utilized the mirai source code uploaded to the GitHub public repository [20]. Table 5 provides detailed information regarding the final dataset that was used in the experiment aimed at detecting C&C servers and identifying botnet infections.
The experiment included preprocessing steps to extract the two types of features in the proposed framework. Each packet was categorized into sessions based on the collected IP addresses, ports, and protocols. 21 stateful features and five stateless features were then extracted from each session.
Fig. 6 presents a box plot of each label, allowing a visual assessment of the potential impact of the stateful features proposed in this study on classification. However, it should be noted that certain stateful features, such as direction and protocol, have limited values that can be extracted from the dataset, rendering their representation in a box plot unsuitable. The statistical data displayed in the box plot indicates that abnormal traffic generally exhibits less dispersed data compared to normal traffic. This is probably because communication with the C&C server typically occurs periodically and in an automated manner. In contrast, normal traffic data demonstrates higher entropy due to the diverse communication patterns that arise from different situations.

Figure 6: Box plot for botnet detection
4.1.3 Analysis Using Machine Learning
Two independent models were developed that employed ensemble techniques involving machine and deep learning models. A machine learning model was created to analyze stateless features using two algorithms: RF and XGBoost. In addition, two deep learning algorithms (CNN and LSTM) were designed to process 2D data and possessed distinct characteristics. The final decision was made through a soft voting ensemble decision-maker, which considered the accuracy of both models.
The training processes of the models varied depending on the selected algorithm. The model for stateful features was automatically generated with optimal hyperparameters using the Keras_tuner library. In contrast, the model for stateless features was selected as the final model based on the highest analysis performance utilizing GridSearchCV. Table 6 displays the layer structure and configuration values of the model for analyzing stateful features, while Table 7 presents the structure of GridSearchCV for analyzing stateless features. The unit value in the Dense layer of Table 6, referred to as “Number of classes,” is determined by the problem context and training data. This represents the number of classes the final model needs to analyze. There are four classes in the botnet detection experiment, as mentioned in Table 5.
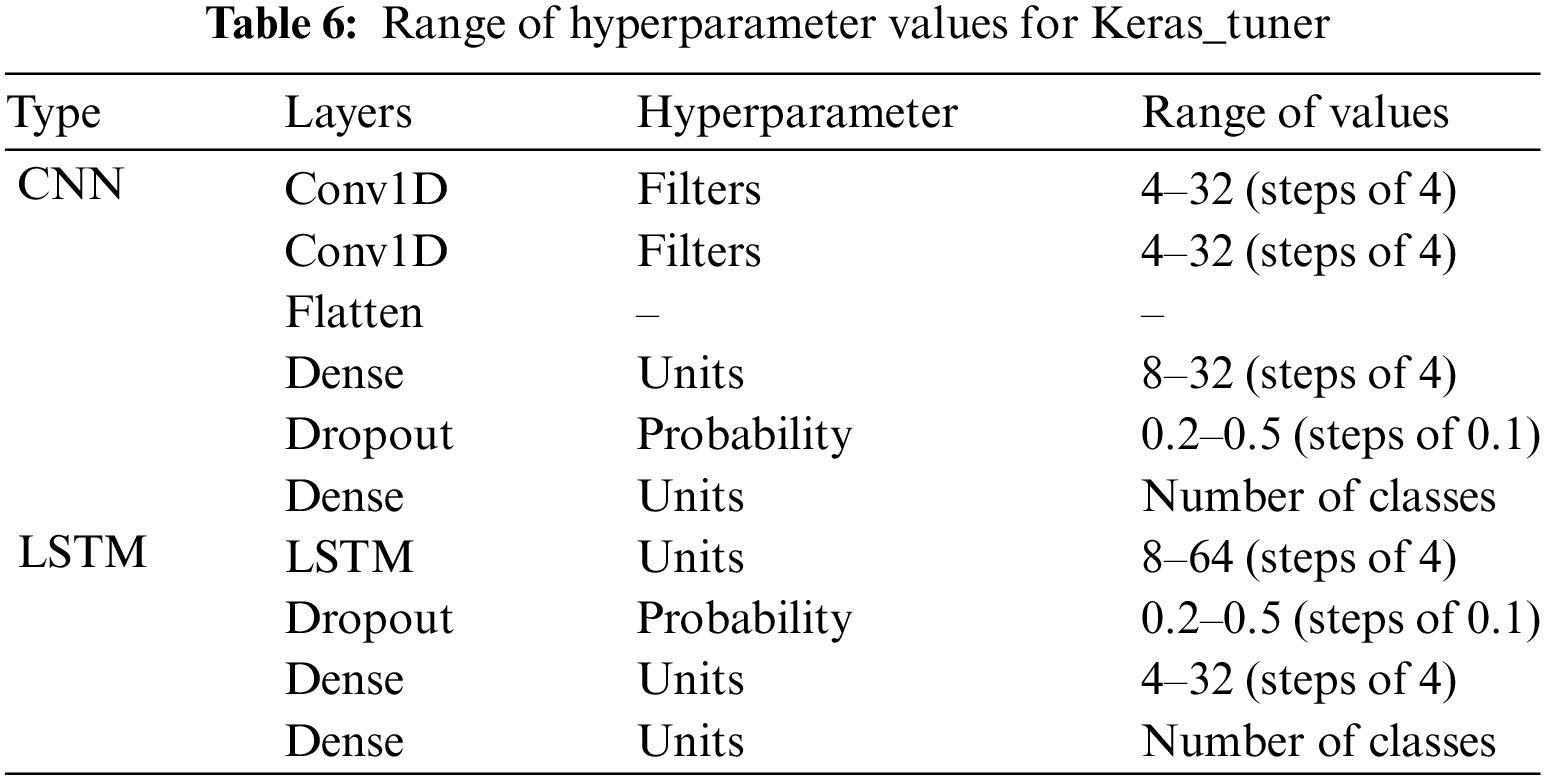
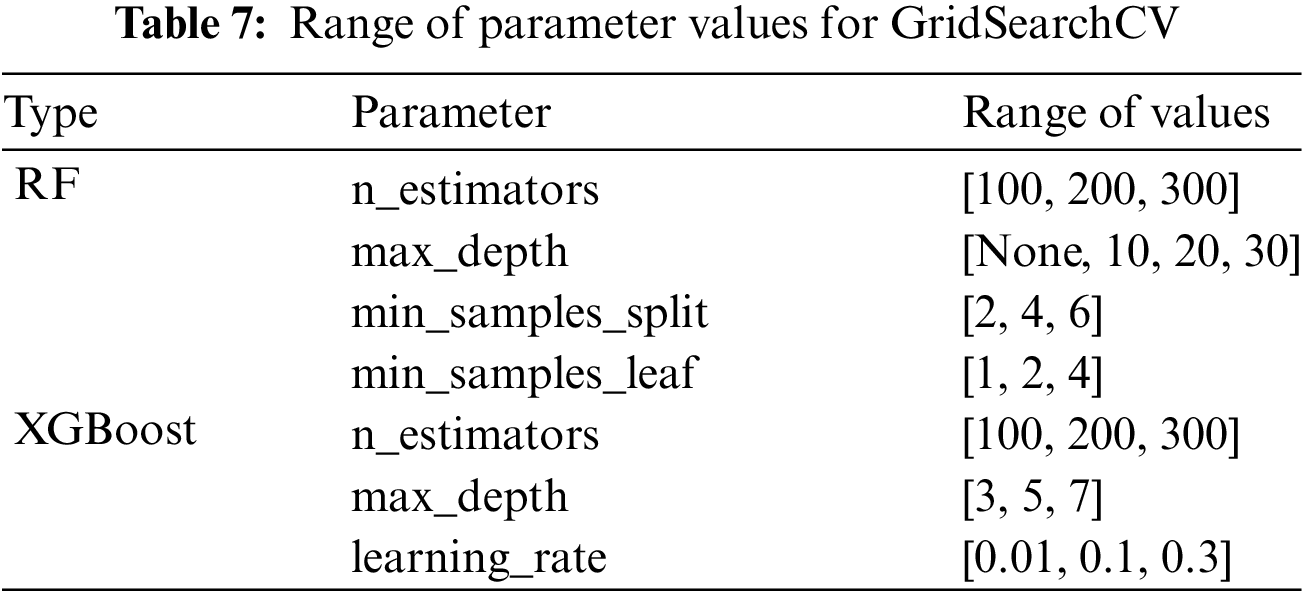
Fig. 7 depicts the epoch-loss graph generated during the data training phase of the experiment.

Figure 7: Epoch-loss graph for botnet detection
Table 8 presents a comparison of the performance metrics for an experiment conducted on detecting C&C server communications using the proposed framework. The metrics were calculated using the macro-average method to address the data imbalance issues that occur during training and evaluation in a multiclass problem scenario. The RF algorithm alone achieved the highest accuracy in resolving this problem. Nevertheless, the average performance metrics obtained from the proposed framework did not demonstrate substantial deviations in accuracy when compared to the RF model in isolation.
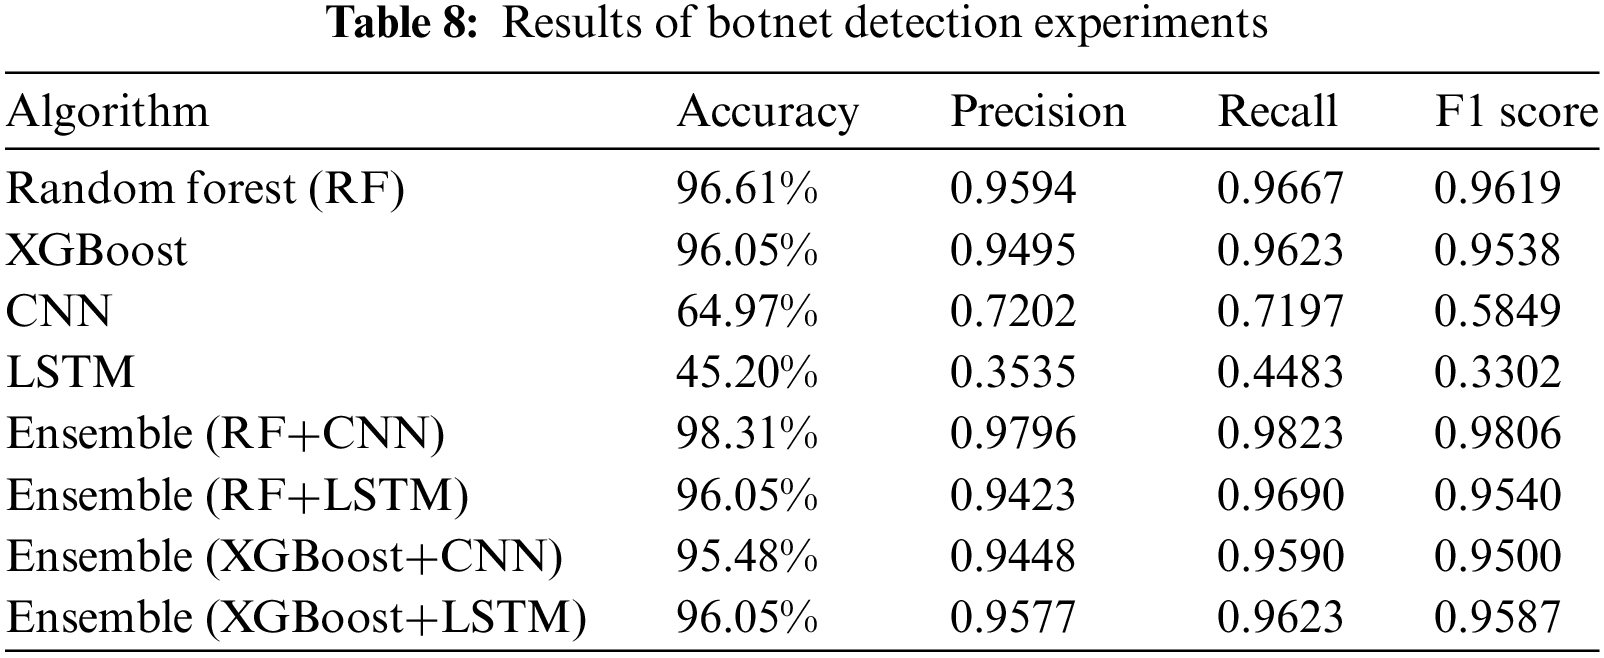
Fig. 8 presents a confusion matrix that illustrates the outcomes of the ensemble method, which combined RF and LSTM. The results demonstrate the optimal performance in botnet detection within the conducted experiment under the proposed framework. However, Table 4 confirms that although the botnet detection experiment was successful, an imbalance was exhibited due to insufficient botnet session data. This imbalance could potentially introduce bias in the results. To address this issue, it is suggested to collect additional malicious traffic data and conduct further experiments using an expanded dataset. This approach would enable refining the results to mitigate the aforementioned problem.
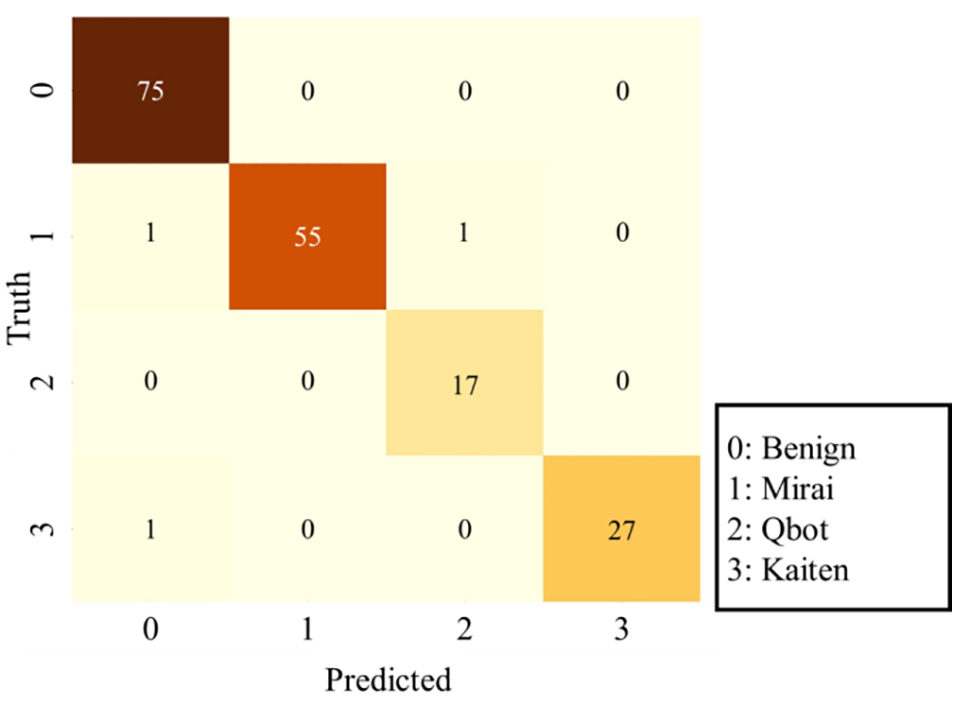
Figure 8: Confusion matrix for botnet detection
Fig. 9 illustrates a graphical depiction of feature importance, shedding light on the impact of stateless features trained with RF and XGBoost on real-world multi-classification problems. The analysis uncovers that the rMinSize feature holds the utmost significance in both models. This discovery implies that conducting network analysis based on the minimum length of collected incoming packets is a valid method for identifying communication with the C&C server. Furthermore, both models assign higher importance to packet size as opposed to the time interval between packets. This is likely because Communication with the C&C server tends to occur less frequently, to emulate typical communication patterns.

Figure 9: Importance of stateless features from botnet detection experiments
Fig. 10 illustrates the experiment to identify device sources in an IoT network.

Figure 10: Device identification experiment flow
In this study, we obtained communication data from nine different types of IoT devices to perform device identification using the CIC IoT dataset 2022 [21]. Moreover, a distinct network environment was established to gather traffic data from four types of IoT devices that were not present in the dataset, to acquire information about these devices. Fig. 11 illustrates the specific configuration of the IoT environment that was arranged for this experiment.

Figure 11: IoT network environment configured for experimental purposes
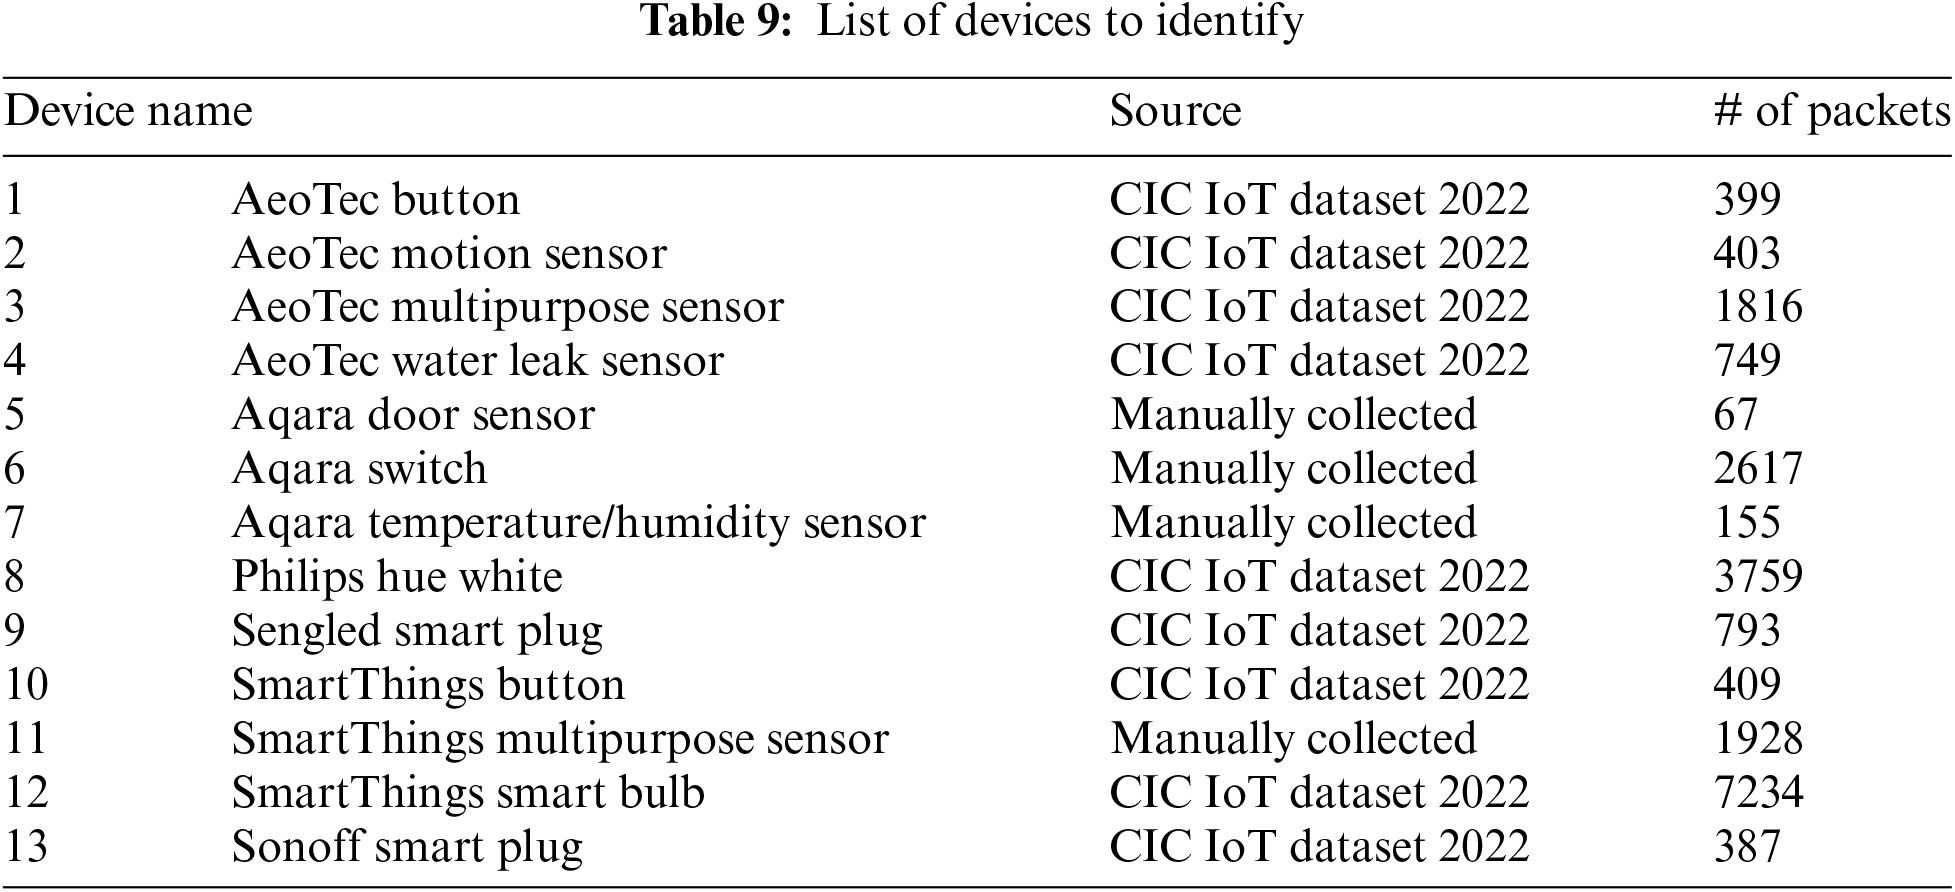
Table 9 presents a comprehensive list of the devices that were the focus of the IoT device identification experiment. Significantly, the number of packets obtained from these devices exhibited notable variations. It is important to acknowledge that employing the entirety of this data might potentially undermine the performance of the experiment due to an imbalance in the data during the training phase. Nonetheless, this study undertook a modest approach to address the issue of data imbalance by exclusively training on the initial eight packets from each session.
The preprocessing techniques employed in this experiment for feature extraction were predominantly consistent with those used in previous experiments. However, due to the inclusion of targeted devices that used the Zigbee protocol, the session-determining algorithm was enhanced to incorporate identification and classification based on personal area network identification. This additional step facilitated the extraction of a cohesive 26-dimensional vector from devices employing different protocols.
Fig. 12 presents a box plot displaying the extracted labels to visually assess the impact of the stateful features proposed in this study on classification. The box plot reveals that there was a resemblance in the communication patterns of specific products, particularly those produced by AeoTec. It should be noted that manufacturers commonly advise connecting their devices with coordinators from the same manufacturer, resulting in comparable communication styles [22]. While this similarity could complicate detailed analysis, it can also serve as evidence of the product’s manufacturer, which is especially valuable when dealing with unfamiliar devices.
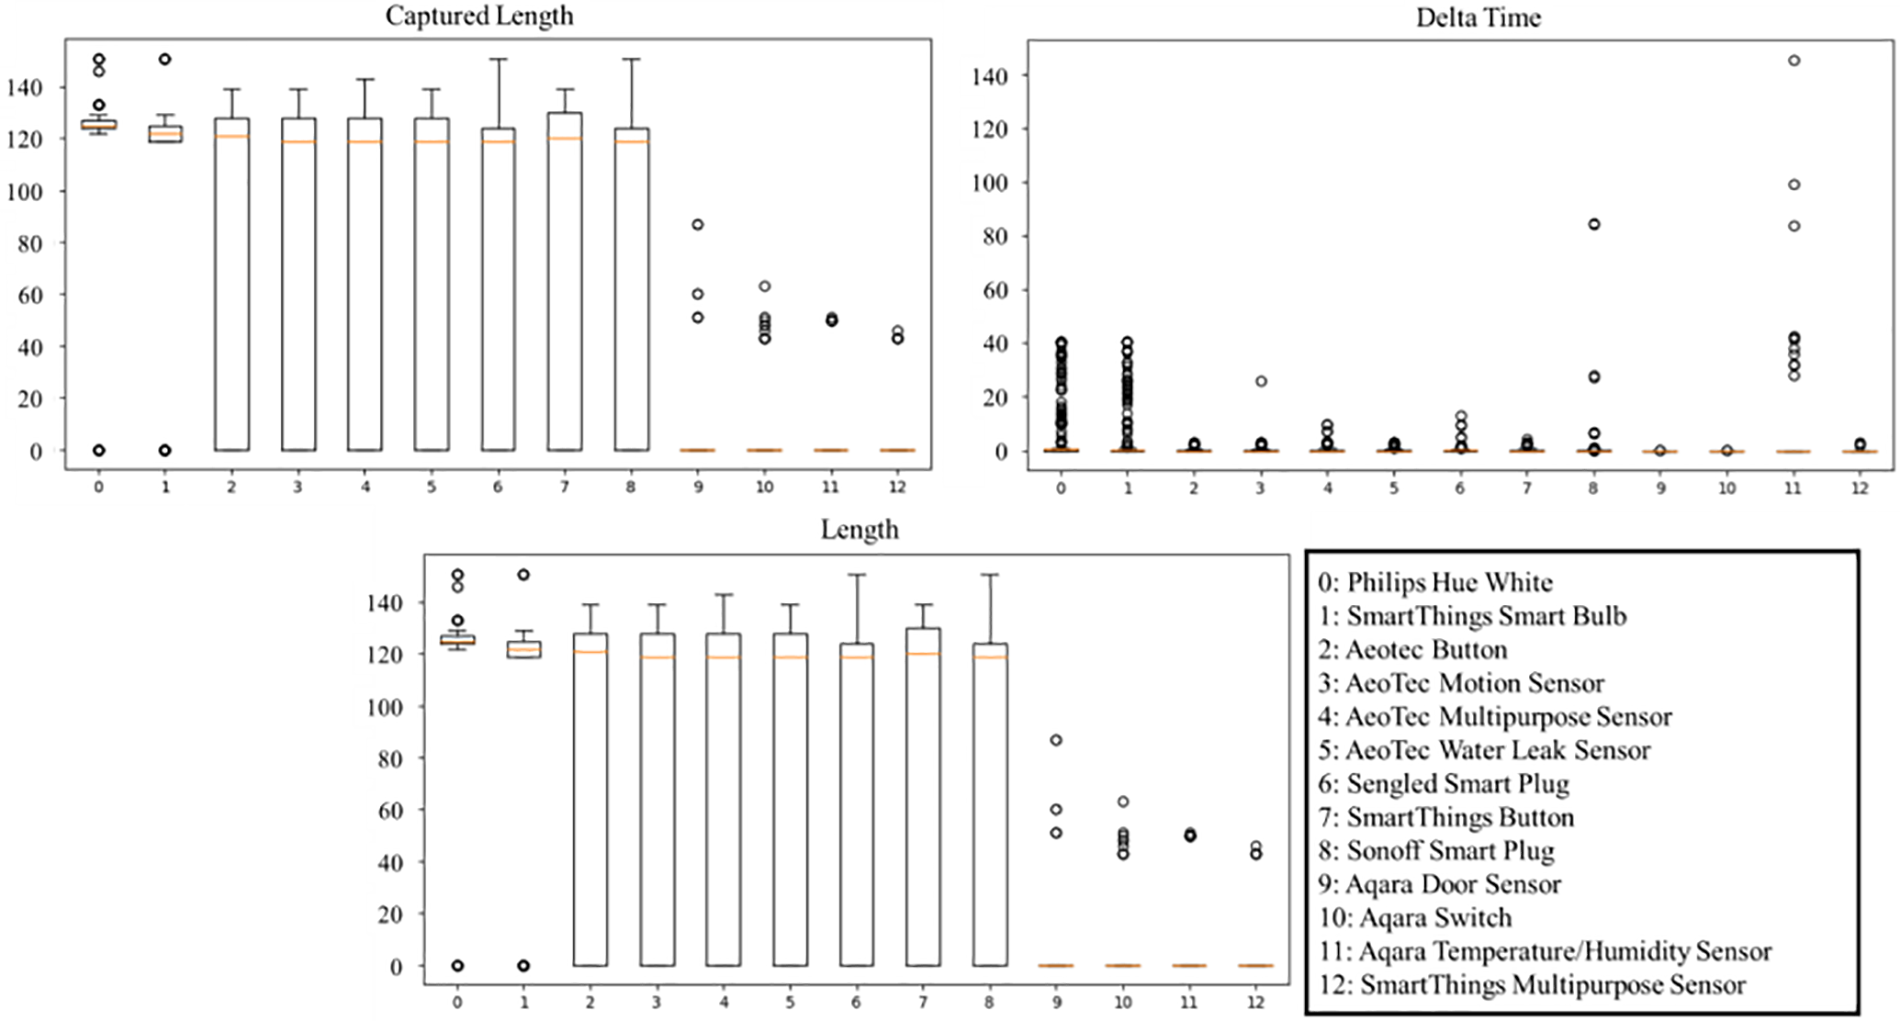
Figure 12: Box plot for device identification
4.2.3 Analysis Using Machine Learning
The model training process for this experiment was conducted in the same manner as the procedure for identifying botnet infections. The configuration values used for the Keras_tuner library and the GridSearchCV module for model training are the same as those presented in Tables 6 and 7. Fig. 13 presents a plot of the epoch-loss graph generated during the data training phase of this experiment.

Figure 13: Epoch-loss graph for device identification
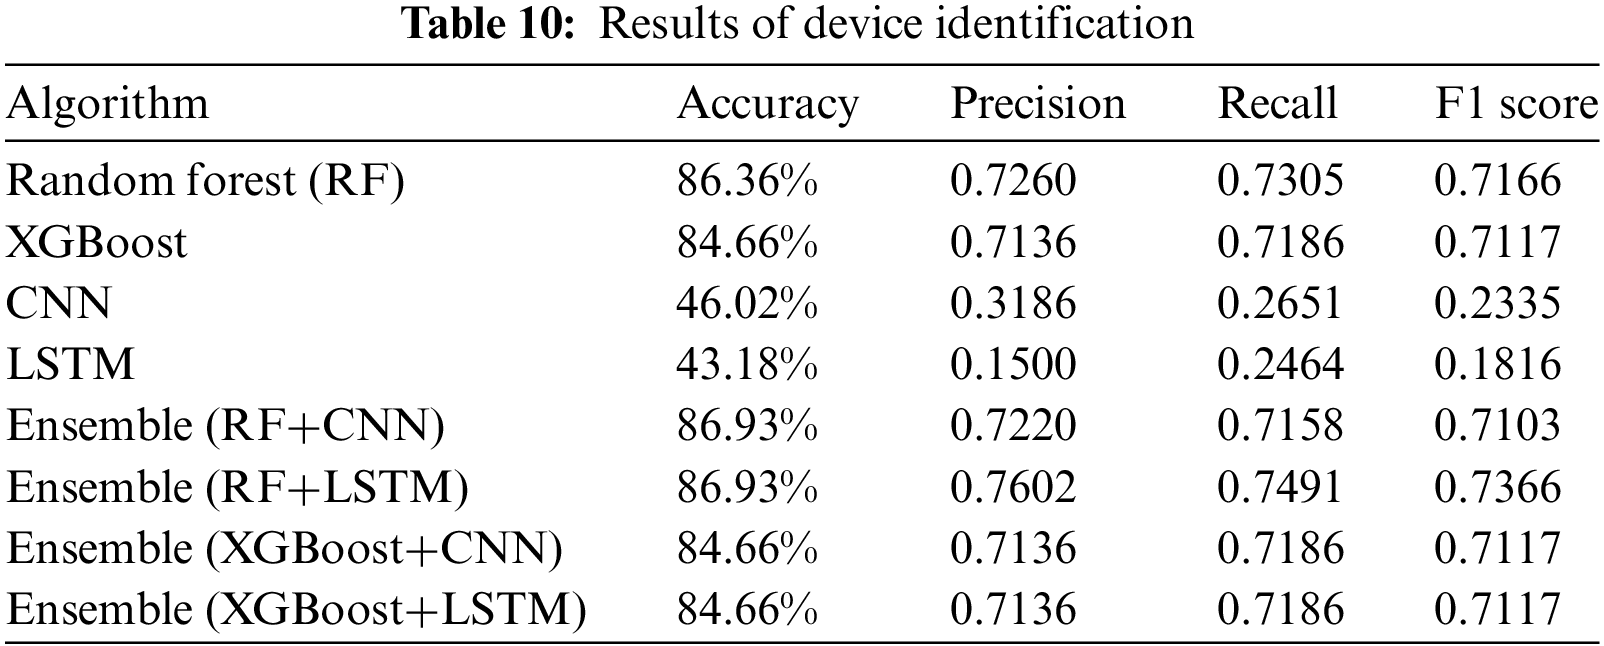
Table 10 presents a comprehensive performance evaluation of the device identification experiment. The findings suggest that the average performance was comparatively lower than the results obtained from the botnet detection experiment. Nevertheless, certain outcomes achieved through the implementation of the proposed ensemble techniques exhibited greater accuracy in comparison to those obtained from a single model. This enhancement was attributed to employing the ensemble method, which allowed for the integration of varying conclusions from each model.
The lower accuracy of the device identification experiment compared to the botnet detection results can be assessed from two perspectives. First, inherent similarities could exist depending on the device manufacturers and models within the data. Fig. 14 presents the confusion matrix derived from the model combining the RF and CNN, which displayed the highest accuracy. This confusion matrix suggests that although the overall accuracy for products from AeoTec was approximately 67.86%, the individual accuracy rates were lower. This implied the need for a more stringent and refined analysis of devices from the same manufacturer and training on a larger dataset. Despite having a greater variety of preset labels, the limited dataset also contributed to performance degradation. This is a common problem in supervised learning, where a large, well-prepared dataset is necessary for higher performance. Continuous data collection from a more diverse range of devices would be expected to improve accuracy beyond the levels achieved in this experiment.

Figure 14: Confusion matrix for device identification
Fig. 15 presents an assessment of the importance of features in real-world multi-classification problems. The analysis highlights the significance of stateless features learned by both RF and XGBoost models. Similar to the botnet detection experiment, it is clear that the XGBoost model places greater emphasis on packet size compared to the RF model. Importantly, the experiment indicates that communication with the C&C server primarily reveals classifiable information in incoming packets. However, this study also demonstrates that IoT devices extract valuable information from the packets they transmit to external entities. This finding is further corroborated by the RF model, which suggests that features extracted from transmitted packets generally carry greater importance than those derived from received packets.

Figure 15: Importance of stateless features from device identification experiments
To evaluate the effectiveness of the proposed framework in addressing common challenges in network analysis, performance evaluations were conducted in two distinct scenarios. The findings clearly demonstrate that the classifier, which combines both types of models simultaneously, outperforms the individual models. Fig. 16 presents a visual comparison of the performance between the single model and the ensemble model in each experiment. The depicted single model in the figure represents the one with the highest accuracy among the four individual models used in each experiment. In cases where two models demonstrate the same level of accuracy, the model with the superior F1 score is selected and depicted in the figure. This selection methodology is consistently applied to the ensemble model as well.

Figure 16: Comparison of the performance between the single model and the ensemble model
The performance graphs indicate that, despite the fact that the proposed framework may not show a significant improvement in accuracy, the conditional soft voting technique used in the ensemble process effectively reduces false positives. This reduction leads to a maximum increase of 0.02 in the F1 score. As a result, the network analysis model based on the proposed framework demonstrates the potential to address false positives that may occur in conventional network analysis frameworks.
Additionally, our observations indicate that the performance remains relatively consistent, regardless of the various problem scenarios considered in this study. This consistency suggests that the framework, which incorporates both stateful and stateless features, has the potential to become a versatile IoT network analysis framework and tool. With further consideration and experimentation, its performance could be significantly improved.
In this study, we implemented and validated the proposed framework using established datasets and network traffic data from an authentic IoT environment. To assess the effectiveness of the framework, we employed confusion matrices and numerical evaluation metrics. Interestingly, although the framework did not demonstrate superior performance in specific scenarios, it effectively addressed various well-known network analysis problems. This suggests that a single ensemble model, trained on general features, can effectively solve diverse network analysis problems without the need for additional fine-tuning procedures. However, since this study focused exclusively on botnet infection detection and device identification, future research should aim to validate the framework’s efficacy in addressing a broader range of issues. Furthermore, although the deep learning model exhibited relatively low average performance in analyzing stateful features, the combined utilization of both stateful and stateless features resulted in higher accuracy compared to solely using the machine learning model for analyzing stateless features. This indicates that enhancing the performance of the stateful features analysis model in future research could significantly improve the overall performance of the ensemble decision-maker.
Also, the impact of stateless features on IoT network analysis has been examined through feature importance analysis. This analysis was facilitated by evaluating the stateless features using decision tree-based models such as RF and XGBoost. In contrast, models like CNN and LSTM, which were employed for analyzing stateful features, encounter difficulties in determining the relative importance of individual features in network analysis.
To enhance performance and enhance our comprehension of feature influence, further research will be conducted. This research will encompass additional analyses aimed at precisely identifying which features exert the most significant impact. We anticipate that this approach will yield valuable insights into the optimal number of packets per session required to effectively extract stateful features and the appropriate weight to assign to each feature. Ultimately, this will contribute to achieving higher overall performance in IoT network analysis.
This paper introduces a machine-learning framework for analyzing network traffic in IoT security incidents. Two experiments were conducted to validate the framework’s effectiveness in identifying and responding to breaches in IoT security. The first experiment focused on detecting botnet infections by identifying communications with command-and-control servers, while the second experiment aimed to identify the sources of these artifacts for device identification. The results demonstrated that the use of ensemble techniques in the device identification scenario improved the overall performance of traffic analysis. This suggests that the parallel analysis approach proposed in this study, which incorporates both stateful and stateless features, allows for a more comprehensive evaluation. Therefore, the proposed framework has the potential to address other problem scenarios beyond those investigated in this study. To further enhance the framework, future research should involve conducting additional experiments using different protocols and devices, as well as validating its efficacy in diverse scenarios.
It is important to note that all algorithms used in the proposed framework are supervised learning algorithms. As a result, their effectiveness in analyzing unknown attacks and devices may be limited. One possible solution could be to build machine learning models using larger datasets. However, creating datasets that encompass the exponentially increasing number of IoT devices poses significant challenges. Thus, future research should explore the use of unsupervised learning algorithms to include scenarios involving zero-day attacks and lesser-known devices.
Acknowledgement: We would like to express our sincere gratitude to our colleagues at the System Security Research Center in Chonnam National University. In particular, we extend our appreciation to Dong-Hyuk Shin for his insightful comments on the manuscript. Additionally, we would like to acknowledge the anonymous reviewers for their meticulous and constructive feedback on our work.
Funding Statement: This work was partly supported by Innovative Human Resource Development for Local Intellectualization program through the Institute of Information & Communications Technology Planning & Evaluation (IITP) grant funded by the Korea government (MSIT) (IITP-2024-00156287, 50%) and funded by the Institute for Information & Communications Technology Planning & Evaluation (IITP) grant funded by the Korea government (MSIT) (No. 2022-0-01203, Regional Strategic Industry Convergence Security Core Talent Training Business, 50%).
Author Contributions: The authors confirm contribution to the paper as follows: Conceptualization, Seung-Ju Han, Seong-Su Yoon; methodology, Seung-Ju Han, Ieck-Chae Euom; validation, Seong-Su Yoon, Ieck-Chae Euom; investigation, Seung-Ju Han, Seong-Su Yoon; writing—original draft preparation, Seung-Ju Han, Seong-Su Yoon, Ieck-Chae Euom; writing—review and editing, Seung-Ju Han, Ieck-Chae Euom; project administration, Ieck-Chae Euom; funding acquisition, Ieck-Chae Euom. All authors reviewed the results and approved the final version of the manuscript.
Availability of Data and Materials: The data used in the study is located in https://github.com/pezluna/iot-network-analyzer/ (accessed on 25 July 2024).
Ethics Approval: Not applicable.
Conflicts of Interest: The authors declare that they have no conflicts of interest to report regarding the present study.
References
1. Shin DH, Han SJ, Kim YB, Euom IC. Research on digital forensics analyzing heterogeneous internet of things incident investigations. Appl Sci. 2024;14(3):1128. doi:10.3390/app14031128. [Google Scholar] [CrossRef]
2. Alaiz-Moreton H, Aveleira-Mata J, Ondicol-Garcia J, Muñoz-Castañeda AL, García I, Benavides C. Multiclass classification procedure for detecting attacks on MQTT-IoT protocol. Complexity. 2019;2019(1): 6516253. doi:10.1155/2019/6516253. [Google Scholar] [CrossRef]
3. Kent K, Chevalier S, Grance T. Guide to integrating forensic techniques into incident. Tech Rep. 2006;1:800–86. [Google Scholar]
4. Nokia. Threat intelligence report. 2023. Available from: https://www.nokia.com/networks/security-portfolio/threat-intelligence-report/. [Accessed 2024]. [Google Scholar]
5. El Baz D. IoT and the need for high performance computing. In: 2014 International Conference on Identification, Information and Knowledge in the Internet of Things, 2014; Beijing, China: IEEE; p. 1–6. [Google Scholar]
6. Bakhshi T, Ghita B. Anomaly detection in encrypted internet traffic using hybrid deep learning. Secur Commun Netw. 2021;2021(1):5363750. doi:10.1155/2021/5363750. [Google Scholar] [CrossRef]
7. International Organization for Standardization. IoT security and privacy. ISO Standard No. 27400; 2022. Available from: https://www.iso.org/standard/44373.html. [Accessed 2024]. [Google Scholar]
8. Kumar A, Shridhar M, Swaminathan S, Lim TJ. Machine learning-based early detection of IoT botnets using network-edge traffic. Comput Secur. 2022;117:102693. doi:10.1016/j.cose.2022.102693. [Google Scholar] [CrossRef]
9. Geetha K, Brahmananda SH. Network traffic analysis through deep learning for detection of an army of bots in health IoT network. Int J Pervasive Comput Commun. 2022;19(5):653–65. [Google Scholar]
10. Moorthy RSS, Nathiya N. Botnet detection using artificial intelligence. Procedia Comput Sci. 2023;218:1405–13. [Google Scholar]
11. Duan L, Zhou J, Wu Y, Xu W. A novel and highly efficient botnet detection algorithm based on network traffic analysis of smart systems. Int J Distrib Sens Netw. 2022;18(3):15501477211049910. doi:10.1177/15501477211049910. [Google Scholar] [CrossRef]
12. Wei C, Xie G, Diao Z. A lightweight deep learning framework for botnet detecting at the IoT edge. Comput Secur. 2023;129:103195. doi:10.1016/j.cose.2023.103195. [Google Scholar] [CrossRef]
13. Thom J, Thom N, Sengupta S, Hand E. Smart recon: network traffic fingerprinting for IoT device identification. In: 2022 IEEE 12th Annual Computing and Communication Workshop and Conference (CCWC), 2022; Las Vegas, NV, USA: IEEE; p. 72–9. [Google Scholar]
14. Salman O, Elhajj IH, Chehab A, Kayssi A. A machine learning based framework for IoT device identification and abnormal traffic detection. Trans Emerg Telecomm Technol. 2022;33(3):e3743. doi:10.1002/ett.3743. [Google Scholar] [CrossRef]
15. Wang Y, Rimal BP, Elder M, Maldonado SIC, Chen H, Koball C, et al. IoT device identification using supervised machine learning. In: 2022 IEEE International Conference on Consumer Electronics (ICCE), 2022; Las Vegas, NV, USA: IEEE; p. 1–6. [Google Scholar]
16. Osei R, Louafi H, Mouhoub M, Zhu Z, di Vimercati SDC, Samarati P. Efficient IoT device fingerprinting approach using machine learning. SciTePress: SECRYPT; 2022. p. 525–33. [Google Scholar]
17. Koball C, Rimal BP, Wang Y, Salmen T, Ford C. IoT device identification using unsupervised machine learning. Information. 2023;14(6):320. doi:10.3390/info14060320. [Google Scholar] [CrossRef]
18. Lopez-Martin M, Carro B, Sanchez-Esguevillas A, Lloret J. Network traffic classifier with convolutional and recurrent neural networks for Internet of Things. IEEE Access. 2017;5:18042–50. doi:10.1109/ACCESS.2017.2747560. [Google Scholar] [CrossRef]
19. Uhříček D, Hynek K. Dataset used for training IoT C&C classifier (v1.0.0) Zenodo; 2022. doi: 10.5281/zenodo.6396923. [Google Scholar] [CrossRef]
20. Jgamblin. Mirai-source-code. 2017. Available from: https://github.com/jgamblin/Mirai-Source-Code. [Accessed 2024]. [Google Scholar]
21. Dadkhah S, Mahdikhani H, Danso PK, Zohourian A, Truong KA, Ghorbani AA. Towards the development of a realistic multidimensional IoT profiling dataset. In: 2022 19th Annual International Conference on Privacy, Security & Trust (PST), 2022; Fredericton, Canada: IEEE; p. 1–11. [Google Scholar]
22. Sivanathan A, Gharakheili HH, Loi H, Radford A, Wijenayake C, Vishwanath A, et al. Classifying IoT devices in smart environments using network traffic characteristics. IEEE Trans Mob Comput. 2018;18(8):1745–59. doi:10.1109/TMC.2018.2866249. [Google Scholar] [CrossRef]
Cite This Article
 Copyright © 2024 The Author(s). Published by Tech Science Press.
This work is licensed under a Creative Commons Attribution 4.0 International License , which permits unrestricted use, distribution, and reproduction in any medium, provided the original work is properly cited.
 Downloads
 Citation Tools