
 Submit a Paper
 Propose a Special lssue
 Open Access
ARTICLE

Bio-Inspired Intelligent Routing in WSN: Integrating Mayfly Optimization and Enhanced Ant Colony Optimization for Energy-Efficient Cluster Formation and Maintenance
Department of Electronics and Communication Engineering, Faculty of Engineering & Technology, SRM Institute of Science and Technology, Vadapalani Campus, Chennai, 600026, India
* Corresponding Author: V. G. Saranya. Email:
Computer Modeling in Engineering & Sciences 2024, 141(1), 127-150. https://doi.org/10.32604/cmes.2024.053825
Received 10 May 2024; Accepted 28 June 2024; Issue published 20 August 2024
 View Full Text
 Download PDF
Abstract
Wireless Sensor Networks (WSNs) are a collection of sensor nodes distributed in space and connected through wireless communication. The sensor nodes gather and store data about the real world around them. However, the nodes that are dependent on batteries will ultimately suffer an energy loss with time, which affects the lifetime of the network. This research proposes to achieve its primary goal by reducing energy consumption and increasing the network’s lifetime and stability. The present technique employs the hybrid Mayfly Optimization Algorithm-Enhanced Ant Colony Optimization (MFOA-EACO), where the Mayfly Optimization Algorithm (MFOA) is used to select the best cluster head (CH) from a set of nodes, and the Enhanced Ant Colony Optimization (EACO) technique is used to determine an optimal route between the cluster head and base station. The performance evaluation of our suggested hybrid approach is based on many parameters, including the number of active and dead nodes, node degree, distance, and energy usage. Our objective is to integrate MFOA-EACO to enhance energy efficiency and extend the network life of the WSN in the future. The proposed method outcomes proved to be better than traditional approaches such as Hybrid Squirrel-Flying Fox Optimization Algorithm (HSFL-BOA), Hybrid Social Reindeer Optimization and Differential Evolution-Firefly Algorithm (HSRODE-FFA), Social Spider Distance Sensitive-Iterative Antlion Butterfly Cockroach Algorithm (SADSS-IABCA), and Energy Efficient Clustering Hierarchy Strategy-Improved Social Spider Algorithm Differential Evolution (EECHS-ISSADE).Keywords
Wireless Sensor Networks (WSNs) comprise sensor nodes that include processors, battery modules, and wireless communication devices. The nodes consistently collect and send environmental information to central base stations for processing. WSNs are utilized in several domains, including intelligent parking systems, military techniques, electronic health services, urban development, precise farming methods, healthcare facilities, and transportation networks [1]. Given technological advancements, WSNs must prioritize energy efficiency, which requires minimizing energy usage. WSNs are dynamic networks that greatly boost the capacity for processing and transmitting data across many industries. However, these activities may use considerably less residual energy. An alternative method to decrease energy use involves enabling sleep modes on particular nodes during periods of inactivity. In addition, WSNs employ routing algorithms that are specially designed to improve the network’s performance. Clustering is a fundamental technique used to create reliable, flexible, and energy-efficient distributed sensor networks. Clustering reduces requirements for communication, hence limiting interference among sensor nodes and decreasing energy usage. The main goal is to optimize the interactions between the sensors and remove unnecessary processes. The basic structure of the wireless sensor network is shown in Fig. 1.
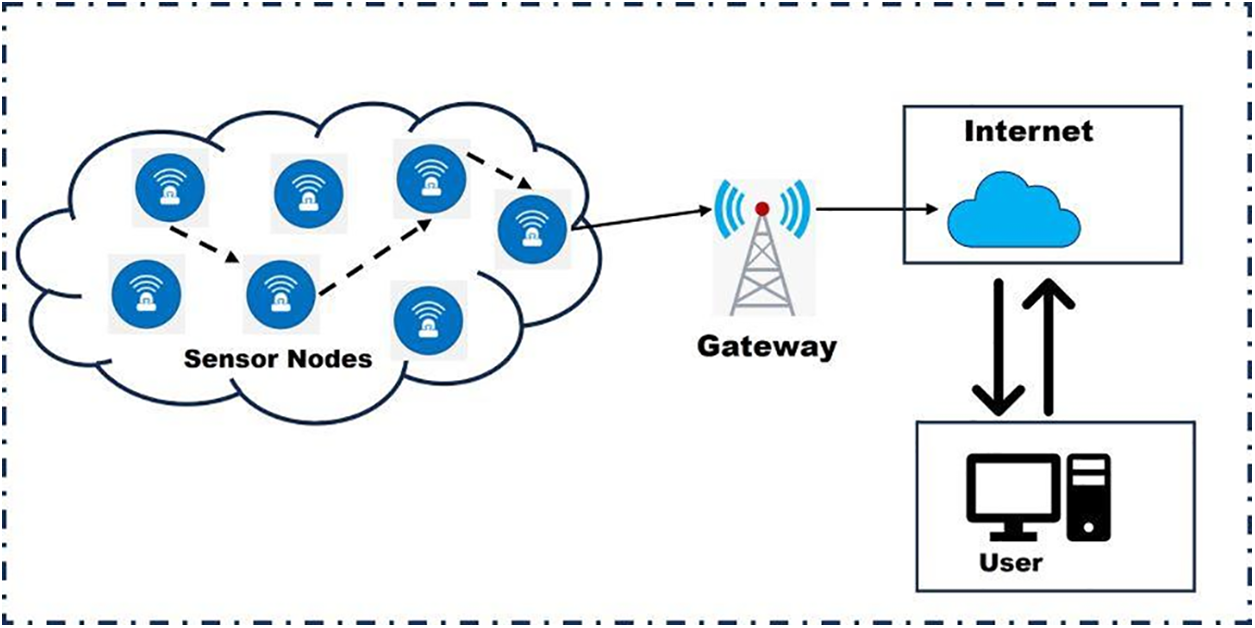
Figure 1: Basic structure of wireless sensor network
Fig. 1 illustrates the fundamental architecture of a Wireless Sensor Network (WSN), comprising a multitude of sensor nodes, a central gateway, and user access facilitated through the internet. In this network, sensor nodes are strategically deployed within a designated sensing area to autonomously gather and relay data. These nodes communicate via multi-hop pathways to aggregate information at the gateway, which then transmits the collected data to the user through internet connectivity. This schematic underscores the operational framework of our study, wherein swarm intelligence methodologies, particularly the proposed Mayfly Optimization Algorithm-Enhanced Ant Colony Optimization (MFOA-EACO) algorithm, are leveraged to optimize routing and clustering processes within the WSN. By enhancing energy efficiency and reducing redundancy in data transmission, our approach aims to extend the network’s longevity and reliability. The integration of swarm intelligence within this structural context demonstrates its efficacy in addressing the inherent challenges of energy consumption and data management in WSNs, thus ensuring sustained and robust network performance.
Since sensor nodes are only connected to a certain cluster, there is no need to maintain the sequential ordering of clusters. Attention has been paid to the systematic organization of sensor networks into clustered frameworks, resulting in the emergence of many organizations that are currently enhancing clustering techniques [2]. Clustering is a key method to create dependable, energy-conserving, and adaptable distributed sensor networks. Clustering reduces the communication required, resulting in decreased energy usage and improved connectivity between the nodes. Ultimately, there should be optimal use of sensors’ interaction hence no need for duplication. The volume of data sent to the sink can be reduced dramatically by merging information already available with information from the cluster head-based (CH-based) sensors. This article explored the key differences between inclusion-conscious and energy-adjusted sensor network organizations, emphasizing clustered WSNs. Effective CH selection cannot be accomplished with the conventional method. The main reason is that choosing a CH is challenging because the node may move from one cluster region to another. To resolve this issue, the most efficient route selection for route nodes is suggested. This enables data transfer irrespective of changes in cluster zones. Furthermore, to save the sensor’s limited battery life, it is essential to execute all of these tasks with efficiency. The majority of sensors are located in remote areas and the life span of the device cannot be enhanced by introducing additional power. A networked structure that has an excessive number of dead nodes could find itself disabled and be unable to operate effectively. Consequently, it is challenging to create routing algorithms for WSNs that are both energy-efficient and energy-maintained. To successfully extend the lifespan of a network, it is necessary to balance the demand for node energy. Classified clustering techniques enhance the lifetime of the network by organizing nodes into many clusters [3]. Clustering protocols aim to optimize energy usage by nodes by selecting the most suitable cluster head and transferring the cluster head role across all nodes. The performance of the clustering process, under the leadership of the selected Cluster Heads (CHs), should exhibit significant variations. Utilizing optimization techniques, such as meta-heuristic, is the most efficient approach to identifying the optimal cluster heads that will effectively prolong the lifespan of the network. Common challenges encountered in algorithms include quick convergence, local search issues, the need for a fitness function, and huge costs. Meta-heuristic-based methods are recommended when the process of looking for the best solution. Effective meta-heuristics additionally possess either at least one global optimum or at least a few domains with good solutions. Examples of global optimization-oriented meta-heuristic approaches are Particle Swarm Optimization (PSO) and Cuckoo Search. Additionally, local optimization methods such as Simulated Annealing (SA) and Harmony Search Algorithm (HSA) are also used [4].
To find the best solution, it is necessary to find a balance between the processes of exploration and exploitation. In the context of integrating Mayfly Optimization Algorithm (MFOA) and Enhanced Ant Colony Optimization (EACO) for energy-efficient routing in WSNs, it is imperative to acknowledge the foundational works and related literature that have significantly contributed to the development and application of these algorithms. MFOA, known for its robustness and efficiency in maintaining cluster head stability, has been extensively utilized in various optimization problems within WSNs. For instance, Wang et al. [5] proposed a self-adaptive multi-strategy artificial bee colony algorithm for coverage optimization in WSNs, showcasing the algorithm’s capacity to enhance coverage while minimizing energy consumption. This study highlights the relevance of adaptive and hybrid algorithms in optimizing WSN performance, providing a basis for integrating MFOA into our proposed approach. Similarly, EACO has demonstrated remarkable efficiency in routing optimization due to its quick detection capabilities and effectiveness in minimizing energy usage. Notably, Hu et al. [6] presented an adaptive routing algorithm for data center networks using ant colony optimization, which significantly improved routing efficiency and reduced energy consumption. These studies underscore the importance of leveraging swarm intelligence and adaptive mechanisms to address the dynamic challenges of WSNs. By integrating MFOA and EACO, our research aims to build upon these foundational works, offering a novel hybrid approach that enhances energy efficiency and network longevity. This integration is expected to bridge the gap between theoretical optimization models and practical applications, ensuring robust and sustainable WSN performance.
This led to a mixture of two widely used meta-heuristic methods, MFOA and EACO. The MFOA is particularly chosen for its robustness in maintaining cluster head stability and computational efficiency, crucial for the dynamic and resource-constrained nature of WSNs. On the other hand, the Enhanced Ant Colony Optimization (EACO) is selected due to its quick detection capabilities and efficiency in route optimization, which are essential for minimizing energy consumption during data transmission in WSNs. These algorithms address key challenges in WSNs, such as maintaining energy efficiency and network stability.
1.1 The Main Contributions of the Research
In the Wireless Sensor Network (WSN), optimization like MFOA is utilized to identify the cluster head due to its exceptional stability and efficiency in terms of computer resources. The selection of the CH in this research is determined by several objective factors, including residual energy, inter-node distance, distance to the base station, node density, and node centrality. EACO utilizes its quick-detecting capabilities to calculate the most efficient route between CH and the base station (BS). The EACO method is improved by using residual energy, node density, and short distance to address the issue of uncertain convergence time. The network’s lifespan is extended as a result of the effective selection of cluster heads (CH) and the establishment of optimal paths for the data transfer. Moreover, The BS receives more packets by reducing node energy consumption during data packet delivery.
The remainder of this paper is organized as follows: Section 2 reviews the related work and presents an overview of existing methodologies. Sections 3 and 4 detail the proposed MFOA-EACO algorithm, including its design and implementation. Section 5 describes the experimental setup and simulation parameters used to evaluate the proposed approach. Section 6 presents the results and discusses the performance comparison with traditional methods. Finally, Section 7 concludes the paper, summarizing the findings and suggesting directions for future research.
Several studies have been conducted to improve the performance of WSNs. The clustering technique has been widely employed to address the shortcomings of the sensor network. Multiple investigations have been carried out on conventional methods. This section will describe some of these studies. In their study, Hassan et al. [7] proposed an energy-efficient clustering technique to enhance the lifespan of internet of thing (IoT) networks based on Wireless Sensor Networks (WSN). Their solution addresses the challenges associated with clustering structure, which can negatively impact the performance of the network protocol. The cluster structure optimization reduced and balanced node power utilization. In conclusion, the proposed protocol is viable for networks with extended lifespan requirements. Han et al. [8] proposed a clustered routing protocol called WPO-EECRP, which aims to optimize energy consumption. The WPO-EECRP protocol took into account many clustering criteria for selecting CHs, including residual energy, the distance between the node’s position and the BS, and the number of neighboring nodes. The WPO-EECRP protocol demonstrated excellent scalability and effectively regulated clustering by modifying the parameters of clusters. The direct transfer of information from the cluster head (CH) to the base station (BS) takes place. These modes of communication result in increased energy consumption across the network. Elsmany et al. [9] developed the EESRA (Energy Efficient Scalable Routing Approach) is a dynamically clustered hierarchical routing approach designed to extend the lifetime of a network as it increases in size. It is adaptive, consumes little energy, and aims to optimize network efficiency. This study compares the Scalable Routing Approach (SRA) to Wireless Sensor Networks (WSN) routing systems that utilize network efficiency as a consequence of network size. The suggested technique did not assess computing time and complexity. To enhance the lifespan of networks, Rambabu et al. [10] proposed an artificial bee colony and bacterial foraging (ABC-BF) approach that integrates the benefits of bacterial foraging (BF) to enhance the local search capabilities of the ABC algorithm. This modification aims to maximize the utilization and investigation of the evaluated criteria to pick the most suitable CH. The assessment involved assessing the ratio of operational and non-operational nodes, in addition to the network’s throughput, using various sensor nodes. Still, the suggested approach exhibited a significant rate of packet loss. Morsy et al. [11] developed a Gravitational Search Algorithm (GSA) to identify optimum CHs from nodes. To select the CH, the remaining node energy was analyzed. The selection of CH aims to include efficiency of energy, distance, and BS distance. Data transfer across the sensor nodes and CH was one hop. After that, multi-hop was utilized to pick the next hop depending on the cost function to transport information across WSN. The multi-hop cost function just considers the following hop’s remaining energy and location from the BS. Tabatabaei et al. [12] analyzed WSN lifetime improvement by clustering sensor networks (SN). By clustering SN, the Lion Pride optimizer algorithm lowered energy usage. The top CHs were chosen based on battery power range and sink distance. The non-CH nodes are linked to the nearest CH. Clusters were created in such a manner. After clusters were built, a sink node-based CH-based direct virtual backbone enabled data routing. The findings showed that the suggested technique had a large processing overhead and low throughput. Zhang et al. [13] presented a novel and effective Robust Ant Colony Optimization (RACO) approach based on Ant Colony Optimization (ACO) to optimize WSN data transmission routing paths. The suggested technique improves ACO’s heuristic value by considering energy usage, node distance, and network security. Numerical testing showed that the RACO technique enhanced the overhead of network performance without altering network architecture but this technique is more computationally expensive. Li et al. [14] introduced an innovative load-balancing ant-based routing protocol (LBAR) for WSNs. A pseudo-random approach was utilized to determine routes in LBAR development to speed improve the search for a cost-effective path and address the balancing of energy. However, this strategy failed to determine cluster methodology optimality.
3 Proposed MFOA-EACO Algorithm
Traditional protocols choose CHs using a calculation based on node characteristics. Although simple to implement, these procedures do not address proper CH selection criteria. Meta-heuristic-based approaches are more efficient than traditional approaches in identifying optimum cluster heads, but they are more time-consuming and computationally challenging due to the iteration methodology utilized for each round. MFOA is a recently developed meta-heuristic with a higher rate of discovery of optimal solutions compared to PSO (Particle Swarm Optimization) and other optimizations. In addition, MFOA can identify several optimal solutions. In a few cases, premature convergence can compromise the quality of the final solution. It is feasible to combine one algorithm that exhibits high exploration abilities with another strategy that demonstrates strong exploitation qualities. The MFOA technique effectively examines the whole exploration space, while the EACO technique exploits and improves current sets of features. The setup of the sensor CH is shown in Fig. 2.
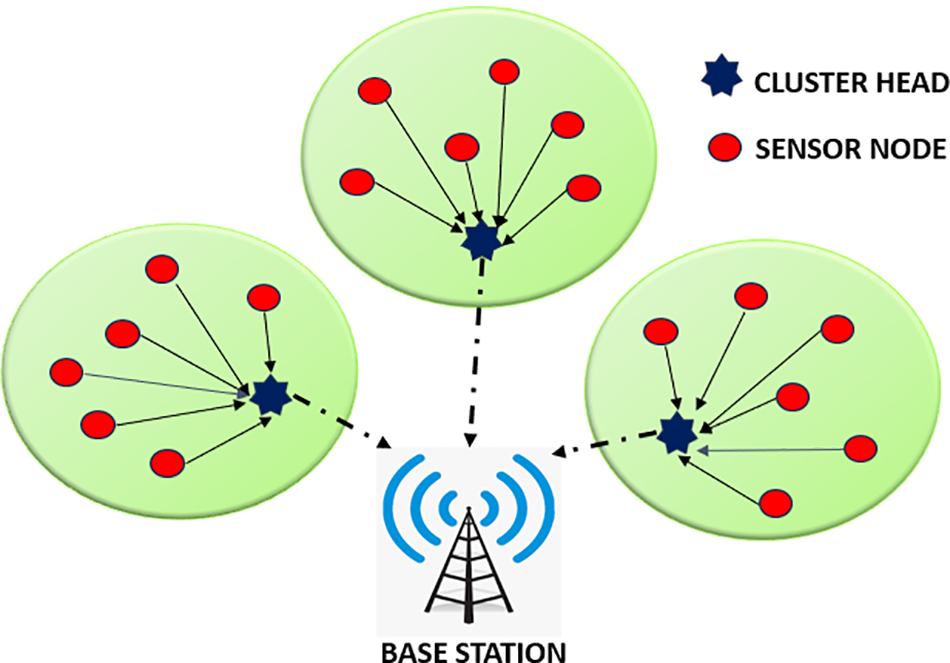
Figure 2: Cluster head formation and data routing
The MFOA-EACO is proposed to address previously identified issues:
• All sensor nodes in a WSN have equivalent initial energy and processing time.
• Each sensor distance is calculated using the Euclidean distance formula.
• Each sensor node is randomly distributed in the sensing area and maintains its precise position after installation. Sensor nodes report stored energy and distance to BS.
• An effective CH selection algorithm selects CHs for all sensor nodes. A routing algorithm is used to determine the optimum route between both CHs and the BS [15].
All sensor nodes have limited resources. Thus, we aim to improve the lifetime of the network by consuming less energy. The radio model is shown in Fig. 3. WSN sensors use most of their energy for data transfer. Thus, to quantify a network’s energy usage, we must consider both data transmission and reception costs [16,17].
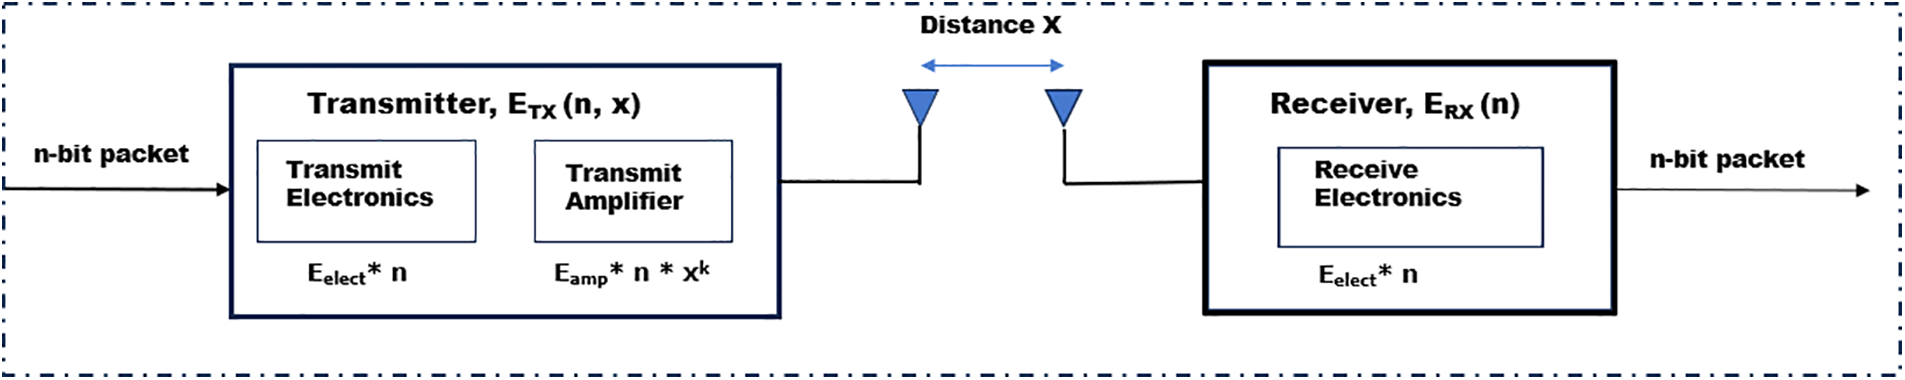
Figure 3: Radio energy model
Fig. 2 illustrates the formation of cluster heads and the data routing process within a wireless sensor network. Sensor nodes are grouped into clusters, each with a designated cluster head responsible for transmitting collected data to the central base station.
This work calculates transmitter and receiver energy using a basic radio model. Eqs. (1) and (2) show how much energy is needed to transmit and receive n-bit packets over a distance of x.
The amplification energy
Fig. 3 depicts the Radio Energy Model, showcasing the energy consumption involved in transmitting and receiving n-bit data packets over a distance x. The model highlights the roles of the transmitter, including the transmit electronics and amplifier, and the receiver, emphasizing the energy required for each process.
3.3 Proposed MFOA-EACO Approach
The proposed method contains two operational methods: network routing and CH selection. EACO establishes the optimal path between CH and BS, whereas MFOA selects the best CH sensors.
The main mathematical idea in this algorithm is the mating process that takes inspiration from the social behavior of mayflies. Mayflies are deemed adults upon hatching from their eggs, and only the most physically fit mayfly manages to live. The precise positioning of mayfly inside the search area determines the optimal resolution to the problem. The position of each mayfly in the search space represents a potential solution to the problem. Using the fitness parameter, this method determines the most advantageous position, known as the best CH. This mathematical model integrates the phenomenon of dance and the mayfly movements within a specific area. Furthermore, it calculates the threshold at which mayflies transition to reach the optimal location. A pair of mayflies are first produced randomly and located in the problem space, represented by a dimensional path, as a potential solution. While assessing the fitness function F(X), a mayfly’s velocity is determined by the change in its position. The flight path of each mayfly is constantly changing. Each mayfly adjusts its location to match the best position (Pbest) achieved by every mayfly in the swarms so far (Gbest). Mayflies select the optimal location as the foundation for CH selection. The mayfly employs a selection process to choose the optimal CH for all the nodes [18].
3.4.1 Mayfly Representation and Initialization
The mayfly is a collection of sensors that are selected as CHs from a network of sensors during the MFOA’s CH selection phase. The amount of CH in the network’s structure is equivalent to each mayfly dimension. Every mayfly’s position is initiated with a randomly selected node ID value between (1 to n), ‘n’ the overall quantity of nodes in the network’s structure [18]. Assume
3.4.2 Position of Male Mayflies
Mayflies exhibit gender dimorphism in their embryonic development, with distinct processes occurring for males and females. Each mayfly governs its position by responding to its own experiences and the experiences of nearby individuals. The MFOA equation incorporates multiple steps that align with the procedures. The current position of the mayfly is estimated to be
The positive attraction limitation functions are denoted as
likewise,
where
3.4.3 Position of Female Mayflies
The attraction between males and females is contingent upon the efficacy of the current solution. The male with the best level of performance attracts the female with the highest level of formation, and this process continues until all partners have been discovered. Furthermore, the updated location
where
where
The crossover process is initiated by determining the initial mayfly selection, followed by a female mayfly. The greatest male generates the best female, and the best female generates the best male. The following Eqs. (12) and (13) depicts the off spring produced after crossover.
This decision may be made depends on fitness criteria. In this case, the male represents the father, and the female represents the mother.
3.5 Assessment of MFOA Fitness Performance for Choosing the Best CH
Based on network data collected from sensors, the identical MFOA performance algorithm selects the best cluster head. The fitness coefficient measures residual energy, distance of CH-BS and node degree. To adjust the fitness factors for optimum outcomes. The fitness function model saves energy and extends network life. The fitness functions under consideration are explained as follows.
In this network, CH carries out many responsibilities, including gathering information from typical sensor nodes and transmitting it to BS. The Cluster Head (CH) needs a substantial amount of energy to carry out the activities listed above. Therefore, the node with a greater amount of residual energy is more likely to be selected as the CH. The residual energy is defined by Eq. (14).
It specifies the separation between its own CH and normal sensor nodes. The dissipation energy of the sensor is mostly dependent on the distance of the routing path. When the chosen node is closer to the base station (BS) by transmission distance, its energy consumption is minimal. Eq. (15) expresses the distance between the sensors Si to CHj. The distance parameter
It denotes the separation between CH and BS. The distance of the transmission path determines the energy use of the node. For instance, when the distance between the base station BS and the CH is considerable, a larger quantity of energy is necessary for transmitting data. Heightened energy usage may cause an abrupt decrease in CH levels. Therefore, the node with a shorter distance from the BS receives priority for transmitting data. Eq. (16) represents the objective function
It determines the amount of sensor nodes that are associated with each distinct CH. The CHs with fewer sensors are chosen since CHs with larger numbers of cluster members use their energy more rapidly. The objective function of the node degree
Every objective function has a weight assigned to it. In this method, several objectives are merged into a single objective function.
where
4 Routing using Enhanced Ant Colony Algorithm (EACO)
Enhanced Ant Colony Optimization (EACO) is another meta-heuristic method inspired by ant behavior. Ants usually choose the quickest way in their nest and food. Applying Enhanced ACO to discrete issues creates a network with nodes and connections. This setup assigns ants to each node and weight to each connection. First, the links’ weight is estimated using actual distance, a random integer, or a mathematical formula. The unpredictable convergence time is solved by improving the Enhanced ACO with residue energy, BS distance, and node degree. The flowchart for hybrid MFOA-EACO method is shown in Fig. 4. The following section extensively clarifies EACO route selection [19,20]:
1. To create the route from each CH to the BS, an ant has been placed in each CH. Forward Ant Packets, or route setup packets, are created by the source CH.
2. Each packet generated during the transmission of these Forward Ant Packets creates local database. When the route is extended as long as it reaches BS, the opposite backward ant packet is generated using the forward ant’s database. This backward ant then transmits along the same path that is used for packet transmission by forward ants.
3. For each route, its pheromone value is adjusted based on energy, base station distance, node degree. Ant k picks the next hop using the nodes transition rule’s formula expression, which shows the likelihood of selecting node j as the next node i.
4. ACO enhances search speed with domain-specific expertise and pheromones. The pheromone values indicate how ants learn the best routes depending on their domain or node behavior. We use weighting factors
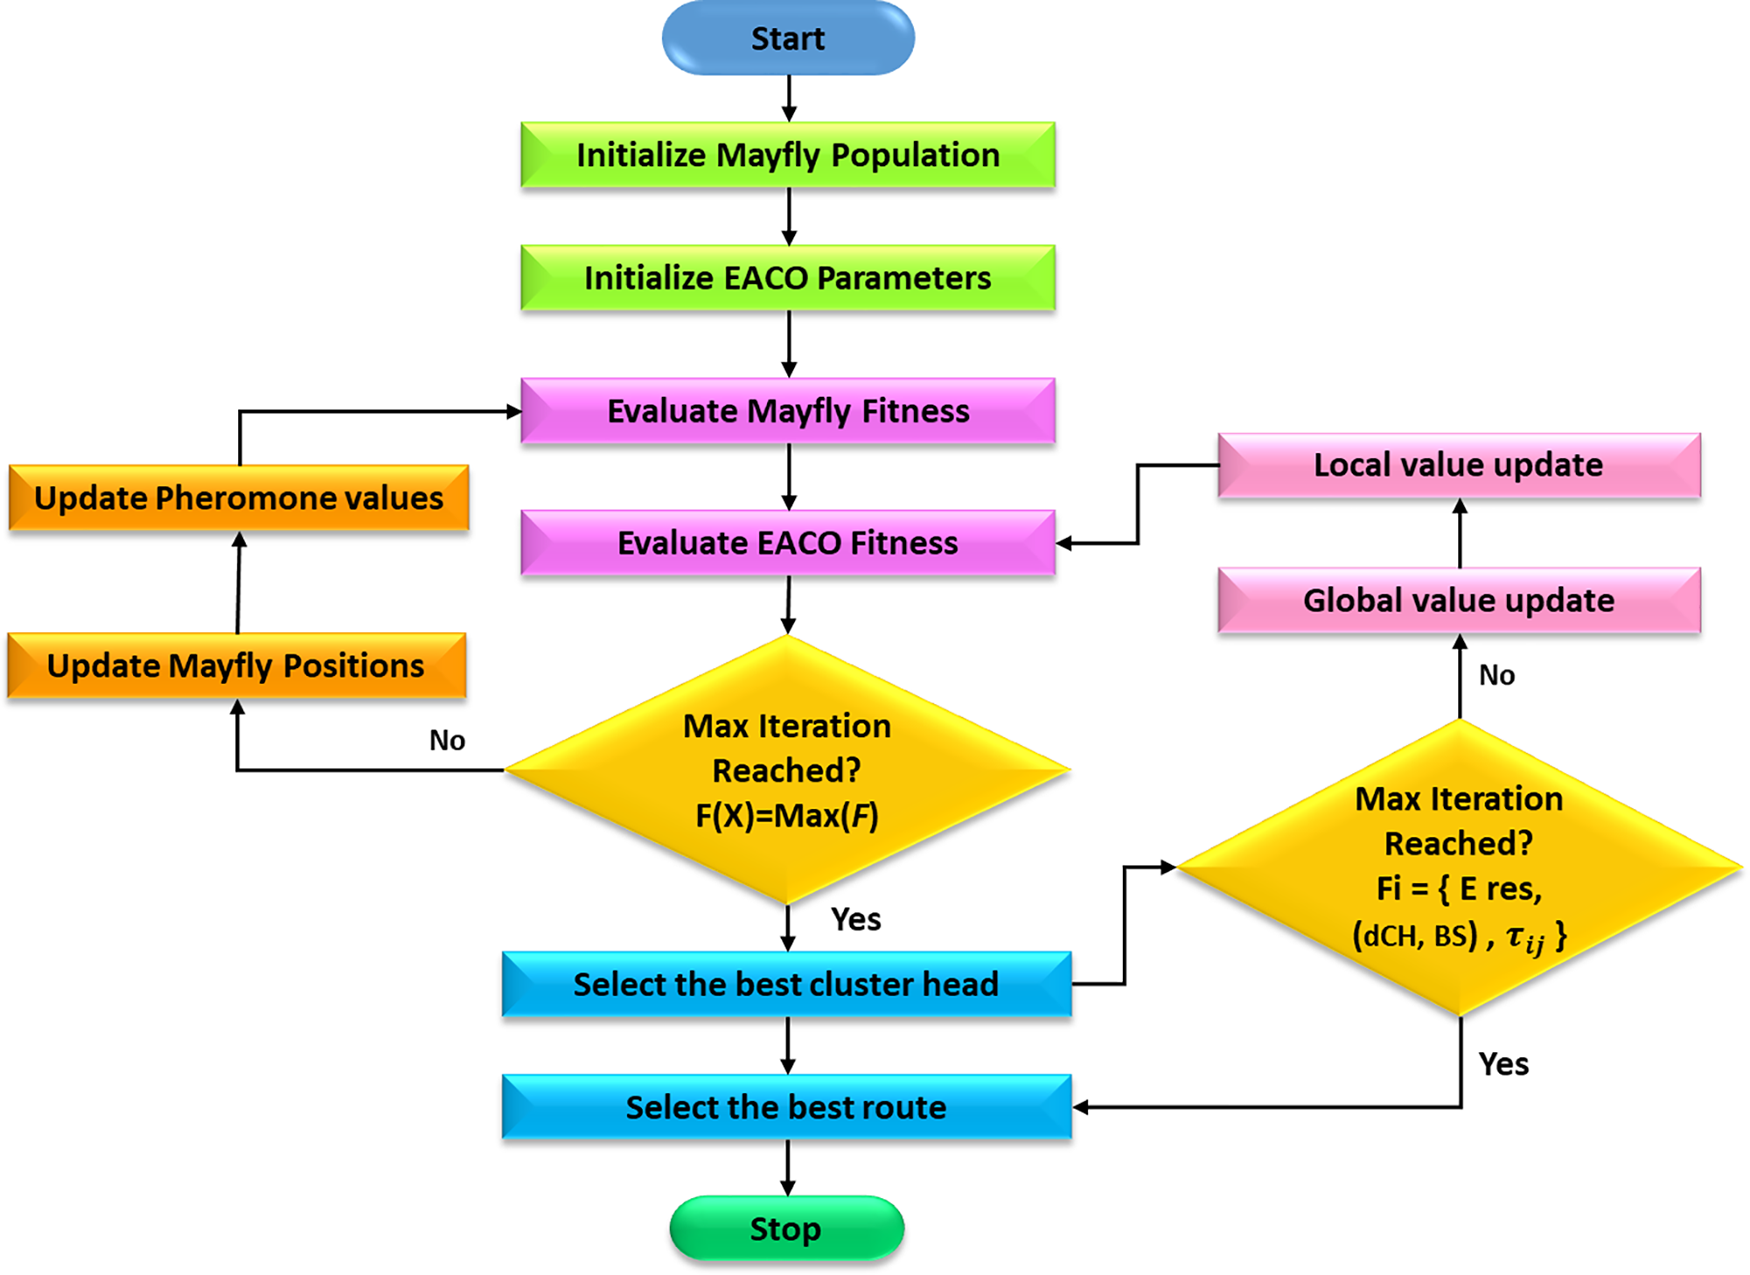
Figure 4: The flowchart for hybrid MFOA-EACO method
4.1 Flowchart for MFOA-EACO Method
4.2 Technical Integration of MFOA and EACO for WSNs
The hybrid MFOA-EACO algorithm is designed to leverage the strengths of both the MFOA and Enhanced Ant Colony Optimization (EACO) to achieve optimal cluster head (CH) selection and efficient routing in WSNs. This section details the mechanics of the integration process, highlighting how these algorithms interact and the specific modifications made to enhance their performance in WSNs.
The interaction between MFOA and EACO is orchestrated to combine the high exploration capability of MFOA with the strong exploitation proficiency of EACO. The process begins with MFOA performing an initial global search to identify potential CHs based on node attributes such as residual energy, node density, and distance to the base station (BS). MFOA’s exploration phase ensures that a wide search space is covered, preventing premature convergence and promoting diversity in the selection of CHs. Once potential CHs are identified, EACO is employed to refine this selection by exploiting the local search space around these candidates. EACO utilizes pheromone trails and heuristic information to enhance the accuracy of the CH selection, ensuring that the final CHs not only have high residual energy but are also optimally positioned to minimize communication distances and energy consumption.
4.2.2 Modifications to Standard Algorithms
To tailor MFOA and EACO for WSN applications, several modifications have been implemented:
a. Energy-Aware Fitness Function in MFOA
The fitness function in MFOA has been modified to prioritize nodes with higher residual energy and closer proximity to other nodes and the BS. This ensures that selected CHs can handle the additional energy burden associated with CH responsibilities. The fitness function incorporates multiple parameters, including residual energy
where
b. Dynamic Pheromone Update in EACO
EACO’s pheromone update mechanism has been adjusted to consider the residual energy of nodes and their distance to the BS. This dynamic update helps in continuously refining the routing paths based on current network conditions, enhancing the longevity and energy efficiency of the network. The pheromone value
where
• The integrated workflow begins with MFOA performing a global search to identify a set of potential CHs. These CHs are then evaluated using the energy-aware fitness function.
• The top candidates from the MFOA phase are passed to the EACO phase, where ants explore the local search space to fine-tune the selection. The pheromone trails are updated dynamically based on energy consumption and distance metrics, guiding ants toward the most efficient routes.
• The final CHs are selected based on a combined score from both MFOA and EACO, ensuring a balance between exploration and exploitation, leading to an optimal network configuration.
4.2.4 Contributions to Energy Efficiency
The hybrid MFOA-EACO approach contributes to energy efficiency in several ways:
• Balanced CH Load: By selecting CHs with high residual energy and optimal positioning, the algorithm ensures that the energy load is evenly distributed among nodes, preventing early depletion of any single node.
• Efficient Routing: The dynamic routing paths generated by EACO minimize the overall communication distance, reducing energy consumption during data transmission.
• Adaptability: The integration allows for continuous adaptation to changing network conditions, maintaining optimal performance even as nodes deplete energy and network topology changes. WSN nodes’ energy efficiency is calculated by comparing energy consumption to valuable data transmitted. An energy efficiency formula is calculated as:
4.2.5 Combined Fitness Function for Final CH Selection
The final selection of CHs incorporates a combined fitness function that integrates both MFOA and EACO criteria. The combined fitness
where
To evaluate the performance of the proposed MFOA-EACO scheme, a comprehensive experimental setup was established. The experiments were conducted using MATLAB R2022b on a Windows 11 system equipped with an Intel Core i5 processor and 8 GB of RAM. This environment was chosen for its balance between computational power and accessibility, making the study reproducible on standard computational setups.
5.1 Simulation Environment and Parameters
The simulation scenario modeled a Wireless Sensor Network (WSN) with sensor nodes randomly distributed within a 100 × 100 m2 area. This configuration reflects a typical WSN deployment scenario where sensor nodes are dispersed to cover a geographic region. The central placement of the base station (BS) at coordinates (50, 50) was selected to minimize communication distances and ensure uniform energy consumption across the network. Key simulation parameters are detailed in Table 1. This table outlines the key simulation parameters used in the study, including the number of sensor nodes, field dimensions, initial energy levels, and communication-related energy values.
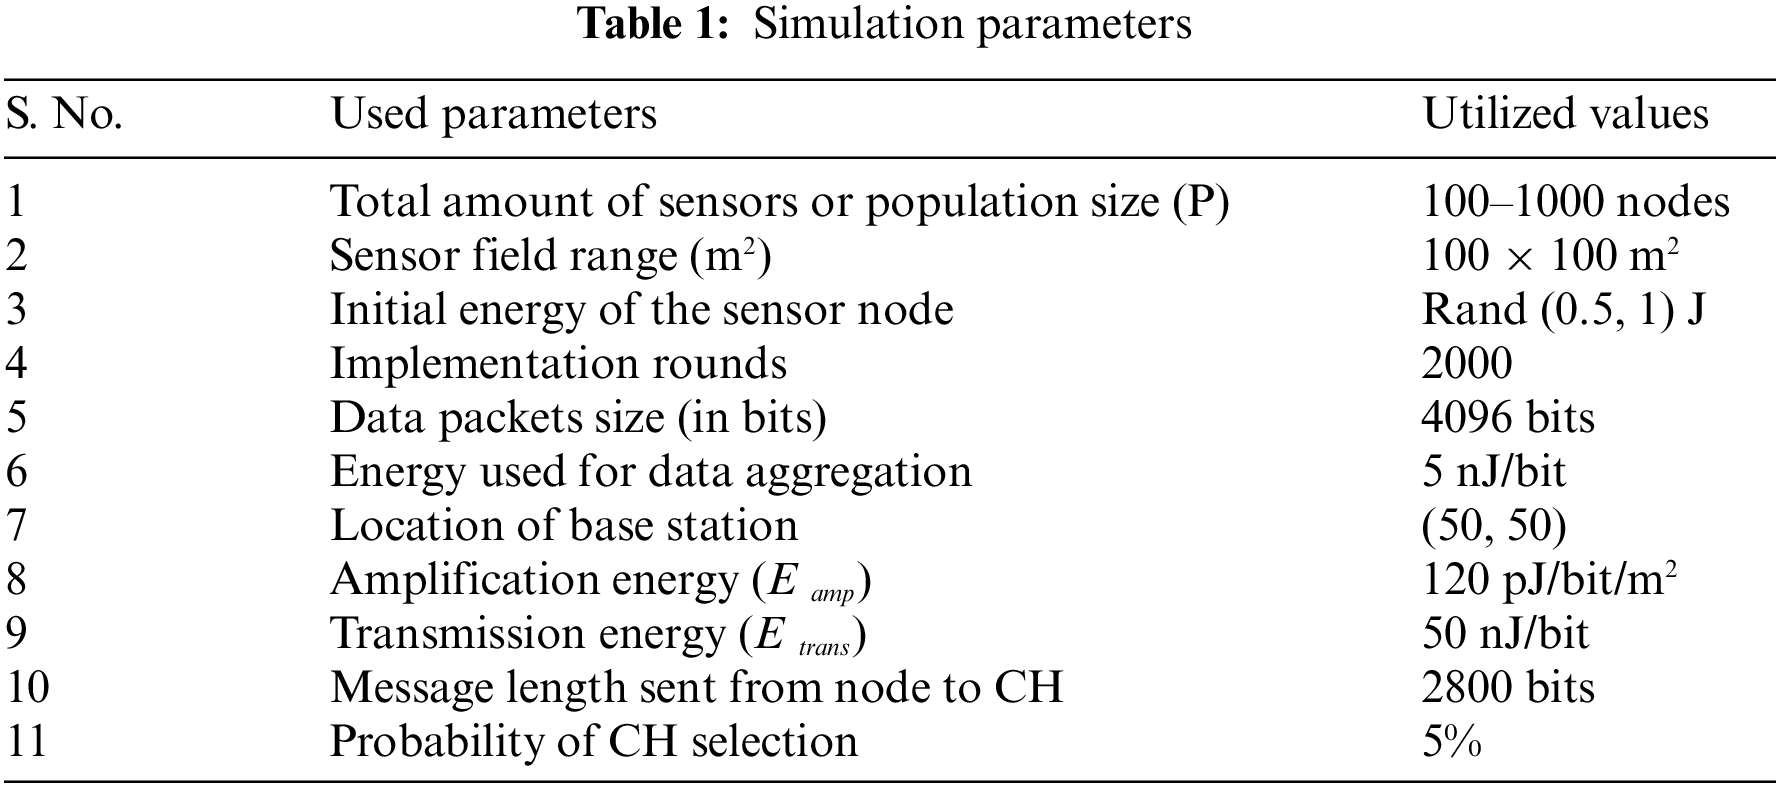
5.2 Rationale for Parameter Selection
The selected parameters are grounded in typical WSN operational environments. The initial energy range for sensor nodes (0.5 to 1 J) reflects the variability in battery capacities due to manufacturing differences and initial charge levels. The 100 × 100 m2 area is a standard size for experimental WSNs, providing sufficient coverage without excessive computational demands. The central placement of the BS at (50, 50) is a strategic choice to minimize the average distance between sensor nodes and the BS, reducing energy consumption for data transmission.
5.3 Data Collection and Sensor Types
Data collection involved tracking several critical performance metrics: the number of alive and dead nodes, residual energy, throughput, and network lifetime. These metrics were recorded at regular intervals throughout the 2000 simulation rounds to provide a detailed performance profile of the MFOA-EACO scheme. The sensor nodes in this simulation are modeled based on typical WSN sensors. They are equipped with capabilities for data sensing, processing, and communication. Energy consumption models for transmission (
a. Energy Consumption Mode
The energy consumption for data transmission and reception was calculated using Eqs. (1)–(4).
b. Network Lifetime
The network lifetime was determined by monitoring the energy levels of the sensor nodes throughout the simulation. The lifetime was defined as the time until 90% of the sensor nodes were depleted of their energy. This was tracked using the following steps:
1. Initial Energy—Each sensor node was initialized with a predefined amount of energy
2. Energy Depletion—For each transmission and reception event, the energy levels were updated:
3. Lifetime Threshold—The network lifetime
c. Mean Throughput Calculation
Mean throughput was calculated as the average rate of successful data packet delivery over the network’s operational time, given by:
where N is the total number of packets delivered and
The proposed MFOA-EACO scheme is demonstrated, and simulation experiments are performed by MATLAB R2022b. In MATLAB R2022b, which runs on a Windows 11 computer with a Core i5 processor from Intel and 8 GB of RAM, the suggested energy-effective routing method is implemented and validated. The simplicity of computation and suitable data analysis are the main benefits of using MATLAB. In the simulation scenario used to implement the proposed MFOA-EACO system, 100 to 1000 various sensor nodes are randomly positioned throughout a 100 × 100 m2 geographic area. The network’s base station is seen as being in the network’s middle. The free-space model’s energy is 10 pJ/bit/m2, and the lattice is 0.5. Additionally, the transmission energy was set to 50 nJ/bit/m2, the magnitude of the energy was established at 120 pJ/bit/m2, and the information processing power was established at 5 nJ/bit/signal. The cluster head election was planned to include 2000 rounds. The simulator settings that were used to apply the suggested results the standardized selection criteria for MFOA-EACO and HSFL-BOA [21], HSRODE-FFA [22] and SADSS-IABCA [23], EECHS-ISSADE [24] cluster heads are existing in Table 1. HGWCSOA-OCHS [25], HABC-MBOA-CHSS [26], FCGWO-CHS [27], and HSRODE-FFA [22], MFOA-EACO are existing in Tables 2 and 3 and also compared the results with SaMABC [5], RACO [6].
6.1 Cluster Head (CH) Formation
We conduct initial comparisons of the proposed approach with current algorithms. Low Energy Adaptive Clustering Hierarchy protocol (LEACH) is a common clustering methodology. Base station placement possibilities are evaluated. The BS analyzes short-range communications from the Centre of the region (100, 100). The proposed method is evaluated by varying the node counts in scenario 1. It represents the Cluster Head (CH) selection for no of nodes 100, 150 in the below Figs. 5, 6.
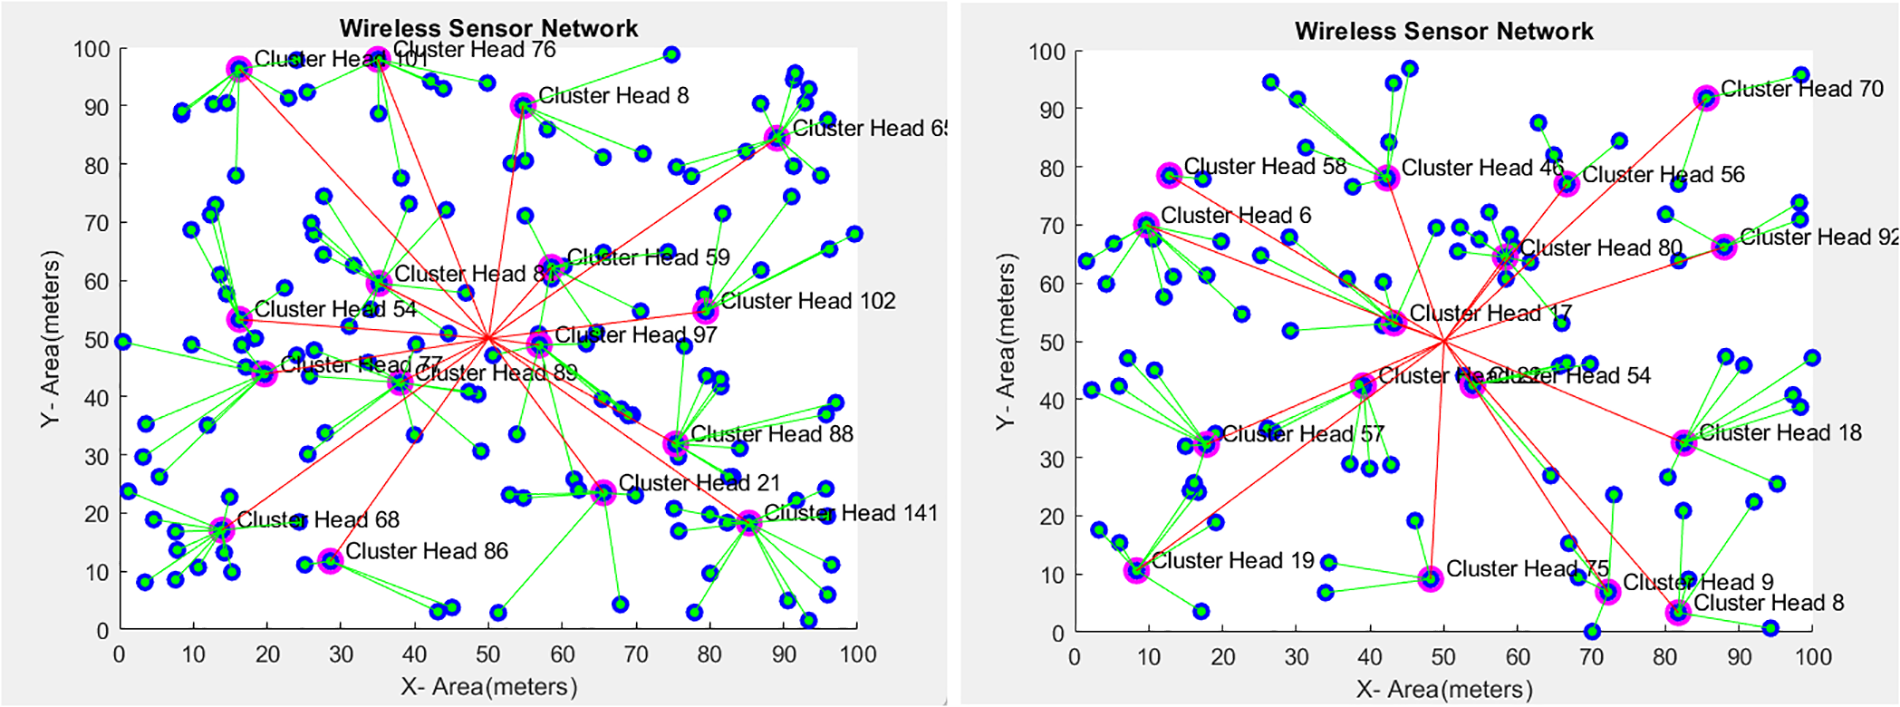
Figure 5: Cluster Head (CH) selection for No. of 150 nodes and 100 nodes
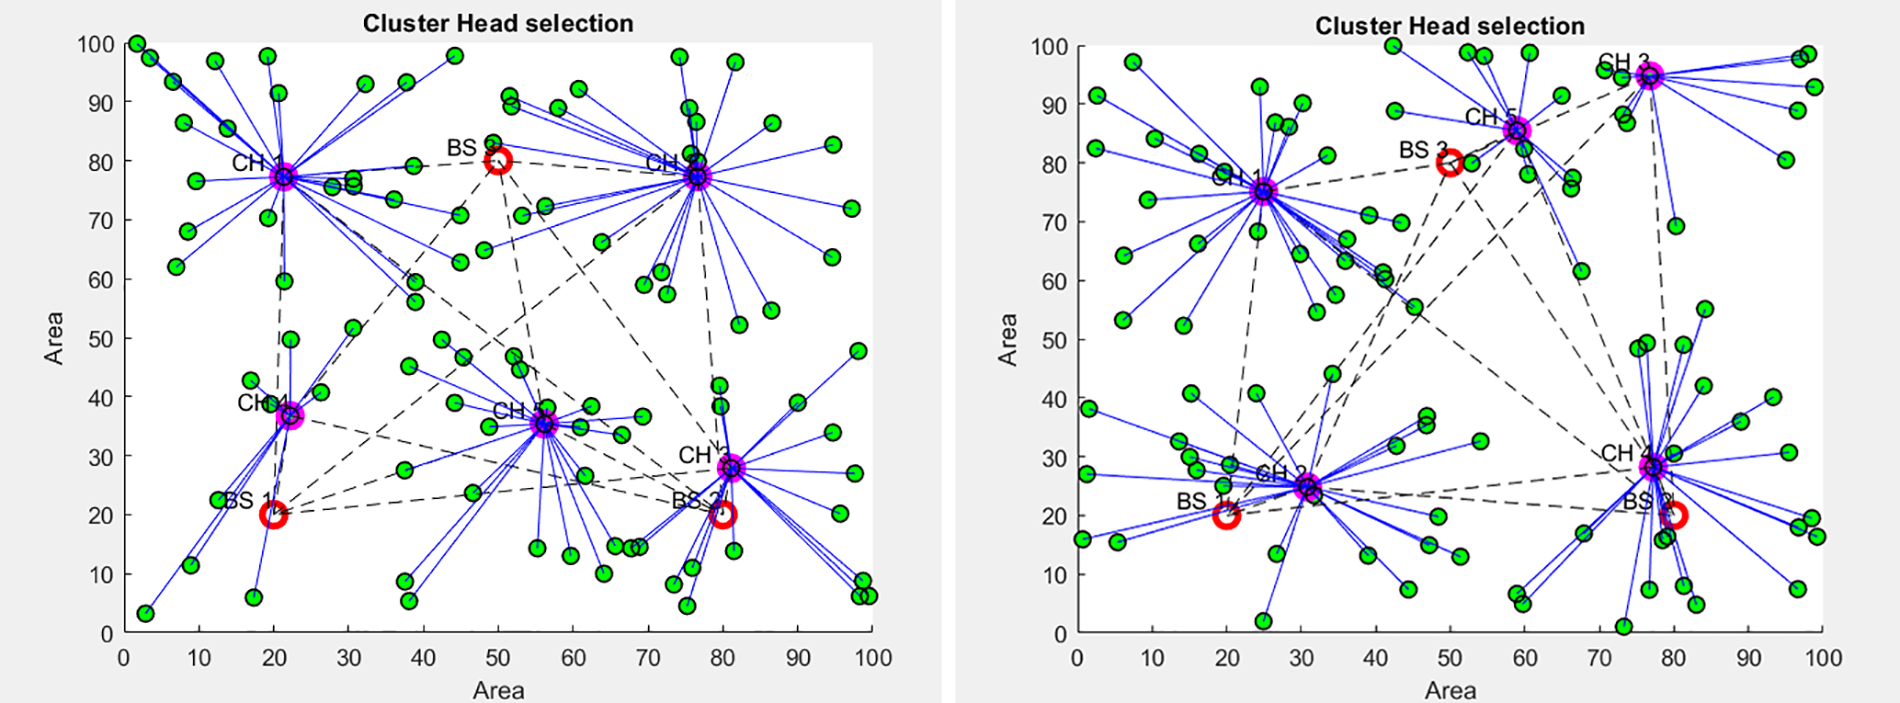
Figure 6: Data routing between Cluster Head (CH) and Base Station (BS)
6.2 Data Routing between Cluster Head (CH) and Base Station (BS)
This simulation uses 100 to 1000 node variations. MFOA-EACO presented the parameters of alive and dead nodes, maximum throughput, maximum residual energy, and network lifetime in this simulation study. It involves an increase in the quantity of still-alive node locations, residual energy, system lifespan, and node death in terms of communication. We initially investigate the dominance of the proposed MFOA-EACO scheme by evaluating the throughput, mean residual energy, percentage of alive nodes, and percentage of dead nodes in various implementation rounds.
In Fig. 5, we illustrate the Cluster Head (CH) selection process for two different scenarios: a Wireless Sensor Network (WSN) with 100 nodes (left) and another with 150 nodes (right). The figures show the spatial distribution of the nodes, with the X and Y axes representing the coordinates in a 2D plane area. The blue and green lines indicate the connections between the nodes and their respective cluster heads. This visualization helps to understand how the proposed hybrid Mayfly Optimization Algorithm-Enhanced Ant Colony Optimization (MFOA-EACO) approach effectively selects CHs and organizes the network, which is crucial for reducing energy consumption and enhancing the network’s lifespan.
Fig. 6 illustrates the data routing process between the Cluster Head (CH) and the Base Station (BS). It shows the transmission path of n-bit packets, detailing the energy consumption at each stage, from the transmit electronics and amplifier in the CH to the receive electronics in the BS. This model emphasizes the efficiency and energy dynamics involved in the communication between CH and BS. The figure includes three clusters, each represented by a circle. Within each cluster, sensor nodes are depicted as blue circles, and the designated Cluster Heads (CHs) are shown as red circles. The lines connecting the sensor nodes to the CHs represent the intra-cluster communication, while the lines connecting the CHs to the BS indicate the inter-cluster communication. Ensure that the color scheme and symbols are distinct and well-explained in the figure legend. For example, blue circles for sensor nodes, red circles for CHs, and clearly distinguishable lines for different types of communication. Adjust the layout to prevent text from being overlapped by lines, which can be done by repositioning the text labels or lines for clarity.
Fig. 7 illustrates the graph that illustrates the proportion of alive nodes supported by the MFOA-EACO scheme as the number of implementation rounds increases. The MFOA-EACO scheme sustained 50% of living nodes at a maximum of 2000 rounds. However, the HSFL-BOA, SADSS-IABCA, HSRODE-FFA, and EECHS-ISSADE techniques can only sustain success rates of 40%, 25%, 38%, and 0%, respectively, after 2000 rounds.
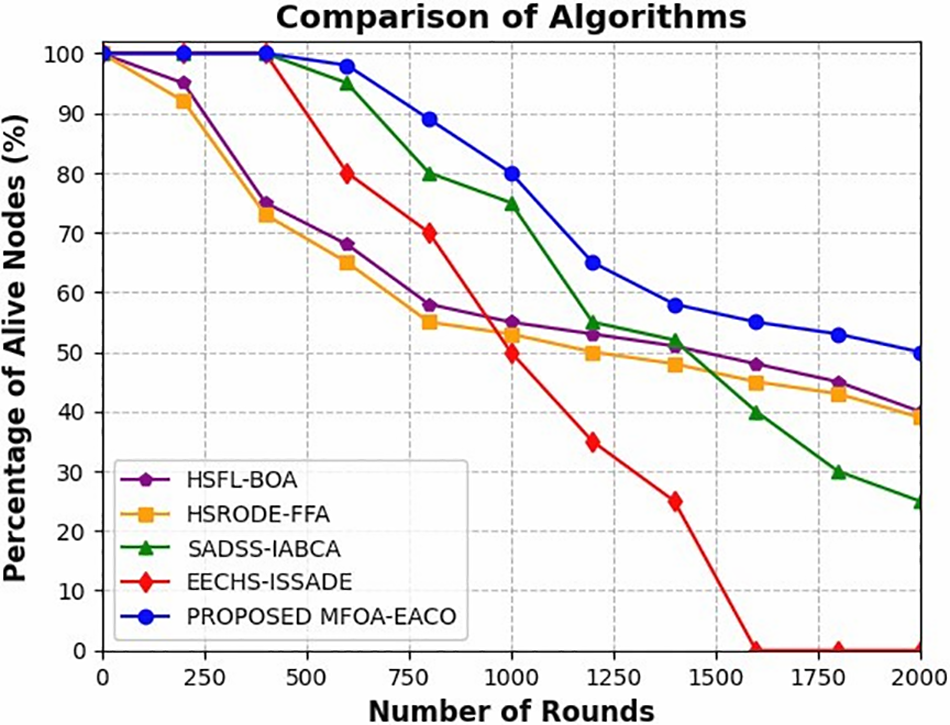
Figure 7: Alive nodes with different iterations
Fig. 8 illustrates a graph that shows the dead nodes (%) in the network when the suggested MFOA-EACO technique and the standard clustering methods are applied throughout many rounds. The maximum proportion of dead nodes during the deployment of the suggested MFOA-EACO has been estimated to be 50% at 2000 rounds.
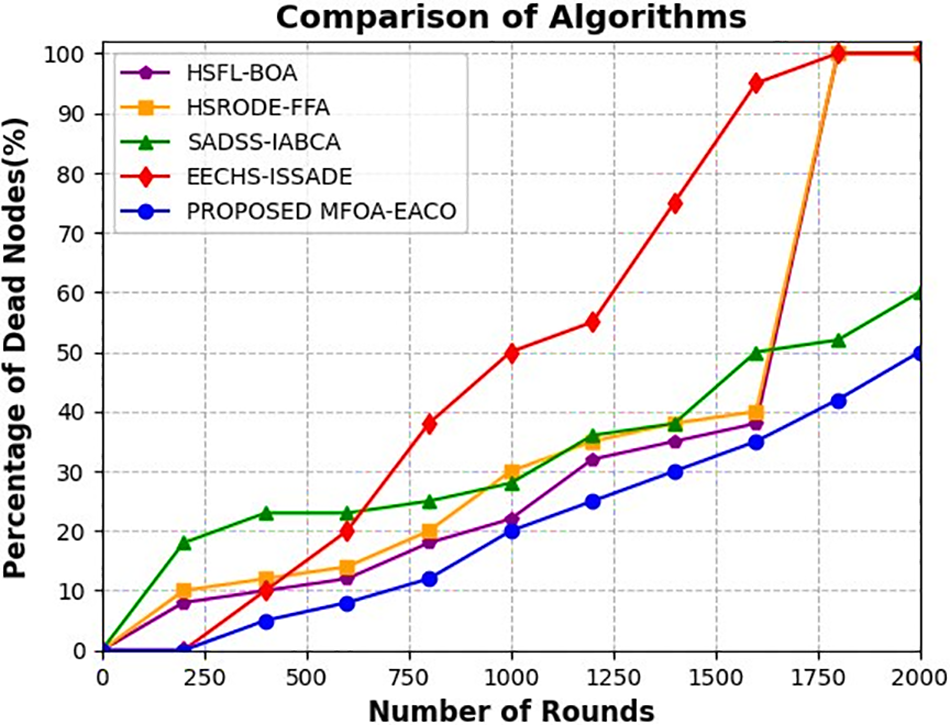
Figure 8: Dead nodes with different iterations
Fig. 9 illustrates the graphs of throughput (Mbps) achieved by the proposed MFOA-EACO technique as the number of implementation rounds increases. The suggested MFOA-EACO system exhibits a significant improvement in throughput as the total number of rounds increases. It was concluded that the suggested MFOA-EACO scheme will get better results compared to variation in the HSFL-BOA, SADSS-IABCA, HSRODE-FFA, and EECHS-ISSADE approaches correspondingly. Before we present the detailed performance metrics, it is essential to clarify the basis for calculating the network’s lifetime and the operational standards for commercial WSN nodes. Typically, commercial WSN nodes are designed to operate optimally for a range of 1000 to 3000 rounds, depending on the application and energy-saving strategies. For reliable functioning, at least 80%–90% of nodes must remain active, ensuring robust data collection and communication. Our experiments reflect these standards by maintaining a substantial percentage of active nodes over 2000 rounds.
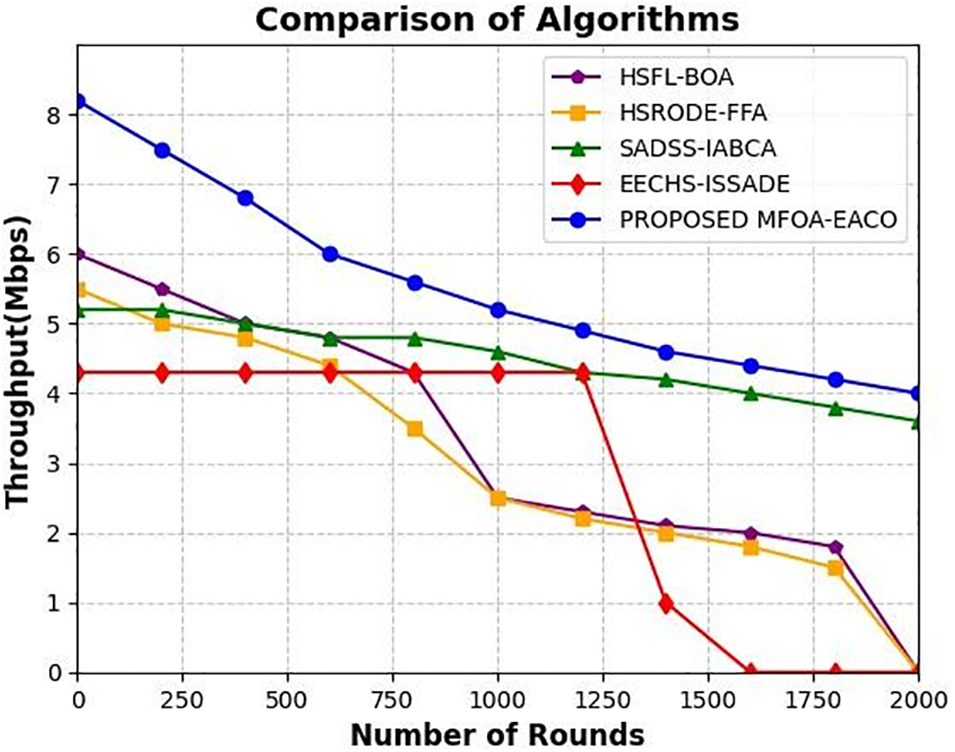
Figure 9: Throughput (Mbps) with different iterations
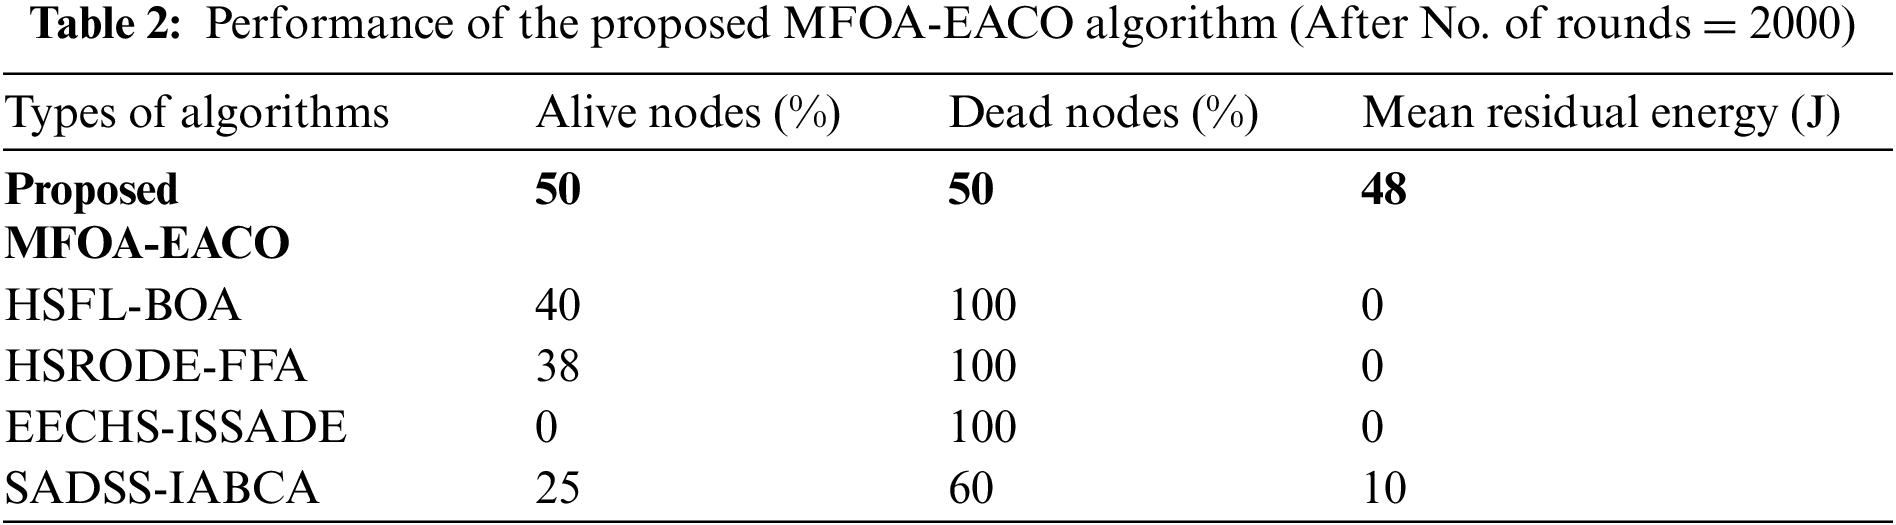
Table 2 presents a comparative analysis of various algorithms in terms of network performance metrics after 2000 rounds, including the proposed MFOA-EACO. The MFOA-EACO algorithm outperforms other methods with 50% of nodes remaining alive, 50% dead nodes, and a mean residual energy of 48 J. In contrast, traditional algorithms like HSFL-BOA and HSRODE-FFA show poorer performance with 100% dead nodes and no residual energy. The SaMABC algorithm performs relatively well, maintaining 45% alive nodes and a mean residual energy of 45 J, while the RACO algorithm, with 30% alive nodes and 20 J residual energy, shows moderate performance. The EECHS-ISSADE and SADSS-IABCA algorithms demonstrate significantly lower efficacy, highlighting the superior energy efficiency and network longevity provided by the MFOA-EACO scheme.
Fig. 10 illustrates the graphs of the mean residual energy obtained by the suggested MFOA-EACO scheme as the number of implementation cycles increases. The suggested MFOA-EACO strategy in the network is known to significantly sustain the mean residual energy. Therefore, the MFOA-EACO scheme has been validated by demonstrating improvements of 25%, 30%, 2%, and 17% compared to the baseline HSFL-BOA, SADSS-IABCA, HSRODE-FFA, and EECHS-ISSADE CH selection systems, respectively. Hence, it was concluded that the suggested MFOA-EACO scheme outperforms the HSFL-BOA, SADSS-IABCA, HSRODE-FFA, and EECHS-ISSADE systems in comparison. The second portion of the investigation assesses the dominance of the proposed MFOA-EACO technique over the initial HGWCSOA-OCHS, HABC-MBOA-CHSS, and HSRODE-FFA schemes. This assessment is based on the mean throughput, mean residual energy, and upgrading in network lifespan for various network sizes. The MFOA-EACO method and initial CH selection strategies achieve the Mean throughput shown in Fig. 11 across various network sizes. The MFOA-EACO strategy enhances the average throughput, regardless of the quantity of nodes in the network’s structure. Fig. 12 illustrates the mean residual energy in the network of the MFOA-EACO technique and baseline CH selection strategies for various network sizes. The average remaining energy of the suggested MFOA-EACO method remains consistently high throughout the network, independent of the total number of sensor nodes present. The suggested MFOA-EACO scheme aims to maintain the average remaining energy at levels 9.72%, 8.11%, 8.91%, and 6.48% higher than those achieved by the baseline HGWCSOA-OCHS, HABC-MBOA-CHSS, FCGWO-CHS and HSRODE-FFA CH selection systems.
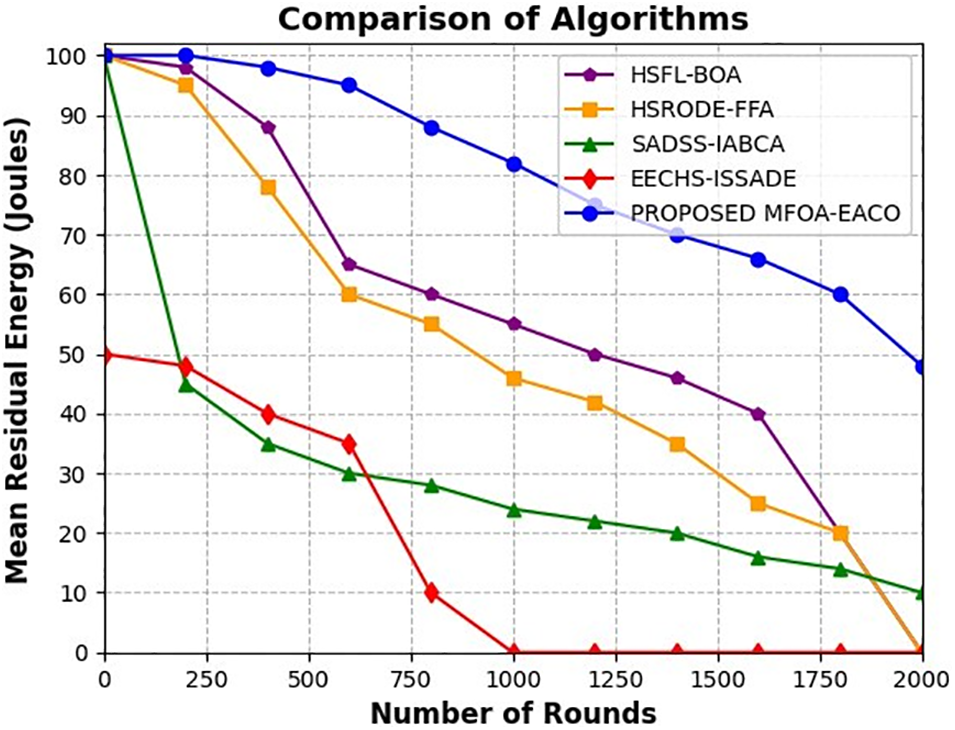
Figure 10: Mean residual energy (J) with different iterations
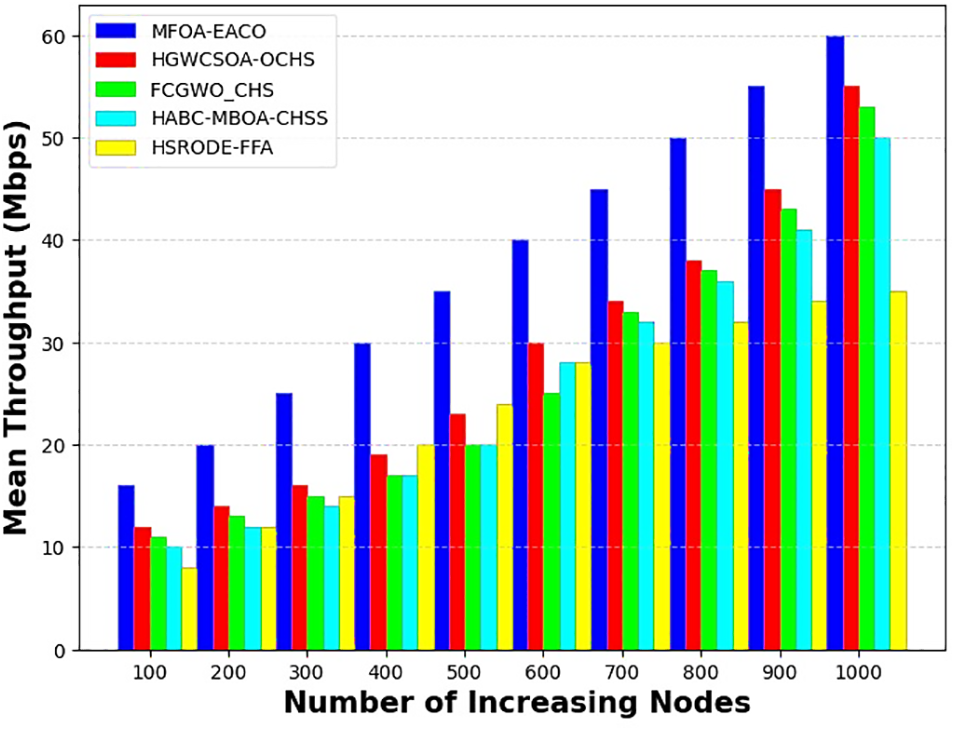
Figure 11: MFOA-EACO mean throughput (Mbps) with an increasing amount of sensor nodes
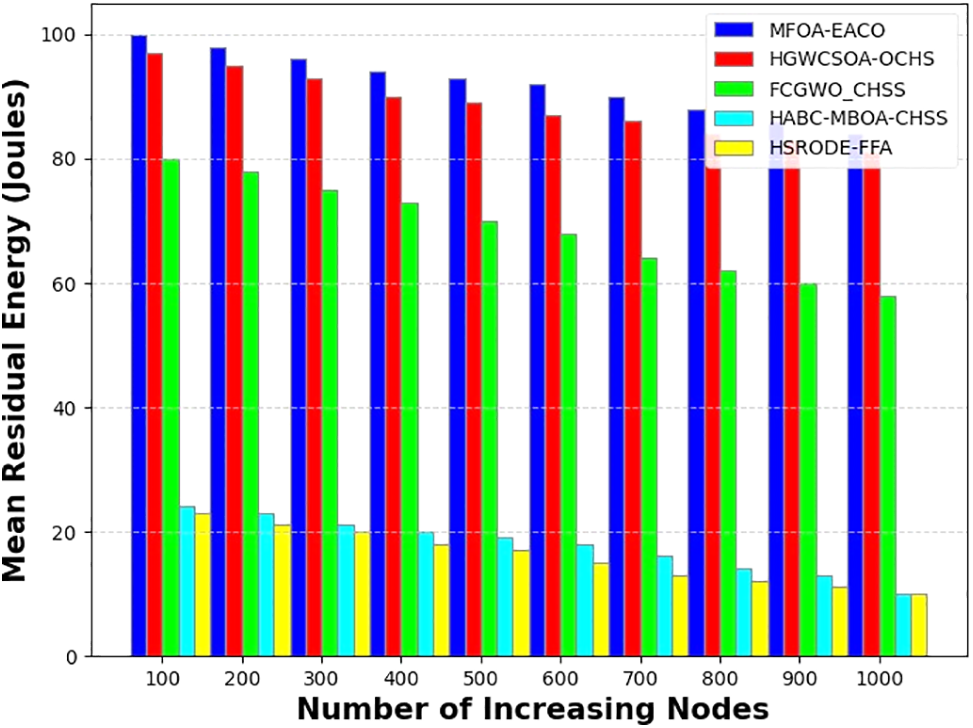
Figure 12: Mean residual energy (J) with an increasing number of sensor nodes
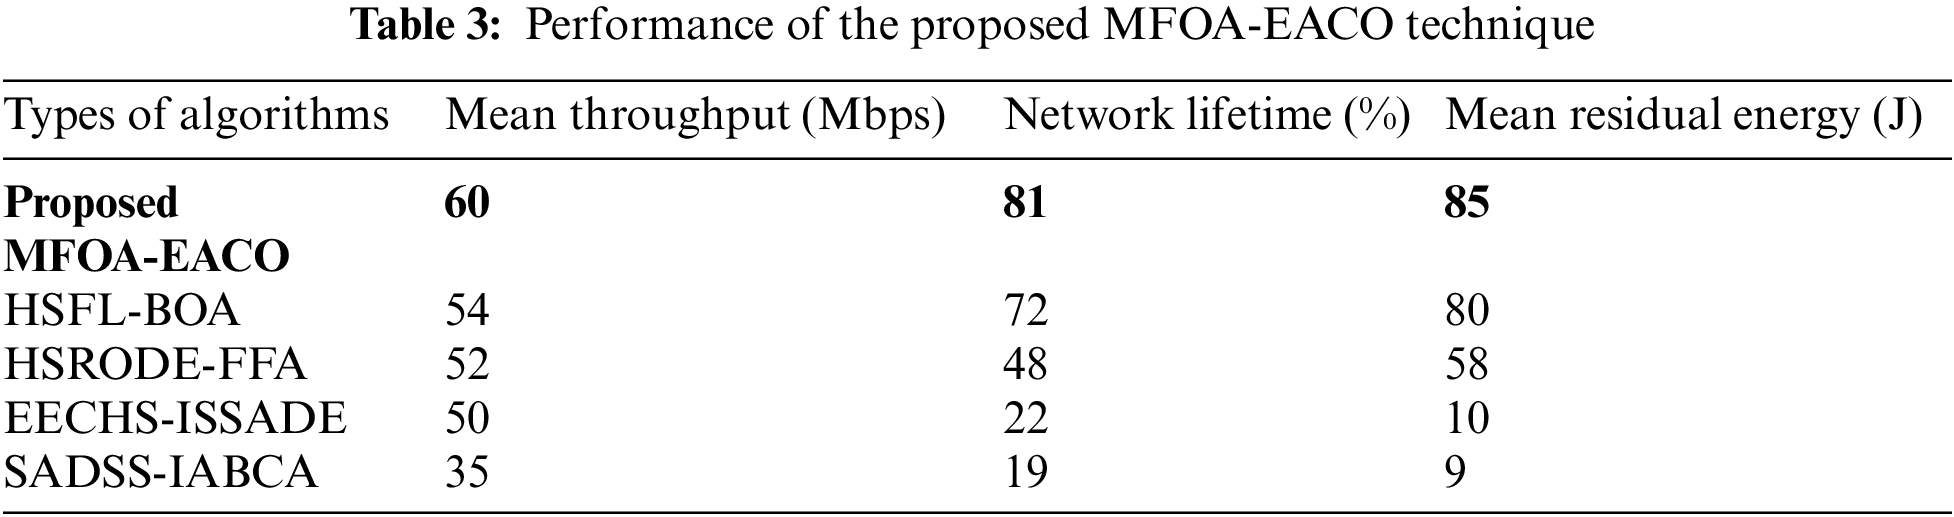
Fig. 13 illustrates the enhancement in network lifespan achieved by the MFOA-EACO scheme compared to the benchmarked CH selection strategies across different network sizes. The hybrid MFOA-EACO algorithm prevents the selection of sensor nodes with low functionality as the cluster head, even with an increasing number of sensors in the overall network. The MFOA-EACO scheme has been shown to increase the network lifespan by 18.2%, 15.28%, 7.39%, and 13.28% compared to the baseline HGWCSOA-OCHS, FCGWO-CHS, HSRODE-FFA, and HABC-MBOA-CHSS CH selection strategies. Table 3 illustrates the performance of the proposed MFOA-EACO scheme over the bench marked schemes.
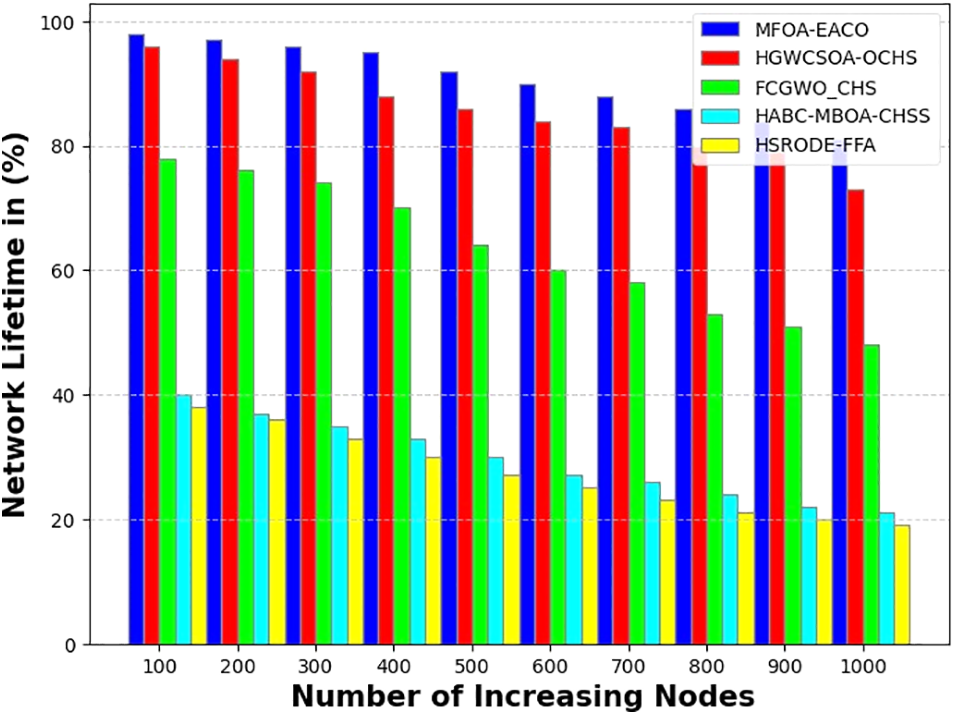
Figure 13: Network lifetime in (%) with an increasing amount of sensor nodes
This research proposes the MFOA-EACO method, which aims to improve the selection of cluster heads in terms of energy stability. The strategy achieves this by finding a balance between exploitation and exploration, thereby boosting the network’s lifespan expectancy. The proposed MFOA-EACO system utilizes the dynamic qualities of MFOA to enable movement across regions in order to locate an optimal solution with faster convergence. It also incorporates two control limits in the clustering process to facilitate exploitation. We found that the proposed MFOA-EACO increases the number of alive nodes in the network by 50% compared to the tested HSFL-BOA, SADSS-IABCA, HSRODE-FFA, and EECHS-ISSADE cluster head selection methods. The mean throughput variation in the proposed MFOA-EACO is enhanced by 38%, whereas the mean throughput variation in the benchmarked HGWCSOA-OCHS, FCGWO-CHS, HABC-MBOA-CHSS, and HSRODE-FFA cluster head selection systems is 25%, 23%, and 20%,18%, respectively, for various sensor nodes. As part of our future goals, we intend to develop hybrid swarm intelligence techniques to pick energy-stabilized cluster heads using new techniques. The purpose is to evaluate the performance of these algorithms with the existing research subject.
Acknowledgement: The authors would like to thank all anonymous reviewers.
Funding Statement: The authors declare that they did not receive funding relevant to this research.
Author Contributions: V. G. Saranya and S. Karthik contributed equally to this work. Conceptualization, V. G. Saranya and S. Karthik; methodology, V. G. Saranya and S. Karthik; writing–original draft preparation, V. G. Saranya; software, V. G. Saranya; validation, V. G. Saranya and S. Karthik; writing review and editing, V. G. Saranya and S. Karthik; supervision, S. Karthik. All authors reviewed the results and approved the final version of the manuscript.
Availability of Data and Materials: All data generated or analyzed during this study are included in this article.
Conflicts of Interest: The authors declare that they have no conflicts of interest to report regarding the present study.
References
1. Sedighimanesh M, Baqeri J, Sedighimanesh A. Increasing wireless sensor networks lifetime with new method. arXiv preprint arXiv:1609.02682; 2016 Sep 9. [Google Scholar]
2. Fang W, Zhang W, Yang W, Li Z, Gao W, Yang Y. Trust management-based and energy efficient hierarchical routing protocol in wireless sensor networks. Digit Commun Netw. 2021;7(4):470–8. doi:10.1016/j.dcan.2021.03.005. [Google Scholar] [CrossRef]
3. Shagari NM, Salleh RB, Ahmedy I, Idris MY, Murtaza G, Ali U, et al. A two-step clustering to minimize redundant transmission in wireless sensor network using sleep-awake mechanism. Wireless Netw. 2022;28(5):2077–104. doi:10.1007/s11276-021-02885-8. [Google Scholar] [CrossRef]
4. Hussain K, Mohd Salleh MN, Cheng S, Shi Y. Metaheuristic research: a comprehensive survey. Artif Intell Rev. 2019;52:2191–233. doi:10.1007/s10462-017-9605-z. [Google Scholar] [CrossRef]
5. Wang J, Liu Y, Rao S, Zhou X, Hu J. A novel self-adaptive multi-strategy artificial bee colony algorithm for coverage optimization in wireless sensor networks. Ad Hoc Netw. 2023;150:103284. doi:10.1016/j.adhoc.2023.103284. [Google Scholar] [CrossRef]
6. Hu J, He M, Rao S, Wang Y, Wang J, He S. Adaptive routing for datacenter networks using ant colony optimization. In: International Conference on Algorithms and Architectures for Parallel Processing; 2023; Singapore: Springer Nature Singapore. pp. 290–309. [Google Scholar]
7. Hassan AA, Shah WM, Habeb AH, Othman MF, Al-Mhiqani MN. An improved energy-efficient clustering protocol to prolong the lifetime of the WSN-based IoT. IEEE Access. 2020;8:200500–17. doi:10.1109/ACCESS.2020.3035624. [Google Scholar] [CrossRef]
8. Han G, Zhang L. WPO-EECRP: energy-efficient clustering routing protocol based on weighting and parameter optimization in WSN. Wirel Pers Commun. 2018;98:1171–205. [Google Scholar]
9. Elsmany EF, Omar MA, Wan TC, Altahir AA. EESRA: energy efficient scalable routing algorithm for wireless sensor networks. IEEE Access. 2019;7:96974–83. [Google Scholar]
10. Rambabu B, Reddy AV, Janakiraman S. A hybrid artificial bee colony and bacterial foraging algorithm for optimized clustering in wireless sensor network. Int J Innov Technol Explor Eng. 2019;8:2186–90. [Google Scholar]
11. Morsy NA, AbdelHay EH, Kishk SS. Proposed energy efficient algorithm for clustering and routing in WSN. Wirel Pers Commun. 2018;103:2575–98. [Google Scholar]
12. Tabatabaei S, Rajaei A, Rigi AM. A novel energy-aware clustering method via Lion Pride Optimizer Algorithm (LPO) and fuzzy logic in wireless sensor networks (WSNs). Wirel Pers Commun. 2019;108:1803–25. [Google Scholar]
13. Zhang Z, Li J, Xu N. Robust optimization based on ant colony optimization in the data transmission path selection of WSNs. Neural Comput Appl. 2021;33:17119–30. doi:10.1007/s00521-021-06303-0. [Google Scholar] [CrossRef]
14. Li X, Keegan B, Mtenzi F, Weise T, Tan M. Energy-efficient load balancing ant-based routing algorithm for wireless sensor networks. IEEE Access. 2019;7:113182–96. doi:10.1109/ACCESS.2019.2934889. [Google Scholar] [CrossRef]
15. Liu X, Yu J, Zhang X, Zhang Q, Fu C. Energy-efficient privacy-preserving data aggregation protocols based on slicing. EURASIP J Wirel Commun Netw. 2020;2020:1–2. doi:10.1186/s13638-020-1643-6. [Google Scholar] [CrossRef]
16. Barshandeh S, Masdari M, Dhiman G, Hosseini V, Singh KK. A range-free localization algorithm for IoT networks. Int J Intell Syst. 2022;37(12):10336–79. doi:10.1002/int.22524. [Google Scholar] [CrossRef]
17. Sharma A, Babbar H, Rani S, Sah DK, Sehar S, Gianini G. MHSEER: a meta-heuristic secure and energy-efficient routing protocol for wireless sensor network-based industrial IoT. Energies. 2023;16(10):4198. doi:10.3390/en16104198. [Google Scholar] [CrossRef]
18. Bhattacharyya T, Chatterjee B, Singh PK, Yoon JH, Geem ZW, Sarkar R. Mayfly in harmony: a new hybrid meta-heuristic feature selection algorithm. IEEE Access. 2020;8:195929–45. [Google Scholar]
19. Sun Z, Wei M, Zhang Z, Qu G. Secure routing protocol based on multi-objective ant-colony-optimization for wireless sensor networks. Appl Soft Comput. 2019;77:366–75. [Google Scholar]
20. Wang Z, Ding H, Li B, Bao L, Yang Z, Liu Q. Energy efficient cluster-based routing protocol for WSN using firefly algorithm and ant colony optimization. Wireless Personal Commun. 2022;125(3):2167–200. [Google Scholar]
21. Tamilarasan N, Lenin SB, Jayapandian N, Subramanian P. Hybrid shuffled frog leaping and improved biogeography-based optimization algorithm for energy stability and network lifetime maximization in wireless sensor networks. Int J Commun Syst. 2021;34(4):e4722. [Google Scholar]
22. Balamurugan AM, Priya MD, Janakiraman S, Malar AC. Hybrid stochastic ranking and opposite differential evolution-based enhanced firefly optimization algorithm for extending network lifetime through efficient clustering in WSNs. J Netw Syst Manage. 2021;29(3):33. [Google Scholar]
23. Bandi R, Ananthula VR, Janakiraman S. Self-adapting differential search strategies improved artificial bee colony algorithm-based cluster head selection scheme for WSNs. Wireless Personal Commun. 2021;121(3):2251–72. doi:10.1007/s11277-021-08821-5. [Google Scholar] [CrossRef]
24. Kathiroli P, Selvadurai K. Energy efficient cluster head selection using improved sparrow search algorithm in wireless sensor networks. J King Saud Univ-Comput Inform Sci. 2022;34(10):8564–75. doi:10.1016/j.jksuci.2021.08.031. [Google Scholar] [CrossRef]
25. Subramanian P, Sahayaraj JM, Senthilkumar S, Alex DS. A hybrid grey wolf and crow search optimization algorithm-based optimal cluster head selection scheme for wireless sensor networks. Wireless Personal Commun. 2020;113(2):905–25. doi:10.1007/s11277-020-07259-5. [Google Scholar] [CrossRef]
26. Rambabu B, Reddy AV, Janakiraman S. Hybrid artificial bee colony and monarchy butterfly optimization algorithm (HABC-MBOA)-based cluster head selection for WSNs. J King Saud Univ-Comput Inform Sci. 2022;34(5):1895–905. doi:10.1016/j.jksuci.2019.12.006. [Google Scholar] [CrossRef]
27. Murugan TS, Sarkar A. Optimal cluster head selection by hybridization of firefly and grey wolf optimization. Int J Wireless Mobile Comput. 2018;14(3):296–305. doi:10.1504/IJWMC.2018.092373. [Google Scholar] [CrossRef]
Cite This Article
 Copyright © 2024 The Author(s). Published by Tech Science Press.
This work is licensed under a Creative Commons Attribution 4.0 International License , which permits unrestricted use, distribution, and reproduction in any medium, provided the original work is properly cited.
 Downloads
 Citation Tools