
 Submit a Paper
 Propose a Special lssue
 Open Access
ARTICLE

Artificial Intelligence Prediction of One-Part Geopolymer Compressive Strength for Sustainable Concrete
1 Department of Civil Engineering, College of Engineering, Jouf University, Sakaka, 72388, Saudi Arabia
2 Department of Civil Engineering, University of Engineering and Technology, Peshawar, 54890, Pakistan
3 Civil Engineering Department, Faculty of Engineering, Al-Azhar University, Cairo, 11884, Egypt
4 Civil Engineering Department, Faculty of Engineering, Aswan University, Aswan, 81528, Egypt
* Corresponding Author: Ahmed. M. Yosri. Email:
(This article belongs to the Special Issue: Recent Advances in Computational Methods for Performance Assessment of Engineering Structures and Materials against Dynamic Loadings)
Computer Modeling in Engineering & Sciences 2024, 141(1), 525-543. https://doi.org/10.32604/cmes.2024.052505
Received 03 April 2024; Accepted 12 June 2024; Issue published 20 August 2024
 View Full Text
 Download PDF
Abstract
Alkali-activated materials/geopolymer (AAMs), due to their low carbon emission content, have been the focus of recent studies on ecological concrete. In terms of performance, fly ash and slag are preferred materials for precursors for developing a one-part geopolymer. However, determining the optimum content of the input parameters to obtain adequate performance is quite challenging and scarcely reported. Therefore, in this study, machine learning methods such as artificial neural networks (ANN) and gene expression programming (GEP) models were developed using MATLAB and GeneXprotools, respectively, for the prediction of compressive strength under variable input materials and content for fly ash and slag-based one-part geopolymer. The database for this study contains 171 points extracted from literature with input parameters: fly ash concentration, slag content, calcium hydroxide content, sodium oxide dose, water binder ratio, and curing temperature. The performance of the two models was evaluated under various statistical indices, namely correlation coefficient (R), mean absolute error (MAE), and root mean square error (RMSE). In terms of the strength prediction efficacy of a one-part geopolymer, ANN outperformed GEP. Sensitivity and parametric analysis were also performed to identify the significant contributor to strength. According to a sensitivity analysis, the activator and slag contents had the most effects on the compressive strength at 28 days. The water binder ratio was shown to be directly connected to activator percentage, slag percentage, and calcium hydroxide percentage and inversely related to compressive strength at 28 days and curing temperature.Keywords
Low carbon-based geopolymers (GP) are plentiful in both strength and durability. When enough alkaline activator is added (either as an aqueous solution or as a solid powder or grain), the aluminosilicate material will polymerize to create chemically bound inorganic polymers [1]). These inorganic polymers share several chemical characteristics with zeolites found in nature, whereas geopolymer gels are naturally amorphous [2,3]. The primary components of the aluminosilicate precursor are waste products from various industrial and agricultural processes, which reduce the need for non-renewable resources and offer a beneficial method of waste utilization. Compared to ordinary Portland cement (OPC), geopolymers have much lower carbon emissions and energy requirements while having outstanding working and durability characteristics. A well-formulated geopolymer mix can reduce carbon emissions and energy usage by up to 80% and 60%, respectively [4,5].
The chemical makeup and reaction of the source materials significantly impact the final products’ characteristics and the geopolymer’s eco-performance. As an illustration, the final product in the case of calcium-rich precursors (such as Class C fly ash (CFA) and Blast furnace slag (BFS) is calcium aluminate gel (C-S-H), which provides relatively high strength but low durability in comparison to sodium alumino-silicate gel (N-A-S-H), which is obtained through geo-polymerization of silica and alumina-rich precursors (such as class F fly ash, lithium slag) [6–8]. Furthermore, the geo-polymerization reaction is frequently triggered by heat since precursors rich in silica and alumina are not very reactive. Therefore, to induce hardening at room temperature, they are commonly utilized in conjunction with highly reactive calcium-rich precursors [9]. Geopolymers can be divided into two groups based on the kind of alkali: Conventional geopolymer and one-part geopolymer. Both types of geopolymer have similar source materials and mechanical properties. The one-part geopolymer is more environmentally friendly and practically feasible because it uses a powdered activator rather than the highly corrosive alkaline solution used in conventional geopolymer [10,11]. However, it cannot be easy to acquire desirable qualities and ecological benefits due to the diversity and varied composition of the source materials. According to published studies, the type and content of source materials, additives, water binder ratio, curing temperature and time, and curing temperature and period are the essential characteristics that determine the properties and environmental performance of geopolymer [12].
Researchers are increasingly relying on predictive models to estimate the strength and other characteristics of cement-based composites since they reduce resource waste, experiment repetition, and time consumption [13,14]. By examining and forecasting several facets of the material, machine learning can help assess how well concrete can be designed. Based on their composition, curing conditions, and other pertinent variables, machine learning algorithms can be trained on historical data to predict concrete’s compressive strength, durability, and other performance characteristics. Relationships between various parameters can be found using regression models, which aid in mixture design optimization for desired qualities. The prediction of strength and other properties of cement-based materials has previously been made using a variety of machine learning (ML) approaches, including decision trees (DT), AdaBoost, support vector machines (SVM), gene expression programming (GEP), random forests (RF), and artificial neural networks (ANN) [15–17]. In forecasting the strength characteristics and other parameters of cement-based composites, these models have shown good performance [18]. However, only a tiny amount of research has been done on geopolymer strength prediction using machine learning algorithms [19–23].
GEP was used by Ali Khan et al. [24] to forecast the compressive strength of geopolymer concrete. The algorithm was said to have predicted the behavior of geopolymer concrete accurately. Similar findings relating to the GEP algorithm’s effective modeling capabilities for geopolymer concrete were also reported in other studies [25,26]. To calculate the mechanical strength of geopolymer concrete using bottom ash and fly ash, Aneja et al. [22] used an ANN-based model. According to the report, the compressive strength of the geopolymer was successfully predicted by the ANN model. Several other researchers have used the AAN technique to forecast compressive strength using other input variables and datasets, and they saw encouraging results [27,28]. However, all of this earlier research used conventional geopolymer, and there is no information in the literature about the application of ANN and GEP to forecast the strength of one-part geopolymer. Moreover, the one-part geopolymer’s reaction mechanism and behavior are significantly different from conventional geopolymer [29]; the machine learning models developed for conventional geopolymer cannot be applied to one-part geopolymer. Therefore, it is necessary to build a machine learning model for strength prediction and mix proportioning of one-part geopolymer. In this study, GEP and ANN are utilized to predict the compressive strength of a one-part geopolymer. Additional parametric and sensitivity analysis is performed to identify the most significant parameters and their respective impact.
This article encompasses machine learning models for predicting the compressive strength of one-part geopolymer concrete. The data was obtained from the published literature presented in Section 2.1. The key parameters influencing the compressive strength of one-part geopolymer were identified. The models (ANN and GEP) were trained several times to obtain their best hyperparameters for the specific problem (Step 1). Based on hyperparameter tuning, the input data was trained (Step 2). The validation data were also used to verify the reliability of the model. The discussion of Steps 1 and 2 is provided in Sections 2.2 and 2.3. After the training, the performance of the models was evaluated using correlation and error indices (Step 3, Section 3.1). Finally, the sensitivity and parametric analysis were obtained based on the trained model to see the influence of each input parameter (Step 4, Section 3.2). The methodology flow chart is given in Fig. 1.
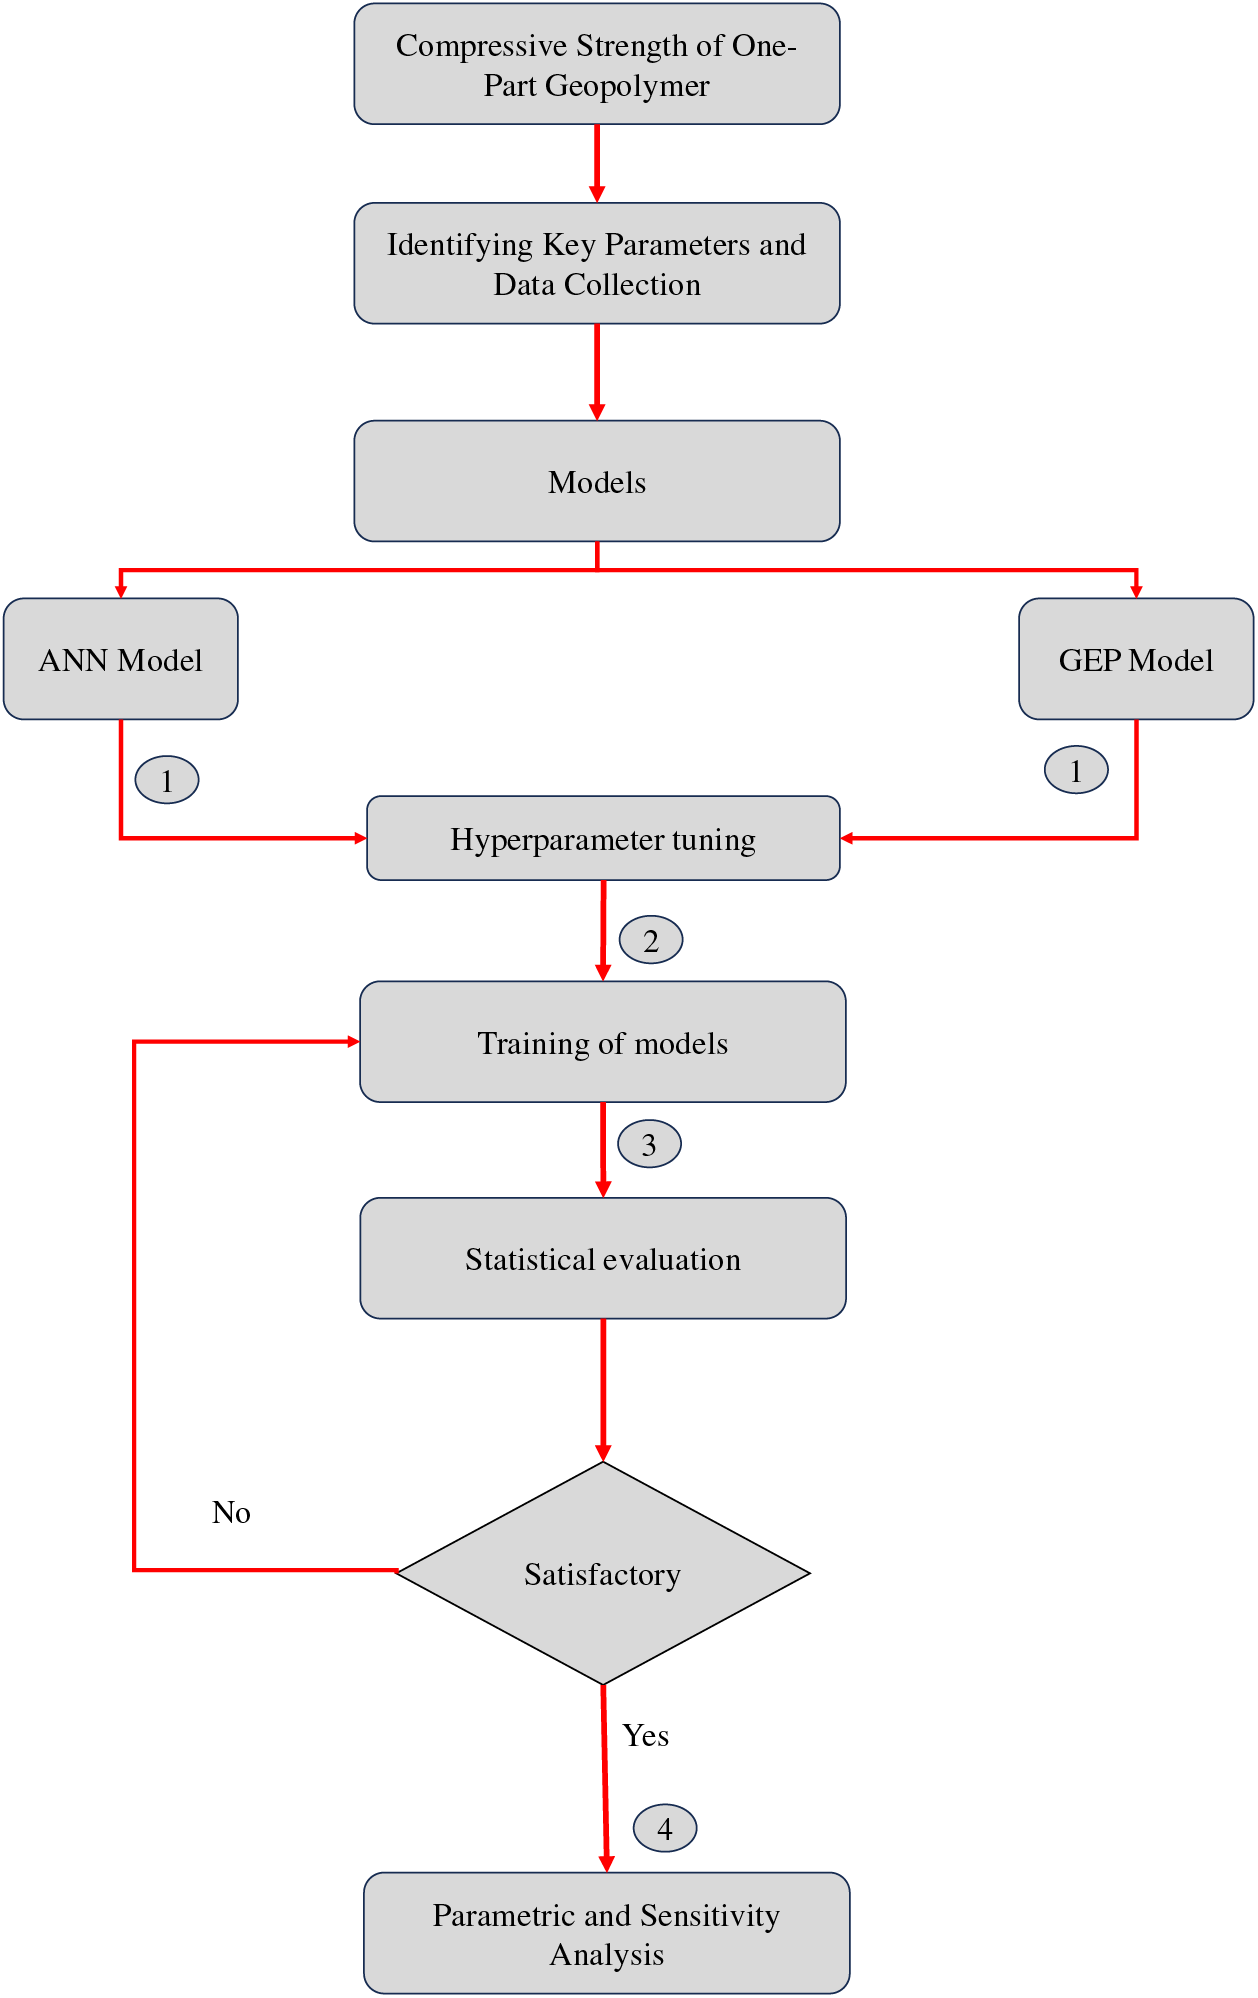
Figure 1: Flow diagram of the methodology of this study
The database is made up of 28 days of compressive strength results (28-d) for several geopolymer mixtures that were gathered from the previously published research articles which studied the properties of one-part geopolymer cement [30–35] and some studies which analyzed the microstructure and properties of one-part geopolymer concrete [35–41], in addition to published articles which discussed the effects of admixtures on mix design of one-part geopolymer concrete [42–48]. The collection includes 171 records for one-part GP compressive strength results. The input variables selected for this experiment include fly ash concentration (% by weight), slag content (% by weight), calcium hydroxide content (% by weight), sodium oxide dose (% by weight), water binder ratio, and curing temperature (°C). The input variables were selected on the basis of data preprocessing in the form of Pearson’s correlation analysis, which showed the importance of the given attributes. The distribution of the input variables significantly impacts the model’s capacity to generalize. Frequency histograms were generated for each variable in the chosen database of one-part geopolymer, as shown in Fig. 2. The histograms show the magnitude of the respective input variable (in terms of bin range) on the x-axis, whereas the frequency of each bin range is shown on the y-axis. The distribution of the data shows even distribution for the fly ash concentration, slag content, and w/b ratio. The other parameters are a little skewed, which is also evident from the statistics in Table 1. However, the statistics of the variation in the data are within the allowable limits, as explained below.
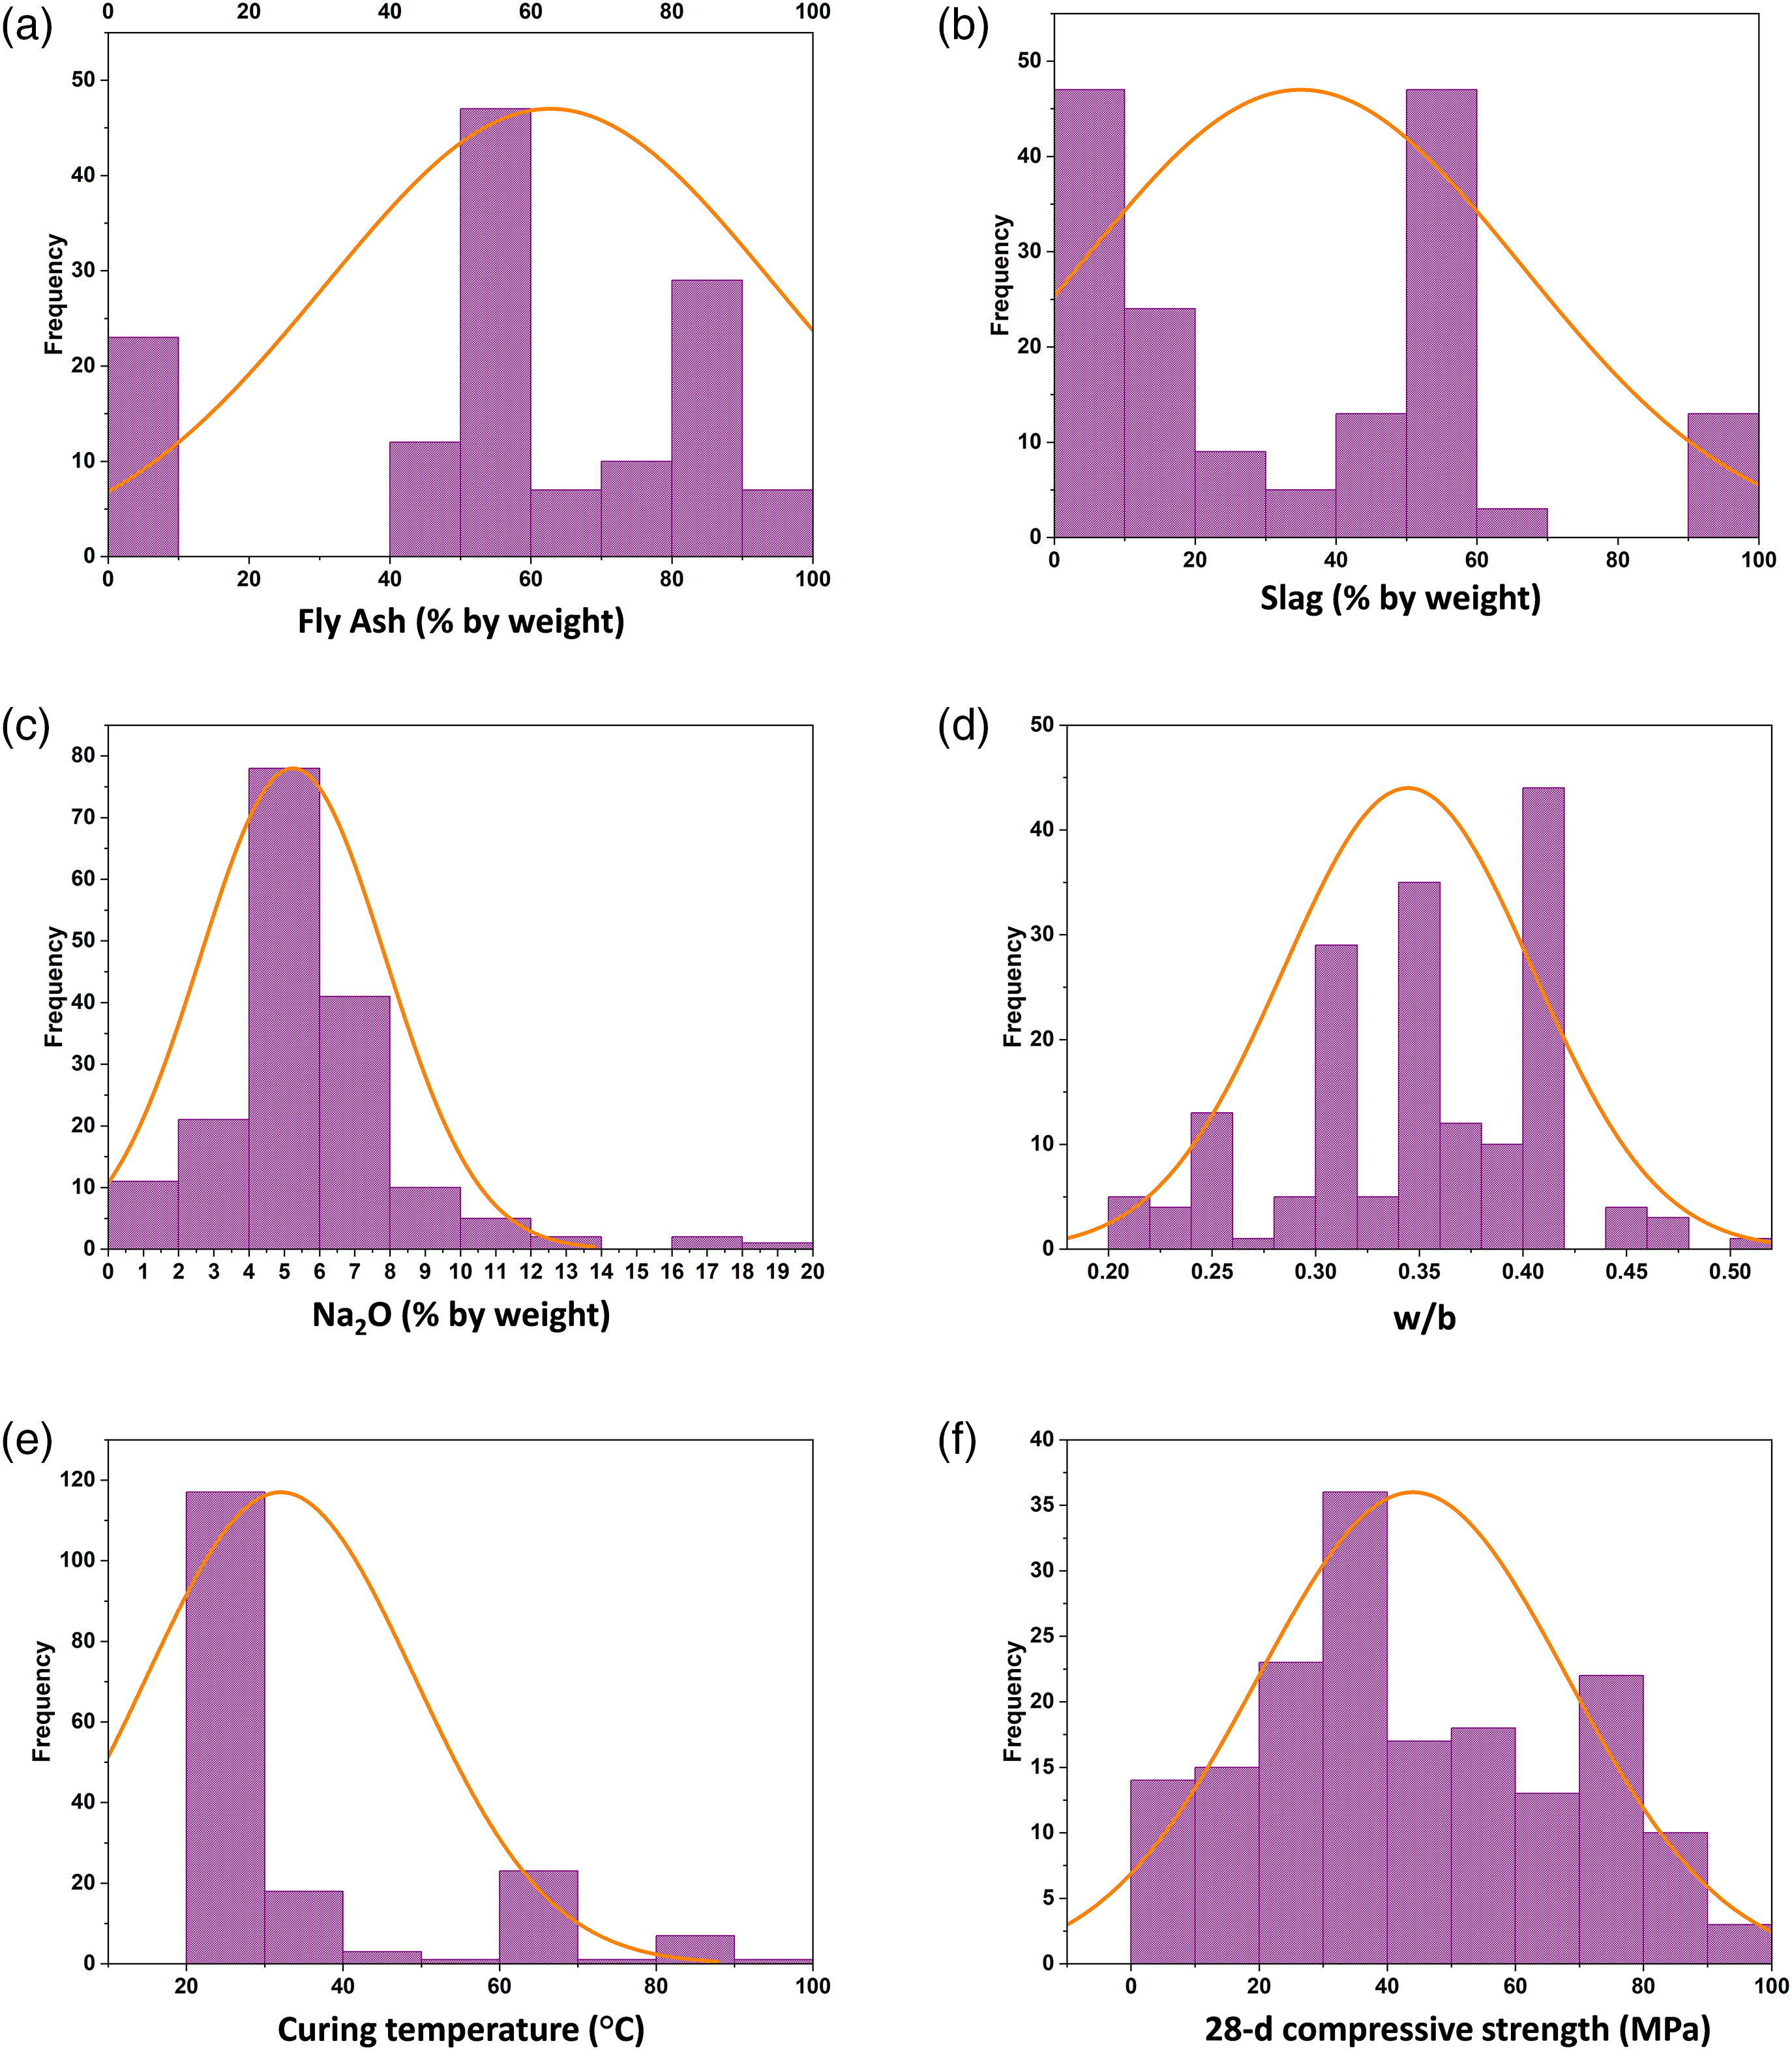
Figure 2: Histogram of input and output variables (a) Fly ash concentration (%) (b) Slag content (%) (c) Na2O (%) (d) w/b ratio (e) Curing temperature (°C) (f) Compressive strength (MPa)
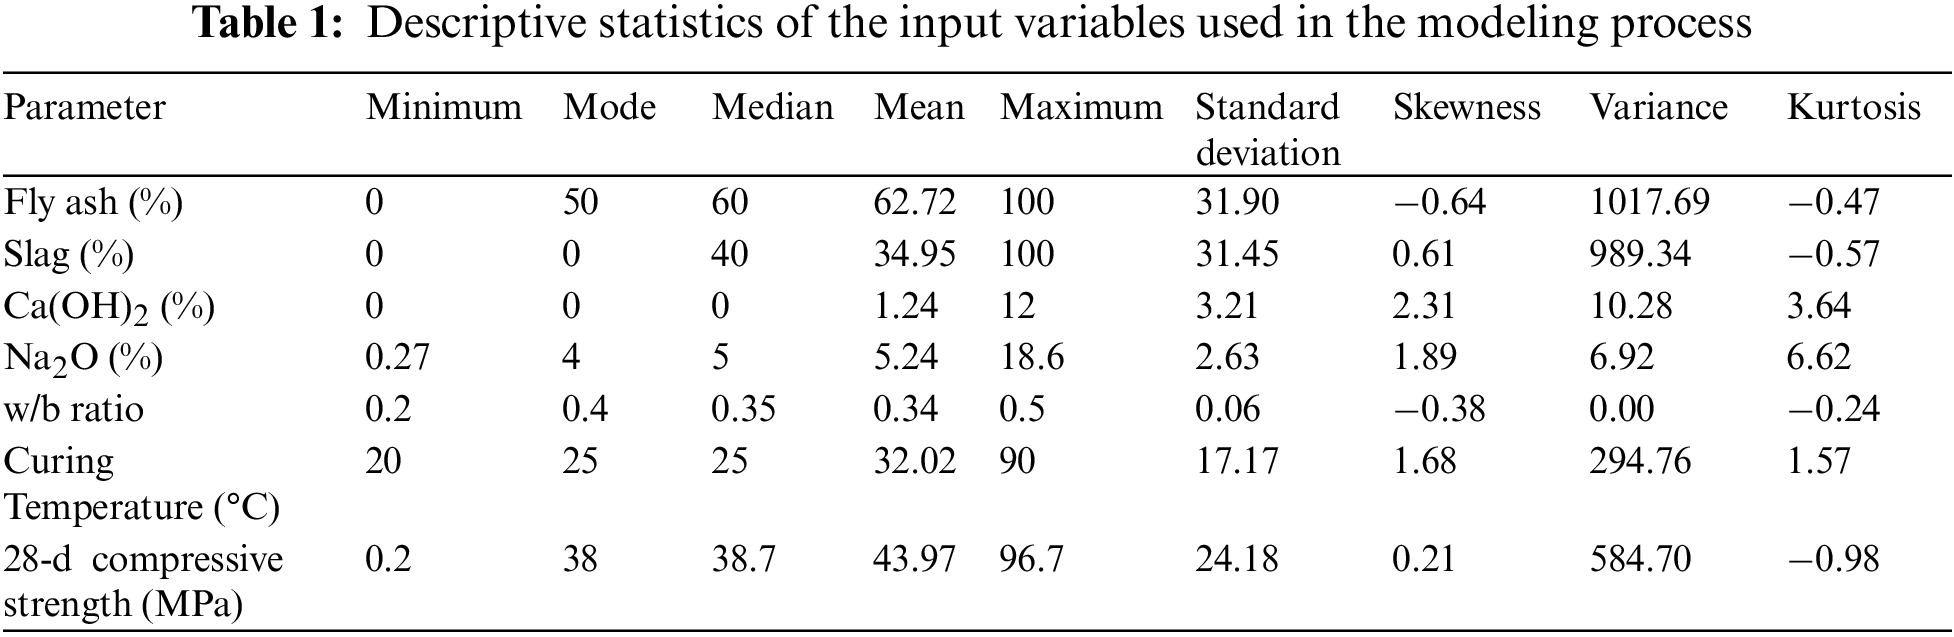
The determined statistical properties of the database are displayed in Table 1. The highest, lowest, and average input and output values show that the database has a variety of data, suggesting that the developed model will be applicable in a wide range of situations. Each input parameter’s standard deviation was also determined. In contrast, the standard deviation of Ca(OH)2, Na2O dose, and w/b ratio is minor, showing that most data points are near average. The Mode values for the given inputs show that 50%, 0%, 0%, 4%, 0.4 and 25°C most frequently appeared in the data for fly ash concentration, slag content, calcium hydroxide content, sodium oxide dose, water binder ratio, and curing temperature, respectively. The standard deviation of FA, BFS, curing temperature, and 28-d compressive strength is substantial, indicating that data points are widely spread. The dataset’s shape was evaluated using the skewness and kurtosis measures. Kurtosis in the −10 to +10 range has been previously reported to indicate that the data is well-shaped for the probability distribution [49]. All of the database’s input and output variables have kurtosis values that fall within the previously specified range. While kurtosis for FA, BFS, w/b ratio, and 28-d compressive strength is negative, it indicates that the tail of the data is on the left side of the distribution curve for these variables. Conversely, kurtosis for Ca(OH)2, Na2O dosage, and curing temperature is favorable, suggesting that the tail of the data is on the right side of the distribution curve for these variables.
2.2 GEP-Based Prediction Modeling
Ferreira suggested the GEP model, which combines the fixed-length simple linear chromosomes of genetic algorithms and the parse trees system of gene programming [50]. Function set, terminal set, control parameters, fitness functions, and terminal conditions are the prerequisites for using GEP. Fig. 3 displays the stages involved in GEP analysis. The first step is to give each input a set of chromosomes with a specified length. These chromosomes are expressed in expression trees in the subsequent step, and the fitness of each expression tree is assessed. Following the application of the reproduction process (crossover, replication, and genetic mutation), the most suitable individuals are selected. Until the ideal answer is found, this iteration process is continued. The GEP model’s applicability for issues like mix design optimization, among others, is a result of its capacity to create straightforward mathematical equations to predict desired results based on input parameters.
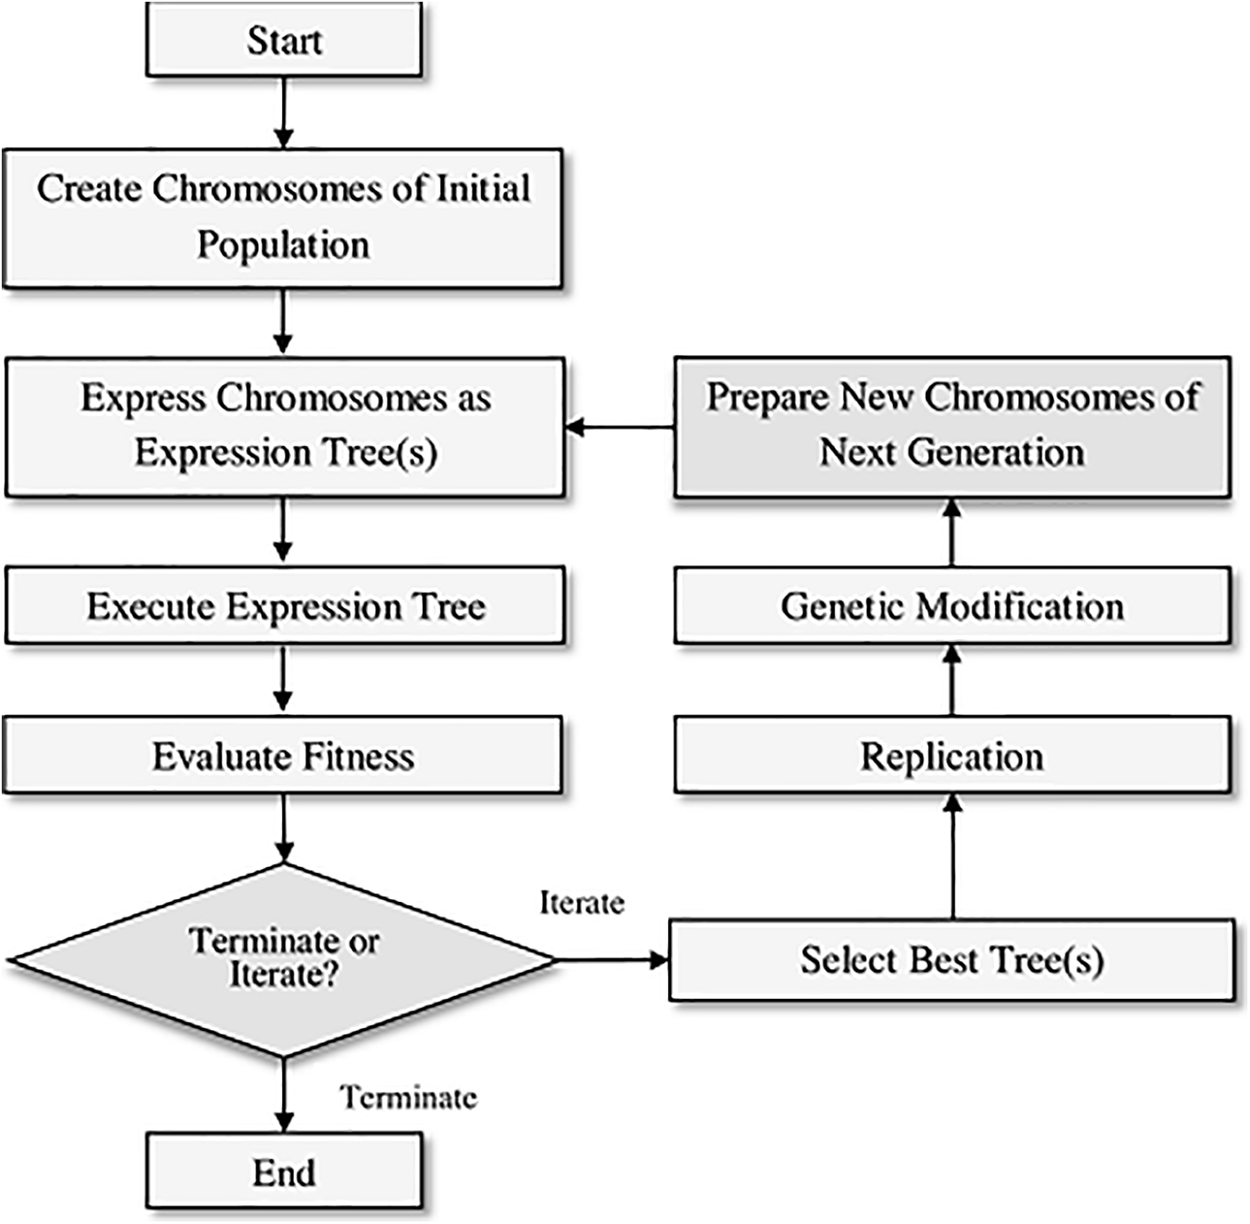
Figure 3: Schematic layout of GEP model [22]
The software GeneXproTools Version 5 was used to carry out the GEP modeling process [51]. The modeling environment was first given a 171-point dataset with variables identified as both inputs and goal variables. The data was split into a 70% training set and a 30% validation set using random partitioning. Many parameter values were systematically adjusted in order to create a high-performance model. The root-mean-square error (RMSE) was selected as the fitness function, allowing for the modification of factors like head size, chromosome count, and gene number. Genetic parameters, such as recombination operators, RIS transposition, IS transposition, and mutation likelihood, were established based on hyperparameter tuning (Table 2). The addition was defined as the linking function between expression trees (ETs), and addition, subtraction, division, square root, and squared multiplication were the linking functions inside ETs. Iterative refining of the model was carried out until it attained optimal fitness, at which point further improvements in correlations and error indices were insignificant. To avoid overfitting, the validation data’s performance was continuously assessed. The modeling procedure came to an end when optimal performance was attained.
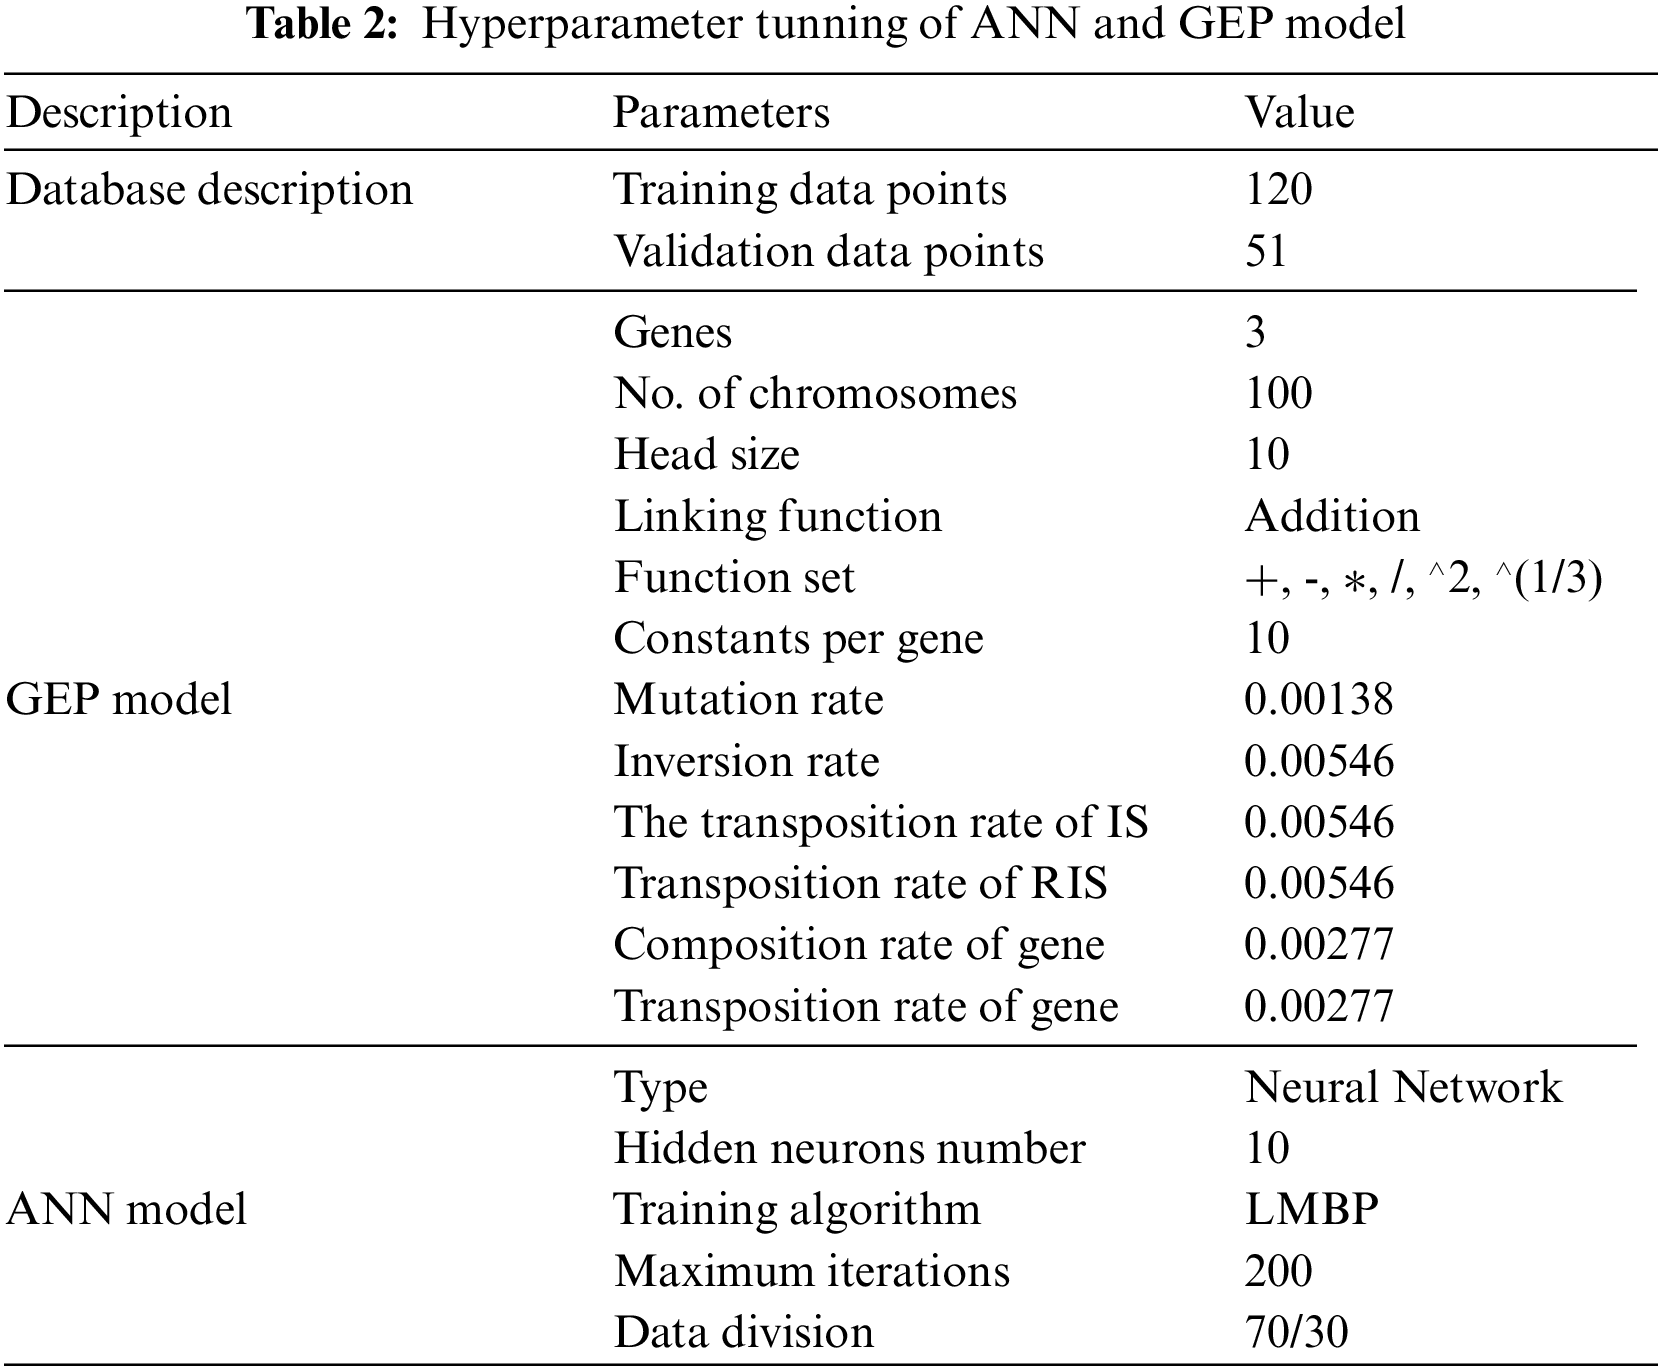
Table 2 lists the genetic operators and input setting parameters that were chosen in accordance with previously released information for comparable analysis.
2.3 ANN-Based Prediction Modeling
One of the most extensively used approaches for data mining and machine learning is the artificial neural network (ANN), a technology based on the biological neural network of the human brain [52]. In contrast to typical computational models, ANN models can learn from the database the underlying complicated nonlinear relationship between the dependent and independent variables. They also do not need specified limitations or assumptions. The ANN model is adequate for situations requiring massive datasets due to its parallel processing capability. The nodes in an ANN model are arranged in three different layers: An input layer, an output layer, and hidden layers. Multi-layered networks typically offer greater accuracy than single-layered networks. The best-concealed layer is found using the trial-and-error method. The three main layers of an artificial neural network (ANN) are input, hidden, and output. Here, the input attributes were introduced into the ANN network in array form in MATLAB. The input layer supported six distinct input parameters. The inputs were partitioned into 70% training and 30% validation data. Trial-based hyperparameter tweaking was used to determine the ideal setup, which included 10 hidden neurons in a single hidden layer. Due to its quick convergence and excellent accuracy properties, the Levenberg-Marquardt backpropagation technique was utilized for the training dataset. Table 2 lists the hyperparameters for the ANN model.
In order to verify the effectiveness of the models, a variety of validation procedures were used in this study, including correlation (R), relative root mean square error (RRMSE), root mean square error (RMSE), mean absolute error (MAE), and relative squared error (RSE). The values of these statistical indices are calculated using Eqs. (1) to (5). In the given equations,
These statistical criteria have also been employed in earlier research to evaluate the precision of AI models [53,54]. A more accurate model frequently has lower RMSE and MAE values. On the other hand, a model is considered to be more precise when the R-value is close to 1. A value of R-value greater than 0.8 denotes a significant correlation between expected and experimental results [55]. R-value assesses the linear dependency between independent and dependent variables.
3.1 Performance Evaluation of Various Models
Key statistical indices, such as R, RMSE, RRMSE, RSE, and MAE, have all been used to assess the efficacy of the generated models thoroughly. Table 3 displays the equivalent values for these indices for the GEP and ANN models on the training and validation datasets. For the GEP model, the training and validation datasets have correlation coefficients (R) of 0.82 and 0.81, respectively. This suggests that there is a fair correlation between the input and output variables [56]. On the other hand, with values of 0.96 and 0.90 for the training and validation datasets, respectively, the ANN model shows noticeably higher correlation coefficients. These high R-values indicate a strong correlation between the input and output variables, highlighting the ANN model’s more extraordinary predictive ability over the GEP model.
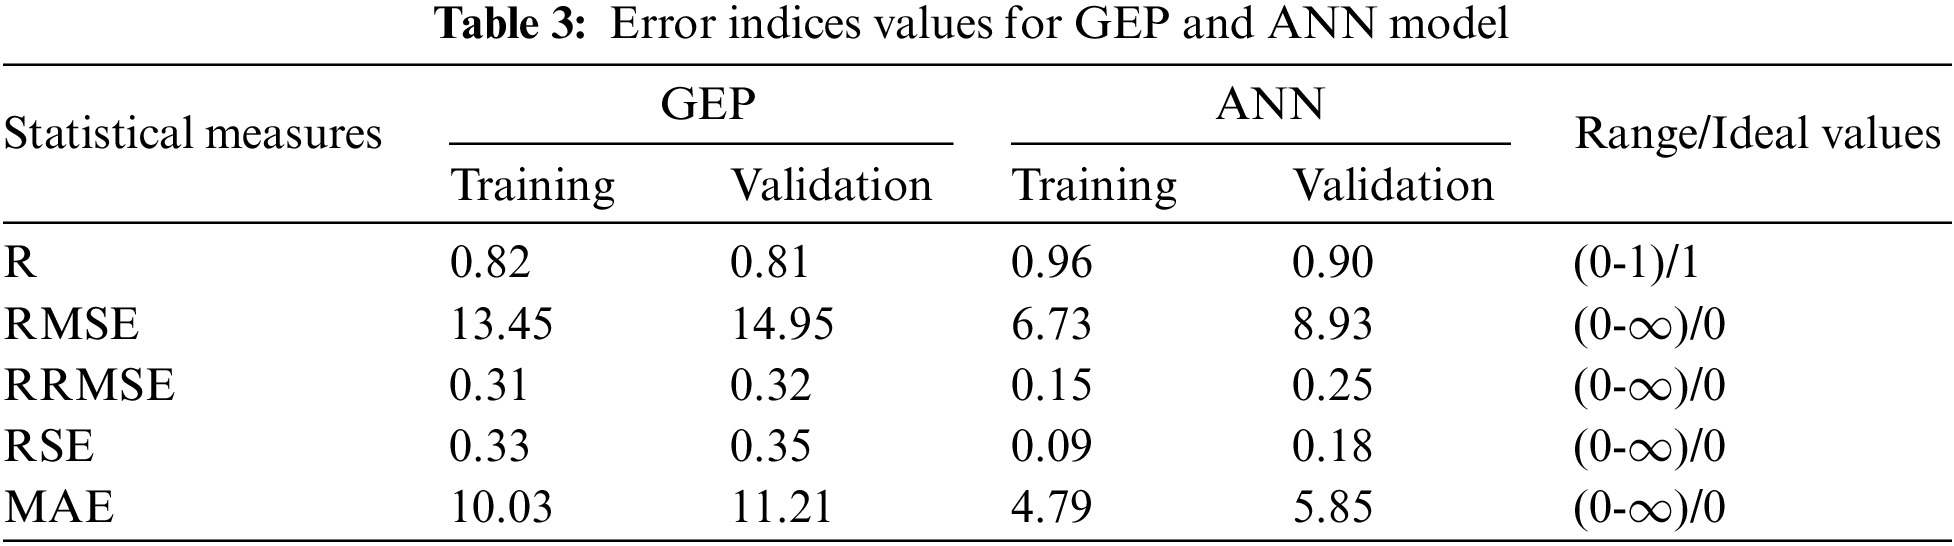
Upon examining the validation dataset, the GEP model produces values for RMSE, RRMSE, RSE, and MAE that are, respectively, 14.95, 0.32, 0.35, and 11.21. By contrast, the ANN model yields far lower values—that is, 8.93 for RMSE, 0.25 for RRMSE, 0.18 for RSE, and 5.85 for MAE—for these error metrics. This discrepancy in error indices highlights the ANN model’s improved predictive performance even more, especially in its capacity to generate precise forecasts for data that has never been observed before.
To put it briefly, the analysis of these statistical indices highlights the advantages of the ANN model over the GEP model, emphasizing the latter’s inability to forecast outcomes on the validation dataset with the former’s superior accuracy and dependability.
Fig. 4 presents the overall evaluation of the complete database and shows the absolute errors of the predictions made by the GEP and ANN models in addition to the outcomes of experimental trials. This figure comprehensively represents the absolute errors in both models. Upon closer inspection, it becomes clear that the absolute errors for the GEP and ANN models both lie within a reasonable range, suggesting that they are generally capable of making correct predictions for the provided data. For both the GEP and ANN models, the average absolute error—a critical performance indicator—is 10.52 and 6.07 MPa, respectively. This significant variation in average absolute error validates the ANN model’s higher prediction accuracy than the GEP model. Since the difference between the values of R and error indices for the training and validation data is more significant in the case of the ANN model, it can be argued that the ANN model is slightly more overfitted than the GEP model.
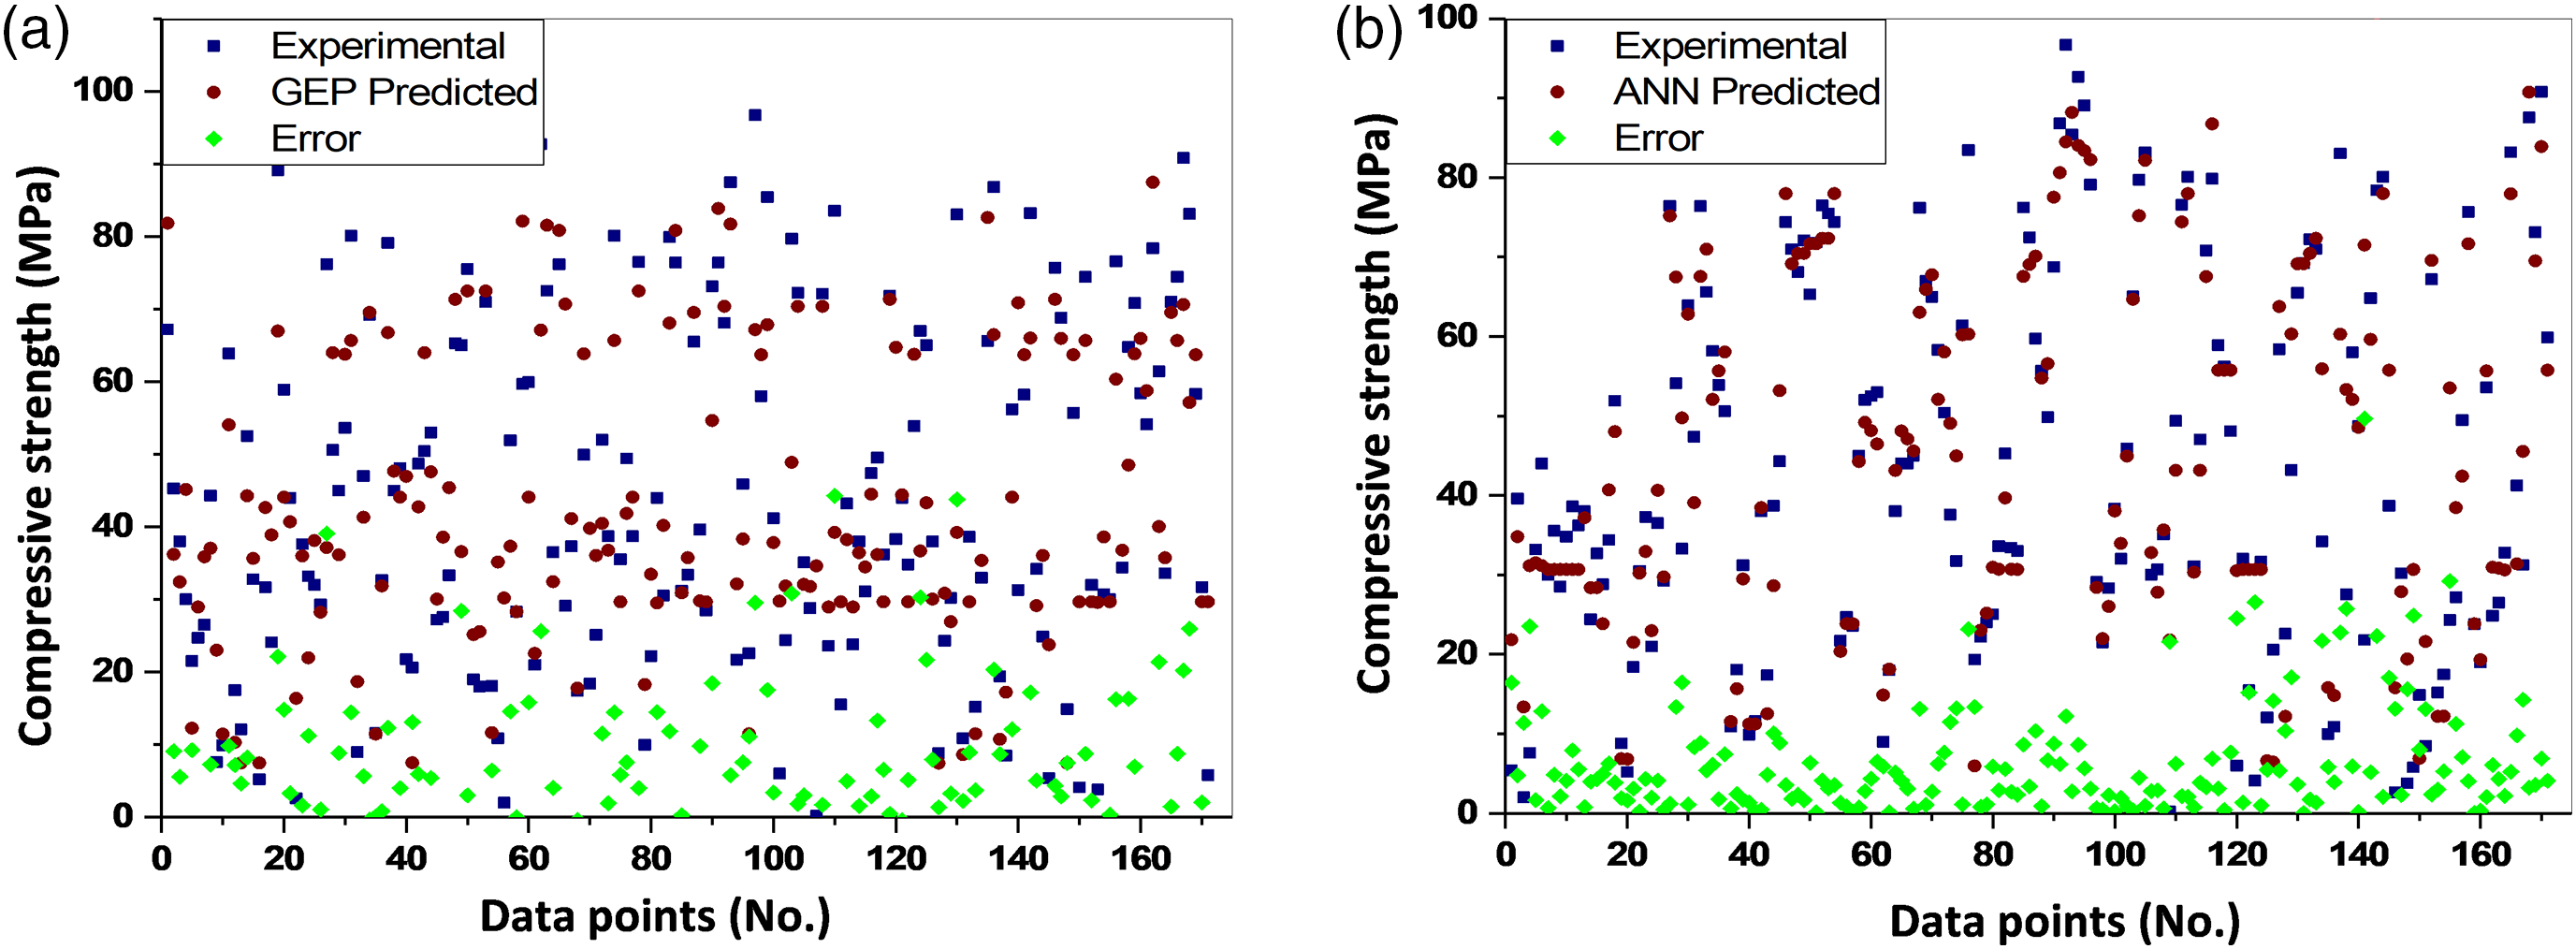
Figure 4: Absolute error representation of (a) GEP and (b) ANN model
Moreover, it is significant that both models show similar absolute maximum errors, even though the ANN forecasts have a noticeably lower incidence rate of maximum errors. This implies that, in spite of the ANN model’s generally improved performance, the GEP model occasionally achieves equivalent accuracy levels, especially when it comes to absolute maximum errors. The examination of average and maximum absolute errors, along with the display of the whole database in Fig. 2, supports the conclusion that the ANN model performs better than the GEP model in terms of prediction accuracy. It is important to note, nevertheless, that both models exhibit respectable accuracy within a reasonable range, with the GEP model occasionally outperforming the others in terms of absolute maximum errors.
Fig. 5 displays the 28-d compressive strength values such that experimental values are plotted on the x-axis and the predicted values on the y-axis. The observation is coupled with an ideal fit and a linear fit of ANN and GEP models. The proximity of the regression line to the perfect fit line and the proximity of the slope to unity are two indicators of models shown in this figure [53]. Fig. 5 shows that the regression line for the 28-d compressive strength result is very close to the perfect fit line, demonstrating that the ANN model accurately captured the effect of all input parameters. As can be observed, the GEP model’s projected compressive strength findings are significantly less accurate than those of the ANN model.
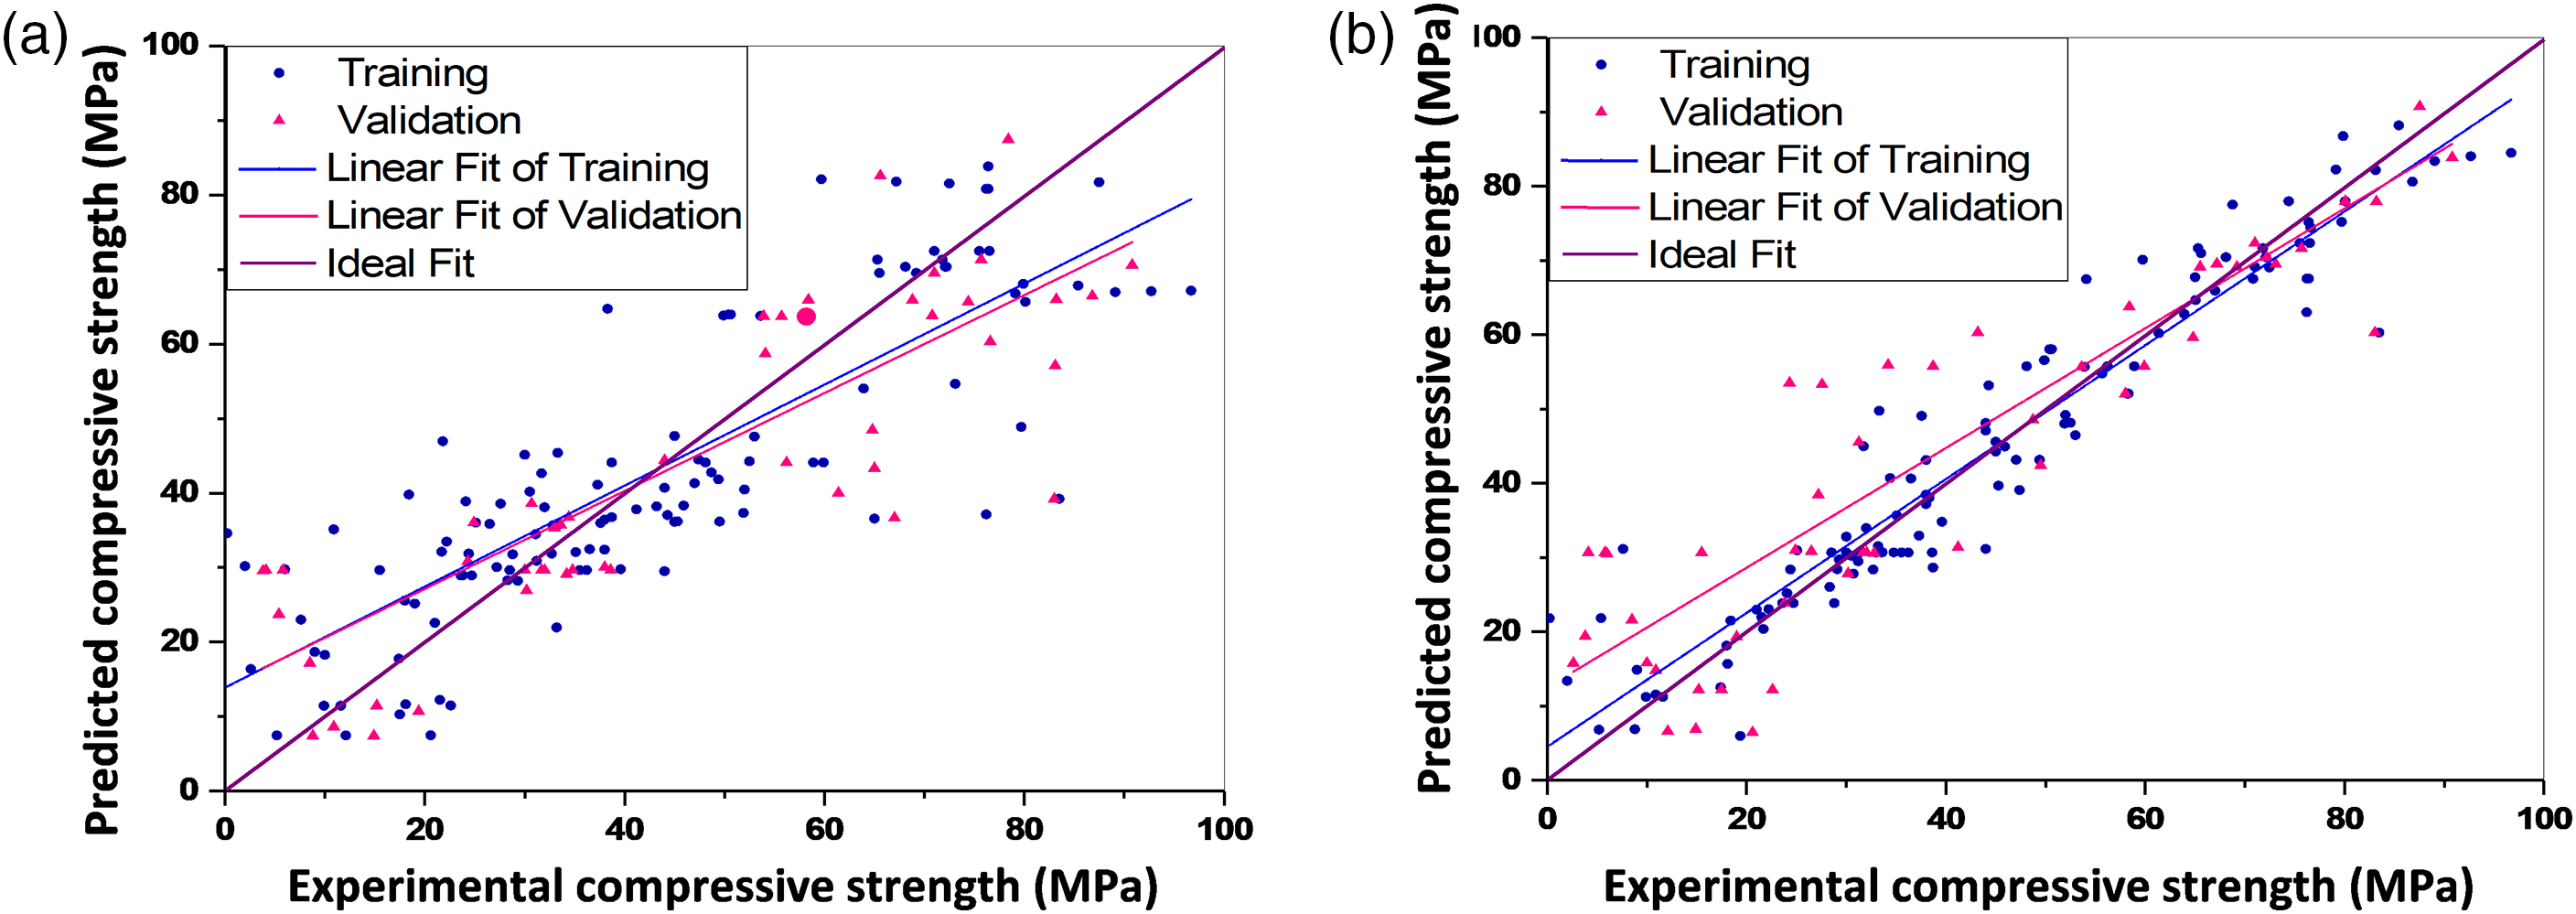
Figure 5: Performance comparison of (a) GEP model (b) ANN model
For sensitivity analysis, a simulated database was created in the form of a separate matrix such that the first variable was changed in equal intervals between its extremes, and the remaining values were maintained at their average values; then, the second parameter was altered while keeping first, third, fourth, fifth and sixth parameter constant at their average values, and so on. The average values of input variables were taken as constant for the parametric study already revealed in Table 1. The database created was tested on the basis of a trained model to predict the target variables. The ANN model was used for sensitivity and parametric evaluation owing to its substantial accuracy performance compared to the GEP model. The results obtained for each input parameter were used to calculate the sensitivity of the parameter. For instance, 20 equal intervals were used for the first parameter, fly ash concentration, and the values of compressive strength obtained were used to find the range (maximum-minimum). Similar calculations were made for all the six variables. The range for each parameter was divided by the sum of all ranges to obtain the sensitivity of the variable in terms of percentages. Numerous academics have previously employed this technique to undertake sensitivity analysis [57,58]. Using the sensitivity analysis method described above, the impact of each input parameter on the 28-d strength forecasting of one-part geopolymer was assessed for this study.
The contribution of each parameter to the anticipated 28-d strength of one part geopolymer is shown in Fig. 6. The dosage of sodium oxide (Na2O) has the most significant influence (38.73%) on the prediction of the 28-d strength of the one-part geopolymer. This outcome is consistent with earlier research on conventional geopolymers and other experimental studies using analogous materials. It has been previously stated that the amount of alkaline activator directly correlates to the dissolution of precursors [59]. As a result, it makes sense that sodium oxide contributes the most to the 28-d strength of one part geopolymer. Slag content makes the second largest (31.47%) contribution to predicting 28-d strength, following the Na2O concentration. One-part geopolymer’s compressive strength is significantly impacted by the production of additional reaction products (calcium silicate hydrate gel and calcium alumino-silicate hydrate gel) in geopolymer systems as a result of the inclusion of slag [60,61]. Fly ash and curing temperature both make a sizable 17.27% and 9.02% contribution, respectively, to the prediction of compressive strength. However, there is virtually little correlation between compressive strength prediction and w/b ratio. Although water does not participate in the geopolymerization reaction, like the hydration reaction, dependence is still reasonable. The dataset employed in this study (owing to the comparatively modest range of variation) may, however, be to blame for the extraordinarily low reliance.
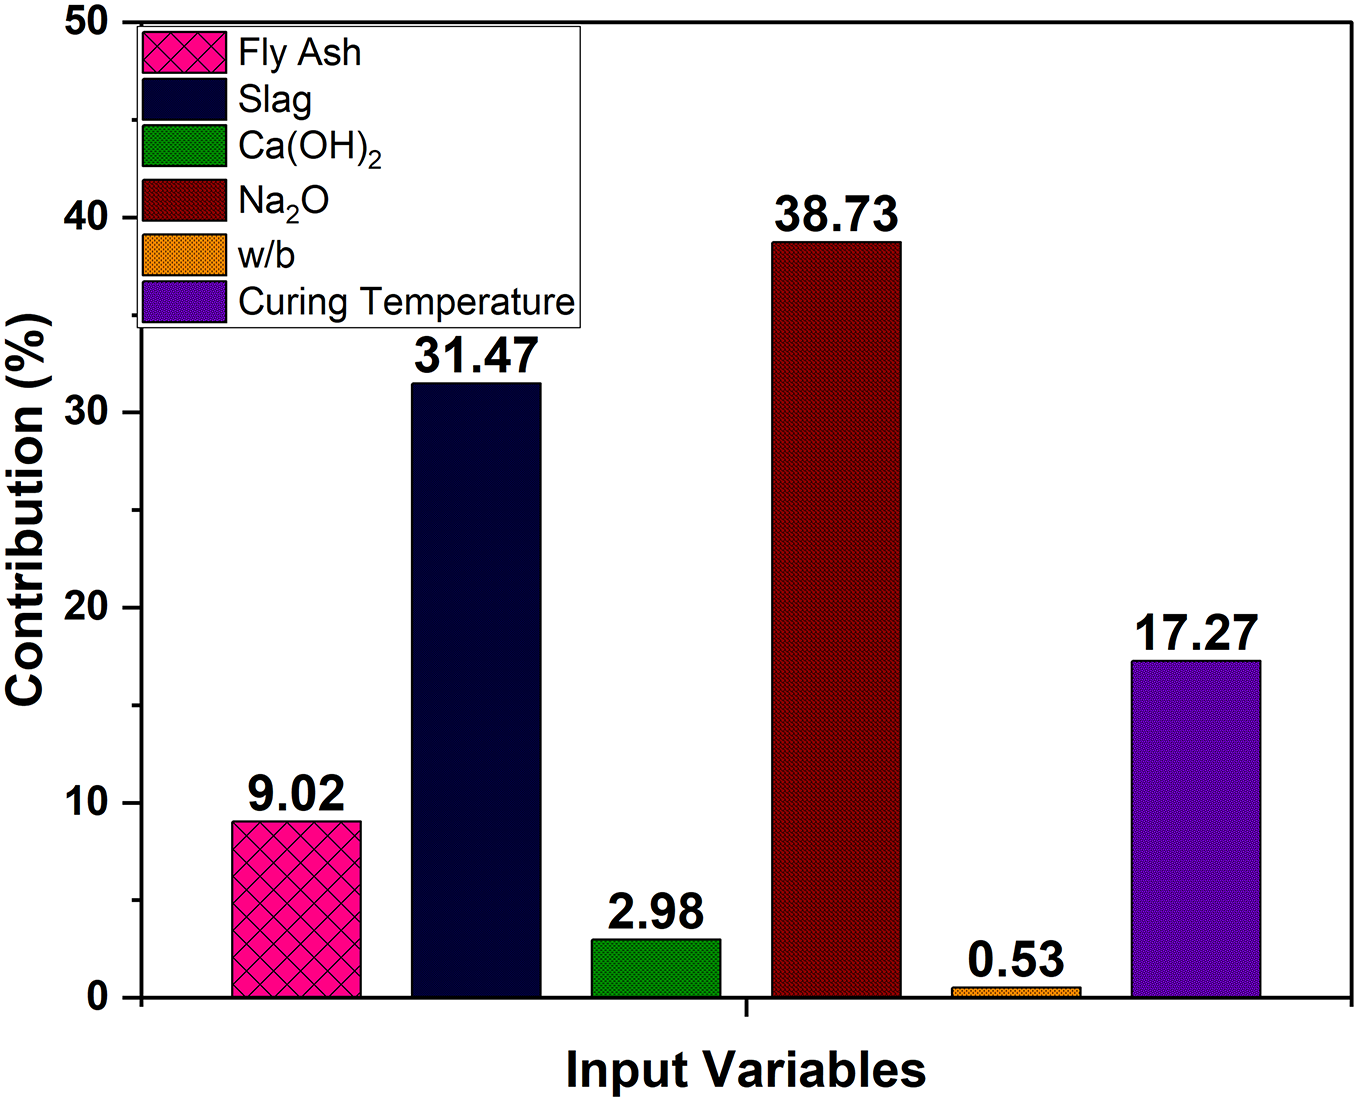
Figure 6: Sensitivity analysis of 28-d compressive strength on the basis of ANN model
Several tests must be conducted to ensure that models developed using AI are trustworthy and effective across a wide range of data combinations. Not all times do the best results for an output parameter imply that the model correctly predicted the behavior. Previous studies have recommended parametric and sensitivity analysis to better understand the relationship between input parameters and their contribution to final output prediction [16,56]. For the parametric study, the procedure described in Section 3.2 was followed. The variation of compressive strength with changing parameters is then plotted to get the parametric evaluation.
According to Al-Majidi et al. [62], the addition of slag to fly ash-based GP resulted in improved strength because of improved pore structure and extra reaction products (C-A-S-H and C-S-H gel), which is evident here as well (Fig. 7a). As shown in Fig. 7b, the compressive strength improves as the slag content increases. With the dosage of calcium hydroxide content being increased, a modest rise in compressive strength can be seen in Fig. 7c. This is also somewhat understandable because an increase in calcium hydroxide concentration raises the system’s alkalinity, which in turn encourages the dissolution of aluminum silicates [63]. As can be seen in Fig. 7d, the compressive strength improved with an increase in activator dosage. The amount of alkaline activator has a direct impact on the dissolution of the aluminosilicate precursor, which is the initial stage in the polymerization reaction. Higher activator concentrations result in more significant dissolution and, as a result, greater strength because of improved geopolymerization [64].

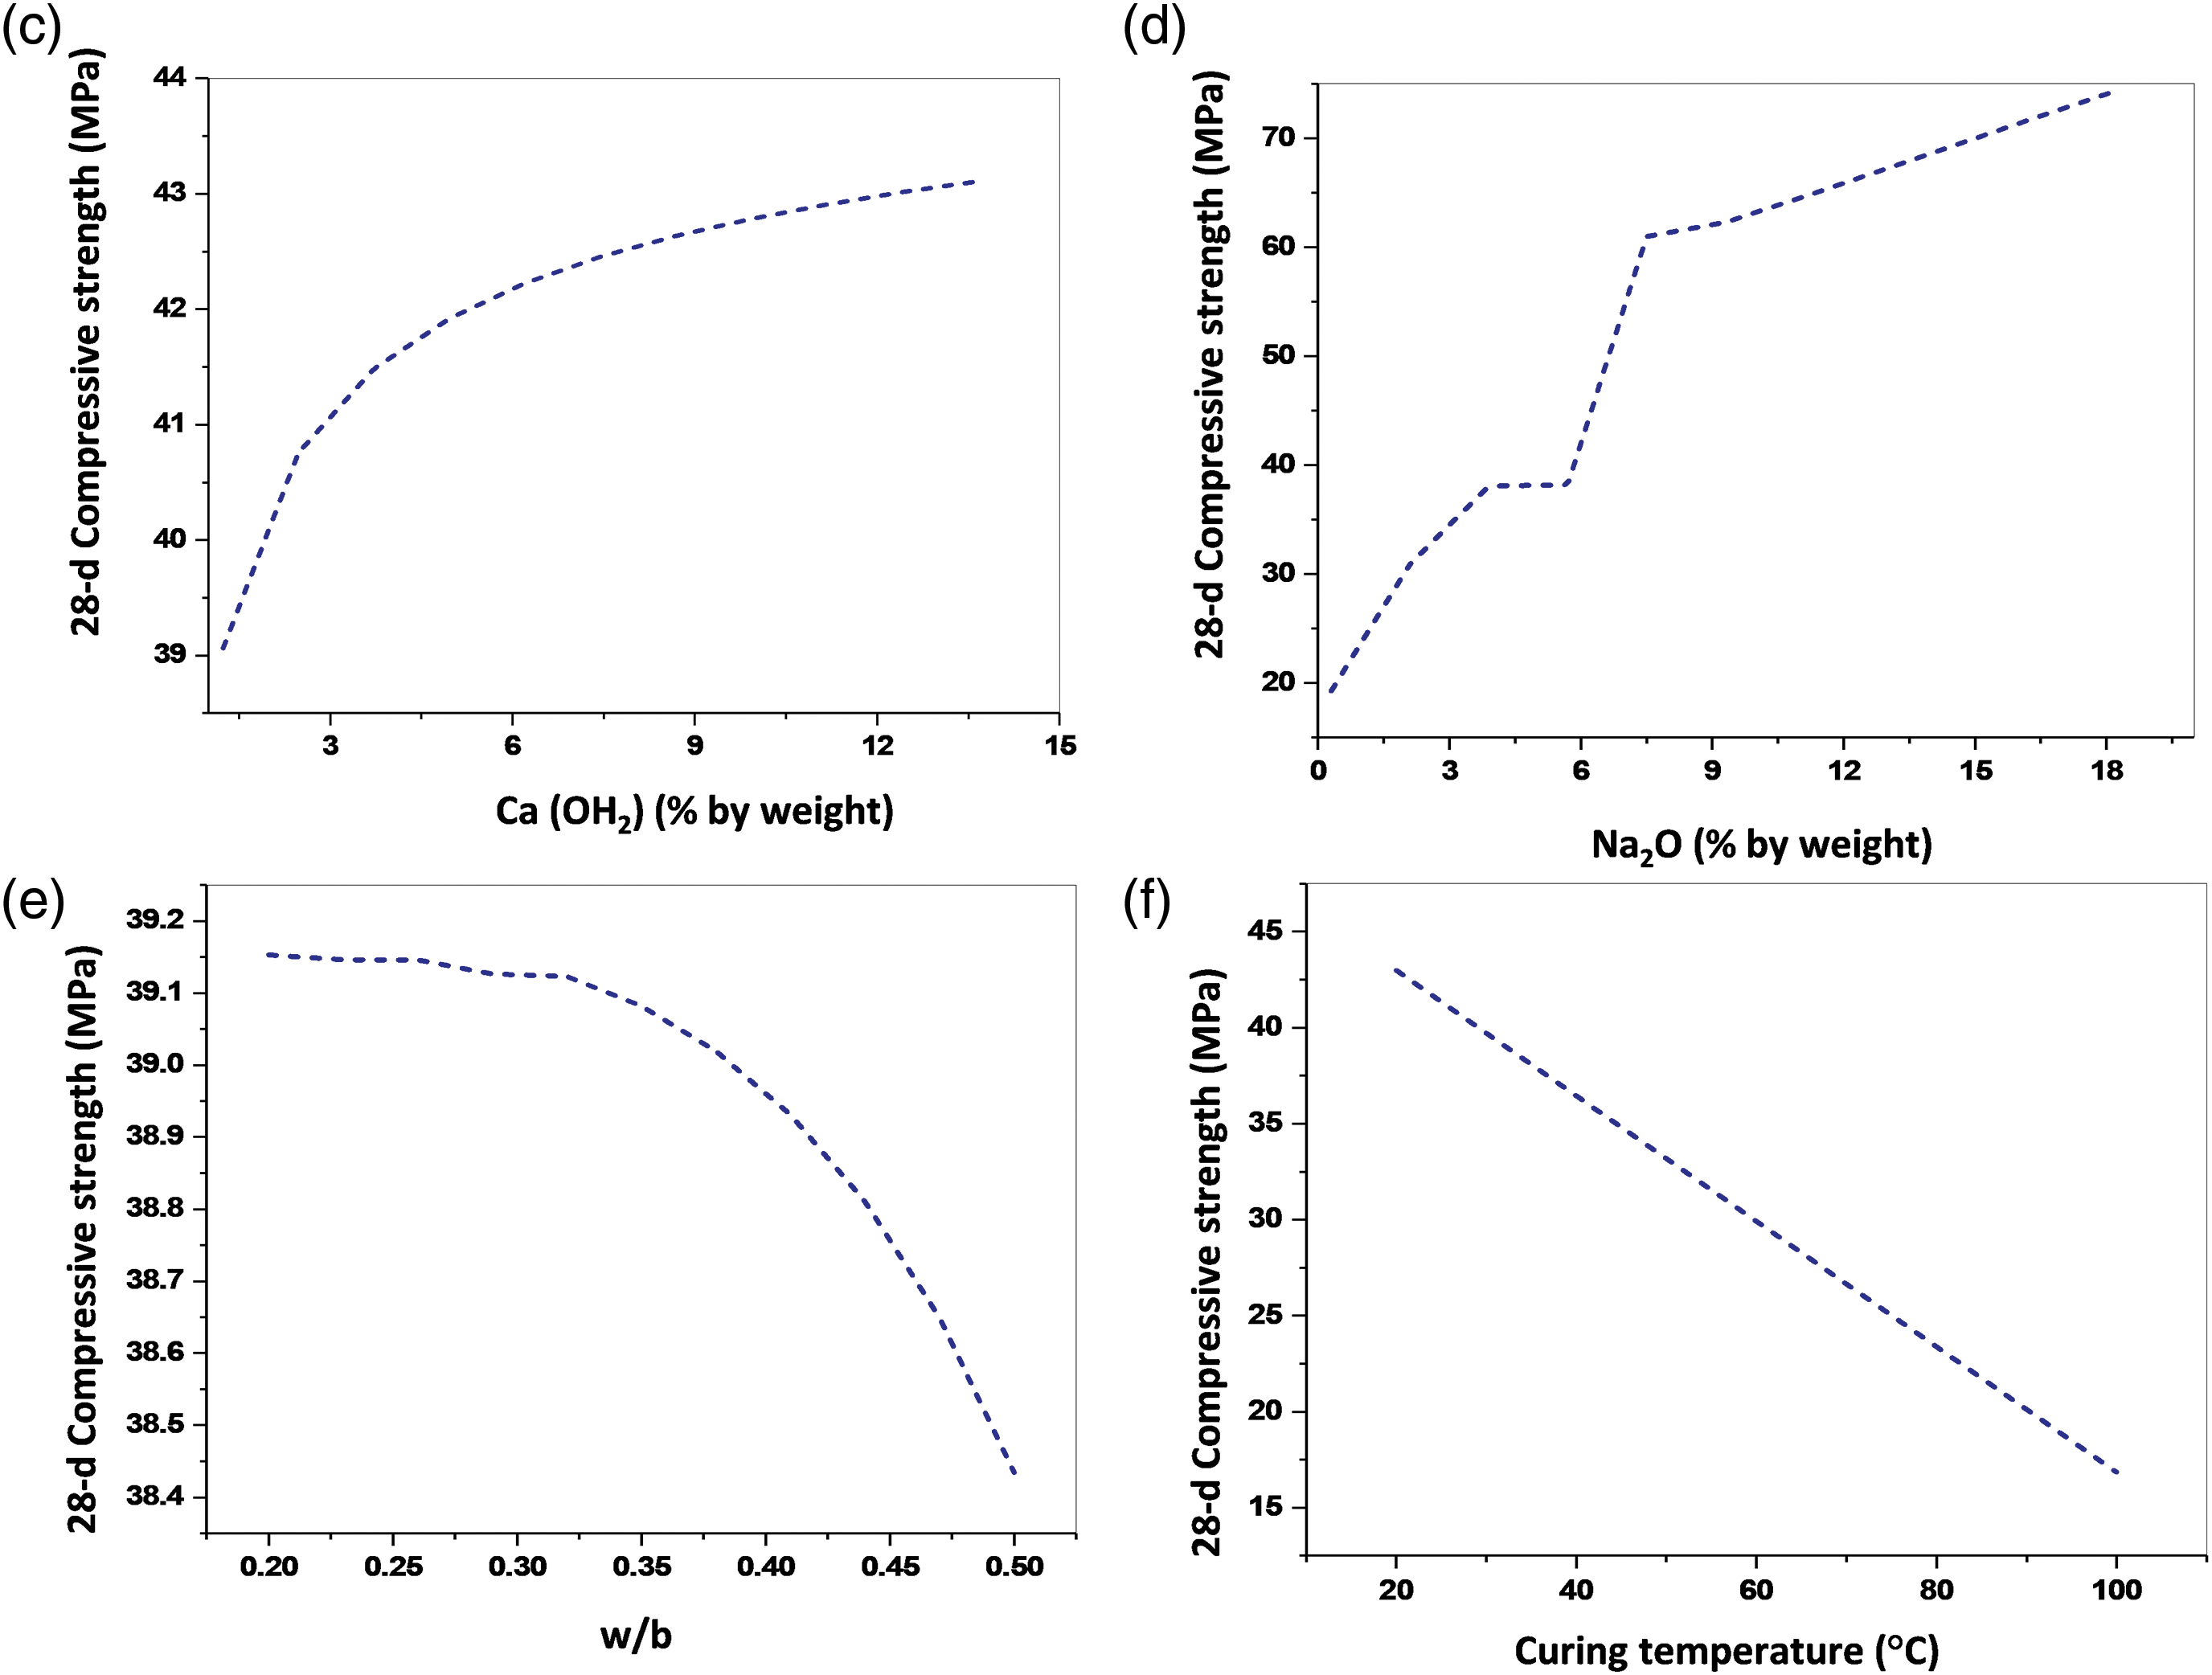
Figure 7: Parametric analysis on the basis of ANN model (a) With fly ash (b) With slag (c) with Ca(OH2) (d) With Na2O (e) For w/b ratios (f) For variable curing temperature
When it comes to the water binder ratio, a slight decrease in compressive strength can be observed with an increase (Fig. 7e). Similar patterns have also been seen in a number of experimental research [65,66]. Geopolymerization requires water for the dissolution, polycondensation, and hardening phases. According to additional research, fly ash-based geopolymers lose strength when the w/b ratio rises [67]. An interesting finding is the inverse relationship between the 28-d compressive strength and the rise in curing temperature for one-part fly ash-slag geopolymers (Fig. 7f). The initial step of geopolymerization, the dissolution of alumino-silicate compounds, is known to be triggered and accelerated by heat [64]. However, water is released during the polycondensation process, which creates aluminosilicate gel. This water becomes entrapped in the crevices of the geopolymer gel that has become hard [68]. Heat curing might hasten the dissolving reaction and cause this water to evaporate from the spaces, which would gradually increase the apparent porosity. As porosity rises, cementitious compounds lose strength [69]. The observed decrease in 28-d compressive strength with an increase in curing temperature may be due to the increase in porosity during high-temperature curing.
This implies that the established model is accurate and dependable for predicting the compressive strength of one-part GP in the context of past experimental experiments. The parametric and sensitivity analysis results are compatible with the findings of the preceding experimental investigations, indicating that the model has been successfully trained to reflect the behavior of a one-part geopolymer.
Because of their low carbon emission content, Alkali Activated Materials (AAMs) or geopolymers have been the focus of recent studies on ecological concrete. In addition to their outstanding environmental qualities, AAMs outperform regular Portland cement-based concrete in terms of strength and longevity. However, elements, including the kind, concentration, and characteristics of raw materials, significantly impact how well AAMs perform. Because of their superior performance, fly ash and slag are the favored precursors for creating one-part geopolymers. Notwithstanding the benefits, finding the ideal combination of input parameters to achieve acceptable performance is complex and rarely documented. As a result, this study uses machine learning techniques, especially Gene Expression Programming (GEP) models and Artificial Neural Networks (ANN). These models, which were created with MATLAB and GeneXprotools, respectively, are meant to forecast compressive strength for fly ash and slag-based one-part geopolymers under different input material and content conditions. The following conclusions were made from this study:
• The performance of the developed ANN and GEP models was evaluated using a variety of statistical indices, i.e., R, MAE, RMSE, RSE, and RRMSE. The values of R (correlation) obtained from the ANN and GEP models were more significant than 0.8, suggesting a reliable agreement between experimental and predicted results.
• With R-values of 0.96 and 0.90 for the training and validation datasets, respectively, the ANN model performed better than the GEP model in predicting the strength of a one-part geopolymer. Additional parameters such as MAE, RMSE, RRMSE, and RSE further validated the higher performance of the ANN model. These values were obtained as 5.85, 8.93, 0.25, and 0.18 MPa, respectively.
• Sensitivity analysis revealed that activator content and slag content are the most influential parameters showing the contribution (38.73 and 32.47, respectively) towards the prediction of 28-d compressive strength. The parametric analysis revealed that activator content, slag, and calcium hydroxide content followed a direct relation, while water binder ratio and curing temperature followed an inverse relation with 28-d compressive strength. The study reveals that the percentage of fly ash from 55% to 85% and slag from 15% to 50% are optimum values depending on the strength requirement.
The current study was based on the data obtained from the literature. To provide more practical and reliable recommendations on optimizing constituents of geopolymer concrete, control laboratory experiments with uniform testing conditions shall be conducted in the future. Moreover, advanced machine learning techniques, including metaheuristic algorithms, shall be used to develop more accurate models.
Acknowledgement: The authors extend their appreciation to the Deanship of Graduate Studies and Scientific Research at Jouf University for funding this work under grant No. (DGSSR-2023-02-02385).
Funding Statement: This work was funded by the Deanship of Graduate Studies and Scientific Research at Jouf University under grant No. (DGSSR-2023-02-02385).
Author Contributions: Conceptualization, Mudassir Iqbal and Ahmed. M. Yosri; Methodology and Software, Mudassir Iqbal, Ahmed. M. Yosri, Mohamed Abdel-Mongy and M. Farag; Formal Analysis and Investigation, Mohamed Abdel-Mongy, M. Farag, Saif Eldeen, Mudassir Iqbal and Fahad Alsharari; Data Curation and Writing—Original Draft Preparation, Mudassir Iqbal, Saif Eldeen and Fahad Alsharari; Writing—Review and Editing, All authors. All authors reviewed the results and approved the final version of the manuscript.
Availability of Data and Materials: The data sets generated and analyzed in the current study are available by the authors upon reasonable request.
Ethics Approval: The study is not included human or animal subject .
Conflicts of Interest: The authors declare that they have no conflicts of interest to report regarding the present study.
References
1. Yang B, Jang JG. Environmentally benign production of one-part alkali-activated slag with calcined oyster shell as an activator. Const Build Mat. 2020;257:119552. [Google Scholar]
2. Kitagawa M, Misu S, Ichikawa J, Matsuhashi H. Preparation of active MgO by short-time thermal decomposition of Mg(OH)2. Res Chem Intermediates. 2015;41:9463–73. [Google Scholar]
3. McQueen N, Kelemen P, Dipple G, Renforth P, Wilcox J. Ambient weathering of magnesium oxide for CO2 removal from air. Nat Commun. 2020;11(1):1–10. [Google Scholar]
4. Handbook CE. Magnesium Oxide and Other Magnesium Chemicals; 2021. https://www.spglobal.com/commodityinsights/en/ci/products/magnesium-oxide-chemical-economics-handbook.html. [Accessed 2024]. [Google Scholar]
5. Raza A, Azab M, Baki ZA, Hachem EI, El Ouni C, Kahla MH, et al. Experimental study on mechanical, toughness and microstructural characteristics of micro-carbon fibre-reinforced geopolymer having nano TiO2. Alex Eng J. 2023;64:451–63. [Google Scholar]
6. Bernal SA, Provis JL, Walkley B, San Nicolas R, Gehman JD, Brice DG, et al. Gel nanostructure in alkali-activated binders based on slag and fly ash, and effects of accelerated carbonation. Cem Concr Res. 2013;53:127–44. [Google Scholar]
7. Hadi MNS, Farhan NA, Sheikh MN. Design of geopolymer concrete with GGBFS at ambient curing condition using Taguchi method. Const Build Mat. 2017;140:424–31. [Google Scholar]
8. Hajimohammadi A, Provis JL, Van Deventer JSJ. The effect of silica availability on the mechanism of geopolymerisation. Cement and Concrete Res. 2011;41(3):210–6. [Google Scholar]
9. Nath R, Sarker PR. Effect of GGBFS on setting, workability and early strength properties of fly ash geopolymer concrete cured in ambient condition. Const Build Mat. 2014;66:163–71. [Google Scholar]
10. Ali Shah SF, Chen B, Ahmad MR, Haque MA. Development of cleaner one-part geopolymer from lithium slag. J Clean Prod. 2021;291:125241. [Google Scholar]
11. Yousefi Oderji S, Chen B, Ahmad MR, Shah SFA. Fresh and hardened properties of one-part fly ash-based geopolymer binders cured at room temperature: effect of slag and alkali activators. J Clean Prod. 2019;225:1–10. [Google Scholar]
12. Shah SFA, Chen B, Oderji SY, Haque MA, Ahmad MR. Improvement of early strength of fly ash-slag based one-part alkali activated mortar. Const Build Mat. 2020;246:118533. doi:10.1016/j.conbuildmat.2020.118533. [Google Scholar] [CrossRef]
13. Wang M, Wan W. A new empirical formula for evaluating uniaxial compressive strength using the Schmidt hammer test. Int J Rock Mech and Min Sci. 2019;123(1):104094. doi:10.1016/j.ijrmms.2019.104094. [Google Scholar] [CrossRef]
14. Wang M, Wan W, Zhao Y. Prediction of the uniaxial compressive strength of rocks from simple index tests using a random forest predictive model. Comptes Rendus Mécanique. 2020;348(1):3–32. doi:10.5802/crmeca. [Google Scholar] [CrossRef]
15. Chen G, Tang W, Chen S, Wang S, Cui H. Prediction of self-healing of engineered cementitious composite using machine learning approaches. Appl Sci. 2022;12:3605. [Google Scholar]
16. Javed MF, Amin MN, Shah MI, Khan K, Iftikhar B, Farooq F, et al. Applications of gene expression programming and regression techniques for estimating compressive strength of bagasse ash based concrete. Crystals. 2020;10(9):1–17. doi:10.3390/cryst10090737. [Google Scholar] [CrossRef]
17. Peng Y, Unluer C. Analyzing the mechanical performance of fly ash-based geopolymer concrete with different machine learning techniques. Const Build Mat. 2022;316(9–10):125785. doi:10.1016/j.conbuildmat.2021.125785. [Google Scholar] [CrossRef]
18. Shah SFA, Chen B, Zahid M, Ahmad MR. Compressive strength prediction of one-part alkali activated material enabled by interpretable machine learning. Const Build Mat. 2022;360(5):129534. doi:10.1016/j.conbuildmat.2022.129534. [Google Scholar] [CrossRef]
19. Asadi Shamsabadi E, Roshan N, Hadigheh SA, Nehdi ML, Khodabakhshian A, Ghalehnovi M. Machine learning-based compressive strength modelling of concrete incorporating waste marble powder. Const Build Mat. 2022;324(10):126592. doi:10.1016/j.conbuildmat.2022.126592. [Google Scholar] [CrossRef]
20. Zhuang X, Zhou S. The prediction of self-healing capacity of bacteria-based concrete using machine learning approaches. Comput Mater Contin. 2019;59(1):57–77. doi:10.32604/cmc.2019.04589. [Google Scholar] [CrossRef]
21. Huynh AT, Nguyen QD, Xuan QL, Magee B, Chung T, Tran KT, et al. A machine learning-assisted numerical predictor for compressive strength of geopolymer concrete based on experimental data and sensitivity analysis. Appl Sci. 2020;10(21):1–16. doi:10.3390/app10217726. [Google Scholar] [CrossRef]
22. Aneja S, Sharma A, Gupta R, Yoo DY. Bayesian regularized artificial neural network model to predict strength characteristics of fly-ash and bottom-ash based geopolymer concrete. Materials. 2021;14(7):1729. [Google Scholar] [PubMed]
23. Tanyildizi H. Predicting the geopolymerization process of fly ash-based geopolymer using deep long short-term memory and machine learning. Cement and Concrete Compos.2021;123:104177. [Google Scholar]
24. Ali Khan M, Zafar A, Akbar A, Javed MF, Mosavi A. Application of gene expression programming (GEP) for the prediction of compressive strength of geopolymer concrete. Materials. 2021;14(5):1106. [Google Scholar] [PubMed]
25. Chu HH, Khan MA, Javed MF, Zafar A, Ijaz Khan M, Alabduljabbar H, et al. Sustainable use of fly-ash: use of gene-expression programming (GEP) and multi-expression programming (MEP) for forecasting the compressive strength geopolymer concrete. Ain Shams Eng J. 2021;12(4):3603–17. [Google Scholar]
26. Nazari A, Ghafouri Safarnejad M. Prediction early age compressive strength of OPC-based geopolymers with different alkali activators and seashell powder by gene expression programming. Ceramics Int. 2013;39(2):1433–42. [Google Scholar]
27. Ahmad A, Ahmad W, Chaiyasarn K, Ostrowski KA, Aslam F, Zajdel P, et al. Prediction of geopolymer concrete compressive strength using novel machine learning algorithms. Polymers. 2021;13(9):3389. [Google Scholar] [PubMed]
28. Shahmansouri AA, Akbarzadeh Bengar H, Ghanbari S. Compressive strength prediction of eco-efficient GGBS-based geopolymer concrete using GEP method. J Build Eng. 2020;31:101326. [Google Scholar]
29. Qian LP, Xu LY, Huang BT, Dai JG. Pelletization and properties of artificial lightweight geopolymer aggregates (GPAone-part vs. two-part geopolymer techniques. J Clean Prod. 2022;374:133933. [Google Scholar]
30. Adesanya E, Ohenoja K, Luukkonen T, Kinnunen P, Illikainen M. One-part geopolymer cement from slag and pretreated paper sludge. J Clean Prod. 2018;185:168–75. [Google Scholar]
31. Alrefaei Y, Wang YS, Dai JG. The effectiveness of different superplasticizers in ambient cured one-part alkali activated pastes. Cement and Concrete Compos. 2019;97:166–74. [Google Scholar]
32. Alrefaei Y, Wang YS, Dai JG, Xu QF. Effect of superplasticizers on properties of one-part Ca(OH)2/Na2SO4 activated geopolymer pastes. Const Build Mat. 2020;241(2):117990. doi:10.1016/j.conbuildmat.2019.117990. [Google Scholar] [CrossRef]
33. Alrefaei Y, Wang YS, Dai JG. Effect of mixing method on the performance of alkali-activated fly ash/slag pastes along with polycarboxylate admixture. Cement and Concrete Compos. 2021;117(19):103917. doi:10.1016/j.cemconcomp.2020.103917. [Google Scholar] [CrossRef]
34. Chen W, Peng R, Straub C, Yuan B. Promoting the performance of one-part alkali-activated slag using fine lead-zinc mine tailings. Const Build Mat. 2020;236:117745. doi:10.1016/j.conbuildmat.2019.117745. [Google Scholar] [CrossRef]
35. Luo Q, Wang Y, Hong S, Xing F, Dong B. Properties and microstructure of lithium-slag-based geopolymer by one-part mixing method. Const Build Mat. 2021;273(5):121723. doi:10.1016/j.conbuildmat.2020.121723. [Google Scholar] [CrossRef]
36. Ma C, Long G, Shi Y, Xie Y. Preparation of cleaner one-part geopolymer by investigating different types of commercial sodium metasilicate in China. J Clean Prod. 2018;201(2):636–47. doi:10.1016/j.jclepro.2018.08.060. [Google Scholar] [CrossRef]
37. Ma C, Zhao B, Guo S, Long G, Xie Y. Properties and characterization of green one-part geopolymer activated by composite activators. J Clean Prod. 2019;220:188–99. [Google Scholar]
38. Ma C, Zhao B, Wang L, Long G, Xie Y. Clean and low-alkalinity one-part geopolymeric cement: effects of sodium sulfate on microstructure and properties. J Clean Prod. 2020;252:119279. [Google Scholar]
39. Tennakoon C, Nicolas RS, Sanjayan JG, Shayan A. Thermal effects of activators on the setting time and rate of workability loss of geopolymers. Ceram Int. 2016;42(16):19257–68. [Google Scholar]
40. Mohammed BS, Haruna S, Wahab MMA, Liew MS, Haruna A. Mechanical and microstructural properties of high calcium fly ash one-part geopolymer cement made with granular activator. Heliyon. 2019;5(9):e02255. [Google Scholar] [PubMed]
41. Nematollahi B, Sanjayan J, Shaikh FUA. Synthesis of heat and ambient cured one-part geopolymer mixes with different grades of sodium silicate. Ceram Int. 2015;41(4):5696–704. [Google Scholar]
42. Nematollahi B, Sanjayan J, Shaikh FUA. Matrix design of strain hardening fiber reinforced engineered geopolymer composite. Compos Part B: Eng. 2016;89:253–65. [Google Scholar]
43. Oderji SY, Chen B, Shakya C, Ahmad MR, Shah SFA. Influence of superplasticizers and retarders on the workability and strength of one-part alkali-activated fly ash/slag binders cured at room temperature. Const Build Mat. 2019;229:116891. [Google Scholar]
44. Samarakoon MH, Ranjith PG, Duan WH, De Silva VRS. Properties of one-part fly ash/slag-based binders activated by thermally-treated waste glass/NaOH blends: a comparative study. Cement and Concrete Compos. 2020;112:103679. [Google Scholar]
45. Wan-En O, Yun-Ming L, Cheng-Yong H, Abdullah MM, Li LY, Ho LN, et al. Comparative mechanical and microstructural properties of high calcium fly ash one-part geopolymers activated with Na2SiO3-anhydrous and NaAlO2. J Mat Res Technol. 2021;15:3850–66. [Google Scholar]
46. Wang YS, Alrefaei Y, Dai JG. Roles of hybrid activators in improving the early-age properties of one-part geopolymer pastes. Const Build Mat. 2021;306:124880. [Google Scholar]
47. Wei T, Zhao H, Ma C. A comparison of water curing and standard curing on one-part alkali-activated fly ash sinking beads and slag: properties, microstructure and mechanisms. Const Build Mat. 2021;273:121715. [Google Scholar]
48. Bong SH, Nematollahi B, Nazari A, Xia M, Sanjayan J. Efficiency of different superplasticizers and retarders on properties of ‘one-part’ fly ash-slag blended geopolymers with different activators. Materials. 2019;12:3410. [Google Scholar] [PubMed]
49. Iqbal MF, Javed MF, Rauf M, Azim I, Ashraf M, Yang J, et al. Sustainable utilization of foundry waste: forecasting mechanical properties of foundry sand based concrete using multi-expression programming. Sci Total Environ. 2021;780:146524. [Google Scholar] [PubMed]
50. Baykasoǧlu A, Güllü H, Çanakçi H, Özbakir L. Prediction of compressive and tensile strength of limestone via genetic programming. Expert Syst Appl. 2008;35(1–2):111–23. [Google Scholar]
51. Amin MN, Ahmad I, Iqbal M, Abbas A, Khan K, Faraz MI, et al. Computational AI models for investigating the radiation shielding potential of high-density concrete. Materials. 2022 Jun 29;15(13):4573. [Google Scholar]
52. Atici U. Prediction of the strength of mineral admixture concrete using multivariable regression analysis and an artificial neural network. Expert Syst Appl. 2011;38(8):9609–18. doi:10.1016/j.eswa.2011.01.156. [Google Scholar] [CrossRef]
53. Iqbal MF, Liu QF, Azim I, Zhu X, Yang J, Javed MF, et al. Prediction of mechanical properties of green concrete incorporating waste foundry sand based on gene expression programming. J Hazardous Mat. 2020;384:121322. doi:10.1016/j.jhazmat.2019.121322. [Google Scholar] [PubMed] [CrossRef]
54. Azim I, Yang J, Iqbal MF, Mahmood Z, Javed MF, Wang F, et al. Prediction of catenary action capacity of RC beam-column substructures under a missing column scenario using evolutionary algorithm. KSCE J Civil Eng. 2021;25(3):891–905. doi:10.1007/s12205-021-0431-0. [Google Scholar] [CrossRef]
55. Nguyen T, Kashani A, Ngo T, Bordas S. Deep neural network with high-order neuron for the prediction of foamed concrete strength. Comput Aided Civ Infrastruct Eng. 2019;34(4):316–32. doi:10.1111/mice.12422. [Google Scholar] [CrossRef]
56. Salami BA, Iqbal M, Abdulraheem A, Jalal FE, Alimi W, Jamal A, et al. Estimating compressive strength of lightweight foamed concrete using neural, genetic and ensemble machine learning approaches. Cement and Concrete Compos. 2022;133:104721. doi:10.1016/j.cemconcomp.2022.104721. [Google Scholar] [CrossRef]
57. Khan K, Iqbal M, Salami BA, Amin MN, Ahamd I, Alabdullah AA, et al. Estimating flexural strength of FRP reinforced beam using artificial neural network and random forest prediction models. Polymers. 2022;14(11):2270. [Google Scholar] [PubMed]
58. Azim I, Yang J, Javed MF, Iqbal MF, Mahmood Z, Wang F, et al. Prediction model for compressive arch action capacity of RC frame structures under column removal scenario using gene expression programming. Structures. 2020;25:212–28. [Google Scholar]
59. Luukkonen T, Abdollahnejad Z, Yliniemi J, Kinnunen P, Illikainen M. One-part alkali-activated materials: a review. Cement and Concrete Res. 2018;103:21–34. [Google Scholar]
60. Gomaa E, Sargon S, Kashosi C, ElGawady M. Fresh properties and compressive strength of high calcium alkali activated fly ash mortar. J King Saud Univ-Eng Sci. 2017;29(4):356–64. [Google Scholar]
61. Lee NKK, Lee HKHK. Setting and mechanical properties of alkali-activated fly ash/slag concrete manufactured at room temperature. Const Build Mat. 2013;47:1201–9. [Google Scholar]
62. Al-Majidi MH, Lampropoulos A, Cundy A, Meikle S. Development of geopolymer mortar under ambient temperature for in situ applications. Const Build Mat. 2016;120(9):198–211. doi:10.1016/j.conbuildmat.2016.05.085. [Google Scholar] [CrossRef]
63. Askarian M, Tao Z, Samali B, Adam G, Shuaibu R. Mix composition and characterisation of one-part geopolymers with different activators. Const Build Mat. 2019;225(5):526–37. doi:10.1016/j.conbuildmat.2019.07.083. [Google Scholar] [CrossRef]
64. Luukkonen T, Abdollahnejad Z, Yliniemi J, Kinnunen P, Illikainen M. Comparison of alkali and silica sources in one-part alkali-activated blast furnace slag mortar. J Clean Prod. 2018;187:171–9. doi:10.1016/j.jclepro.2018.03.202. [Google Scholar] [CrossRef]
65. Panias D, Giannopoulou IP, Perraki T. Effect of synthesis parameters on the mechanical properties of fly ash-based geopolymers. Colloids and Surf A: Physicochem Eng Aspects. 2007;301(1–3):246–54. doi:10.1016/j.colsurfa.2006.12.064. [Google Scholar] [CrossRef]
66. Xie J, Kayali O. Effect of initial water content and curing moisture conditions on the development of fly ash-based geopolymers in heat and ambient temperature. Const Build Mat. 2014;67(2):20–8. doi:10.1016/j.conbuildmat.2013.10.047. [Google Scholar] [CrossRef]
67. Junaid MT, Kayali O, Khennane A, Black J. A mix design procedure for low calcium alkali activated fly ash-based concretes. Const Build Mat. 2015;79:301–10. doi:10.1016/j.conbuildmat.2015.01.048. [Google Scholar] [CrossRef]
68. Temuujin J, Van Riessen A, Williams R. Influence of calcium compounds on the mechanical properties of fly ash geopolymer pastes. J Hazardous Mat. 2009;167(1–3):82–8. doi:10.1016/j.jhazmat.2008.12.121. [Google Scholar] [PubMed] [CrossRef]
69. Yazdi MA, Liebscher M, Hempel S, Yang J, Mechtcherine V. Correlation of microstructural and mechanical properties of geopolymers produced from fly ash and slag at room temperature. Const Build Mat. 2018;191:330–41. doi:10.1016/j.conbuildmat.2018.10.037. [Google Scholar] [CrossRef]
Cite This Article
 Copyright © 2024 The Author(s). Published by Tech Science Press.
This work is licensed under a Creative Commons Attribution 4.0 International License , which permits unrestricted use, distribution, and reproduction in any medium, provided the original work is properly cited.
 Downloads
 Citation Tools