
 Submit a Paper
 Propose a Special lssue
 Open Access
ARTICLE

Malware Detection Using Dual Siamese Network Model
1 Department of Software Convergence, Soonchunhyang University, Asan, 31538, Republic of Korea
2 Department of Mobility Convergence Security, Soonchunhyang University, Asan, 31538, Republic of Korea
3 Department of Information Security Engineering, Soonchunhyang University, Asan, 31538, Republic of Korea
* Corresponding Author: Taeguen Kim. Email:
(This article belongs to the Special Issue: Advanced Security for Future Mobile Internet: A Key Challenge for the Digital Transformation)
Computer Modeling in Engineering & Sciences 2024, 141(1), 563-584. https://doi.org/10.32604/cmes.2024.052403
Received 01 April 2024; Accepted 18 June 2024; Issue published 20 August 2024
 View Full Text
 Download PDF
Abstract
This paper proposes a new approach to counter cyberattacks using the increasingly diverse malware in cyber security. Traditional signature detection methods that utilize static and dynamic features face limitations due to the continuous evolution and diversity of new malware. Recently, machine learning-based malware detection techniques, such as Convolutional Neural Networks (CNN) and Recurrent Neural Networks (RNN), have gained attention. While these methods demonstrate high performance by leveraging static and dynamic features, they are limited in detecting new malware or variants because they learn based on the characteristics of existing malware. To overcome these limitations, malware detection techniques employing One-Shot Learning and Few-Shot Learning have been introduced. Based on this, the Siamese Network, which can effectively learn from a small number of samples and perform predictions based on similarity rather than learning the characteristics of the input data, enables the detection of new malware or variants. We propose a dual Siamese network-based detection framework that utilizes byte images converted from malware binary data to grayscale, and opcode frequency-based images generated after extracting opcodes and converting them into 2-gram frequencies. The proposed framework integrates two independent Siamese network models, one learning from byte images and the other from opcode frequency-based images. The detection models trained on the different kinds of images generated separately apply the L1 distance measure to the output vectors the models generate, calculate the similarity, and then apply different weights to each model. Our proposed framework achieved a malware detection accuracy of 95.9% and 99.83% in the experiments using different malware datasets. The experimental results demonstrate that our malware detection model can effectively detect malware by utilizing two different types of features and employing the dual Siamese network-based model.Keywords
Malware poses serious security issues, including the leakage of personal information and crucial data, as well as causing system paralysis [1]. Traditionally, signature-based detection methods based on static and dynamic features have been used to detect such malware. Static signatures are defined by elements that can be extracted without executing the malware, such as hardcoded key values, string information, file signatures, and file hash values. Dynamic signatures refer to information extracted after executing the malware in a virtual environment, primarily including dynamically loaded API (Application Programming Interface) and network traffic information from a Sandbox [2,3]. With the diversification of cyber-attacks, the use of malware for attacks has increased. To mitigate the attacks caused by malware, research utilizing machine learning has actively been conducted. The previously introduced detection methods have proven effective in detecting malware by training machine learning models with existing malware [4,5]. However, these methods struggle to detect new malware or variants since they primarily learn from the features of known malware [6]. To overcome this, we designed our detection method to analyze newly emerged malware by adapting the few-shot learning (FSL) approach [7]. Few-shot learning (FSL) is a machine learning method that allows for rapid learning and generalization from a small amount of data without needing large datasets. Unlike traditional machine learning, which relies on existing data for performance evaluation, FSL enables predictions for small or unfamiliar datasets by learning classification methods. In FSL, the dataset is divided into a support set for training and a query set for evaluating the performance of the trained model [8]. Among the many kinds of few-shot learning algorithms, our method utilizes a Siamese network algorithm demonstrating excellent performance. The Siamese neural network, designed based on few-shot learning, receives two input data and vectorizes them through the neural network. Then, it measures the similarity between the two vectors using various distance functions such as L1 distance, cosine distance, and L2 distance to perform classification [9].
We propose a dual Siamese network architecture that integrates two Siamese networks, each learning from byte images and opcode frequency-based images. The framework selects a small number of image pairs created from malware data, including opcode frequency image pairs and byte image pairs, trains two independent models, and measures each model’s similarity before applying weights for detection. Byte images represent binary data directly, allowing for a detailed understanding of the file’s content and structure, while opcode frequency-based images represent the program’s instruction set, learning specific behavior patterns of malware. Combining these two distinct features information effectively analyzes and detects malware from multiple perspectives.
In other words, our framework enhances malware detection performance by utilizing both byte images and opcode frequency-based images, and the framework outperformed previous studies and other research using the same dataset. Additionally, by suggesting a method using the pre-trained VGG16 (Visual Geometry Group-16) model, to select representative samples, we improved detection efficiency by comparing more relevant samples.
The structure of this paper is as follows: Section 2 discusses related work on malware detection, Section 3 details the transformation of the dataset into a form usable for training, including byte images and opcode frequency-based images, and the dual Siamese network architecture and components. Section 4 presents the experimental results and the malware detection performance of the proposed framework, and conducts a comparative analysis with related work to our proposed method. Section 5 presents the conclusions, outlines future research, and discusses the limitations and implications of this paper.
This section introduces existing research related to malware detection. In the study by Zolkiplic et al. [10], a new malware detection framework that combines signature-based detection and Genetic Algorithm (GA) techniques was proposed to address the limitations of traditional signature-based methods in detecting various malware and zero-day attacks. The framework consists of three primary components: signature-based detection, GA detection, and signature generation. The signature-based component uses known malware signatures for identification, and the GA component targets new and unknown malware types through learning and adaptation. The framework operates by automatically generating signatures from detected malware and updating the database for future reference. This integrated approach has improved the detection of newly released malware, enhancing the effectiveness and efficiency of computer operation security. Savenko et al. [11] proposed a dynamic signature-based malware detection method based on API call tracing to generate malware signatures. This method analyzes the frequency and interaction patterns of critical API calls made by malicious programs to identify and distinguish malware signatures from normal applications. The signature captures the frequency of important API calls related to malicious activity and their interaction characteristics to analyze malware behavior, offering a more resilient response to obfuscation and evasion techniques used by malware authors. Santos et al. [12] suggested OPEM, a hybrid malware detection method that combines static and dynamic analysis features to improve malware identification accuracy. Static analysis involves inspecting executable files without execution to capture operational codes (opcodes) sequences and frequency, while dynamic analysis operates by executing files in a sandbox to observe system call activities and exceptions that occur. By integrating these approaches, OPEM effectively detects malware that uses obfuscation or packing and complex evasion techniques.
Recent studies have extensively pursued deep learning-based malware detection. Research by Hwang et al. [13] proposed a platform-independent malware analysis method that works on both Windows and Linux environments. This AI-based technique analyzes binary data to detect malware without relying on the specific file formats of executable files. By extracting and classifying strings from binary data, the method achieves effective malware detection across various platforms. Experimental results showed a high accuracy of 91.77% on Windows datasets, demonstrating the method’s capability to manage malware threats in diverse computing environments. Yoo et al. [14] proposed a hybrid approach named AI-HydRa for malware classification, combining random forest and deep learning techniques. The model uses both static and dynamic features to enhance detection accuracy, employing a voting mechanism to integrate results from different classifiers. In experiments with 6,395 samples, AI-HydRa achieved an 85.1% detection rate. Jeon et al. [15] proposed HyMalD, a hybrid malware detection model for IoT devices, integrating Bi-LSTM (Bidirectional Long Short Term Memory) and SPP-Net (Spatial Pyramid Pooling Network). This model combines static and dynamic analyses to detect obfuscated malware using opcode and API call sequences. HyMalD achieved a 94.85% detection accuracy, proving effective in identifying malware within smart IoT environments. Sara et al. [16] presented a static analysis-based approach using machine learning and deep learning technologies to detect zero-day malware attacks in Android applications. This approach utilized static attributes extracted from mobile apps, such as permissions, API calls, and opcodes, and employed a Multiview DL (Deep Learning) model on various datasets composed of real Android application functionalities to achieve high accuracy in zero-day malware scenarios. He et al. [17] proposed utilizing machine learning (ML) technology through hardware-supported malware detection (HMD) to overcome the limitations of conventional software-based detection methods. This proposal includes methods applying AdaBoost ensemble learning for real-time zero-day malware detection, a Deep-HMD approach based on deep neural networks and transfer learning, and a Reinforced-HMD framework using reinforcement learning for cost-efficient detection, leveraging limited hardware performance counter (HPC) events to reduce costs and enhance detection performance. Aslan et al. [18] suggested a hybrid architecture using a pre-trained model combining ResNet-50 and Alex Net to effectively address new malware variants. Chaganti et al. [19] proposed an image-based malware detection framework utilizing the Deep Learning Model EfficientNetB1. This framework evaluated the performance and computational efficiency of various pre-trained Convolutional Neural Network (CNN) models to select the most suitable CNN architecture for malware classification. The study also assessed different malware image representation methods by varying the image width according to the file size. Results indicated that malware using a fixed-width byte-level representation with EfficientNetB1 performed best. Acharya et al. [20] conducted malware detection based on EfficientNetB0 and CNNs by converting malware binaries into 8-bit grayscale images and classifying malware families using the EfficientNetB1 model. This research not only demonstrated the efficiency and excellence of deep learning models but also suggested the potential for model robustness evaluation against adversarial attacks and the possibility of extension through feature fusion and multi-viewpoint learning approaches. Brown et al. [21] proposed malware detection in a cloud environment using Automated Machine Learning (AutoML) to optimize CNN models. This paper utilized AutoML mainly in two areas: using deep feedforward neural networks like Multi-Layer Perceptrons (MLPs) for static malware detection and optimizing CNN models with AutoML for malware detection on virtual machines operated in a cloud-based IaaS (Infrastructure as a Service). Abdulazeez et al. [22] described a comprehensive methodology for utilizing pre-trained CNN models for malware detection. The proposed approach involved converting malware images to grayscale and extracting features using models like ResNet-50, DenseNet-201, Google Net, Alex Net, and Squeeze Net. Classification was performed using several algorithms, including feature selection through Principal Component Analysis (PCA), GDA (Gaussian Discriminant Analysis), KNN (K-Neighbor Nearest), logistic SVM (Support Vector Machine), RF (Random Forest), and ensemble learning, with the KNN classifier showing the most effective results. Zhong et al. [23] proposed a Multi-Level Deep Learning System (MLDLS) for malware detection, organizing multiple deep learning models in a tree structure to effectively handle complex malware data distributions and improve scalability, demonstrating superior performance over single deep learning models, deep learning model ensembles, and machine learning techniques.
Our proposed malware detection research similar to Siamese network-based malware detection includes the following: Chai et al. [24] proposed the Dynamic Prototype Network based on Sample Adaptation for few-shot malware detection (DPNSA) for zero-day malware detection using a few samples. This model efficiently detected unknown malware by dynamically adjusting model parameters based on a small number of input samples and learning from predefined class samples. Additionally, the introduction of a dual-sample dynamic activation function utilized the correlation between samples to reduce the impact of irrelevant features for sophisticated detection. Almarshad et al. [25] suggested a new approach for detecting Android Malware using the Siamese Shot Learning technique. This study utilized Siamese networks trained through an N-way one-shot task with the Drebin dataset to rank sample similarity and measure accuracy, integrating Siamese one-shot learning and machine learning-based algorithms to prove high accuracy and the ability to adapt to new and unknown malware variants. Zhu et al. [7] proposed a new malware detection approach using a Multi-Loss Siamese Neural Network and Batch Normalization Layer. This model accurately identified unknown new malware variants with fewer samples and optimized small sample size issues like overfitting and vanishing gradients through batch normalization and multiple loss functions. Moreover, this paper described converting raw binary files into grayscale images to facilitate the use of Siamese networks by generating positive and negative pairs for effective training. Hsiao et al. [26] proposed a new approach to malware image classification using One-Shot Learning with Siamese Networks. This model effectively detected new malware with limited samples by converting malware samples into resized grayscale images and classifying them based on the average hash (aHash) within the family, then training the Siamese Network to rank the similarity between samples. Zhu et al. [27] proposed a task-aware meta-learning-based Siamese Neural Network to classify control flow obfuscated malware. The model uses entropy and image-based features to enhance detection accuracy. With the VGG16 (Visual Geometry Group-16) network integrated for feature embedding, it effectively identifies malware variants despite obfuscation. Experimental results showed the model achieved up to 95% classification accuracy. Asir et al. [28] proposed a method for Android-based malware detection using Siamese Shot Learning. This approach learns fine-grained patterns and enhances the model’s generalization ability using only a small amount of labeled data, making it effective in detecting new and varied malware instances. Kasarapu et al. [29] proposed a malware detection framework that uses AI-based code generation techniques to expand the dataset by generating diverse variant samples from a limited number of malicious samples. The generated samples mimic the patterns of real malware, ensuring practical detection performance. By leveraging Few-Shot Learning, the framework efficiently classifies complex malware with a small number of samples. Davis et al. [30] proposed a method for malware detection in network traffic by extracting specific fields from the IP header of network sessions in pcap files and converting this data into 50 × 50 RGB images. Using a CNN model based on the VGG network, their approach demonstrated high performance across various datasets. Notably, the CNN model achieved a macro F1-Score of 97% on the MCFP (Malware Capture Facility Project) dataset and showed excellent generalization capabilities on the USTC-TFC2016, MedBIoT, and IEEE-Mirai datasets.
Recent research has shown that Siamese Networks have notable performance in malware detection, but most studies have the limitation of utilizing only one type of image information, reflecting limited characteristics. To address this issue, our research proposes a model that combines byte images and opcode frequency-based images, enabling a comprehensive analysis of both the structure of the file and the behavior patterns of malware, thereby allowing for more versatile detection.
Our proposed detection method’s processing flow can be divided into two parts, as shown in Fig. 1. The first part is the detection model generation (model tuning) phase, which generates the dual Siamese network-based detection model. The dual Siamese network-based detection model consists of two Siamese networks, therefore each network should be trained separately. To train each network model, binary files are converted into image data, and then image pairs are selected. These image pairs are simultaneously fed into the detection model for training. It is noted that each network model utilizes two types of image pairs: byte image pairs and opcode frequency image pairs.

Figure 1: The overall processing flow of our proposed detection framework
The second part is the detection (model testing) phase, where query samples are input into the detection model to analyze its maliciousness. The dual Siamese network-based detection model processes image pairs (e.g., query sample-representative malware sample or query sample-representative benign program sample) to produce two separate similarity scores based on different features. In other words, in each process of a Siamese network, a query sample is compared with a set of representative malware and benign samples. The query sample’s similarities calculated from the two different Siamese networks are then weighted and merged into a single final similarity score to determine the query sample’s classification. For the decision, the final similarities between the query sample and the representative samples are compared to each other, to determine which type of representative sample has the highest similarity. If the query sample’s similarity with a malware sample is higher than that with the benign program samples, then the query sample is considered malware.
We define a byte image as an image created by directly using the byte values contained in a binary to specify the image pixel values. To convert a binary file to a byte image, the byte image generation module first loads the hex binary to memory, and then it divides the entire bit sequence of the hex binary loaded in the memory into 8-bit (1 byte) units, and each 8-bit is considered as one-pixel value to construct the image. Each pixel’s value is considered as a grayscale value between 0 and 255, and the byte image is generated in the format of grayscale which is one way of representing images, using only brightness information without color information to depict the image. In this study, the size of the Image was set to 128 × 128. This dimension was chosen as it is appropriate for the efficient training and processing of our proposed Siamese Network. Images larger than 128 × 128 may consume excessive training time and computational resources. Conversely, significantly smaller images might fail to capture critical features necessary for distinguishing between malicious and benign samples. The detailed algorithm for the byte image generation is shown in Algorithm 1, and the examples of the images converted from the malware samples and the benign program samples are depicted in Fig. 2.

Figure 2: The examples of the byte image. (a) Dropper/Win32, (b) Downloader/Win32, (c) Exe File/Win32, (d) DLL File/Win32

3.1.2 Opcode Frequency-Based Image Generation
The opcode frequency-based image is generated by conducting four major steps: converting a binary file into assembly code by disassembling, extracting the sequence of opcodes from the disassembled code, calculating the frequency of the 2-grams extracted from the entire opcode sequence, and converting the 2-gram frequency data into an image. Each steps are explained in Section 3.1.2.
To identify the opcodes used in malicious and normal files, the binary is converted into assembly language form. Using IDA Pro, Windows-based executable files are disassembled and transformed into assembly language.
After obtaining the disassembled code from the binary file, unnecessary information such as operands in the assembly instruction sequence is first removed to retain the opcode information. Then, opcodes are extracted while maintaining the order of instructions written in the disassembled code.
2-Gram Opcode Frequency Extracting
From the entire opcode sequence consisting of only opcodes of the disassembled code, the 2-grams are extracted. 2-gram is a sequential data composed of two consecutive elements of a sequence. For example, assuming there is an opcode sequence data which is made of [“mov”, “add”, “sub”, “push”, “pop”], the extracted 2-grams would be [[“mov”, “add”], [“add”, “sub”], [“sub”, “push”], [“push”, “pop”]]. The frequency of 2-grams can be determined by simply counting 2-grams discovered while the method moving sliding window of size 2.
Converting Opcode Frequency Data to an Image
To visualize the extracted 2-gram opcode frequency data as images, it is necessary to establish the coordinate indices for the 2-gram opcodes. The opcode frequency images can vary depending on how these coordinate indices are set. The method for setting coordinate indices can vary widely depending on the criteria established. In our case, opcode instances are clustered first to group similar opcodes. The opcode instance is defined as a document frequency that represents the count of how many documents contain a specific term within a dataset. In detail, the document frequency of each opcode is measured in a set of malware files previously collected, and it is used for conducting clustering.
The indices of the opcodes in the same cluster are positioned close to each other in the x/y coordinate of the image. The distance function used for opcode clustering is the Pearson correlation coefficient. The Pearson correlation coefficient, ranging from –1 to 1, indicates a strong negative correlation when approaching –1 and a strong positive correlation as it approaches 1 [31]. A value near 0 means there is little to no correlation [32]. Given two variables
After clustering opcode instances using the Pearson correlation coefficient, images are generated based on the 2-gram opcode frequencies recorded in Section 3.1.2. If the frequencies recorded for the sequence [[“mov”, “add”], [“add”, “sub”], [“sub”, “push”], [“push”, “pop”]] were [[“mov”, “add”]: 1, [“add”, “sub”]: 2, [“sub”, “push”]: 3, [“push”, “pop”]: 4], then a frequency of 1 would be recorded at the horizontal axis index matching “mov” and the vertical axis frequency for “add”. This process is repeated for all opcode 2-grams to generate an image. The remaining processes for image creation are identical to that of creating byte images, and the resulting images are shown in Fig. 3. (a) and (b) are examples of malware samples converted into opcode frequency-based images, while (c) and (d) are the examples of benign samples’ image

Figure 3: Examples of the opcode frequency-based image. (a) Dropper/Win32, (b) Downloader/Win32, (c) Exe File/Win32, (d) DLL File/Win32
3.2 Selecting Image Pairs for Model Training
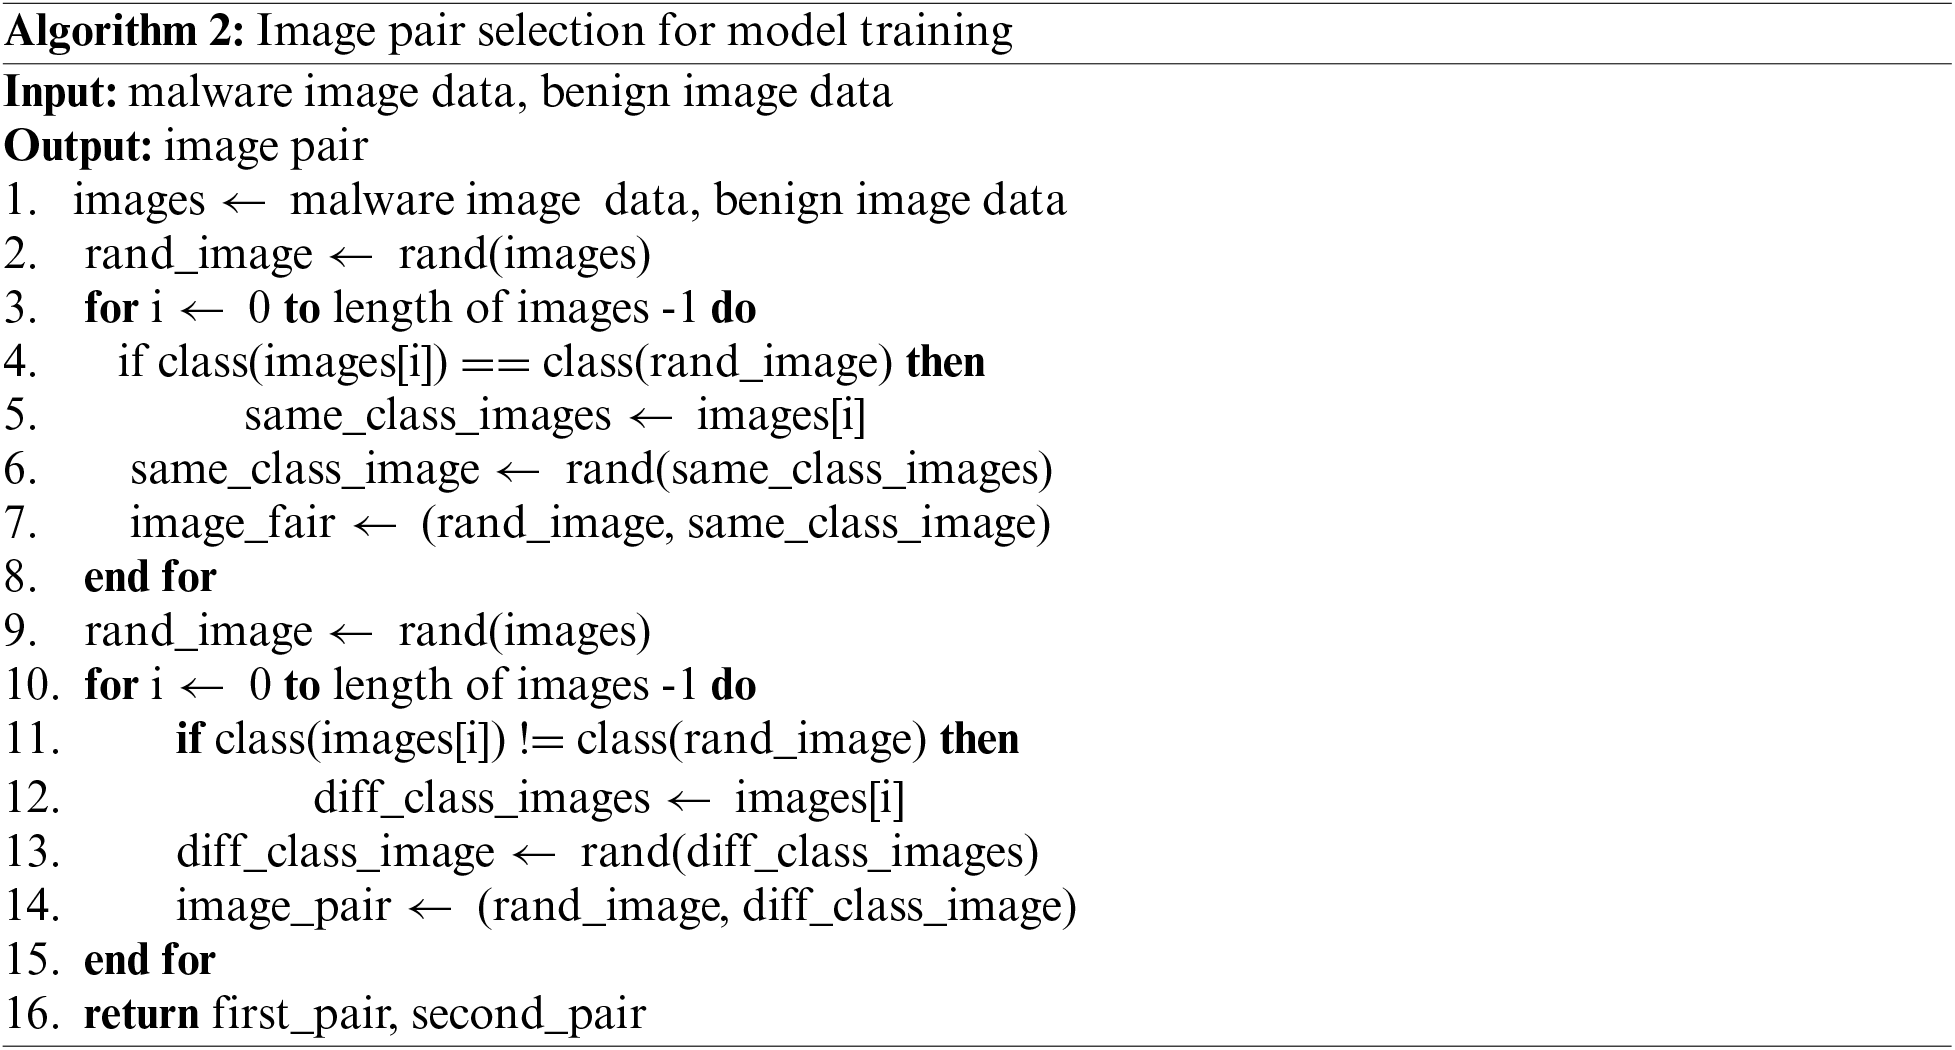
After all byte and opcode frequency images of malware samples and benign program samples are generated, image pairs need to be selected for training two Siamese network models. As described in Algorithm 2, an image is randomly selected from the entire dataset consisting of malware Images and benign program images. Then, another image of the same class as the first selected image is randomly chosen to form an image pair. This process is repeated until enough image pairs of the same class. Siamese network requires not only image pairs of the same class but also image pairs of which image belongs to different classes. Therefore, an image of a different class than the previously selected image is also chosen at random to form an image pair of different classes. During the image pair selection process, a duplicate removal mechanism is conducted to prevent previously selected image pairs from being reused. It ensures that the samples composing the training data are more diverse. The examples of image pairs are shown in Fig. 4.

Figure 4: Examples of image pairs in the same class or different class. (a) Abnormal Image Pair, (b) Normal Image Pair, (c) Normal–Abnormal Image Pair, (d) Abnormal–Normal Image Pair
3.3 Dual Siamese Network-Based Detection
3.3.1 Constructing a Siamese Network
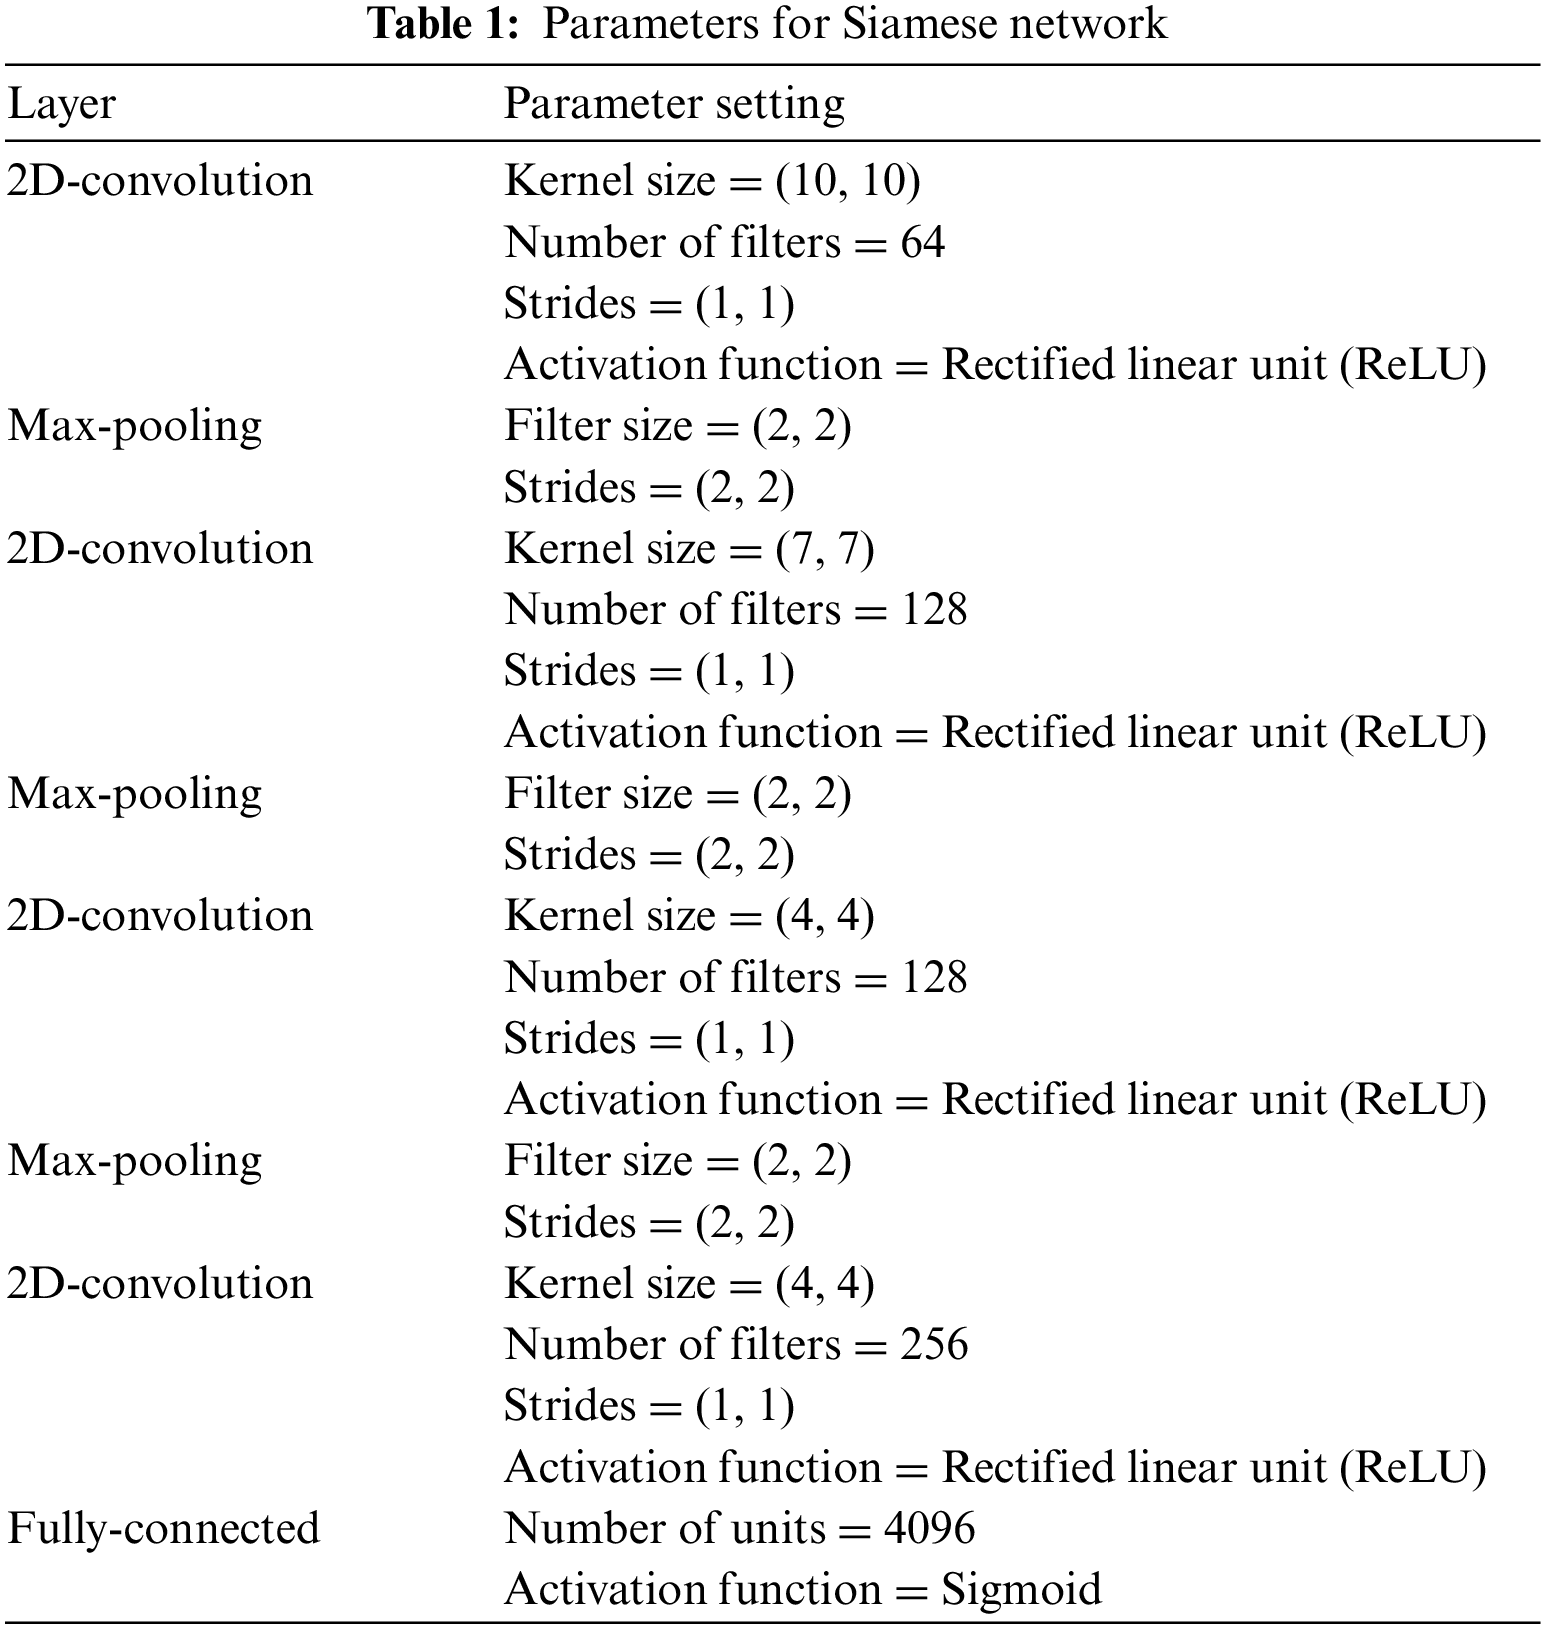
The processing flow for training Siamese network models is depicted in Fig. 5. After all image pairs are selected, the image pairs are labeled to train the Siamese network model. A Siamese network is a specialized neural network used primarily for tasks that involve finding the similarity or relationship between two inputs. The Siamese network model analyzes input data in pairs and produces an output value representing the distance between given inputs of the pair. Therefore, the image pairs of which images are in the same class are labeled as 1, and the pairs of which images belong to different class are labeled as 0. After all given image pairs are labeled, then it is possible to fit the Siamese network models using the image pairs. Dual Siamese network consists of two Siamese networks, and each Siamese network also consists of two identical subnetworks for embedding and a merging network for producing distance value. It is noted that the convolution and pooling layers in the subnetworks for embedding share the weight parameters. The detailed architecture and parameter information are described in Fig. 5 and Table 1. In addition, two subnetworks converge into a merging layer at the end, which computes a metric or distance function to measure how similar or different the inputs are. The L1 distance is used to assess the similarity between the two output vectors of the subnetworks. L1 distance calculates the distance between two points marked in the coordinate space of Euclidean geometry. If there’re two given vectors

Figure 5: Processing flow of dual Siamese network-based detection
If two images are deemed similar (in the case of an image pair from the same class), the similarity score should be close to 1, whereas if they are considered different (in the case of an image pair from different classes), it should be close to 0.
Therefore, when a binary file being analyzed using the dual Siamese network model, L1 distance is converted to a similarity value by using Eq. (3), and the example of images based on similarity is shown in Fig. 6.

Figure 6: The examples of images and their similarities. (a) Normal–Abnormal, (b) Abnormal–Abnormal, (c) Normal–Abnormal, (d) Abnormal–Abnormal
3.3.2 Selection of Representative Samples
The representative samples are used in malware detection with the trained dual Siamese network model. To select these representative samples, each image is first input to the pre-trained VGG16 model to transform the image data to a vector. The VGG16 model consists of consecutive convolution and pooling layers, and fully-connected layers. Among the immediate output of layers of the VGG16, the output of the last pooling layer is flattened to form the vector. After all images are converted to vectors, then a malware sample and a benign sample that have the minimum Euclidean distance in each group are chosen as the representative malware and benign samples. The query sample, along with the representative malware and benign samples, forms the image pairs that are input into the dual Siamese network model.
3.3.3 Detection Using Dual Siamese Network
Siamese networks can only determine whether two given inputs belong to the same class or not. Therefore, to ascertain whether a specific binary is malicious or not, one must compare the binary file’s similarity with representative samples of both malware and benign programs. If the similarity with the malware samples is higher, the binary file is classified as malware. Therefore, if a binary file is given, its byte image and opcode frequency image are generated, and these images are considered as query samples. The similarity is firstly computed using the pair of the query images and malware images, and the similarity is also calculated using the pair of the query images and benign program images. Then, these two similarities are compared for the final decision.
Dual Siamese Network consists of two Siamese networks which separately produce a similarity value. Therefore, in each pairwise similarity calculation, the similarity for opcode frequency images and the similarity for byte images are calculated by two Siamese networks, and these two similarities are weighted and averaged to obtain a single similarity.
In the experiments of this paper, we used the data provided by the Korea Internet & Security Agency for the 2018–2019 “AI-based malware detection” track [34]. Among the provided PE (Portable Executable) files, we focused on codes targeting the Intel 80386 PE and excluded small-sized malware and normal codes with less than 500 instructions. From the remaining data, we randomly selected 10,000 Normal and 10,000 Abnormal data. Additionally, to prove the detection model’s generalization performance, we also used 9000 malware samples collected from Vxunderground [35].
The dataset was transformed into two different formats to facilitate model learning. The first method, Byte Image, converts the PE file binary into an 8-bit grayscale image, and the second method, Opcode Frequency-Based Image, generates an image based on the opcode frequency of the PE file. Using these methods, the processed dataset was divided into a Support (Training) Set and a Query (Test) Set at an 8:2 ratio.
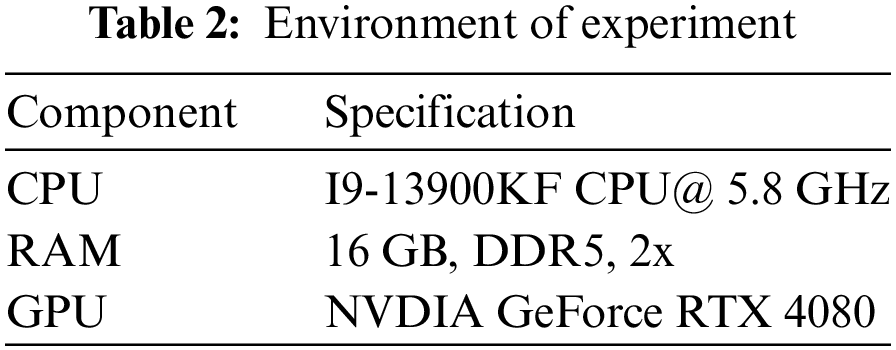
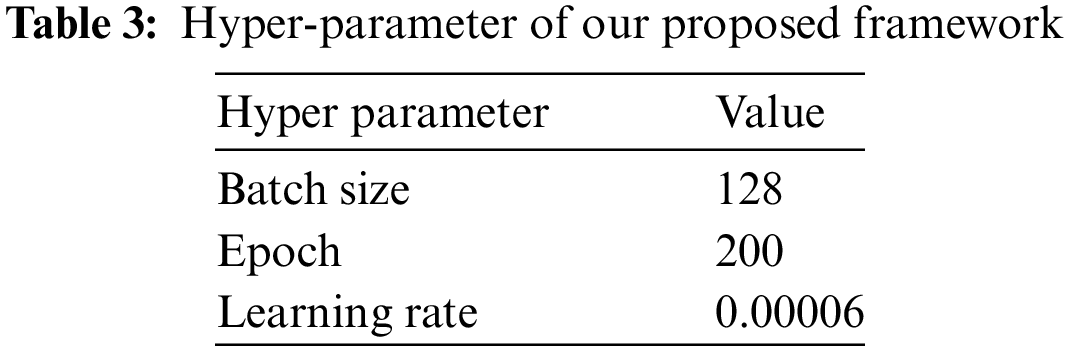
The system specifications used in the experiments of this paper are shown in Table 2, and the libraries used are Python 3.10.12, PyTorch 2.1.2, and Scikit-Learn 3.10.12. The hyper-parameters of the Dual Siamese Network are shown in Table 3 and are set to the values that performed the best in performance comparisons.
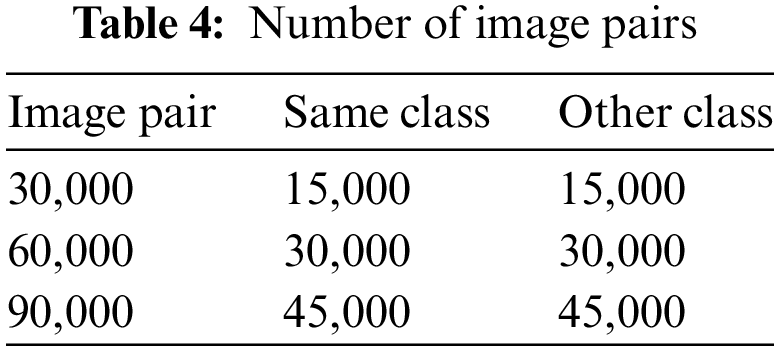
To determine whether a combined form of two features demonstrates better performance than a single feature in our proposed Dual Siamese Network, the similarity weight of each Siamese network model was incremented by 10 within a range of 0 to 100 during the experiments, and the sum of the weights of both models was set to satisfy 100. The support set consists of 16,000 images (# of the benign samples: 8000, # of malware samples: 8000), and all possible image pairs are 127,992,200, however, in our experiments, we conducted the evaluation using only 30,000, 60,000, 90,000 image pairs. In this case, image pairs of the same class and image pairs of different classes are selected in a 5:5 ratio among the set image pairs as shown in Table 4. This approach was adopted to ascertain the impact on the performance of our proposed method as the number of image pairs increases.
In this section, performance metrics such as Accuracy, Precision, Recall, and F1-Score are explained. To calculate each performance metrics, True Positive (TP), True Negative (TN), False Positive (FP), and False Negative (FN) are calculated in advance. True Positive (TP) occurs when the true category is positive, and the predicted category is also positive. True Negative (TN) occurs when the true category is negative, and the predicted category is also negative. A False Positive (FP) occurs when the true category is negative, but the predicted category is positive. A False Negative (FN) occurs when the true category is positive, but the predicted category is negative [5]. After all basic metrics such as TP and FP are computed, then Accuracy, Precision, Recall, and F1-Score can be calculated using the basic metric values.
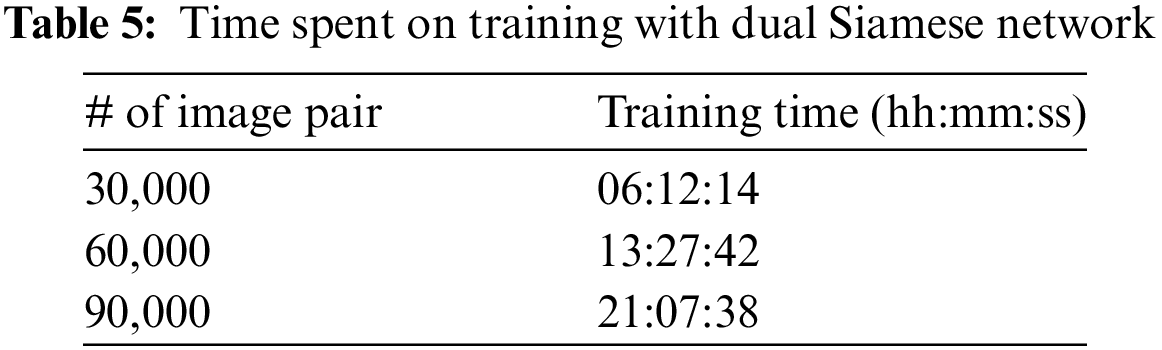
Accuracy is defined as the ratio of correctly predicted results to the total number of predictions, and it is the ratio of TP and TN to the sum of all predictions. The formula is Eq. (4). Precision is defined as the percentage of positive predictions that are correct. It is calculated by dividing the number of TP by the sum of TP and FP. The formula is Eq. (5). Recall is the model’s ability to correctly identify malware. It is expressed as the number of TP divided by the total number of true cases, i.e., the sum of FP and FN. The formula is Eq. (6). The F1-Score is the harmonic mean of Precision and Recall. Table 5 shows the training time depending on the number of image pairs used for training. The shortest training time was about 6 h for 30,000 image pairs and the longest training time was about 21 h for 90,000 image pairs. The formula is Eq. (7).
4.3.2 Malware Detection Performance
The experimental results regarding the effects of varying weights and image pair quantities on model performance are presented in Table 6. The weight ratio is expressed as the Byte Image model to opcode frequency-based ratio. As shown in the table, a higher number of image pairs generally leads to better performance, with the best results achieved when both features are used in equal proportions (50:50 weight ratio). The best performance was achieved with 90,000 image pairs and a 50:50 weight ratio. In this configuration, the model achieved an accuracy of 95.90%, precision of 96.81%, recall of 94.60%, and F1-Score of 95.69%. Comparing the results across all metrics, the 50:50 weight ratio consistently provides predominantly high performance in terms of accuracy, precision, recall, and F1-Score. The precision, which measures the model’s accuracy in predicting positive samples, was highest at 96.81%, indicating a low false positive rate. The recall, which assesses the model’s ability to identify all relevant instances, was slightly lower at 94.60%, indicating that while the model is highly accurate, there is still a small proportion of relevant instances not being detected. The F1-Score, which balances precision and recall, was high at 95.69%, reflecting the overall effectiveness and robustness of the model. The confusion matrix is shown in Fig. 7, and the results indicate that our proposed model, which utilizes a combination of features, performs more accurate detection than models using single features alone, and that increasing the number of image pairs has a positive impact on the model’s detection performance.
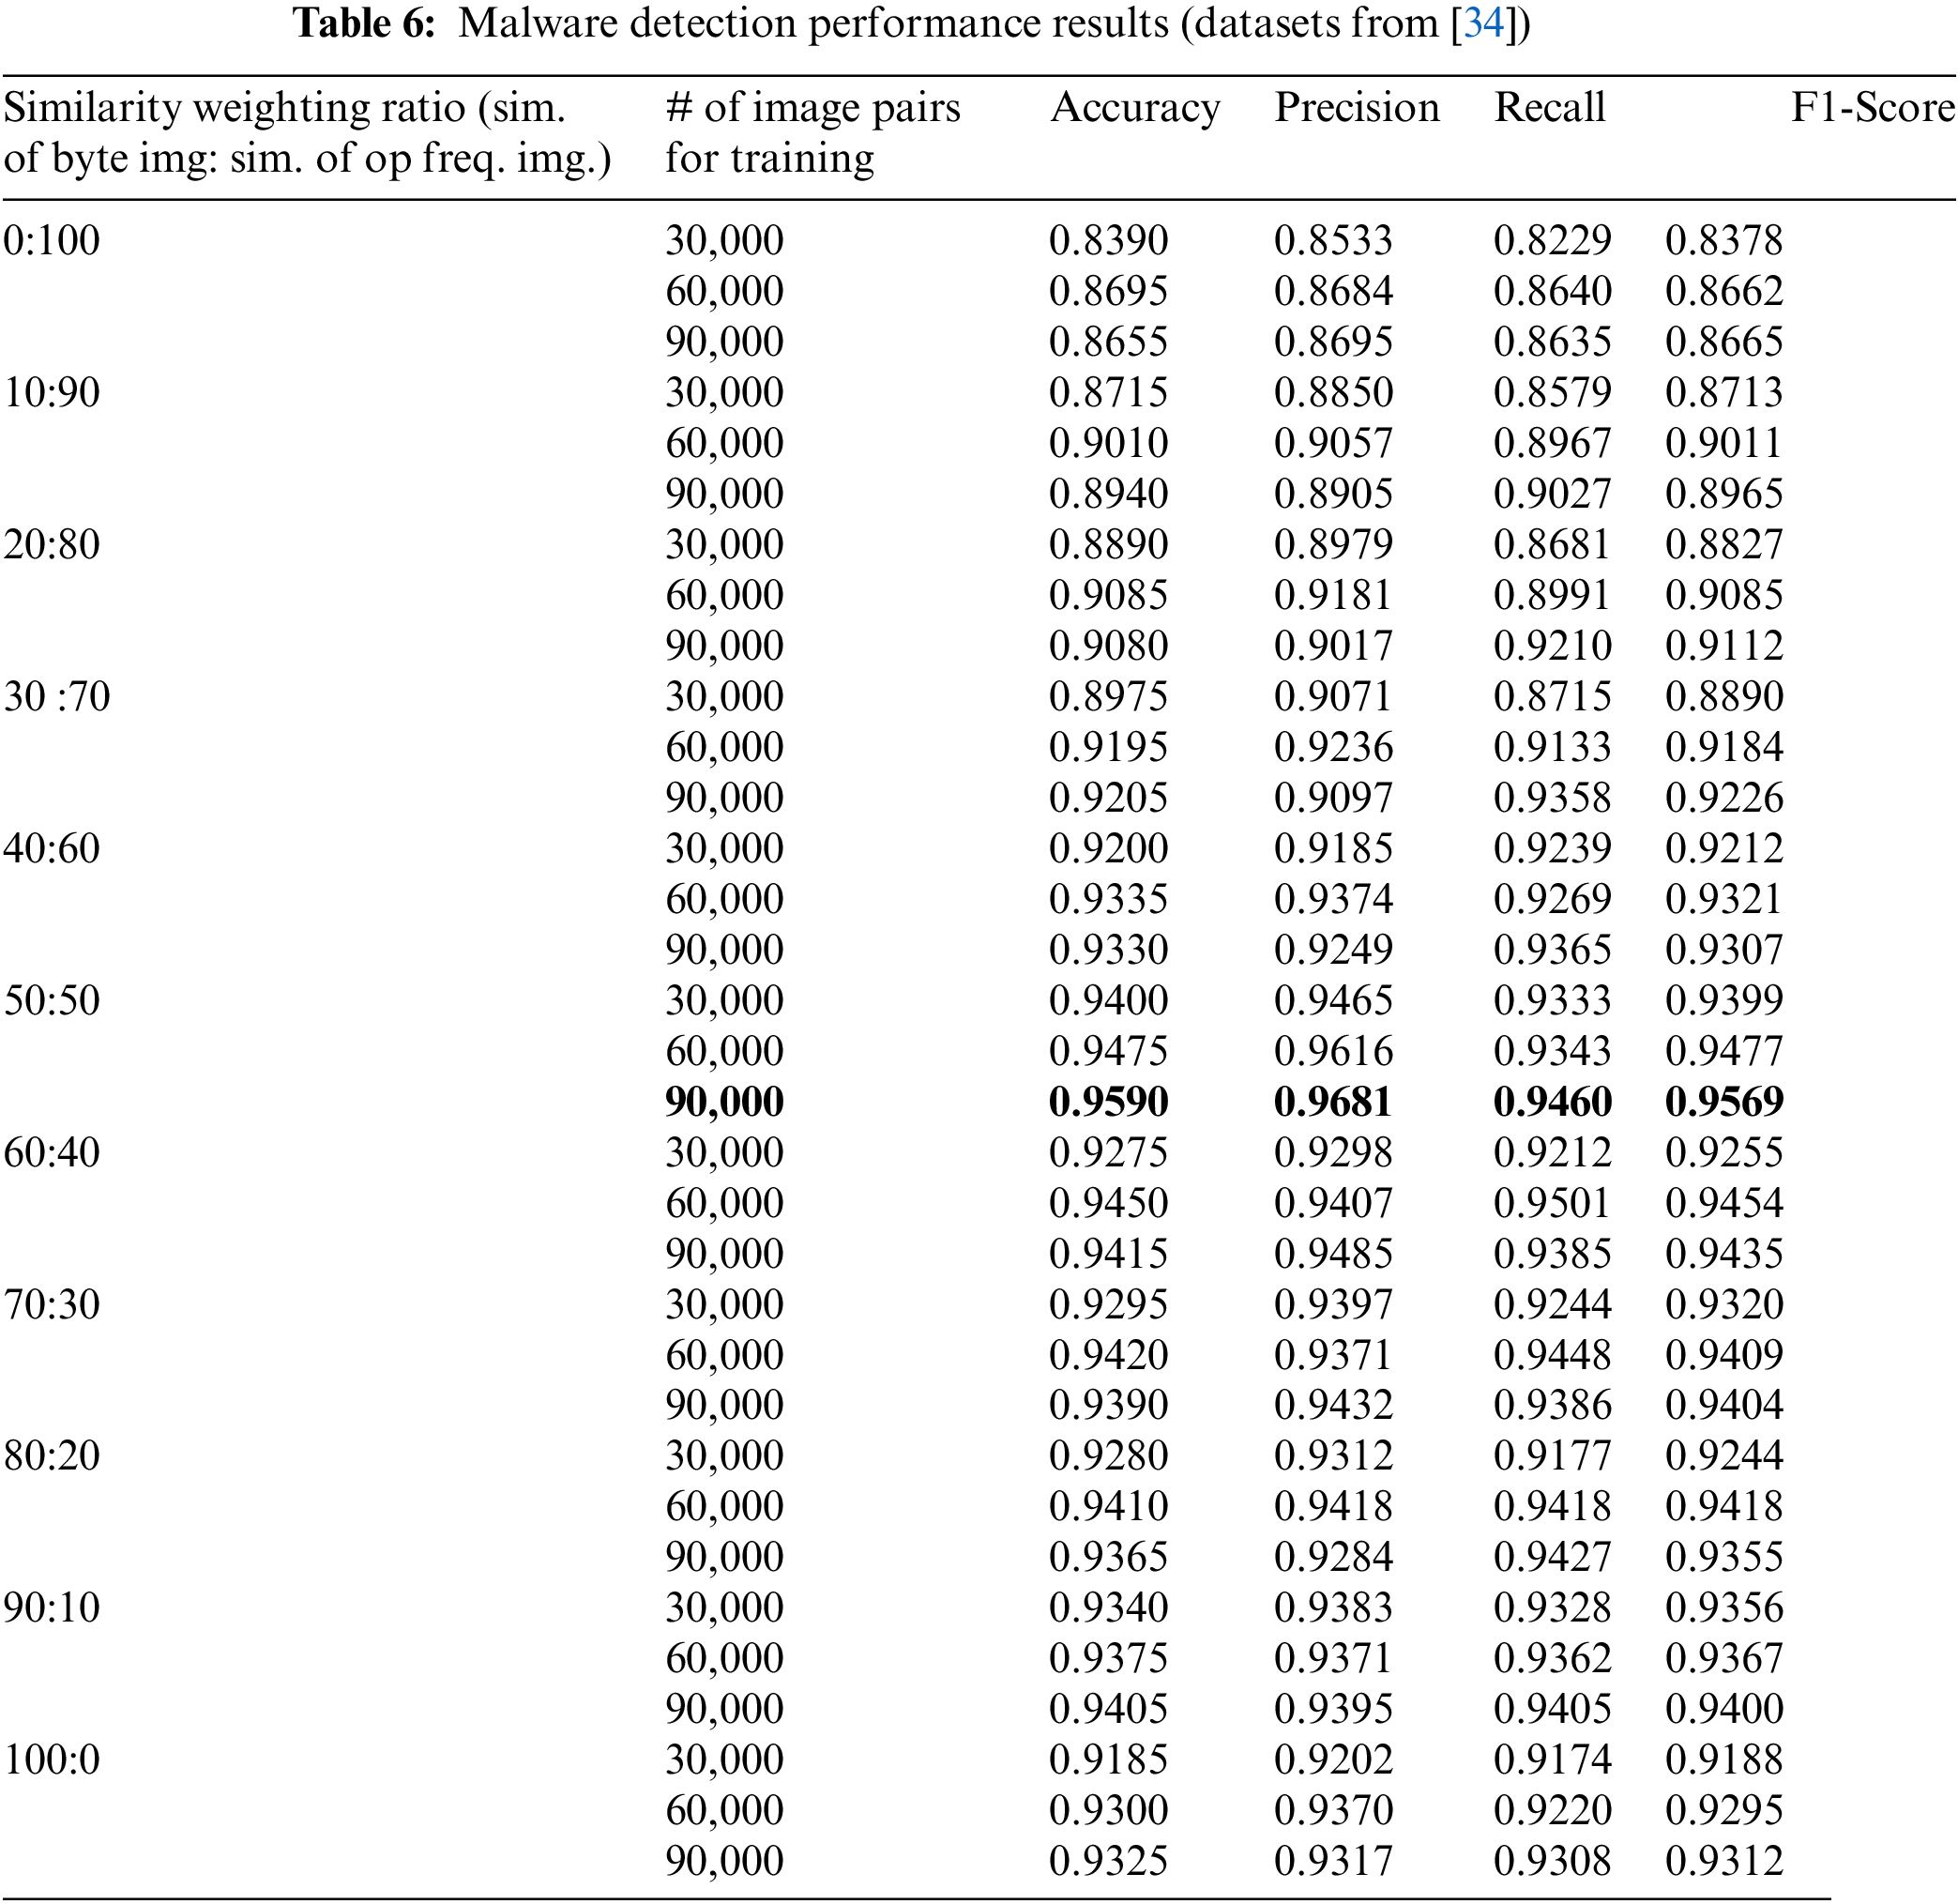

Figure 7: Confusion matrix evaluated using the dataset of [34] (The similarity weight ratio is 50:50, and 90,000 image pairs were used)
The experimental results using the additional dataset consisting of 9000 malware samples collected from [35] are shown in Table 7, indicating that the model demonstrates a very high level of detection performance. Specifically, in the confusion matrix in Fig. 8, both the accuracy and F1-Score are above 0.998, showing that the model performs accurate predictions in almost all cases. The precision and recall are also close to 0.998, demonstrating that the model is highly effective not only in the accuracy of positive predictions but also in identifying actual positive cases. These experimental results prove that using the additional dataset has further enhanced the model’s generalization ability, significantly increasing the model’s reliability and accuracy.
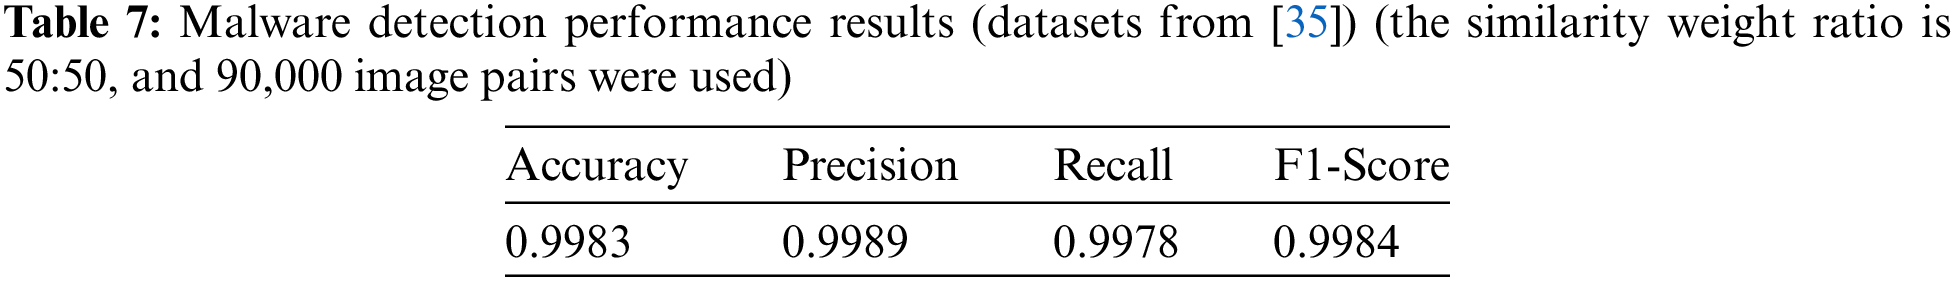
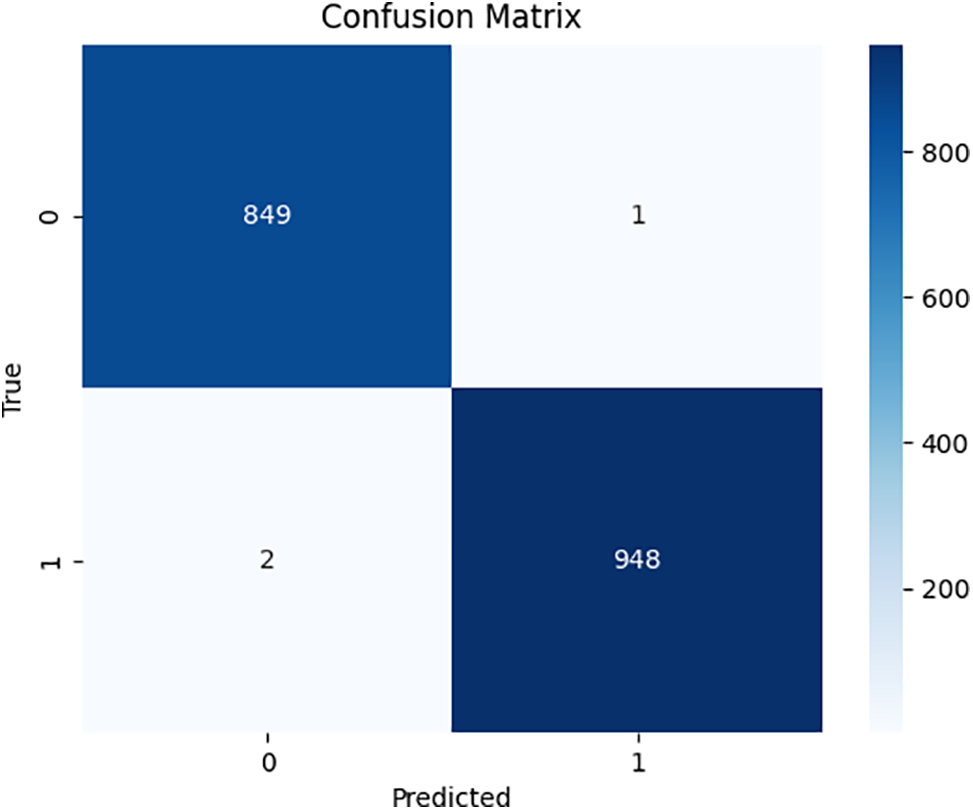
Figure 8: Confusion matrix evaluated using the dataset of [35] (the similarity weight ratio is 50:50, and 90,000 image pairs were used)
Additionally, to check the performance even when the training dataset is significantly reduced, we conducted the malware detection experiment using only 800 samples consisting of 400 benign samples and 400 malware samples of Vxunderground [35], the experimental results, shown in Table 8, achieved a high accuracy of 99.5%. The Confusion Matrix is shown in Fig. 9.
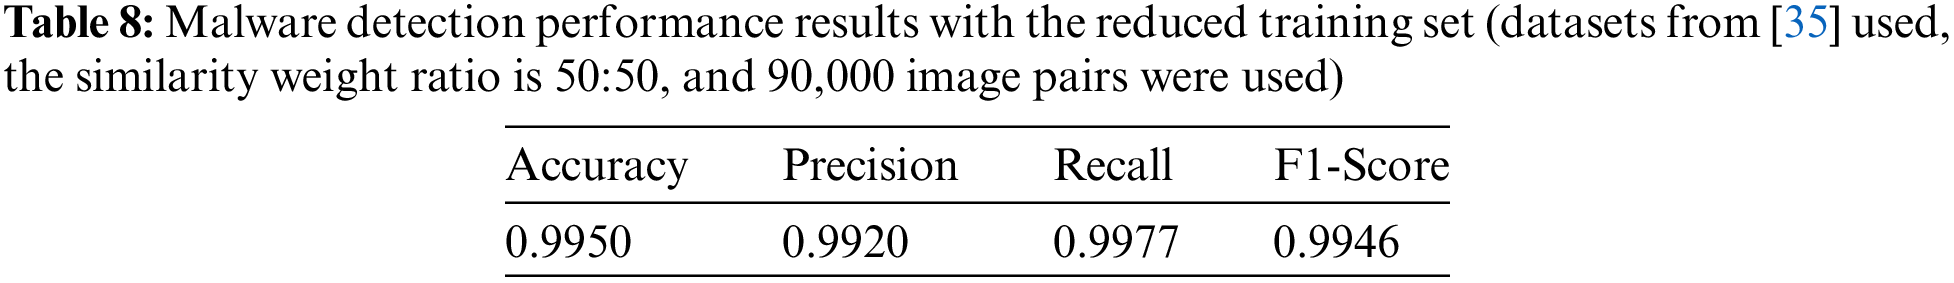

Figure 9: Confusion matrix for Vxunderground sample with reduced training data
4.3.3 Performance Growth along Training Steps
Fig. 10 shows the change in loss per image pair for models trained on byte images and opcode frequency-based images. Fig. 10a–c shows the loss changes for the Siamese Network tested with 30,000, 60,000, and 90,000-byte image pairs, respectively.

Figure 10: The growth of loss values along learning epochs (Dataset: [34]). (a) Gray Scale Image (30,000), (b) Gray Scale (60000), (c) Gray Scale (90,000), (d) Opcode Frequency-Based Image (30,000), (e) Opcode Frequency-Based Image (60,000), (f) Opcode Frequency-Based Image (90,000)
Similarly, Fig. 10d–f shows the loss changes for the Siamese Network tested with 30,000, 60,000, and 90,000 Opcode Frequency-Based Images Pairs, respectively. Both Siamese Networks converge stably, with minimal loss rates due to the model’s estimation errors. The x-axis and y-axis of each graph in the figures mean the number of epochs for training and binary cross entropy loss value. The binary cross entropy loss is calculated using Eq. (8) and Eq. (9) [36].
where
Fig. 11 shows the accuracy changes for the model trained with byte image and opcode frequency-based image. The accuracy was measured every 10 epochs during the training process, and it can be observed that the accuracy improves as training progresses.

Figure 11: The growth of accuracy values along learning epochs (Dataset: [35]). (a) Accuracy (Image Pair: 30,000), (b) Accuracy (Image Pair: 60,000), (c) Accuracy (Image Pair: 90,000)
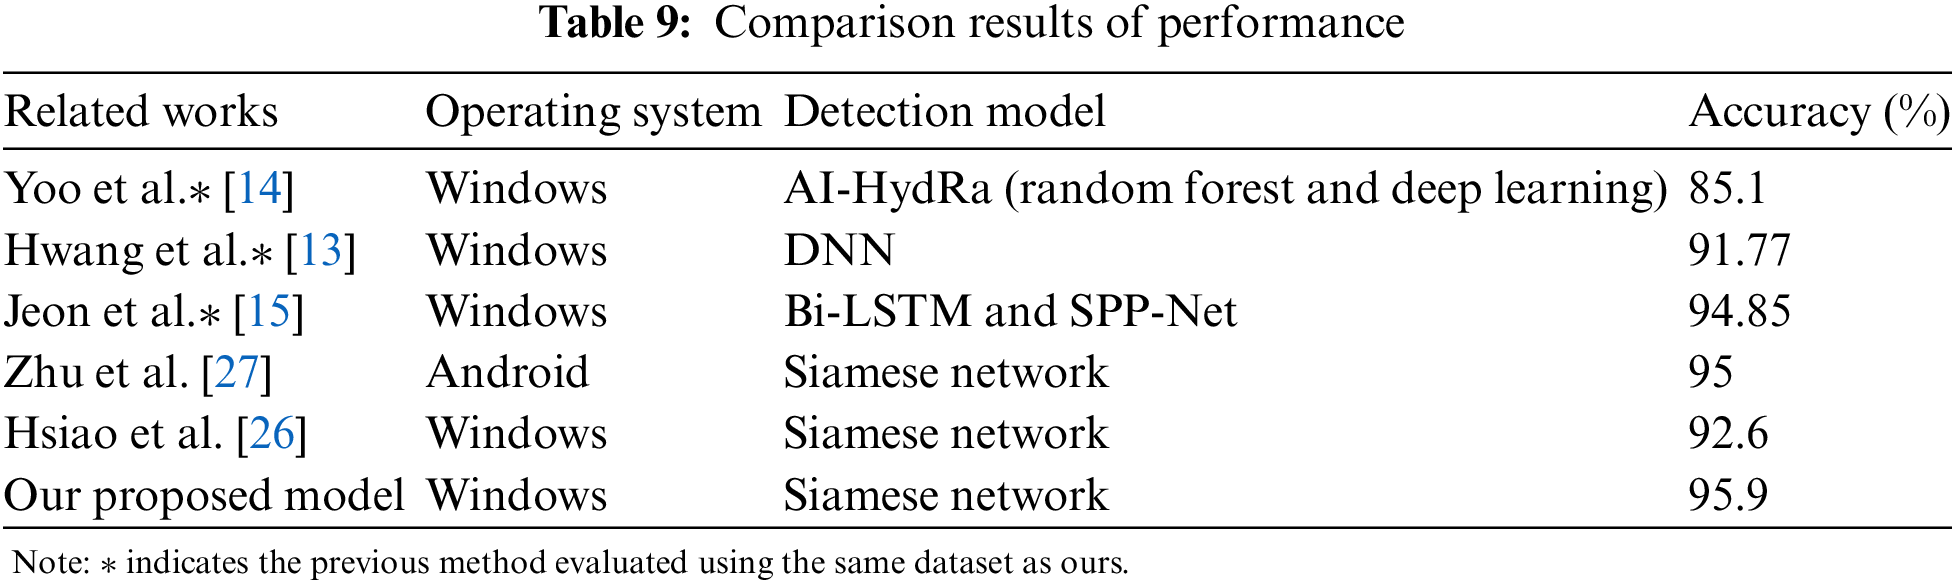
4.3.4 Performance Comparison with Previous Works
Table 9 presents the comparative analysis results between our study and related works using the same dataset as well as studies performing malware detection based on the Siamese Network. The study using the same dataset by Jeon et al. [15] achieved an accuracy of 94.85% with their Bi-LSTM and SPP-Net method, while the study based on the Siamese Network by Zhu et al. [27] reported an accuracy of 95%. Our proposed framework demonstrated approximately 1–10% higher accuracy compared to related studies using the same dataset, and about 1–3% higher performance than the study using the Siamese Network. This indicates that the Dual Siamese Network proposed in this paper enables more efficient detection.
In this paper, we propose a Dual Siamese Network framework based on byte Image and opcode frequency-based image. Our framework utilizes byte image and opcode frequency-based image to generate malware detection models, applying different weights to each to comprehensively reflect various characteristics. We measured the malware detection performance of our framework which uses two kinds of features, by varying the number of the image pairs for training and similarity weight ratios. As a result, the detection accuracies of 95.90% and 99.83% were achieved in the experiments using different malware samples. The experimental results demonstrate that our malware detection model can effectively detect malware by utilizing two different types of features and employing the dual Siamese network-based model.
Our proposed framework uses byte image and opcode frequency-based image features for malware detection. While these static features are useful, they have the limitation of not capturing the behavioral information of malware. Addressing this limitation is necessary. Incorporating a wider variety of dynamic features (e.g., API execution features) is believed to result in even better performance. Additionally, integrating other neural networks, such as GANs (Generative Adversarial Networks), is also expected to enhance the detection model’s generalization and performance. In the future, we plan to research the combination of other useful algorithms or features that might enhance the quality of the proposed framework. These efforts are expected to significantly contribute to the detection of various types of malware.
Acknowledgement: This work was supported by the Soonchunhyang University Research Fund.
Funding Statement: The authors received no specific funding for this study.
Author Contributions: The authors confirm contribution to the paper as follows: study conception and design: Taeguen Kim; data collection & evaluation: ByeongYeol An and JaeHyeok Yang; draft manuscript preparation: ByeongYeol An and SeoYeon Kim. All authors reviewed the results and approved the final version of the manuscript.
Availability of Data and Materials: The datasets used in this study can be accessed from the following sources: The dataset provided by the KISA Information Security R&D Center is available at https://www.ksecurity.or.kr/kisis/subIndex/461.do and the dataset collected from Vxunderground can be accessed at https://vx-underground.org/APTs, accessed on 23/04/2024. The datasets used and/or analyzed during the current study are available from the corresponding author on reasonable request.
Conflicts of Interest: The authors declare that they have no conflicts of interest to report regarding the present study.
References
1. Aslan ÖA. A comprehensive review on malware detection approaches. IEEE Access. 2020;8:6249–71. [Google Scholar]
2. Ngo MV, Truong-Huu T, Rabadi D, Loo JY, Teo SG. Fast and efficient malware detection with joint static and dynamic features through transfer learning. In: Int Conf on Appl Cryptogr Netw Security; 2023 June 19–22; Kyoto, Japan. Cham: Springer Nature Switzerland. p. 503–31. doi:10.1007/978-3-031-33488-7_19. [Google Scholar] [CrossRef]
3. Vinayakumar R, Soman KP. DeepMalNet: evaluating shallow and deep networks for static PE malware detection. ICT Express. 2018;4(4):255–8. [Google Scholar]
4. Falowo OI, Ozer M, Li C, Abdo JB. Evolving malware and DDoS attacks: decadal longitudinal study. IEEE Access. 2024;12:39221–37. [Google Scholar]
5. Vasan D, Alazab M, Wassan S, Safaei B, Zheng Q. Image-based malware classification using ensemble of CNN architectures (IMCEC). Comput Secur. 2020;92:10174. doi:10.1016/j.cose.2020.101748. [Google Scholar] [CrossRef]
6. Rong C, Gou G, Hou C, Li Z, Xiong G, Guo L. UMVD-FSL: unseen malware variants detection using few-shot learning. In: 2021 International Joint Conference on Neural Networks (IJCNN); 2021 July 18–22; Shenzhen, China: IEEE. p. 1–8. doi:10.1109/IJCNN52387.2021.9533759. [Google Scholar] [CrossRef]
7. Zhu J, Jang-Jaccard J, Watters PA. Multi-loss siamese neural network with batch normalization layer for malware detection. IEEE Access. 2020;8:171542–50. [Google Scholar]
8. Wang Y, Yao Q, Kwok JT, Ni LM. Generalizing from a few examples: a survey on few-shot learning. ACM Comput Surveys. 2020;53(3):1–34. [Google Scholar]
9. Koch G, Zemel R, Salakhutdinov R. Siamese neural networks for one-shot image recognition. ICML Deep Learn Workshop. 2015;2(1). [Google Scholar]
10. Zolkipli MF, Jantan A. A framework for malware detection using combination technique and signature generation. In: 2010 Second International Conference on Computer Research and Development; 2010 May 7–10; Kuala Lumpur, Malaysia: IEEE. p. 196–9. doi:10.1109/ICCRD.2010.25. [Google Scholar] [CrossRef]
11. Savenko O, Nicheporuk A, Hurman I, Lysenko S. Dynamic signature-based malware detection technique based on API call tracing. CEUR Workshops. 2019;2393:633–43. [Google Scholar]
12. Santos I, Devesa J, Brezo F, Nieves J, Bringas PG. OPEM: a static-dynamic approach for machine-learning-based malware detection. In: International Joint Conference CISIS’12-ICEUTE’12-SOCO’12 Special Sessions; 2012 Sep 5–7; Ostrava, Czech Republic: Springer Berlin Heidelberg. p. 271–80. doi:10.1007/978-3-642-33018-6_28. [Google Scholar] [CrossRef]
13. Hwang C, Hwang J, Kwak J, Lee T. Platform-independent malware analysis applicable to windows and Linux environments. Electronics. 2020;9(5):793. doi:10.3390/electronics9050793. [Google Scholar] [CrossRef]
14. Yoo S, Kim S, Kim S, Kang BB. AI-HydRa: advanced hybrid approach using random forest and deep learning for malware classification. Inf Sci. 2021;546(6):420–35. [Google Scholar]
15. Jeon J, Jeong B, Baek S, Jeong Y. Hybrid malware detection based on Bi-LSTM and SPP-Net for smart IoT. IEEE Trans Ind Inform. 2021;18(7):4830–37. [Google Scholar]
16. Sara JJ, Hossain S. Static analysis based malware detection for zero-day attacks in android applications. In: 2023 Int Conf Inf Commun Technol Sustain Dev (ICICT4SD); 2023 Sep 21–23; Dhaka, Bangladesh: IEEE. p. 169–73. doi:10.1109/ICICT4SD59951.2023.10303336. [Google Scholar] [CrossRef]
17. He Z. Advancing hardware-assisted cybersecurity: effective machine learning approaches for zero-day malware detection (Master Thesis). California State University, Fullerton: USA; 2023. [Google Scholar]
18. Aslan Ö, Yilmaz AA. A new malware classification framework based on deep learning algorithms. IEEE Access. 2021;9:87936–51. [Google Scholar]
19. Chaganti R, Ravi V, Pham TD. Image-based malware representation approach with EfficientNet convolutional neural networks for effective malware classification. J Inf Secur Appl. 2022;69:87936–51. [Google Scholar]
20. Acharya V, Ravi V, Mohammad N. EfficientNet-based convolutional neural networks for malware classification. In: 2021 12th International Conference on Computing Communication and Networking Technologies (ICCCNT); 2021 July 6–8; Kharagpur, India. IEEE. p. 1–6. doi:10.1109/ICCCNT51525.2021.9579750. [Google Scholar] [CrossRef]
21. Brown A, Gupta M, Abdelsalam M. Automated machine learning for deep learning based malware detection. Comput Security. 2024;137:103582. doi:10.1016/j.cose.2023.103582. [Google Scholar] [CrossRef]
22. Abdulazeez FA, Ahmed IT, Hammad BT. Examining the performance of various pretrained convolutional neural network models in malware detection. Appl Sci. 2024;14(6). doi:10.3390/app14062614. [Google Scholar] [CrossRef]
23. Zhong W, Gu F. A multi-level deep learning system for malware detection. Expert Syst Appl. 2019;133:151–62. [Google Scholar]
24. Chai Y, Du L, Qiu J, Yin L, Tian Z. Dynamic prototype network based on sample adaptation for few-shot malware detection. IEEE Trans Knowl Data Eng. 2023;35(5):4754–66. [Google Scholar]
25. Almarshad FA, Zakariah M, Gashgari GA, Aldakheel EA, Alzahrani AIA. Detection of android malware using machine learning and siamese shot learning technique for security. IEEE Access. 2023;11:127697–714. [Google Scholar]
26. Hsiao SC, Kao DY, Liu ZY, Tso R. Malware image classification using one-shot learning with siamese networks. Procedia Comput Sci. 2019;159:1863–71. [Google Scholar]
27. Zhu J, Jang-Jaccard J, Singh A, Watters PA, Camtepe S. Task-aware meta learning-based siamese neural network for classifying control flow obfuscated malware. IEEE Trans Ind Inform. 2023;15(6):214. doi:10.3390/fi15060214. [Google Scholar] [CrossRef]
28. Asir D, Natheesh A, A. SA, Manoj K. Enhancing malware detection through machine learning: a comparative analysis of random forest and Naive Bayes classification systems. Int J Adv Res Sci Technol. 2024;13(3):1288–92. [Google Scholar]
29. Kasarapu S, Shukla S, Hassan R, Sasan A, Homayoun H, Pudukotai Dinakarrao SM. Generative AI-based effective malware detection for embedded computing systems; 2024. Available from: https://arxiv.org/html/2404.02344v2. [Accessed 2024]. [Google Scholar]
30. Davis RE, Xu J, Roy K. Classifying malware traffic using images and deep convolutional neural network. IEEE Access. 2024;12:58031–8. [Google Scholar]
31. Asuero AG, Sayago A, González AG. The correlation coefficient: an overview. Crit Rev Anal Chem. 2007;36(1):41–59. [Google Scholar]
32. Bhandari P. Correlational research | when & how to use. 2021. Available from: https://www.scribbr.com/methodology/correlational-research/. [Accessed 2024]. [Google Scholar]
33. Rane S, Sun W, Vetro A. Privacy-preserving approximation of L1 distance for multimedia applications. In: 2010 IEEE International Conference on Multimedia and Expo; 2010; Singapore: IEEE. p. 492–7. doi:10.1109/ICME.2010.5583030. [Google Scholar] [CrossRef]
34. KISA Information Security R&D Center. Large, normal, malicious 4; 2019. Available from: https://www.ksecurity.or.kr/kisis/subIndex/461.do. [Accessed 2024]. [Google Scholar]
35. Vxunderground. Apts; 2024. Available from: https://vx-underground.org/APTs. [Accessed 2024]. [Google Scholar]
36. Su J, Liu Z, Zhang J, Sheng VS, Song Y, Zhu Y, et al. DV-Net: accurate liver vessel segmentation via dense connection model with D-BCE loss function. Knowl Based Syst. 2021;232:107471. doi:10.1016/j.knosys.2021.107471. [Google Scholar] [CrossRef]
Cite This Article
 Copyright © 2024 The Author(s). Published by Tech Science Press.
This work is licensed under a Creative Commons Attribution 4.0 International License , which permits unrestricted use, distribution, and reproduction in any medium, provided the original work is properly cited.
 Downloads
 Citation Tools