
 Submit a Paper
 Propose a Special lssue
 Open Access
ARTICLE

Anomaly-Based Intrusion Detection Model Using Deep Learning for IoT Networks
1 Faculty of Computing, Universiti Teknologi Malaysia (UTM), Johor Bahru, 81310, Malaysia
2 DAAI Research Group, College of Computing and Digital Technology, Birmingham City University, Birmingham, B4 7XG, UK
3 Department of Software Engineering, College of Computer and Information Sciences, King Saud University, Riyadh, 11345, Saudi Arabia
* Corresponding Author: Muaadh A. Alsoufi. Email:
(This article belongs to the Special Issue: Emerging Technologies in Information Security )
Computer Modeling in Engineering & Sciences 2024, 141(1), 823-845. https://doi.org/10.32604/cmes.2024.052112
Received 23 March 2024; Accepted 07 June 2024; Issue published 20 August 2024
 View Full Text
 Download PDF
Abstract
The rapid growth of Internet of Things (IoT) devices has brought numerous benefits to the interconnected world. However, the ubiquitous nature of IoT networks exposes them to various security threats, including anomaly intrusion attacks. In addition, IoT devices generate a high volume of unstructured data. Traditional intrusion detection systems often struggle to cope with the unique characteristics of IoT networks, such as resource constraints and heterogeneous data sources. Given the unpredictable nature of network technologies and diverse intrusion methods, conventional machine-learning approaches seem to lack efficiency. Across numerous research domains, deep learning techniques have demonstrated their capability to precisely detect anomalies. This study designs and enhances a novel anomaly-based intrusion detection system (AIDS) for IoT networks. Firstly, a Sparse Autoencoder (SAE) is applied to reduce the high dimension and get a significant data representation by calculating the reconstructed error. Secondly, the Convolutional Neural Network (CNN) technique is employed to create a binary classification approach. The proposed SAE-CNN approach is validated using the Bot-IoT dataset. The proposed models exceed the performance of the existing deep learning approach in the literature with an accuracy of 99.9%, precision of 99.9%, recall of 100%, F1 of 99.9%, False Positive Rate (FPR) of 0.0003, and True Positive Rate (TPR) of 0.9992. In addition, alternative metrics, such as training and testing durations, indicated that SAE-CNN performs better.Keywords
List of Abbreviations
| IoT | Internet of Things |
| AIDS | Anomaly-Based Intrusion Detection System |
| SAE | Sparse Autoencoder |
| CNN | Convolutional Neural Network |
| FPR | False Positive Rate |
| TPR | True Positive Rate |
| IDS | Intrusion Detection System |
| RNN | Recurrent Neural Network |
| DNN | Deep Neural Network |
| GRU | Gated Recurrent Units |
| WDLSTM | Weight Dropped Long Short-Term Memory |
| FCNs | Fully Connected Networks |
| VAE | Variational Autoencoder |
| ANN | Artificial Neural Network |
| LSTM | Long Short-Term Memory |
| SSAE | Stacked Sparse Autoencoder |
| TCN | Temporal Convolutional Network |
| NIDS | Network Intrusion Detection System |
| D-PACK | Name of Model |
| KitNET | Name of Model |
| KDD99 | Dataset |
| NSL-KDD | Dataset |
| UNSW-NB15 | Dataset |
| Yahoo Web scope S5 | Dataset |
| KYOTO-HONEYPOT | Dataset |
| MAWILAB | Dataset |
| kitsune | Dataset |
| Bot-IoT | Dataset |
| MQTT | MQ Telemetry Transport |
| DoS | A Denial-of-Service |
| DDoS | A Distributed Denial of Service |
| OS | Operating System |
| SMOTE | Synthetic Minority Over-Sampling Technique |
| ReLU | Rectified Linear Unit |
| KL | Kullback-Leibler |
Cybersecurity is an essential part of the framework of information management in the Internet of Things (IoT) environment. The large-scale distribution of IoT devices for smart homes, healthcare, smart cars, and smart power grids, compounded with the intricacy of communication protocols employed by IoT users, can pose significant security risks. These factors collectively contribute to the extensive vulnerability of IoT systems to cyber-attacks. Although smart and remote-control technologies boost efficiency and productivity, they also increase the risk of cyberattacks. In addition, smart and remote-control technologies boost efficiency and productivity and increase the risk of cyber-attacks. The IoT information protection architecture is crucial in today’s advanced technological environment. Since 2015, there have been considerable increases in the usage of IoT devices. By 2025, the number of IoT devices is predicted to reach 42 billion [1–3]. This number of devices generates a high volume of data that needs to be analyzed, leading to computational costs and energy consumption. In contrast, as attackers become more covert and attack costs continue to drop, the environment for IoT network security is significantly threatened.
Intrusion detection has gradually replaced active defense as the essential tool for ensuring network system security. The purpose of an intrusion detection system (IDS), which is based on a specific security strategy, is to monitor the operation of the network system, detect various intrusion behaviors, attempts, or results, and automatically react to effectively prevent illegal access or intrusion. Misuse-based and anomaly-based detection are two processing methods typically included in IDS [4]. The intrusive behavior mode must be precisely defined in advance by the Misuse Detection System, and the intrusive behavior is identified if the attacker’s attack pattern precisely fits the detection system’s pattern library. Anomaly detection systems categorize intrusion activities as unfamiliar and constitute a subset of abnormal behaviors. Any deviation from the established normal behavior pattern beyond a certain threshold is an intrusion event.
In recent years, researchers have employed machine learning techniques to build network intrusion detection systems and have made significant progress toward improving the effectiveness and performance of intrusion detection systems [5–7]. However, most machine learning algorithms can only produce acceptable outcomes in datasets with limited sample sizes. When used for large-scale intrusion detection systems, these algorithms typically run into time and space complexity issues. The input data in feature space, which has large dimensionality and nonlinear properties, is the primary cause. Therefore, proposing or implementing more efficient algorithms to reduce the dimension of high-dimensional data is necessary in intrusion detection.
Deep learning has emerged as a transformative approach to anomaly detection within the context of the IoT. With the proliferation of interconnected devices and the generation of vast amounts of data, traditional rule-based methods struggle to effectively capture the intricate patterns and relationships that often characterize anomalies in IoT environments. Deep learning techniques, such as convolutional neural networks (CNNs), autoencoders, and recurrent neural networks (RNNs), offer a data-driven paradigm that learns complex feature representations from raw sensor data. By leveraging the hierarchical and abstract features learned through deep architectures, these models can discern subtle deviations from normal behavior and identify previously unseen anomalies. This ability to autonomously learn and adapt to evolving patterns means that deep learning is a powerful tool for enhancing anomaly detection accuracy and responsiveness in IoT ecosystems, ultimately contributing to improved operational efficiency, security, and reliability across a wide range of applications, from industrial automation to smart cities and healthcare [8,9].
Sparse autoencoders (SAE) have proven highly effective in anomaly detection. In the field of IoT, where data streams are often vast and include a mix of normal and anomalous patterns, SAE plays a pivotal role in learning a compact representation of the underlying data distribution. SAE captures subtle anomalies that deviate from the norm by encoding the input data into a lower-dimensional latent space while enforcing sparsity constraints on the learned features. This capability is advantageous in IoT environments where anomalies signify critical operational issues or security breaches. SAE excels in learning intricate and rare patterns, making them well-suited for detecting anomalies in IoT data, ranging from sensor readings to network traffic, ultimately enhancing system reliability, performance, and security. In [10–12], the SAE detected anomalies in IoT networks, achieving encouraging results. However, these models were validated using outdated datasets, and they need to be validated using recent datasets that represent natural IoT environments to ensure accurate output. In addition, the complexity of these models is questionable in meeting the underlying IoT environment [13].
CNN has emerged as a powerful tool for anomaly detection in the context of IoT applications. Using its ability to automatically learn hierarchical features from raw data, CNN excels at capturing spatial patterns and correlations within IoT sensor data. In anomaly detection, CNN is employed to process the multidimensional data streams generated by IoT devices, such as temperature, humidity, and motion sensors. CNN can discern deviations that signify anomalies, enabling real-time identification of unusual events or behavior by training on normal operating patterns. This capability is particularly valuable in IoT scenarios where traditional rule-based methods struggle due to the complexity and variability of data. With CNN’s capacity to extract and model intricate relationships, anomaly detection in IoT using CNN presents a promising avenue to enhance IoT systems’ reliability, security, and efficiency. The literature [14–16] proposed that CNN detects anomalies in the IoT environment. These approaches achieved encouraging results regarding Accuracy, Precision, Recall, and F1. However, the high-dimension data, detection time, and model complexity were not addressed. Researchers and developers employed SAE with CNN to classify different domains [17–19].
Intelligent environments that depend on the IoT require IDSs with a high data volume, optimal performance, and rapid response time. Consequently, current IDSs cannot fully meet the demands of IoT environments [20]. Nonetheless, designing an efficient IDS tailored for IoT devices poses a formidable challenge due to several factors. Specifically, IDS solutions within IoT ecosystems necessitate remarkable lightweight characteristics, requiring minimal storage capacity, computational resources, and optimal response time [21,22]. In addition, in the context of detection and classification tasks, it is imperative to maintain a minimal number of features for optimal efficiency [23]. Incorporating all available features in the construction of an IDS can result in the inclusion of redundant and irrelevant elements. Effective performance of IDS requires careful optimization of features [24]. In addition, numerous datasets currently in use can be outdated, potentially failing to adequately capture the evolving behavioral characteristics of contemporary cyber threats [25–27]. However, limited information exists regarding recent attacks or their associated patterns. Thus, identifying appropriate datasets for training and evaluating the detection system poses a significant challenge [20]. These approaches are not without limitations. They are often sensitive to hyperparameters, struggle with highly imbalanced data, exhibit complexity and long training times, yield low detection rates, and suffer from high false alarm rates. They face challenges in detecting novel anomaly types. Hence, This research proposes an anomaly intrusion detection system using SAE and CNN for IoT networks. It uses a sparse autoencoder as dimension reduction to perform feature learning and reduce the complexity of the data while retaining significant features. The advantage of an SAE is that it can be customized to different levels of sparsity, which enables control of the amount of compression and the level of detail in the learned representation to make the data more suitable for classification. Then, this study applies a Convolutional Neural Network as a classifier to detect anomalies optimally. The contributions of this study are as follows:
• It designs a dimension reduction model using SAE for IoT network data to reduce the high volume of data and mitigate model complexity.
• It designs an anomaly-based intrusion detection model for IoT networks using CNN called SAE-CNN utilizing the dimension reduction model in (I).
• It validates the proposed SAE-CNN model using a recent IoT dataset that represents the natural IoT environment.
• It compares the proposed SAE-CNN model performance with the state-of-the-art.
The remainder of the article is divided into the following sections. A review of recent, pertinent research initiatives is provided in Section 2. The Materials and Method are presented in Section 3. Section 4 presents the experiment’s results and the commentary, and Section 5 presents the study’s conclusion.
Effective IDS significantly increases data transfer across smart devices and communication protocols. Deep learning represents a branch of artificial intelligence wherein the learning mechanism is modeled through the interconnected structure of numerous artificial neurons. Deep learning has become more significant in the industry since researchers have concentrated on more thorough artificial intelligence approaches to anomaly detection [28]. The comprehensive review of anomaly detection of deep learning approaches conducted by Samariya et al. [29] presents a thorough analysis of invasions. The main findings of their survey report stressed the requirement for a current and valid dataset to obtain correct output results. Previously, some researchers employed KDD99 or NSL-KDD datasets to distinguish harmful behaviors. Yin et al. [30] proposed an anomaly detection model for IoT time series data combining recurrent autoencoder, CNN, and deep neural network (DNN). They utilized the Yahoo Web scope S5 dataset to evaluate their hybrid model. They improved learning predictions by using a two-stage window-based data preprocessing. This model achieved encouraging results of 99.6 accuracy and 97.98 F1. However, the complexity of this model architecture needs to be enhanced to be suitable for the IoT environment. To analyze malicious traffic at the packet level and interpret traffic attributes from raw packet data, Wang et al. [31] constructed a deep hierarchical network. They employed a CNN to extract spatial data from the raw packet and a Gated Recurrent Units (GRU) to retrieve temporal features. Their model’s detection rate was high for some attacks but low for others.
Hassan et al. [32] proposed a hybrid deep learning technique that combines a CNN and a Weight Dropped Long Short-Term Memory (WDLSTM) model to detect intrusions in large data. The best features are found using CNN, while a window-dependent long short-term memory network (WDLSTM) is utilized to prevent overfitting in neural networks. The model’s binary classification accuracy on the UNSW-NB15 dataset was 97.1%, and its multiclass classification accuracy was 98.4%. Significant advances in information and communication technology have led to changes in the overall computational environment. Hwang et al. [33] proposed a D-PACK, an anomaly detection model for IoT network traffic. This model is an unsupervised deep learning model for early network traffic anomaly detection using a CNN and an autoencoder (AE), and the study utilized the USTC-TFC2016 dataset to evaluate their model. It is important to note that D-PACK only looks at the first few bytes of the first few packets in each flow for early detection, which can be misleading. In addition, this model requires many resources and takes a long time to train and reprocess. It also only addresses a few different types of attacks. Malaiya et al. [34] proposed an anomaly detection model to detect anomalies in IoT networks. They employed a variational autoencoder (VAE) with Fully Connected Networks (FCNs) and Sequence-to-Sequence (Seq2Seq) structures. They evaluate their model using different NSL-KDD, UNSW-NB15, KYOTO-HONEYPOT, and MAWILAB. Numerous preprocessing methods, including one-hot encoding, normalization, and others, have been applied to data preparation, feature manipulation and selection, and smooth neural network training. These parameters are mostly, but not only, created to make it possible for neural networks to learn intricate properties from various packet scopes.
Mirsky et al. [35] introduced Kitsune as a plug-and-play Network Intrusion Detection System (NIDS) that autonomously learns to identify intrusions within a local network. Kitsune operates without supervision, offering an efficient online detection capability. At its core, Kitsune employs an ensemble of neural networks, termed autoencoders, which collaborate to discern between normal and abnormal network traffic patterns. This core algorithm, known as KitNET, is complemented by a feature extraction framework adept at effectively monitoring the nuances of each network channel. The evaluations confirmed that Kitsune performs similarly to traditional offline anomaly detectors, even when deployed on resource-constrained platforms like the Raspberry Pi. These results underscore Kitsune’s potential as a practical and cost-effective NIDS solution. In addition, to tackle the challenges of heterogeneity of IoT devices and the rapid growth of the volume of transmitted data, Bovenzi et al. [36] proposed unsupervised early anomaly detection using autoencoder AE. The experimental analysis used two contemporary and openly accessible IoT datasets (IoT-23 and Kitsune).
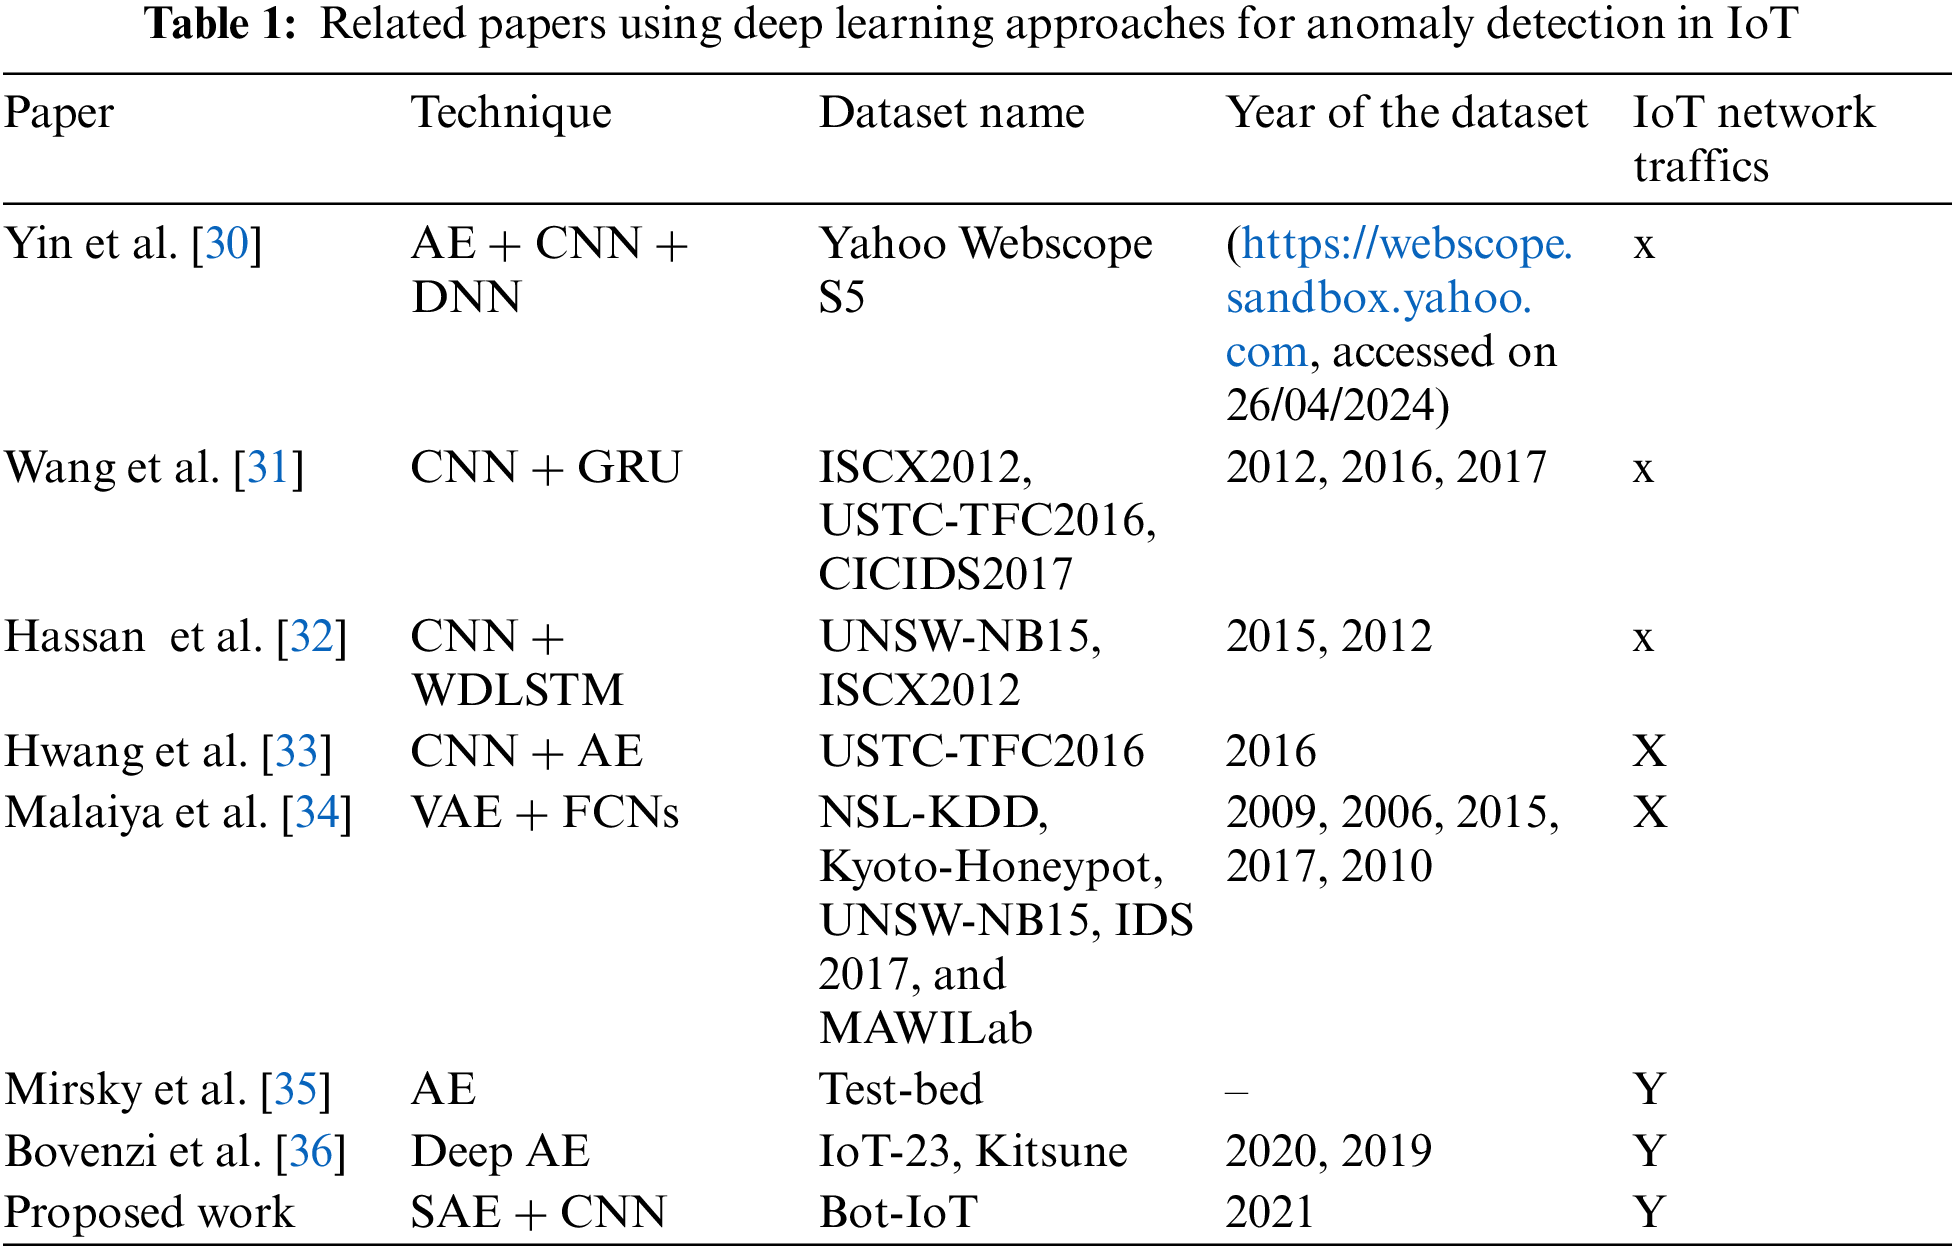
Based on the above studies, this research observes the importance and ubiquitous application of deep learning in intrusion detection. The detection rate for some studies is unsatisfactory. The complexity of these models raises questions about their suitability for meeting the demands of the IoT environment. In addition, these models encounter a significant challenge characterized by increased false alarms in complex digital environments. Several studies have assessed intrusion detection methods using outdated or small datasets such as NLS-KDD and UNSW-NB15. These datasets do not consider many recent cyberattacks, and the IoT network traffic was not deemed when developing these datasets. Table 1 provides an overview of recent studies focusing on anomaly detection to compare this research with these works across different aspects.
This section describes in detail the two phases of SAE-CNN model: dimension reduction and classification.
This section outlines the proposal framework for an anomaly intrusion detection system using sparse autoencoder and CNN. Fig. 1 illustrates the two phases of the proposed model: the dimension reduction phase using SAE and the classification phase using CNN.
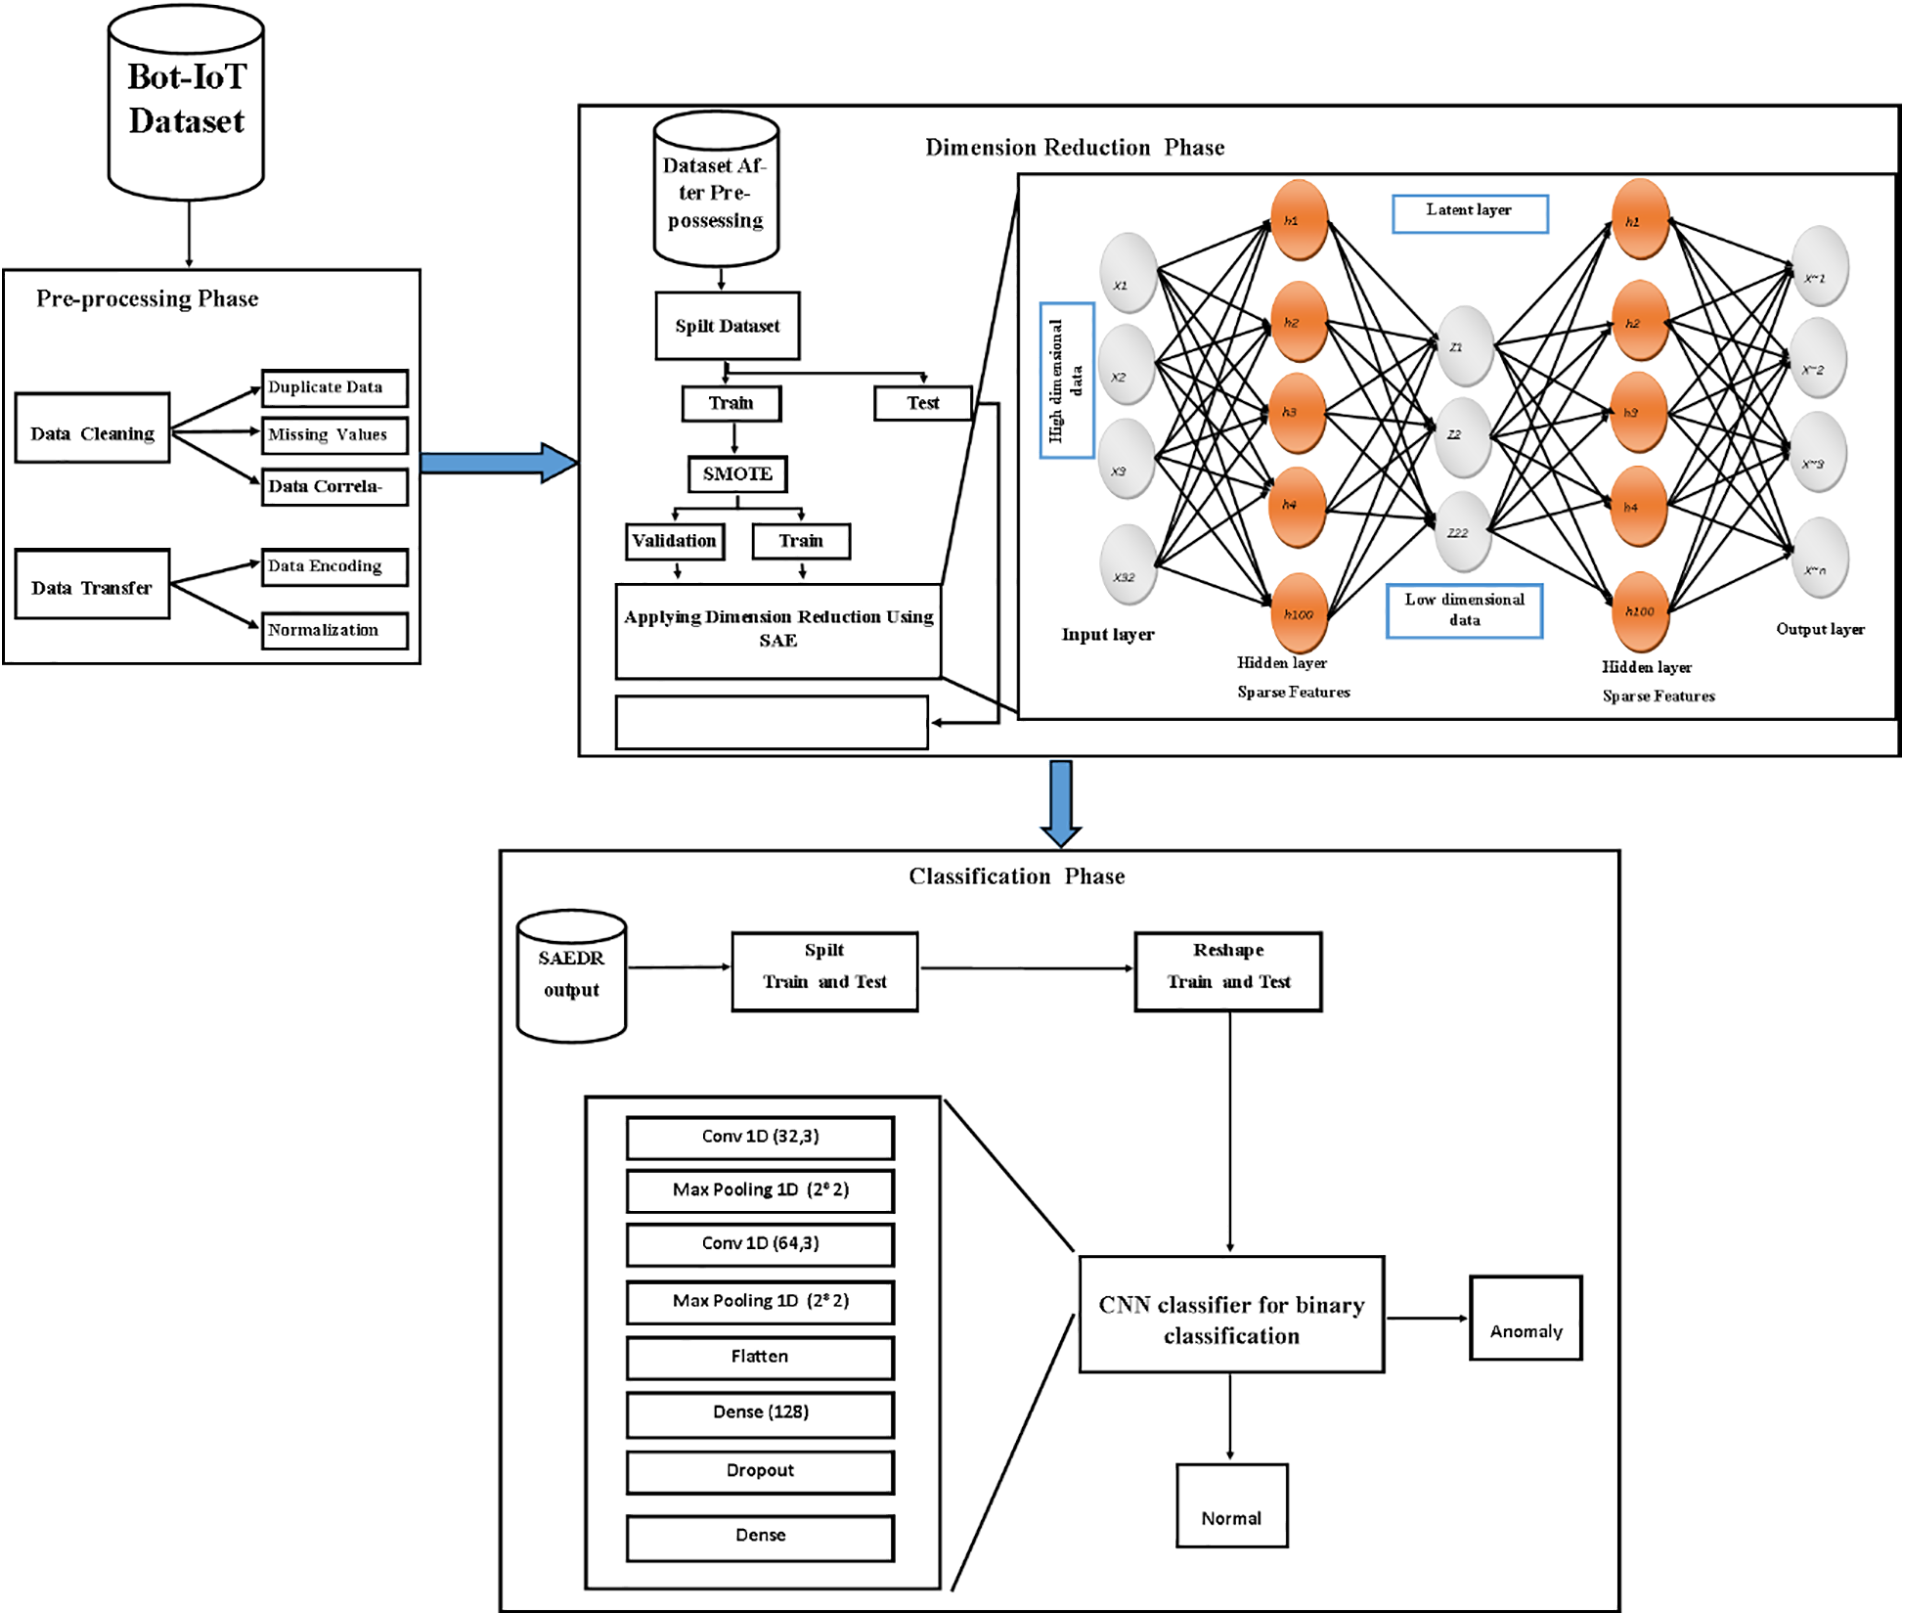
Figure 1: Proposed SAE-CNN framework
Hardware and software setup used for implementing proposed models included Kaggle standard notebook, Laptop Toshiba core i5, CPU: Intel(R) Core (TM) i5 CPU M 460 @ 2.53 GHz 2.53 GHz and RAM: 8.00 GB.
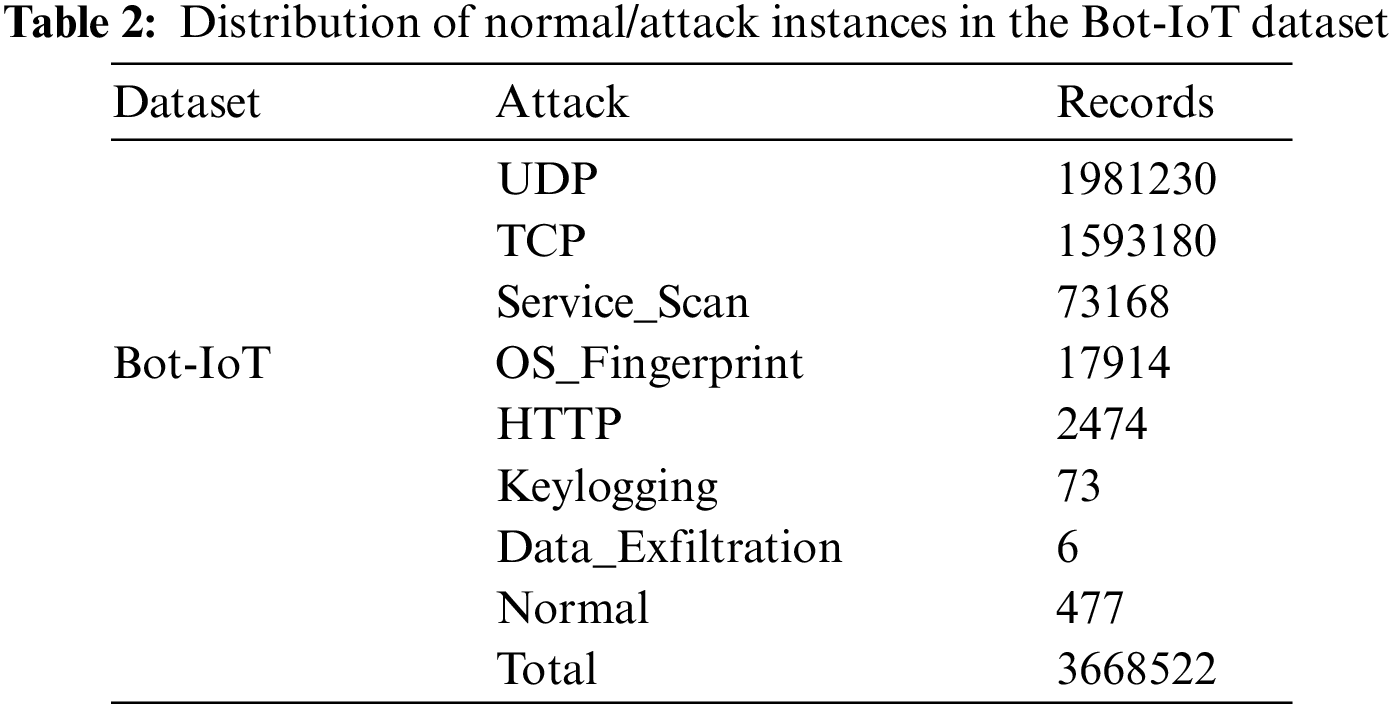
This research utilized the Bot-IoT dataset, containing realistic IoT network traffic, to evaluate the proposed schemes and models. Canberra’s UNSW generated the Bot-IoT dataset [37]. Both simulated and genuine IoT attack traffic are present in the dataset context. Six different attack types are used in five IoT devices to produce the traffic. The Bot-IoT database is created by extracting this recorded network and regular traffic [38]. The Node-Red tool was employed to stimulate the heterogeneous network profiles in Bot-IoT, which contains sufficient records for them [39]. This dataset can be used with various IoT systems because it employs the lightweight MQTT protocol. In order to generate appropriate IoT traffic [40], the whole dataset has 72 million records and includes both legitimate traffic and several types of attack traffic, including DoS, DDoS, OS, data exfiltration, and service scan. Table 2 shows the statistical distribution and a description of the dataset. The 74 different files that make up the CSV version of the Bot-IoT contain 46 features per row. The study removed 5% of the primary dataset to facilitate the computer processing of the datasets. This 5% dataset is divided into 4 CSV files, containing 3,668,045 attacks and 477 normal records [37]. This research utilizes the 5% dataset used in similar studies [41,42]. Table 2 shows the distribution of attacks and normal records in the Bot-IoT dataset.
The preprocessing phase is significant for preparing data for deep learning models. Several steps in the preprocessing phase were conducted to prepare the Bot-IoT dataset for this model, which is critical for the model’s performance. Bot-IoT contains 46 features, and duplicate features, missing values, and empty columns were checked. In addition, the data type was converted into an integer value, and the object was encoded to a categorical value using a label encoder to ensure that all values were numeric. Then, the correlation matrix was employed to find the correlation between the columns and the attack column. Columns were sorted based on the correlation they have with the attack column. Only the most correlated columns were kept, and those with less than 1% or 0.01% correlation were removed. After implementing the Correlation matrix, 33 features remained. The correlation before and after applying the correlation matrix is shown in Figs. 2 and 3.
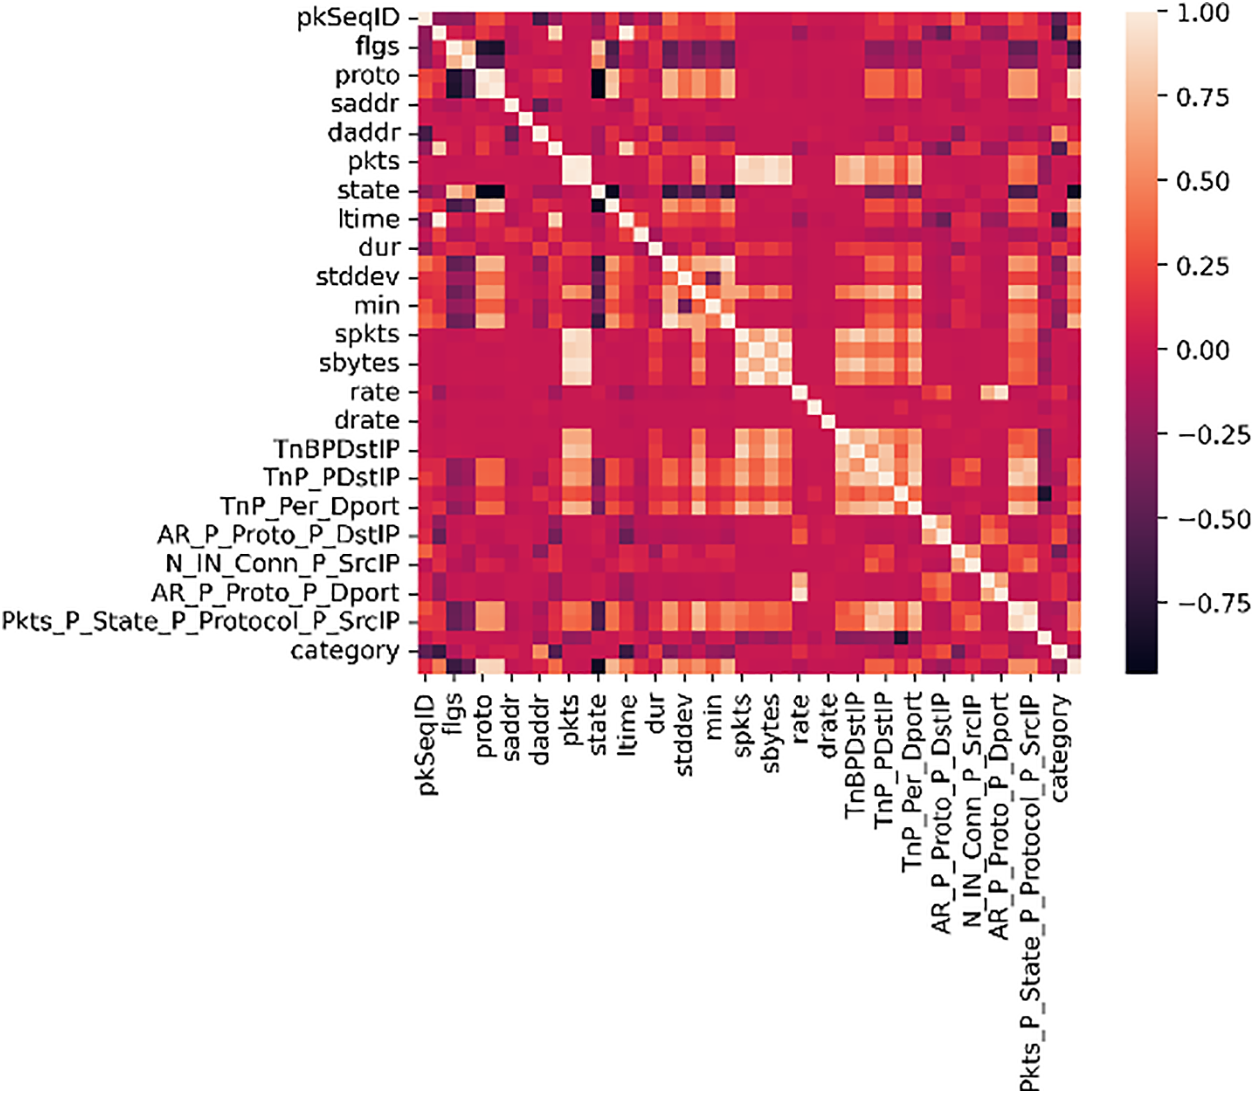
Figure 2: The correlation before applying the correlation matrix
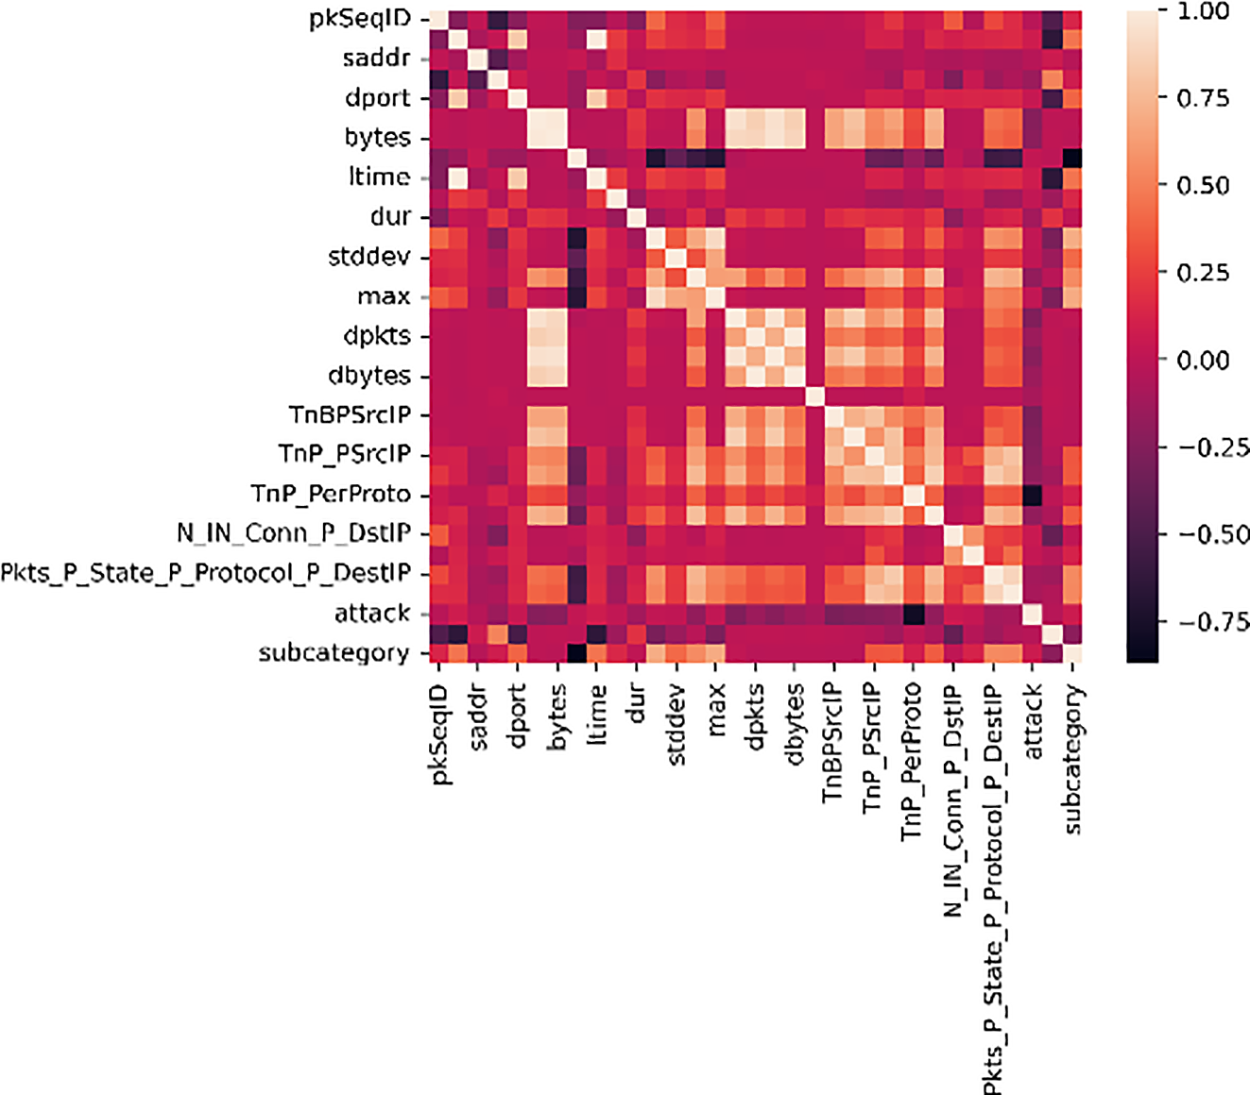
Figure 3: The correlation after applying the correlation matrix
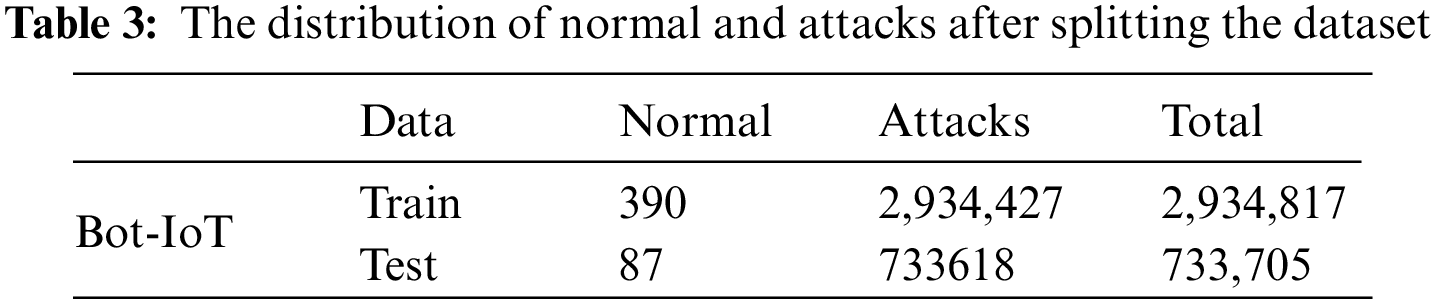
The suggested system employed 80% of the whole dataset as training data, and 20% of the dataset was kept for testing to assess the effectiveness of the sparse autoencoder. The dataset and distribution of assaults and normal upon splitting are presented in Table 3.
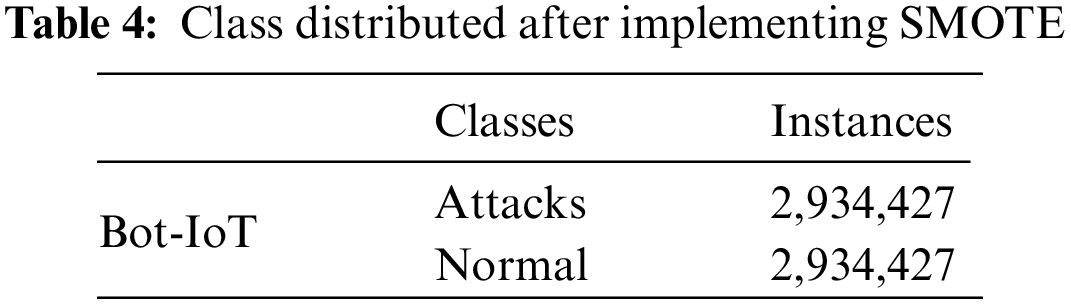
When the class distribution in a learning dataset is imbalanced, machine learning algorithms can encounter difficulties. To address this issue, a common approach in imbalanced data learning involves under-sampling the majority class as a conventional operational strategy. Alternatively, a combination of oversampling techniques and under-sampling can be employed to achieve balance in the datasets [43,44]. The Synthetic Minority Over-sampling Technique (SMOTE) was exclusively employed to balance the training data. Table 1 indicates that the normal class has 390 instances, while the attack class has 2,934,427 instances. Methods such as SMOTE, among others, are frequently employed to address class imbalance concerns, enhancing classifier performance. Considering the binary classification in this study, the balancing procedure is applied to ensure an equitable distribution of samples across each class in the preprocessed dataset. The artificially balanced dataset is used as a training set for neural networks. The term BD stands for (
In order to reduce the impact of dimensionality and increase the model’s accuracy, Sinaga et al. [45] emphasized that data normalization is a crucial preprocessing step. StandardScaler is a popular normalization technique that scales input characteristics to have a mean of 0 and a standard deviation of 1, which aids in removing biases brought on by various measurement scales or units, as shown in Eq. (1). For numerical properties, the deviation from the mean and standard deviation of the feature is employed to normalize each value over the range [0, 1]. The effect of dimensionality can be lessened by standardizing the data in this manner, making it possible to analyze the data in a way that is more accurate and robust [46].
where X is the network traffic feature vector,
Sparse autoencoders offer a distinct advantage over other types of autoencoders by promoting efficient and meaningful feature learning through a sparsity constraint, resulting in reduced overfitting, improved interpretability, robustness to noise, hierarchical feature representations, and transferability, making them particularly well-suited for tasks requiring compact, informative, and generalizable data representations. Olshausen et al. [47] initially introduced the concept of sparse encoding to replicate the computational learning process of receptive fields in basic cells within the primary visual cortex of mammals. However, autoencoders encounter an inherent issue where input data is duplicated and transferred to the output layer. This results in perfect recovery of the original input data yet fail to derive any significant, meaningful features throughout the autoencoder’s operation.
Hence, Bengio et al. [48] incorporated the concept of sparse encoding into the autoencoder architecture. They introduced a penalty term for sparsity in the hidden layer, aiming to enable the autoencoder to capture more compact and effective low-dimensional data features while adhering to sparsity constraints, enhancing its ability to represent the input data more effectively. The average activation of the neurons in the hidden layer is assumed to be equal to:
where n is the number of neurons, N is the total number of data points, j is a specific neuron, x is the input data, and i is the index for data points.
This study used the ReLU function (Eq. (3)) on the autoencoder’s hidden layer and the decoder layer’s activation function.
Kullback-Leibler (KL) divergence is constructed in Eq. (4) to calculate the sparsity penalty of the model.
Currently, the error function of the sparse autoencoder comprises two components: the first term denotes the mean square error, while the second term represents the regularization term, as determined in Eq. (5):
In Eq. (6), m is the number of hidden units, and
Where
By adding sparseness limits, SAE can limit how much each neuron node is activated. This increases the robustness and reduces the impact of interfering elements, such as noise, on the defect features recovered from the original input data. Non-negative weights constraint is added to the network to remove redundant features in this model. The Sparse Autoencoder (SAE) comprises a solitary, hidden layer that can be utilized on various IoT devices, regardless of their limitations or resource constraints.
3.9 Convolutional Neural Network CNN
Compared to Conventional neural networks, CNNs are built differently. The neurons in each layer of a conventional neural network are all connected to the neurons in the layer above them. In contrast, each layer of a CNN is only connected to a small portion of the neurons, as opposed to the neurons being completely associated with the previous layer. Three layers make up a fundamental CNN structure: convolution, pooling, and a fully linked layer [49]. In the convolutional layer, a filter or kernel processes the input image to provide a conclusion that is an array of integers. A single value is generated by multiplying the kernel over a portion of the input. The entire image is passed through the filter, producing several values representing the input data’s feature map.
Different feature maps are produced using kernels representing different aspects of the input tensors. The following equation gives the mathematical explanation of the convolution layer:
At layer (i), (Wi) is the weight vector of the convolution filter, (bi) is the bias vector, and (f) is the activation function. The feature map at layer (i) is represented by (Mi), with (M0) being the input layer (X).
A typical nonlinear function utilized in CNN is the Rectified Linear Unit (ReLU) and (sigmoid) activation functions [50]. This study used sigmoid as an activation function in the last Denes layer. Since CNN uses the same weight and bias vector as a traditional neural network, its potential can be attributed to using fewer parameters. In addition, it does not necessitate manually creating feature extraction, unlike conventional machine learning classifiers. The second layer, known as the pooling layer, involves a down-sampling process that seeks to reduce the dimensionality of the feature map.
This study employed four metrics: Accuracy, Precision, Recall, and F1-score (F1), to assess the effectiveness of the proposed method. The F1-score is the harmonic mean of the accuracy and recall scores. Accuracy indicates the proportion of samples correctly classified, Precision is the proportion of malicious samples correctly identified among all malicious samples, and Recall is the proportion of malicious samples accurately classified among all malicious samples. Higher values for Precision, Recall, and F1-score indicate superior model performance, and their formulations are as follows:
where TP (True Positive) is the number of accurately classified positive class samples, FP (False Positive) is the misclassified negative class samples as positive, TN (True Negative) is the number of correctly classified negative class samples, and FN (False Negative) is the misclassified positive class samples as negative.
In addition, the experimental findings of this research are measured using metrics based on the confusion matrix. Table 5 displays the definition of the confusion matrix.
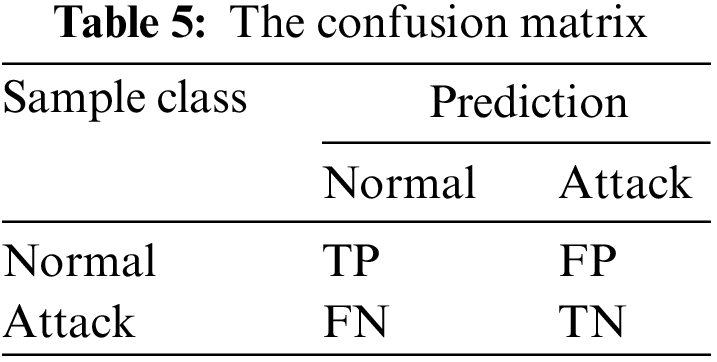
Where TP (True Positive) is the number of normally identified records that were correctly identified, TN (True Negative) is the number of attacks that were correctly identified, FP (False Positive) is the number of normally identified records that were incorrectly identified, and FN (False Negative) is the number of attacks that were incorrectly identified.
This section discusses the results of the two phases of dimension reduction and classification and compares the proposed study to the methods in the literature.
Although no fixed architecture exists for a sparse autoencoder, extensive experiments were conducted to identify the most efficient architecture for dimension reduction while adhering to IoT resource constraints. If the number of hidden layers is too large or the number of neurons in each layer is excessive, it can lead to a complex training process with increased training time and resource consumption. This study experimented with different architectures, including 2, 3, and 4 layers, different regularizers (L1 and L2), varying sparsity levels (0.2, 0.4, and 0.5), and different learning rates (0.01 and 0.001). Ultimately, it selected a sparse autoencoder with one hidden layer containing 100 neurons and matched hyperparameters, as shown in Fig. 1. In addition, the hyperparameters have a critical impact on the SAE performance. In training a Sparse Autoencoder (SAE), key parameters include the number of epochs (training iterations over the dataset), batch size (number of examples processed in each training iteration), sparse parameter (target sparsity level in hidden layer activations), optimizer (algorithm for updating model parameters), sparsity (encouragement of zero or near-zero activations), learning rate (step size in parameter updates), and loss function (quantification of model prediction error). These parameters collectively govern the model’s learning dynamics, regularization, and convergence, impacting its ability to learn meaningful representations from the data. Table 6 shows the hyperparameters of the used SAE.
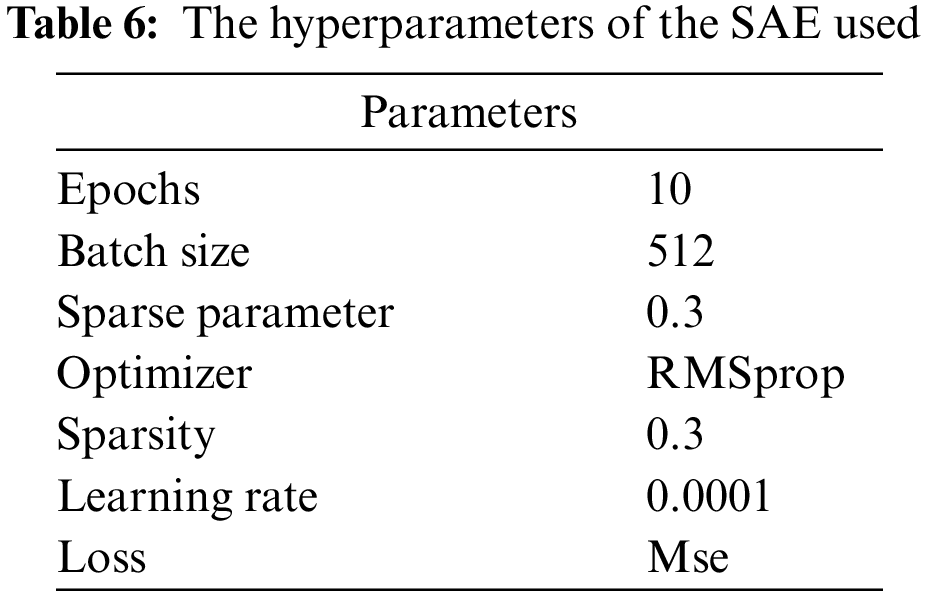
A good sparse parameter is determined to be 0.05, based on extensive studies conducted by Bengio [51]. Various past researchers have also utilized this metric. Yan et al. [10] applied four hidden layers with a sparse parameter of 0.04. However, given that the sparse parameter is connected to the number of bottleneck dimensions, this parameter cannot be relevant to the proposed model. Table 6 indicates that the sparse parameter in the case is 0.03. Choosing the suitable optimizer for the autoencoder will enhance the model validation loss and overall performance. The RMSprop optimizer was employed in the proposed approach for iterative training of sparse parameters through backpropagation to identify the most favorable parameter values that minimize the loss function. Fig. 4 illustrates the loss of both training and validation data throughout the training process. It shows that there is no indication of overfitting, as the loss curves for both datasets converge smoothly without significant divergence. In addition, the model performance, as indicated by the loss curves, remains consistent and shows no signs of deteriorating on either the training or validation dataset, indicating robust learning without overfitting.
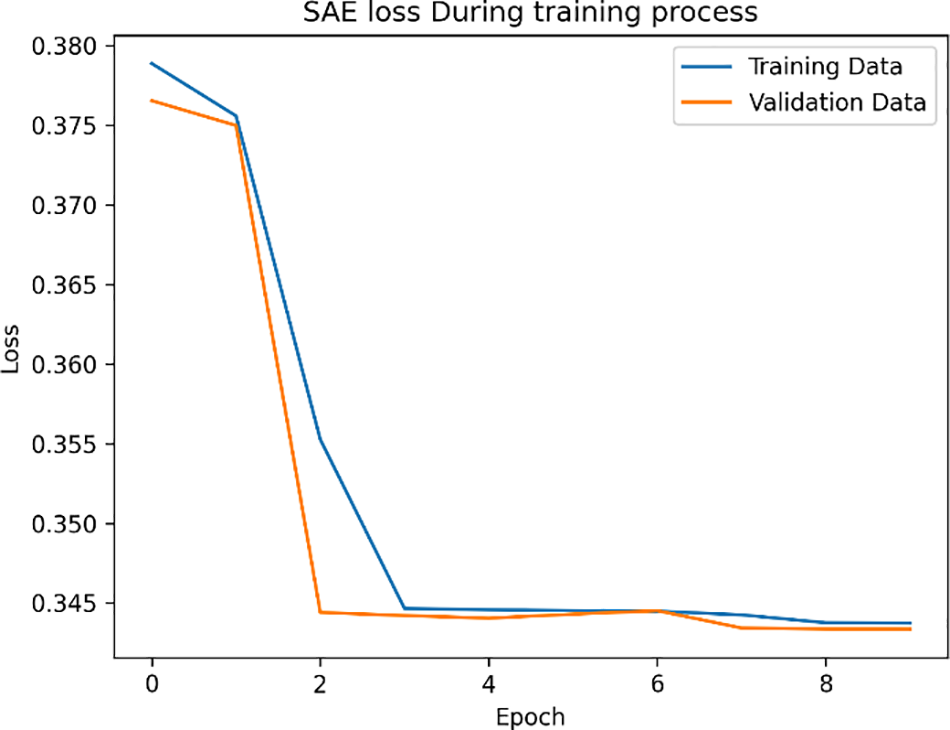
Figure 4: The loss of the SAE during training
Fig. 5 shows the reconstruction error of the whole test dataset, which is not observed in the training phase. It indicates that the model can successfully separate the anomaly instances from the normal ones based on a threshold. The scatter plot visually captures the reconstruction errors for each data point, utilizing distinct markers to differentiate between the two classes. Points positioned above the threshold are categorized as anomalies due to higher reconstruction errors, while those below are classified as normal.
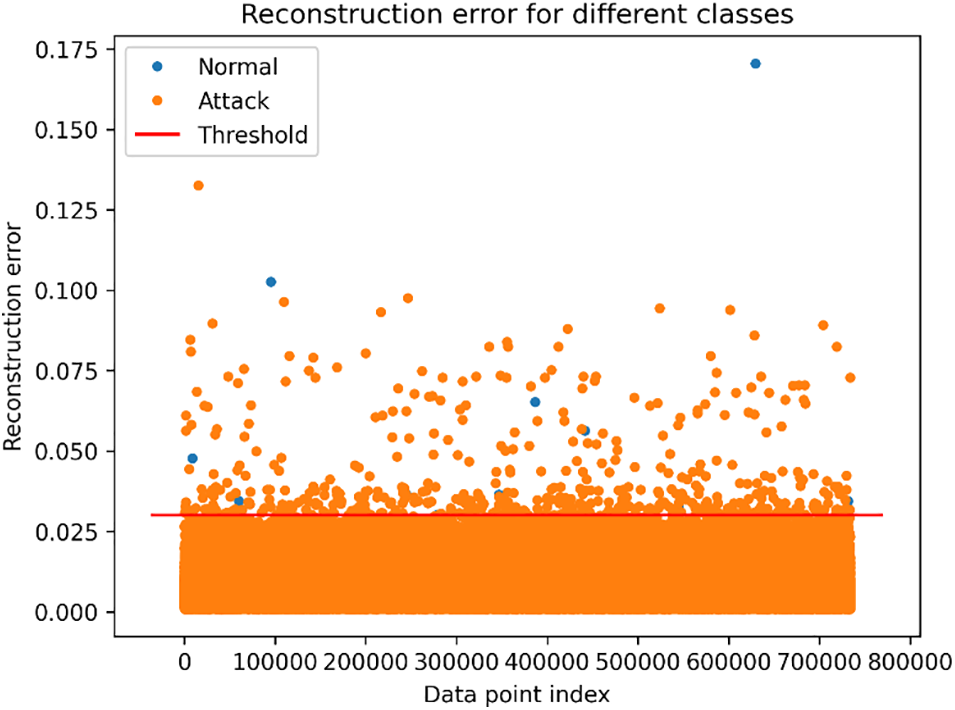
Figure 5: Reconstruction error with a threshold
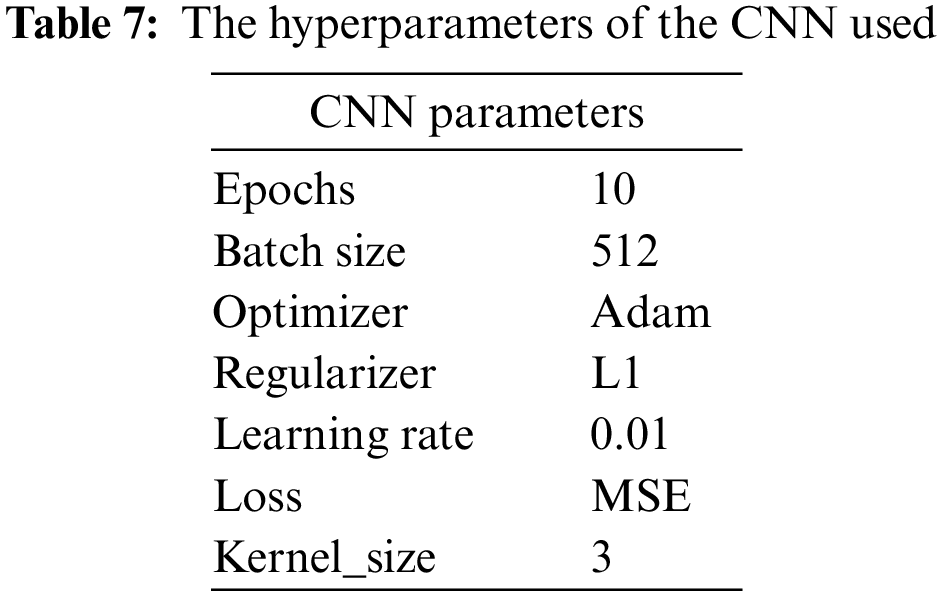
There is no fixed CNN architecture, which should be built based on the networks and data. The parameters of the CNN must be chosen carefully to maintain the model’s complexity, training time, and efficiency. Unlike the studies proposed in [52,53], this research conducted extensive experiments to set up the architecture and parameters for the proposed model and the best architecture fit, as shown in Fig. 1. Table 7 lists the CNN model parameters. In training a CNN, key hyperparameters include the number of epochs (training iterations over the dataset), batch size (number of examples processed in each training iteration), optimizer (algorithm for updating model parameters), regularizer (technique to prevent overfitting), kernel size (dimensions of convolutional filters), learning rate (step size in parameter updates), and loss function (quantification of prediction error). These parameters collectively govern the model’s learning dynamics, regularization, and convergence, impacting its ability to extract features and make accurate predictions from the input data. Efficiently tuning and understanding these hyperparameters are crucial for training an effective CNN model.
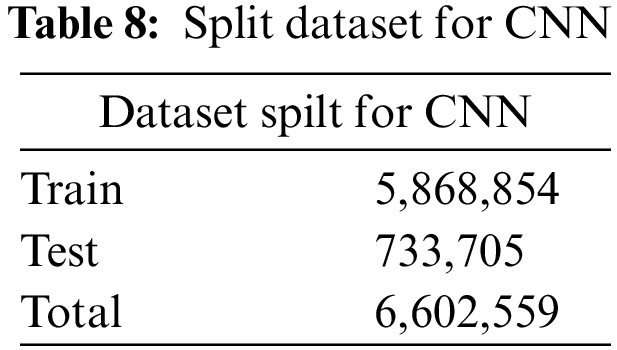
The dimension reduction phase output is utilized as input in the classification phase, as shown in Table 8. The training and testing data were reshaped into (32, 3, 1) to make it suitable for the CNN process to prepare the data for CNN.
Figs. 6 and 7 indicate that the performance of the proposed model during the training phase is smoother, and there is no overfitting between the training and validation data. In addition, the model’s training accuracy is performed efficiently.
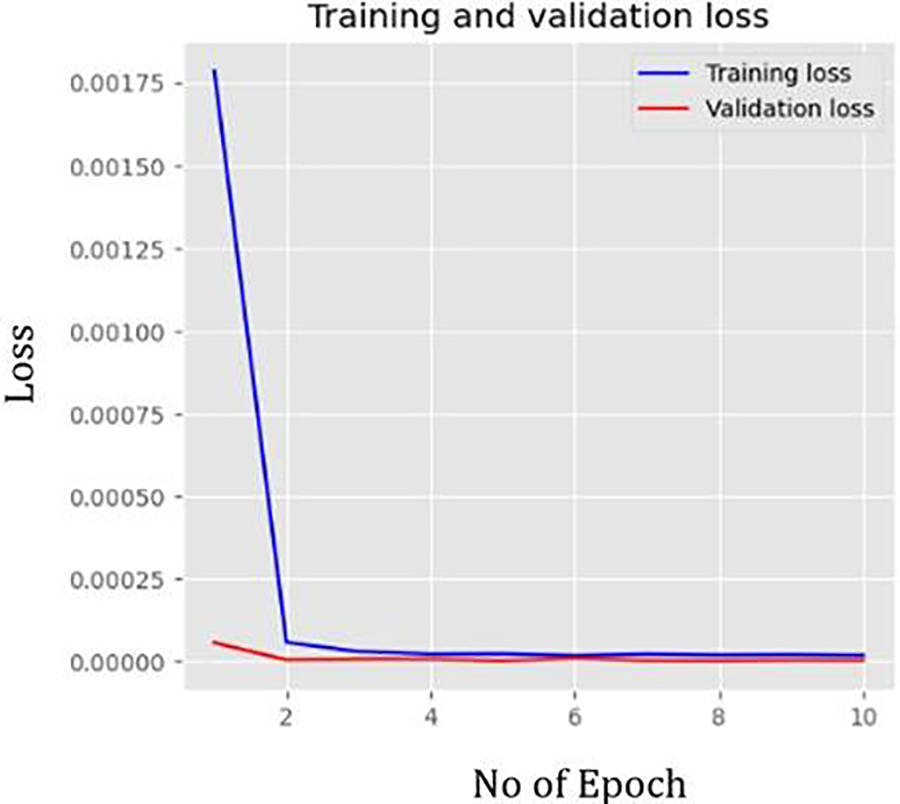
Figure 6: The loss of the SAE-CNN during training
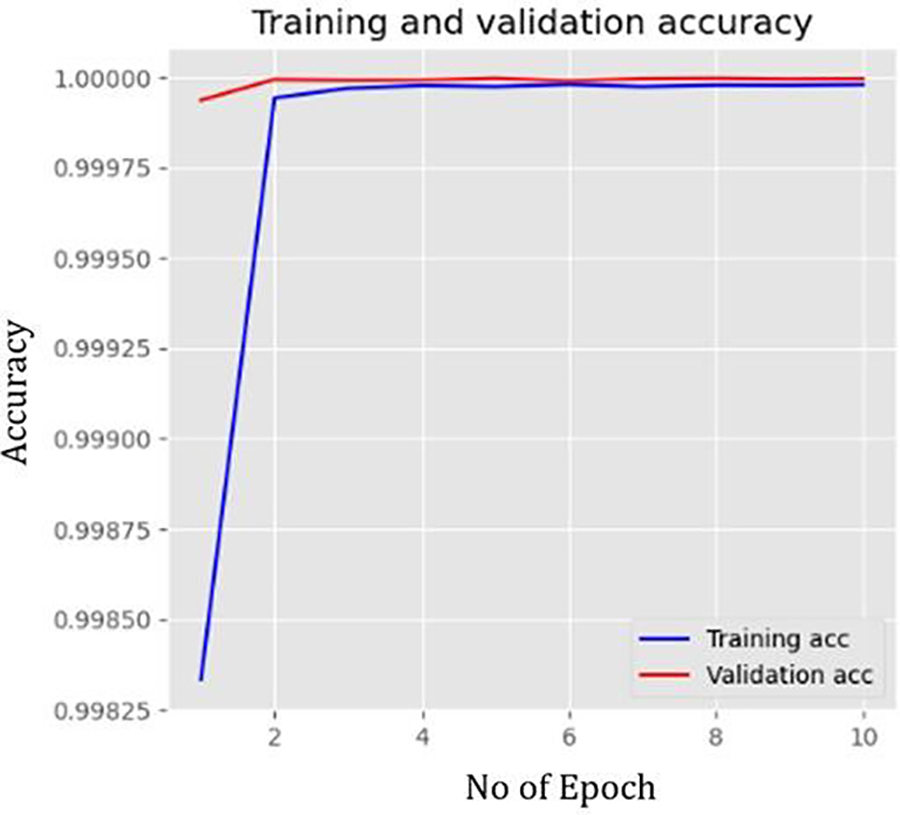
Figure 7: The accuracy of the SAE-CNN during training
The proposed SAE-CNN effectiveness is evaluated using Receiver Operating Characteristic (ROC) and Area Under the Curve (AUC) assessments. AUC is utilized as a benchmark for unsupervised outlier identification due to its interpretability. ROC-based evaluation is employed as it is insensitive to class distribution, allowing for a fair comparison of different techniques across various thresholds. This approach enables the identification of the SAE-CNN that performs better than others at different decision thresholds. The tradeoff between the true positive rate (TPR) and the false positive rate (FPR) is evaluated using ROC curves. The ROC curve provides a graphical representation of the model’s classification performance. The area under the ROC curve, the AUC, summarizes the model’s overall performance. The AUC ROC curve illustrates the relationship between TPR and FPR. In addition, the Area Under the Receiver Operating Characteristic (AUROC) curve and the Mean Precision-Recall (MPR) are commonly used as evaluation metrics to assess the effectiveness of outlier identification systems. These metrics provide insights into the model’s performance and ability to identify the malicious correctly. The performance and efficiency of the anomaly identification system can be measured by analyzing the ROC curve and evaluating the AUC, AUROC, and MPR. These metrics aid in evaluating the model’s ability to correctly detect anomalies while minimizing the false positives rate. The most effective model should have a high AUROC, but AUROC often exposes the gap between the techniques when dealing with imbalanced datasets. The efficiency of the proposed SAE-CNN framework was evaluated using the AUC metric. The AUC is calculated by considering the areas of small geometric components under the Receiver Operating Characteristic (ROC) curve. Fig. 8 depicts the results of the AUC assessments for the suggested architecture. It indicates that the proposed SAE-CNN model outperforms existing classification models, achieving an AUC score of (AUC = 1.00).
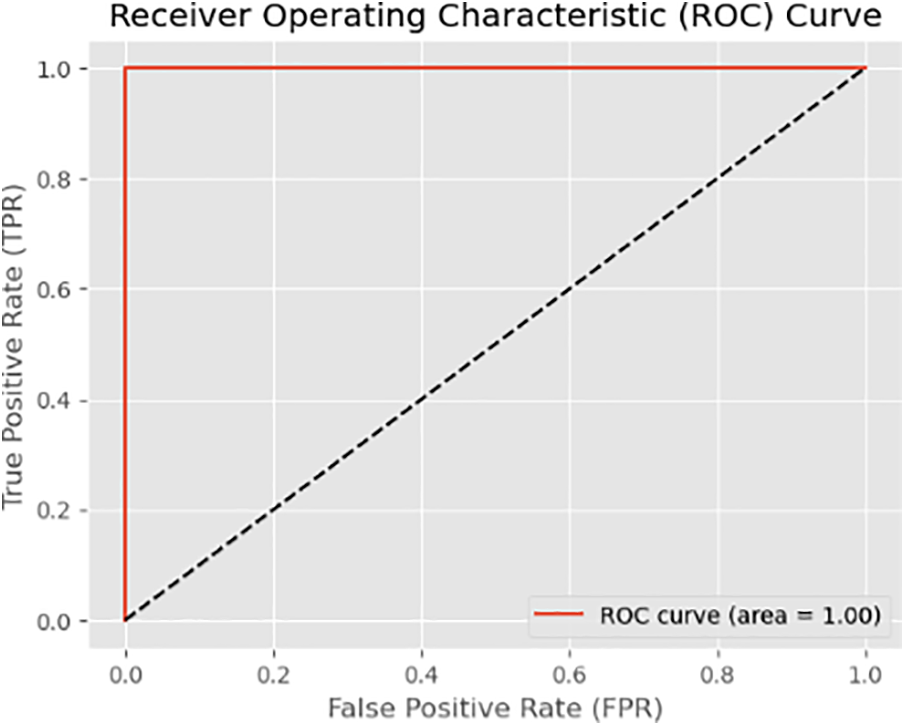
Figure 8: Receiver operating characteristic curve (ROC) of the SAE-CNN model
The classification report of the SAE-CNN model shows that the Accuracy, Precision, Recall, and F1-score achieved 99.9%, meaning that almost all examples in classes were correctly predicted. The SAE-CNN achieved 0.9992 as TPR and 0.0003 as FPR. The SAE-CNN achieved a significant result in detection and prediction, making it suitable for the IoT environment compared to the state-of-the-art. One of the strengths of the SAE-CNN model is that it can obtain the aforementioned experimental results with 4,695,097 training samples, a considerably greater number of training samples than other experimental approaches in the literature. The training time of the proposed SAE-CNN was 745.00 s, and the testing time was 68.19 s. In addition, the approach demonstrated superior performance across multiple metrics such as Accuracy, Recall, Precision, F1-score, ROC curve, FPR, and TRP compared to existing methods. Although deep learning models are often associated with high computational costs, the proposed model addresses this concern by utilizing only one SAE layer, a few CNN layers, and meticulously tuned hyperparameters. In addition, the reduced number of iterations in the proposed model significantly decreases training time while maintaining high performance. This streamlined architecture effectively minimizes complexity without compromising performance.
Compared to the work in the literature, the proposed SAE-CNN model consists of a one-layer SAE as a dimension reduction and the simple architecture of CNN, making the SAE-CNN less complex and less resource-consuming even with large amounts of data. In addition, the proposed model performs better than the existing models, including SAE + ANN, CNN + SMT + AE, SSAE + TCN, SSAE, and SAE. The proposed SAE-CNN model achieves the highest Accuracy, Precision, Recall, and F1-score among all compared algorithms, with accuracy and precision of 99.9%, recall of 100%, and an F1-score of 99.9%. This indicates the proposed SAE-CNN model’s ability to classify instances and minimize false positives and negatives accurately. In contrast, while some existing algorithms, such as CNN + SMT + AE and SSAE + TCN, demonstrate high accuracy and precision, they fall short in recall and F1-score, suggesting potential limitations in identifying all relevant instances and achieving a balance between precision and recall. In addition, algorithms such as SSAE and SAE exhibit comparatively lower accuracy and precision, further emphasizing the superiority of the proposed SAE-CNN model in classification tasks.
It is essential to acknowledge the limitations of existing algorithms. For instance, SSAE + TCN and SSAE achieve relatively lower accuracy and precision than the proposed model, indicating potential challenges in accurately classifying instances. Similarly, SSAE lacks recall and F1-score metrics, limiting its ability to comprehensively evaluate its performance. In addition, despite SAE achieving high accuracy and precision, its lack of recall metric hinders a complete assessment of its performance. The proposed SAE-CNN model outperforms existing models across multiple performance metrics, highlighting its effectiveness in classification tasks. However, it is crucial to consider the limitations of existing models, such as challenges in achieving a balance between precision and recall and the absence of specific evaluation metrics, when comparing them with the proposed SAE-CNN model. Table 9 and Fig. 9 compare the SAE-CNN model and other models in the literature.
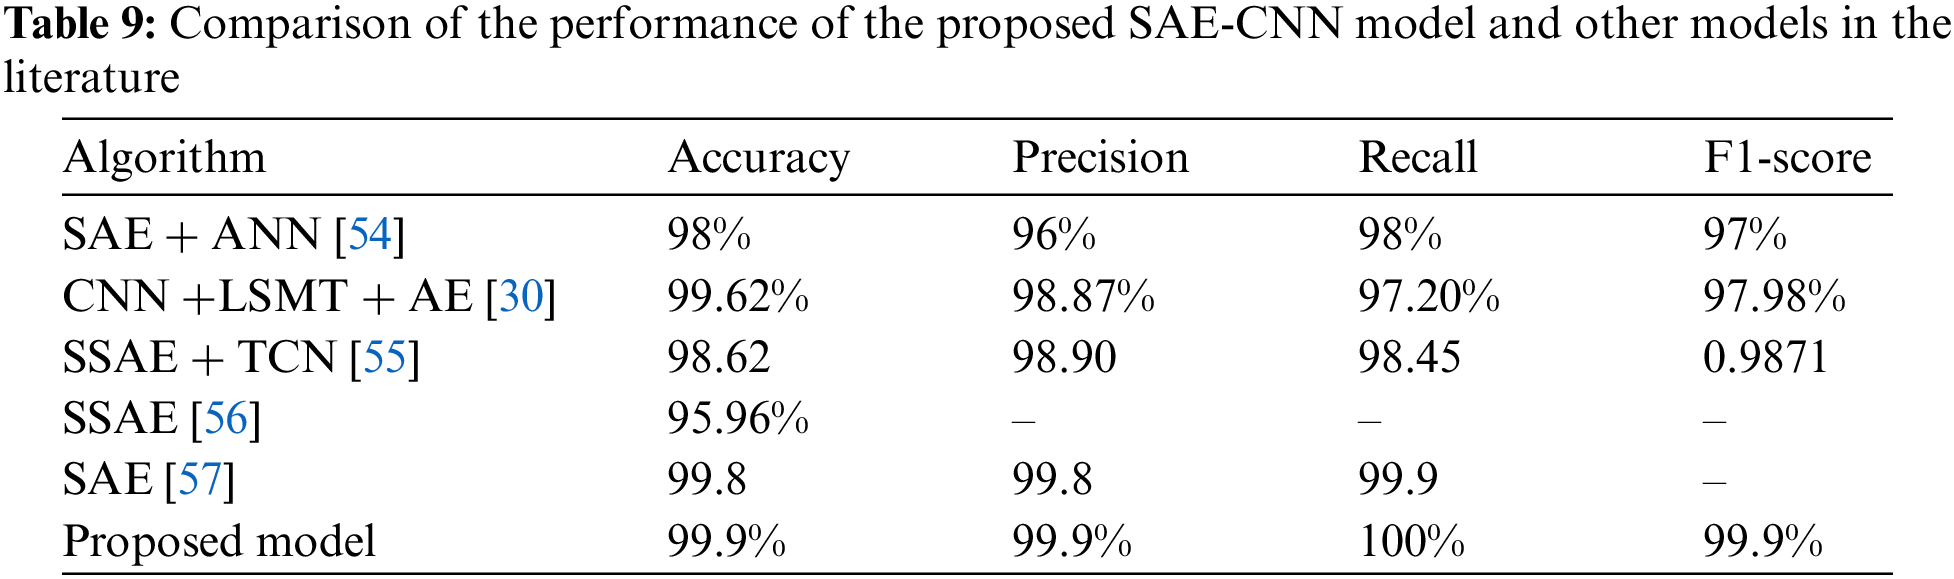
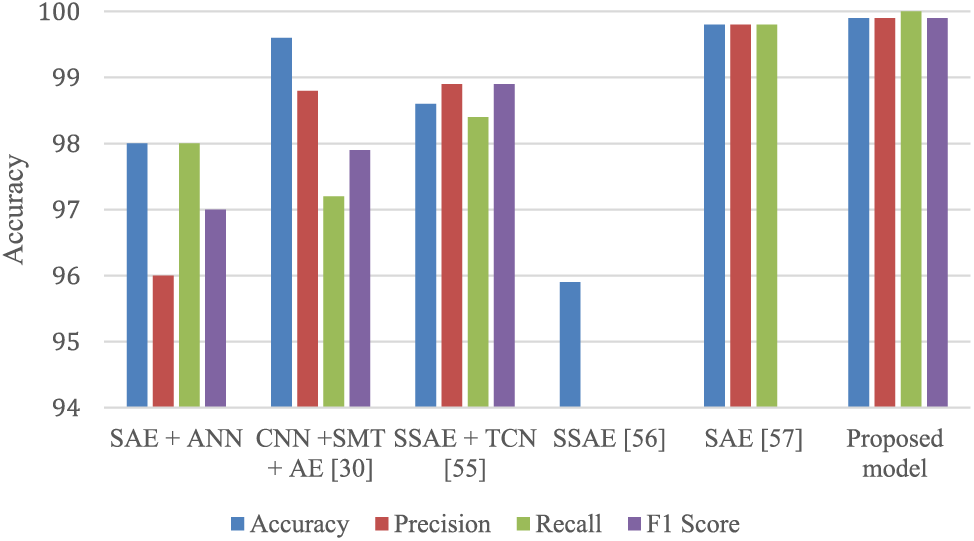
Figure 9: Comparison of the performance between the proposed SAE-CNN model and other models in the literature
This research proposes an efficient anomaly traffic detection model, an SAE-CNN model, to enhance IoT security based on realistic IoT network traffic utilizing the capabilities of SAE and CNN. SAE effectively reduces the high dimensionality of data due to its unique ability to learn compact and meaningful representations from complex and large-scale datasets. Given their capacity to autonomously identify key features within input data and their proficiency in conducting accelerated computations, CNN offers a compelling anomaly detection and classification option. This study aims to mitigate the high dimension of the vast amount of data generated from IoT devices and achieve efficient classification between normal and malicious IoT networks’ traffic while meeting the underlying characteristics of IoT characteristics. This study used the Bot-IoT dataset, a recent dataset containing a wide variety of modern attacks and reflecting real IoT network traffic. The proposed SAE-CNN model is compared to several deep learning models for network attack detection systems. The proposed SAE-CNN model reached and exceeded the studies in the literature by achieving 99.9% accuracy, 99.9% precision, 100% recall, and 99.9% F1-score. It detected attacks efficiently with 0.9992% TPR and 0.0003 FPR. Hence, this research shows that deep learning techniques are viable for cybersecurity in the IoT environment. Future work will focus on enhancing the adaptivity of this model to detect attacks over time efficiently. In addition, it intends to evaluate the performance of the proposed model using alternative datasets to ensure its robustness and generalization. It will address considerations for resource efficiency by optimizing model complexity and reducing training time. This includes refining the architecture and hyperparameters to improve efficiency without sacrificing performance.
Acknowledgement: The authors extend their sincere gratitude to the reviewers for their valuable suggestions, which have significantly enhanced the quality of this paper. We also express our heartfelt thanks to the editors for their patience, amiable guidance, and diligent efforts in refining the manuscript.
Funding Statement: Researchers Supporting Project Number (RSP2024R206), King Saud University, Riyadh, Saudi Arabia.
Author Contributions: The authors confirm contribution to the paper as follows: study conception and design: Muaadh A. Alsoufi, Maheyzah Md Siraj, Fuad A. Ghaleb; data collection: Muaadh A. Alsoufi, Muna Al-Razgan, Mahfoudh Saeed Al-Asaly, Taha Alfakih; analysis and interpretation of results: Muaadh A. Alsoufi, Faisal Saeed, Maheyzah Md Siraj; draft manuscript preparation: Muaadh A. Alsoufi, Faisal Saeed, Maheyzah Md Siraj. All authors reviewed the results and approved the final version of the manuscript.
Availability of Data and Materials: All data presented in this paper can reasonably be obtained from the relevant references or by contacting the corresponding author of this paper. https://research.unsw.edu.au/projects/bot-iot-dataset (accessed on 26/04/2024).
Conflicts of Interest: The authors declare that they have no conflicts of interest to report regarding the present study.
References
1. Ferrag MA, Maglaras L, Moschoyiannis S, Janicke H. Deep learning for cyber security intrusion detection: approaches, datasets, and comparative study. J Inf Secur Appl. 2020;50:102419. doi:10.1016/j.jisa.2019.102419. [Google Scholar] [CrossRef]
2. El Kafhali S, El Mir I. Exploring the effectiveness of cloud, internet of things and fog computing for healthcare monitoring systems. In: Computational intelligence for medical Internet of Things (MIoT) applications. Elsevier; 2023. p. 77–91. doi:10.1016/B978-0-323-99421-7.00008-8. [Google Scholar] [CrossRef]
3. Albreem MA, Sheikh AM, Alsharif MH, Jusoh M, Yasin MNM. Green Internet of Things (GIoTapplications, practices, awareness, and challenges. IEEE Access. 2021;9:38833–58. [Google Scholar]
4. Adeniyi O, Sadiq AS, Pillai P, Aljaidi M, Kaiwartya O. Securing mobile edge computing using hybrid deep learning method. Computers. 2024;13(1):25. [Google Scholar]
5. Kumar G, Kumar K, Sachdeva M. The use of artificial intelligence based techniques for intrusion detection: a review. Artif Intell Rev. 2010;34:369–87. [Google Scholar]
6. Alsoufi MA, Razak S, Siraj MM, Nafea I, Ghaleb FA, Saeed F, et al. Anomaly-based intrusion detection systems in iot using deep learning: a systematic literature review. Appl Sci. 2021;11(18):8383. [Google Scholar]
7. Qiu J, Shi H, Hu Y, Yu Z. Enhancing anomaly detection models for industrial applications through SVM-based false positive classification. Appl Sci. 2023;13(23):12655. doi:10.3390/app132312655. [Google Scholar] [CrossRef]
8. Aravamudhan P. A novel adaptive network intrusion detection system for internet of things. PLoS One. 2023;18(4):e0283725. doi:10.1371/journal.pone.0283725. [Google Scholar] [PubMed] [CrossRef]
9. Alsoufi MA, Razak S, Siraj MM, Al-rimy BA, Ali A, Nasser M, et al. A review of anomaly intrusion detection systems in IoT using deep learning techniques. Adv Data Sci Adapt Anal. 2021;13(03n04):2143001. doi:10.1142/S2424922X21430014. [Google Scholar] [CrossRef]
10. Yan B, Han G. Effective feature extraction via stacked sparse autoencoder to improve intrusion detection system. IEEE Access. 2018;6:41238–48. doi:10.1109/ACCESS.2018.2858277. [Google Scholar] [CrossRef]
11. Rahman Shahid M, Blanc G, Zhang Z, Debar H. Anomalous communications detection in IoT networks using sparse autoencoders. arXiv preprint arXiv:1912.11831. 2019. [Google Scholar]
12. Cui J, Zong L, Xie J, Tang M. A novel multi-module integrated intrusion detection system for high-dimensional imbalanced data. Appl Intell. 2023;53(1):272–88. doi:10.1007/s10489-022-03361-2. [Google Scholar] [PubMed] [CrossRef]
13. Kimanzi R, Kimanga P, Cherori D, Gikunda PK. Deep learning algorithms used in intrusion detection systems–a review. arXiv preprint arXiv:2402.17020. 2024. [Google Scholar]
14. SUllah S, Ahmad J, Khan MA, Alkhammash EH, Hadjouni M, Ghadi YY, et al. A new intrusion detection system for the internet of things via deep convolutional neural network and feature engineering. Sensors. 2022;22(10):3607. [Google Scholar]
15. Choudhary A, Mian T, Fatima S, Panigrahi B. Nature-inspired artificial bee colony-based hyperparameter optimization of CNN for anomaly detection in induction motor. Expert Syst. 2023;e13407. doi:10.1111/exsy.13407. [Google Scholar] [CrossRef]
16. Sankaran KS, Kim BH. Deep learning based energy efficient optimal RMC-CNN model for secured data transmission and anomaly detection in industrial IOT. Sustain Energy Technol Assess. 2023;56:102983. [Google Scholar]
17. Li M, Wu H, Yang M, Huang C, Tang BH. Trend classification of InSAR displacement time series using SAE-CNN. Remote Sens. 2023;16(1):54. doi:10.3390/rs16010054. [Google Scholar] [CrossRef]
18. Zhu Y, Zi Y, Xu J. Transfer learning-based SAE-CNN for industrial data processing in multiple working conditions recognition. In: 2022 IEEE International Conference on Prognostics and Health Management (ICPHM); 2022; IEEE. p. 167–172. doi:10.1109/ICPHM53196.2022.9815720. [Google Scholar] [CrossRef]
19. Tang X, Yang J, Wan H. A hybrid SAE and CNN classifier for motor imagery EEG classification. In: Artificial intelligence and algorithms in intelligent systems; Springer; 2019. vol. 27. p. 265–78. doi:10.1007/978-3-319-91189-2_26. [Google Scholar] [CrossRef]
20. Sarwar A, Alnajim AM, Marwat SNK, Ahmed S, Alyahya S, Khan WU. Enhanced anomaly detection system for iot based on improved dynamic SBPSO. Sensors. 2022;22(13):4926. [Google Scholar] [PubMed]
21. Nie F, Liu W, Liu G, Gao B. M2VT-IDS: a multi-task multi-view learning architecture for designing IoT intrusion detection system. Internet of Things. 2024;101102. doi:10.1016/j.iot.2024.101102. [Google Scholar] [CrossRef]
22. Altulaihan E, Almaiah MA, Aljughaiman A. Anomaly detection IDS for detecting DoS attacks in IoT networks based on machine learning algorithms. Sensors. 2024;24(2):713. [Google Scholar] [PubMed]
23. Ozkan-Ozay M, Akin E, Aslan Ö., Kosunalp S, Iliev T, Stoyanov I, et al. A comprehensive survey: evaluating the efficiency of artificial intelligence and machine learning techniques on cyber security solutions. IEEE Access. 2024;12. doi:10.1109/ACCESS.2024.3355547. [Google Scholar] [CrossRef]
24. Aljehane NO, Mengash HA, Hassine SB, Alotaibi FA, Salama AS, Abdelbagi S. Optimizing intrusion detection using intelligent feature selection with machine learning model. Alex Eng J. 2024;91:39–49. [Google Scholar]
25. Guato Burgos MF, Morato J, Vizcaino Imacaña FP. A review of smart grid anomaly detection approaches pertaining to artificial intelligence. Appl Sci. 2024;14(3):1194. [Google Scholar]
26. Huang J, Yang Y. Anomaly detection in machining centers based on graph diffusion-hierarchical neighbor aggregation networks. Appl Sci. 2023;13(23):12914. [Google Scholar]
27. Sharma S, Kumar V, Dutta K. Multi-objective optimization algorithms for intrusion detection in IoT networks: a systematic review. Internet of Things Cyber-Phys Syst. 2024;4:258–67. [Google Scholar]
28. Binbusayyis A, Vaiyapuri T. Comprehensive analysis and recommendation of feature evaluation measures for intrusion detection. Heliyon. 2020;6(7). doi:10.1016/j.heliyon.2020.e04262. [Google Scholar] [PubMed] [CrossRef]
29. Samariya D, Thakkar A. A comprehensive survey of anomaly detection algorithms. Ann Data Sci. 2023;10(3):829–50. [Google Scholar]
30. Yin C, Zhang S, Wang J, Xiong NN. Anomaly detection based on convolutional recurrent autoencoder for IoT time series. IEEE Trans Syst, Man, Cybern: Syst. 2020;52:1–11. doi:10.1109/TSMC.2020.2968516. [Google Scholar] [CrossRef]
31. Wang B, Su Y, Zhang M, Nie J. A deep hierarchical network for packet-level malicious traffic detection. IEEE Access. 2020;8:201728–40. [Google Scholar]
32. Hassan MM, Gumaei A, Alsanad A, Alrubaian M, Fortino G. A hybrid deep learning model for efficient intrusion detection in big data environment. Inf Sci. 2020;513:386–96. [Google Scholar]
33. Hwang R, Peng M, Huang C, Lin P, Nguyen V. An unsupervised deep learning model for early network traffic anomaly detection. IEEE Access. 2020;8:30387–99. doi:10.1109/ACCESS.2020.2973023. [Google Scholar] [CrossRef]
34. Malaiya RK, Kwon D, Suh SC, Kim H, Kim I, Kim J. An empirical evaluation of deep learning for network anomaly detection. IEEE Access. 2019;7:140806–17. doi:10.1109/ACCESS.2019.2943249. [Google Scholar] [CrossRef]
35. Mirsky Y, Doitshman T, Elovici Y, Shabtai A. Kitsune: an ensemble of autoencoders for online network intrusion detection. arXiv preprint arXiv:1802.09089. 2018. [Google Scholar]
36. Bovenzi G, Aceto G, Ciuonzo D, Montieri A, Persico V, Pescapé A. Network anomaly detection methods in IoT environments via deep learning: a fair comparison of performance and robustness. Comput Secur. 2023;128:103167. [Google Scholar]
37. Koroniotis N, Moustafa N, Sitnikova E, Slay J. Towards developing network forensic mechanism for botnet activities in the IoT based on machine learning techniques. In: Mobile networks and management. Melbourne, Australia: Springer; 2018. p. 30–44. [Google Scholar]
38. Asadi M, Jamali MAJ, Parsa S, Majidnezhad V. Detecting botnet by using particle swarm optimization algorithm based on voting system. Future Gener Comput Syst. 2020;107:95–111. [Google Scholar]
39. Ibitoye O, Shafiq O, Matrawy A. Analyzing adversarial attacks against deep learning for intrusion detection in IoT networks. In: 2019 IEEE Global Communications Conference (GLOBECOM); 2019; IEEE. p. 1–6. doi:10.1109/GLOBECOM38437.2019.9014337. [Google Scholar] [CrossRef]
40. Koroniotis N, Moustafa N, Sitnikova E, Turnbull B. Towards the development of realistic botnet dataset in the internet of things for network forensic analytics: Bot-IoT dataset. Future Gener Comput Syst. 2019;100:779–96. [Google Scholar]
41. Baig ZA, Sanguanpong S, Firdous SN, Nguyen TG, So-In C. Averaged dependence estimators for DoS attack detection in IoT networks. Future Gener Comput Syst. 2020;102:198–209. [Google Scholar]
42. Ferrag MA, Maglaras L, Ahmim A, Derdour M, Janicke H. RDTIDS: rules and decision tree-based intrusion detection system for internet-of-things networks. Future Internet. 2020;12(3):44. [Google Scholar]
43. Popoola SI, Adebisi B, Ande R, Hammoudeh M, Anoh K, Atayero AA. smote-drnn: a deep learning algorithm for botnet detection in the internet-of-things networks. Sensors. 2021;21(9):2985. [Google Scholar] [PubMed]
44. de Vargas VW, Aranda JAS, dos Santos Costa R, da Silva Pereira PR, Victória Barbosa JL. Imbalanced data preprocessing techniques for machine learning: a systematic mapping study. Knowl Inf Syst. 2023;65(1):31–57. doi:10.1007/s10115-022-01772-8. [Google Scholar] [PubMed] [CrossRef]
45. Sinaga KP, Yang MS. Unsupervised K-means clustering algorithm. IEEE Access. 2020;8:80716–27. doi:10.1109/ACCESS.2020.2988796. [Google Scholar] [CrossRef]
46. Goldstein M, Uchida S. A comparative evaluation of unsupervised anomaly detection algorithms for multivariate data. PLoS One. 2016;11(4):e0152173. doi:10.1371/journal.pone.0152173. [Google Scholar] [PubMed] [CrossRef]
47. Olshausen BA, Field DJ. Emergence of simple-cell receptive field properties by learning a sparse code for natural images. Nature. 1996;381(6583):607–9. doi:10.1038/381607a0. [Google Scholar] [PubMed] [CrossRef]
48. Bengio Y, Lamblin P, Popovici D, Larochelle H. Greedy layer-wise training of deep networks. Adv Neural Inform Process Syst. 2006;19. [Google Scholar]
49. Vedaldi A, Lenc K. Matconvnet: convolutional neural networks for matlab. In: Proceedings of the 23rd ACM International conference on Multimedia; 2015. p. 689–92. doi:10.1145/2733373.2807412. [Google Scholar] [CrossRef]
50. Zhou D, Yan Z, Fu Y, Yao Z. A survey on network data collection. J Netw Comput Appl. 2018;116:9–23. doi:10.1016/j.jnca.2018.05.004. [Google Scholar] [CrossRef]
51. Bengio Y. Practical recommendations for gradient-based training of deep architectures. In: Neural networks: tricks of the trade. 2nd ed. Springer; 2012. p. 437–78. [Google Scholar]
52. Hairab BI, Elsayed MS, Jurcut AD, Azer MA. Anomaly detection based on CNN and regularization techniques against zero-day attacks in IoT networks. IEEE Access. 2022;10:98427–40. doi:10.1109/ACCESS.2022.3206367. [Google Scholar] [CrossRef]
53. Ullah I, Mahmoud QH. Design and development of a deep learning-based model for anomaly detection in IoT networks. IEEE Access. 2021;9:103906–26. doi:10.1109/ACCESS.2021.3094024. [Google Scholar] [CrossRef]
54. Mienye ID, Sun Y, Wang Z. Improved sparse autoencoder based artificial neural network approach for prediction of heart disease. Inform Med Unlocked. 2020;18:100307. doi:10.1016/j.imu.2020.100307. [Google Scholar] [CrossRef]
55. Yang R, He H, Xu Y, Xin B, Wang Y, Qu Y, et al. Efficient intrusion detection toward IoT networks using cloud-edge collaboration. Comput Netw. 2023;228:109724. doi:10.1016/j.comnet.2023.109724. [Google Scholar] [CrossRef]
56. Yuan Y, Jia K. A distributed anomaly detection method of operation energy consumption using smart meter data. In: 2015 International Conference on Intelligent Information Hiding and Multimedia Signal Processing (IIH-MSP); 2015; IEEE. p. 310–3. [Google Scholar]
57. Tun MT, Nyaung DE, Phyu MP. Network anomaly detection using threshold-based sparse autoencoder. In: IAIT’20: Proceedings of the 11th International Conference on Advances in Information Technology; 2020 Jul. p. 1–8. doi:10.1145/3406601.3406626. [Google Scholar] [CrossRef]
Cite This Article
 Copyright © 2024 The Author(s). Published by Tech Science Press.
This work is licensed under a Creative Commons Attribution 4.0 International License , which permits unrestricted use, distribution, and reproduction in any medium, provided the original work is properly cited.
 Downloads
 Citation Tools