
 Submit a Paper
 Propose a Special lssue
 Open Access
ARTICLE

Marine Predators Algorithm with Deep Learning-Based Leukemia Cancer Classification on Medical Images
1 Department of Computer Science & Engineering, Gandhi Institute for Technology, BPUT, Bhubaneswar, 752054, India
2 Department of Information Technology, Vardhaman College of Engineering (Autonomous), Hyderabad, 501218, Telangana, India
3 Department of Electronic & Communication Engineering, Vedang Institute of Technology, Bhubaneswar, 752010, India
4 Department of Computer Engineering, College of Computer and Information Sciences, King Saud University, Riyadh, 11543, Saudi Arabia
5 Department of Computing and Information Systems, School of Engineering and Technology, Sunway University, Jalan Universiti, Bandar Sunway, Selangor Darul Ehsan, 47500, Malaysia
6 Research Centre for Human-Machine Collaboration (HUMAC), School of Engineering and Technology, Sunway University, Jalan Universiti, Bandar Sunway, Selangor Darul Ehsan, 47500, Malaysia
7 Guizhou Key Laboratory of Intelligent Technology in Power System, College of Electrical Engineering, Guizhou University, Guiyang, 550025, China
8 Operations Research Department, Faculty of Graduate Studies for Statistical Research, Cairo University, Giza, 12613, Egypt
9 Applied Science Research Center, Applied Science Private University, Amman, 11931, Jordan
* Corresponding Author: Muhammed Basheer Jasser. Email:
(This article belongs to the Special Issue: Advances in Swarm Intelligence Algorithms)
Computer Modeling in Engineering & Sciences 2024, 141(1), 893-916. https://doi.org/10.32604/cmes.2024.051856
Received 17 March 2024; Accepted 19 June 2024; Issue published 20 August 2024
 View Full Text
 Download PDF
Abstract
In blood or bone marrow, leukemia is a form of cancer. A person with leukemia has an expansion of white blood cells (WBCs). It primarily affects children and rarely affects adults. Treatment depends on the type of leukemia and the extent to which cancer has established throughout the body. Identifying leukemia in the initial stage is vital to providing timely patient care. Medical image-analysis-related approaches grant safer, quicker, and less costly solutions while ignoring the difficulties of these invasive processes. It can be simple to generalize Computer vision (CV)-based and image-processing techniques and eradicate human error. Many researchers have implemented computer-aided diagnostic methods and machine learning (ML) for laboratory image analysis, hopefully overcoming the limitations of late leukemia detection and determining its subgroups. This study establishes a Marine Predators Algorithm with Deep Learning Leukemia Cancer Classification (MPADL-LCC) algorithm on Medical Images. The projected MPADL-LCC system uses a bilateral filtering (BF) technique to pre-process medical images. The MPADL-LCC system uses Faster SqueezeNet with Marine Predators Algorithm (MPA) as a hyperparameter optimizer for feature extraction. Lastly, the denoising autoencoder (DAE) methodology can be executed to accurately detect and classify leukemia cancer. The hyperparameter tuning process using MPA helps enhance leukemia cancer classification performance. Simulation results are compared with other recent approaches concerning various measurements and the MPADL-LCC algorithm exhibits the best results over other recent approaches.Keywords
With the clear benefits for patients and medical professionals, the importance of computer-aided diagnosis (CAD) has suddenly become obvious in modern healthcare. Also, the automatization of processes conventionally maintained by human professionals becomes increasingly important [1]. The image analysis process can be supported using networks that perform multilayer analysis of patterns, widely known as artificial intelligence (AI). Computer networks can exhibit the result with lower error bias if supported by large datasets of input data [2]. Medical imaging focused on pattern detection is usually supported by AI algorithm, and it is used as a powerful aid in the three most important steps of decision-making in the medical imaging task: recognition (assignment to the class) [3], detection (image segmentation), and result description (conversion of the results into natural language). Implementing an AI algorithm can contribute to standardizing the diagnosis process and significantly decrease the time required to diagnose pathology and describe the result [4].
Leukemia is a lethal cancer-related disease that significantly causes higher mortality rates worldwide and affects all age groups, i.e., adults and children [5]. Specifically, it is linked with White Blood Cells (WBC), which can cause damage to the blood or bone marrow and increase immature lymphocytes. The correct classification of WBC is critical to find the disease’s nature [6]. They are classified based on the composition of the cytoplasm. Most classifications of WBC are Lymphocytes and syndromes resulting in Acute Lymphoblastic Leukemia (ALL). In General, leukemia can be classified into two types: chronic and acute leukemia. Without any specific medication, the total recovery time of acute leukemia was three months, whereas the recovery time of chronic leukemia was found to be greater than that of acute leukemia [7]. ALL can be referred to as one common type of acute leukemia accountable for nearly 25% of every childhood tumor.
In the primary step, it seems to be in the bone marrow and can be later dispersed all over the human body [8]. In a healthy person, the WBC development is based on body necessities, but in terms of leukemia, it can be formed abnormally and turns out to be ineffective. Hence, a reliable and rapid cancer diagnosis becomes a severe need for fruitful treatment to increase survival rates. At present, a manual examination of blood samples gained with the help of microscopic images was made to detect this disease, which can be less accurate, often very slow, and time-consuming [9]. Also, in the microscopic study, the shape and appearance of leukemic cells are like normal cells, which makes diagnosis challenging [10]. Convolutional Neural Networks (CNNs) have been used in Deep Learning (DL) to classify images for years, but there is still a gap in enhancing their performance, efficiency, and learning process.
The MPADL-LCC algorithm was applied to classify medical images based on the Marine Predator Algorithm with Deep Learning (MPADL-LCC). The projected MPADL-LCC system utilizes the bilateral filtering (BF) technique as a preprocessing stage. In addition, the MPADL-LCC technique employs Faster SqueezeNet for feature extraction with the Marine Predator Algorithm (MPA) as a hyperparameter optimizer. Eventually, the denoising autoencoder (DAE) methodology can be executed to detect and classify leukemia cancer accurately. The series of simulations of the MPADL-LCC approach can be tested on the medical imaging dataset.
The goal is to integrate the Marine Predators Algorithm with Deep Learning for Leukemia Cancer Classification in medical images, creating highly efficient diagnostic tools. The aim is to enhance leukemia detection accuracy for more reliable diagnostic instruments in medical imaging using the unique capabilities of the Marine Predators Algorithm and robust pattern recognition of deep learning.
• The Marine Predators Algorithm is inspired by sea species’ predatory behavior. The technique tries to increase solutions’ convergence speed and quality by replicating these natural processes in the context of optimizing deep learning models. This nature-inspired method adds a new dimension to the optimization process.
• Despite their potency, deep learning models encounter hurdles such as overfitting and a dearth of robustness. To address these challenges, integrating the Marine Predators Algorithm introduces an optimization strategy geared towards augmenting the model’s capacity for generalization. The algorithm’s predatory characteristics promise to foster a learning process that is more robust and adaptive to diverse datasets, mitigating the risks associated with overfitting and bolstering the model’s overall performance.
• Leukaemia Cancer Classification includes identifying complicated patterns and features in medical imaging. Traditional approaches can struggle to deal with the complexities of these patterns. Deep learning holds immense promise when correctly led and optimized. The Marine Predators Algorithm provides a novel optimization technique designed specifically for the challenges of medical image interpretation.
• The combination of marine biology-inspired algorithms and deep learning in the medical arena exemplifies interdisciplinary innovation. It combines biology, optimization, and artificial intelligence principles to develop a comprehensive approach to a critical problem like cancer categorization.
• The idea stems from a desire to find a more robust and adaptable solution for the Leukaemia Cancer Classification. The combination of Deep Learning with the Marine Predators Algorithm is motivated by a desire to push the limits of accuracy, efficiency, and robustness in medical picture processing, ultimately contributing to advances in cancer diagnosis.
• The algorithm is anticipated to employ novel optimization tactics based on marine predators. These can include emulating the hunting or swarming behavior seen in marine species to improve the algorithm’s performance.
• The algorithm can demonstrate increased convergence properties using predatory instincts, allowing faster and more accurate solutions to complicated optimization problems.
• Deep learning, specifically CNNs in the context of medical pictures, contributes by recognizing detailed patterns and elements suggestive of leukemia in the photos.
• The method can automate the extraction of relevant information from medical images, which is critical in the case of cancer categorization.
• When properly trained, deep learning has a high accuracy in classification tasks. This will make a significant difference in the accurate identification of leukemia.
• Collaborating the Marine Predators Algorithm with Deep Learning can result in a hybrid model that uses nature’s optimization capabilities and deep learning’s pattern identification capabilities.
• The model can become more resistant to fluctuations and complexities in medical pictures by integrating these approaches, increasing its real-world applicability.
• The combined model can aid in the early diagnosis of leukemia, which is crucial for improving patient outcomes.
• The algorithm might be used as a decision support system for doctors, assisting them in making more accurate and fast diagnoses.
• The model can be adaptable to varied datasets, making it suitable for various medical imaging contexts.
• Contributions include the creation of a generalizable framework that can be applied to different types of medical picture categorization problems.
The distinctive methodology employed by the Marine Predators Algorithm combined with deep learning for leukemia cancer categorization presents a novel approach to feature extraction, optimization, and disease detection. This innovative strategy has the potential to drive significant advancements in medical imaging analysis for cancer research and diagnosis, offering promising prospects for breakthroughs in the field.
The central research question for investigating the Marine Predators Algorithm combined with deep learning for the classification of Leukemia Cancer on medical images is framed as follows:
Q1. How does the Marine Predators Algorithm enhance optimization efficiency in the context of deep learning for leukemia cancer classification?
Q2. What is the impact of integrating the Marine Predators Algorithm with deep learning techniques on the overall performance of the leukemia cancer classification model?
Q3. How robust is the hybrid model to variability in medical imaging datasets, and does it exhibit consistent performance across diverse sets of leukemia images?
Devi et al. [11] presented an innovative technique called the Gaussian Blurring Hue Saturation Value GBHSV-Leuk approach for classifying and segmenting ALL cancer cells. The first stage includes preprocessing and blurring the reflections and noise in the image using the Gaussian Blurring (GB) method. The next stage contains segmentation through the morphological operations and Hue Saturation Value (HSV) technique for distinguishing the background and foreground colors, which enhances the prediction accuracy. Jawahar et al. [12] offered a deep neural network (DNN)-based (ALNett) technique to classify microscopic WBC images, and depth-wise convolutions having different dilation rates were used. For extracting robust global and local features out of microscopic images for precise forecasting of ALL, the cluster layers with convolution, max-pooling, and normalizing procedures are utilized to offer enriched contextual and structural details. Ramaneswaran et al. [13] devised a hybrid Inceptionv3 and XGBoost methods for classifying ALL from microscopic WBC images. In this technique, the XGBoost method performs as classification, and head Inceptionv3 performs as image feature extraction.
Sunil et al. [14] introduced a completely automatic ALL detection technique that depends on DNN. ALL refers to a condition that affects the leukocytes. Children are likely to suffer from melanoma. Unlike other cancers, it does not create tumors, which is the main difficulty faced with this type of cancer and makes it very difficult to detect. Manual microscopic testing procedures have been employed before automation, but they are error-prone and time-consuming. However, this study deals with medical data and needs better accuracy and efficiency; hence, this system used various CNNS architectures. The research presents a potential deep CNN structure for mitigating this problem and yielding more precise ALL detection. Prostate cancer (PRC) stands as a predominant global cause of mortality. The imperative for enhancing healthcare services lies in the early identification and characterization of the PRC. Utilizing microarray gene expression data (GED), a contemporary approach intertwining DL and machine learning (ML) methodologies, fortified by multiple optimization tools, presents a promising avenue for the effective categorization of PRC [15].
In this technique, a new probability-related weight factor was recommended, which has a vital role in hybridizing professionally Mobilenet-V2 and ResNet-18 while protecting the merits of both methodologies. Zakir Ullah et al. [16] described a non-invasive, CNN-related technique that sizes medical images to make tasks. The presented solution, an attention module termed Efficient Channel Attention (ECA) comprising CNN-related techniques, utilizes VGG16 to derive better-quality deep attributes and image data, leading to superior classifier outcomes and feature representations. A technique with an ECA module will help solve morphological similarity among healthy cells and ALL cancer images. In [17], a potential CAD system for ALL detection was devised. This technique covers two stages. In the first phase, the WBC was segmented in microscopic blood images. The second stage extracts significant features, such as texture and shape features, from segmented cells. Eventually, K-nearest neighbor (KNN) and Naive Bayes (NB) methods are applied to find the normal and abnormal segmented cells on the extracted features. The histological diagnosis of these cancers is critical in choosing the best treatment option. On either front, early and accurate diagnosis reduces the probability of death.
This study employs an innovative deep-learning model inspired by marine predators, MPADL-LC3, to classify lung and colon cancer. As cancer spreads from one part of the body to another, metastasis is a complex process [18]. Through a comparative analysis, the study exhibits the superior performance of the MPADL-LC3 system across various parameters. The study introduces an advanced hybrid methodology for classifying WBC subtypes. Initially, to extract optimal deep features, refined and segmented WBC images undergo transfer learning on established neural networks, including DenseNet201 and Darknet53. Subsequently, the feature vector undergoes filtration using an entropy-controlled marine predator algorithm (ECMPA). This meta-heuristic optimization technique, inspired by nature, selectively retains robust features and discards weaker ones. The resultant reduced feature vector is inputted into various baseline classifiers with diverse kernel values to achieve effective subtype classification. The efficacy of the proposed approach is demonstrated through validation on a publicly available dataset, encompassing 5000 synthetic images representing five distinct WBC subtypes [19].
The marine predator algorithm is a meta-heuristic optimization method rooted in the survival-of-the-fittest concept. However, the conventional marine predator algorithm exhibits a unidirectional search approach, limiting its ability to converge effectively and often leading to stagnation at local minima. An innovative opposition-based learning feature has been introduced to enhance exploration capabilities and facilitate productive convergence towards global optima [20]. Although the automated classification of White Blood Cells (WBCs) using deep convolutional neural networks indicates promising accuracy, it grapples with substantial processing costs attributed to extensive feature sets. Through dimensionality reduction, intelligent feature selection emerges as a critical strategy to enhance model performance while mitigating computational complexity [21]. Peripheral Blood Smear (PBS) images are frequently favored for initial malignancy screenings in ALL diagnoses. Manual perusal of PBS images in laboratories for cancer detection is susceptible to errors due to interoperability issues and human fatigue. In addition, the non-specific nature of symptoms in blood smear images and their intricate morphological structures pose significant challenges when using trained data. Advanced algorithms outperform traditional methods, offering effective solutions to image processing challenges [21]. A novel CNN-based framework was introduced to improve accuracy. The proposed CNN model was tested on the primary biliary cholangitis (PBC) dataset normal DIB (Direct Immunoblotting). The results of the studies showed that the CNN-based framework for blood cell categorization achieves a 99.91% accuracy on the PBC dataset. When compared to previous results given in the literature, the proposed convolutional neural network model performs competitively [22,23].
This research aims to establish an innovative framework for predicting lung cancer using Electronic Claims Records (ECRs) through a meticulously designed exclusion process, employing a state-of-the-art sequence-based transformer. It unveils pioneering outcomes by applying a disease prediction model to the entire population of Taiwan. It provides comprehensive evaluations of lung cancer prediction, presenting the proposed methodology as an advanced framework for predicting disease risk based on claims data. Although clinical tests and imaging methods are conventionally employed for diagnosing metastasis, they are typically administered after the event. Metastasis prediction or early diagnosis is critical for treatment planning since it affects patient survival. The method created in this study will be valuable in predicting metastasis and, as a result, in choosing therapy options for cancer patients [24,25].
This study presents a diverse array of conventional Machine Learning and cutting-edge deep learning algorithms designed for the intricate classification of driver somatic non-synonymous mutations. Using a 70-feature annotation derived from medical and statistical tools, the methodology, Driver-Oriented Genomics Analysis (DrOGA), surpasses individual and ensemble methods based on the extensive analysis of a comprehensive database from various public data sources [26]. The developed computer-aided detection technique discriminates lung tumors and extracts tumor-related attributes from chest computed tomography images. After the feature selection process, a classifier is applied based on the Naive Bayesian network, utilizing eight selected image features. In addition, a multilayer perceptron classifier is employed that integrates two genomic biomarkers. This dual-classifier approach enhances the system’s robustness, incorporating visual and genomic information for more accurate and comprehensive leukemia detection 22. This system accurately predicts the risk of cancer recurrence. Training and evaluation involve a dataset comprising 79 stage I Non-small cell lung cancer (NSCLC) patients, utilizing a synthetic minority oversampling strategy and a leave-one-case-out validation approach. In addition, a fusion method integrates prediction scores from the two classifiers for enhanced accuracy [27].
A multi-class classification problem is created by binning the objective variable into four bins to accurately forecast the patients’ survival months. Using a multi-tier categorization system improves the accuracy of the results. Although the final numerical results are biologically significant, it is advised that a therapeutically meaningful model be derived with caution [28]. This research investigates numerous aspects of machine learning and deep learning approaches, focusing on feature selection and categorization. The reviews and comparisons demonstrate the parameter algorithm’s resultant correctness in the feature selection and classification process by assessing the testing outcomes in different datasets. In addition, different methodologies are used in this study to focus on the difficulties and identification of variables [29]. Exploring both Acute Myeloid Leukemia (AML) and ALL, this investigation utilizes gene expression data from a diverse cohort to predict leukemia subtypes using three distinct machine learning algorithms: XGBoost, Random Forest Classification, and Artificial Neural Networks. Before applying the algorithms, the dataset underwent dimensionality reduction through principal component analysis (PCA) [30]. Focusing on binary categorization, the primary goal of this study is to optimize the efficiency and accuracy of classifying leukemia samples into Acute Lymphocytic Leukemia and Acute Myelocytic Leukemia. Various feature selection approaches were employed and compared, ultimately selecting the dimensionality reduction algorithm that demonstrated the highest classification accuracy with the fewest genes (features). Computer science researchers have developed numerous automatic approaches for selecting algorithms and/or hyper-parameter values for a particular supervised machine learning problem, making machine learning accessible to layperson users with minimum computing skills [31]. Hyper-parameter tuning is crucial in determining the ideal machine learning parameters [32]. This indicates that the hyper-parameter values for certain leukemia traits were successfully determined using the Hybrid Optimization of Resource Distributions (HORD) technique. The HORD approach also improved the model’s performance by adjusting and locating the ideal set of hyper-parameters for the CNN model [33]. This model maximizes feature selection and refinement from high-dimensional data by fusing machine learning with image processing [34].
This study formulated a novel MPADL-LCC system for detecting and classifying leukemia cancer on microscopic images. The projected MPADL-LCC methodology encompasses BF-based noise removal, Faster SqueezeNet, MPA-based hyperparameter optimizer, and DAE-based classification. Fig. 1 illustrates the overall flow of MPADL-LCC methods. Integrating the Marine Predators Algorithm with deep learning provides a unique approach to leukemia detection. It efficiently extracts features from complex medical images using the algorithm’s strengths, which is crucial for accurate cancer classification. Deep learning enables higher accuracy in distinguishing leukemia from non-leukemia cells. Scalable and adaptable, the model can handle large datasets and improve with additional data, enhancing its performance over time.

Figure 1: The overall flow of the MPADL-LCC system
In the primary stage, the presented MPADL-LCC technique enforced the BF approach for the noise removal process. BF is a technique employed to smoothen images with the edges. The usage of BF is quickly advanced, and now it is applied in image processing applications, including picture enhancement, image de-noise, and others. Early detection can improve the chances of survival and successful treatment. However, depending on the diagnostician’s experience, it is time-consuming and complex. It is critical for patients and their prognoses that BC (Blood Cancer) can be automatically recognized by interpreting histological pictures [35]. The pixel of all the points from the low-pass filter is considered equivalent to the nearer point.
The output (h) and input (f) images can be multi-band;
Nonetheless, the pixel of the point at the borders is very similar to the closing point.
Therefore, the lines are blurred. The filter blends gray rates based on multispectral similarities and numerical proximity, allowing similar values. The filtering range can be expressed as follows:
where
BF is defined as follows:
3.2 Feature Extraction using Faster SqueezeNet
At this stage, the MPADL-LCC system exploited the Faster SqueezeNet algorithm for developing feature vectors. Faster SqueezeNet is presented to expand the real-time performance and precision of electronic module classification [36]. Residual structures and BatchNorm are added to avoid overfitting. Fig. 2 defines the infrastructure of the SqueezeNet algorithm. Simultaneously, like DenseNet, the concat was employed to connect various layers to improve the expressiveness of the first layers of the networks. The model comprises a global average pooling layer, 3 block layers, 4 convolutional layers, and 1 BatchNorm layer. In the following ways, the Fast SqueezeNet is enhanced:

Figure 2: Structure of SqueezeNet model
(1) It is a derivative of the DenseNet framework, and a linked mode is developed to increase the data flow between layers. The present layer receives all the mapping features of the prior layer, and it is exploited
In Eq. (6),
Without excessively improving the network parameters, the network efficiency can be improved, and concurrently, any 2-layer network can directly communicate data.
(2) It learns from the ResNet model and presents many primary components, including a fire module and pooling layer, to ensure the best network convergence. Finally, the 2 layers are added and connected with the second convolutional layer.
Correctly, representing desirable underlying mapping as
3.3 Hyperparameter Tuning Using MPA
MPA was used for the hyperparameter tuning procedure. MPA can be a metaheuristic optimizer approach inspired by natural laws, which control better foraging approaches and encounter rates among prey and predators in the marine ecosystem. Medical data plays an essential part in cancer illness diagnosis. Redundant and irrelevant highlighted genes are two different characteristics that reduce the performance of the machine learning model [37]. The MPA uses Brownian and Lévy steps to mimic a predator’s behavior during the prey attack. MPA depends on two motions; hence, it was necessary to recognize the idea of the random walk (RW) model, including Lévy and Brownian motion, as follows.
Key parameters in the MPA combined with deep learning for leukemia cancer classification include the choice of deep learning architecture (e.g., CNN, ResNet) and specific layer configurations. Image preprocessing techniques such as resizing, normalization, and augmentation are vital. MPA parameters for feature selection, such as search step size and iteration count, are crucial. Hyperparameters for training the model, like learning rate and batch size, also play a significant role. Additionally, parameters for data preprocessing and dataset split are essential considerations.
With a Gaussian (norma was l) distribution using the zero mean
LF is a kind of RW where step size was defined through a probability function stated by Lévy distribution (power law tail).
where
The MPA begins with the primary population cast using a uniform distribution of random values among upper and lower boundaries or respective variables, and it is formulated as follows:
where
where
Another typical matrix of MPA is the prey matrix, an auxiliary matrix that assists in updating the elite matrix process. The initialization process can enable these matrices. The predator updates the location using a matrix. In addition, the fittest matrix is created and chosen as elite.
where
The MPA process is classified into three major stages.
Phase 1: This stage is relevant for up to one-third of the iteration procedure. In addition, the velocity ratio was considerably higher. This makes sure the exploration of this searching space. The ratio was greater compared with 10. The weaker stagnation during predator movement can be observed as follows:
While
where
Phase 2: Here, the balance between exploitation and exploration determines the convergence. For exploration, the predator and the prey are responsible. As per the rules, in the unit velocity ratio
While
For the first half of the population
where
Phase 3: Here, the predator moves faster than the prey, mainly related to the exploitation ability. In a lower velocity ratio
While
3.4 Leukemia Classification Using DAE
In this study, the DAE approach is exploited for medical image classification. The Autoencoder (AE) is a feedforward neural network (FFNN) with a
(1) The encrypted map
Deep convolution AE offered a remarkable capacity for medical and neuroimaging scans. In general, every Fully Connected (FC) layer can be replaced with numerous normalization, convolutional, and pooling layers, in which amount of layers is based on the problems and the targeted performance. The arithmetical formula of the convolution AE is the same as the elemental AE mentioned before, except that weight is shared. For input
The input generated to the decoder is expressed in Eq. (18), where
The DAE is a decisive difference from AE, which accepts the stochastic noisy depiction of input based on Gaussian additive noise when compared to the ideal input and thus attains an optimum set of weights that highlights discriminatory features.
This study employed a robust computing environment with powerful CPU and GPU capabilities to manage the intensive computational tasks required for training neural networks to implement the leukemia cancer classification system using deep learning. It utilized popular frameworks such as TensorFlow, PyTorch, or Keras, ensuring all necessary libraries were installed. This study designed a convolutional neural network architecture for medical image analysis, specifying layer types (e.g., convolutional, pooling), activation functions, and layer depths based on previous research. A labeled dataset of medical images containing leukemia and non-leukemia cases was prepared for supervised learning. Then, an optimizer such as Adam or RMSprop was employed to minimize training loss. For evaluation, key evaluation metrics (accuracy, precision, recall, F1 score, confusion matrix) were defined for model assessment. The dataset was split into training, validation, and test subsets (e.g., 70-15-15 ratio) to train and validate the model while preventing overfitting. The hyperparameters are fine-tuned based on validation performance, and the final model was evaluated on the test set. In addition, the developed model was constructed using Python in conjunction with the Keras deep learning framework, and all computations are executed on Google Colab utilizing a 12GB NVIDIA Tesla K80 GPU. The experimental configuration encompasses the dataset used, and the model’s performance was rigorously validated. The simulation result of the MPADL-LCC algorithm was tested on the C-NMC_Leukemia dataset available from [16].
The Marine Predators Algorithm aids in efficient feature extraction from medical images inspired by marine predators’ foraging behavior to capture relevant leukemia patterns. The model achieves enhanced classification accuracy by learning intricate image patterns by integrating deep learning, particularly CNNs. This combination results in a robust classifier capable of handling variations in image data quality and resolution. Improved accuracy promises early leukemia detection, which is crucial for timely intervention. These advancements have significant clinical implications, potentially improving diagnostic processes and patient care. Future research aims to refine the algorithm, optimize parameters, and validate its performance across diverse clinical settings.
Performance measures are described in Eqs. (22)–(25), and they are accuracy, recall, precision, and F1 score. True Positive (TP) denotes the number of correctly detected positive samples; True Negative (TN) is the number of correctly classified negative samples; False Positive (FP) is the number of falsely detected positive samples; and False Negative (FN) is the number of undetected positive samples.
where:
• Estimated MetricEstimated Metric is the observed performance metric (e.g., accuracy, sensitivity, and others),
• z is the z-score corresponding to the desired confidence level,
• n is the sample size.
In order to assess the robustness of the hybrid model, it is necessary to test it on datasets that differ in picture quality, resolution, and illness subtypes, reflecting the variety present in clinical practice. This method guarantees that the model can adjust to various imaging situations. Standard metrics, including accuracy, precision, recall, and F1 score, evaluate the model’s performance across these many datasets. This allows for understanding the model’s generalization and consistent performance in real-world circumstances. Extensive testing on various leukemia picture sets is necessary to confirm the model’s applicability in medicine by validating its dependability and possible clinical impact under different imaging settings. It can evaluate if the model’s performance holds steady over various groups of photos by dividing the dataset into folds and training/testing the model on various combinations.
This study used the dataset_2 for the second validation phase. In addition, this dataset has insufficient microscopic blood samples to adequately train the proposed model. In order to overcome this restriction, data augmentation techniques were employed to improve the diversity of photos in the training set. The training process was improved by adding several image changes to the dataset. The expanded train set was then utilized to train the model. This validation phase’s results, which involved randomly rearranging the train and test sets, are encouraging. In particular, an accuracy of 98% was attained in the second run of testing with the dataset_2. Table 1 describes the Samples for testing and training data. Fig. 3 describes the confusion matrics of the leukemia data for dataset_2. The database contains 530 images, with 360 cancer images and 170 healthy images, as listed in Table 2. Fig. 4 illustrates the sample images of the system.
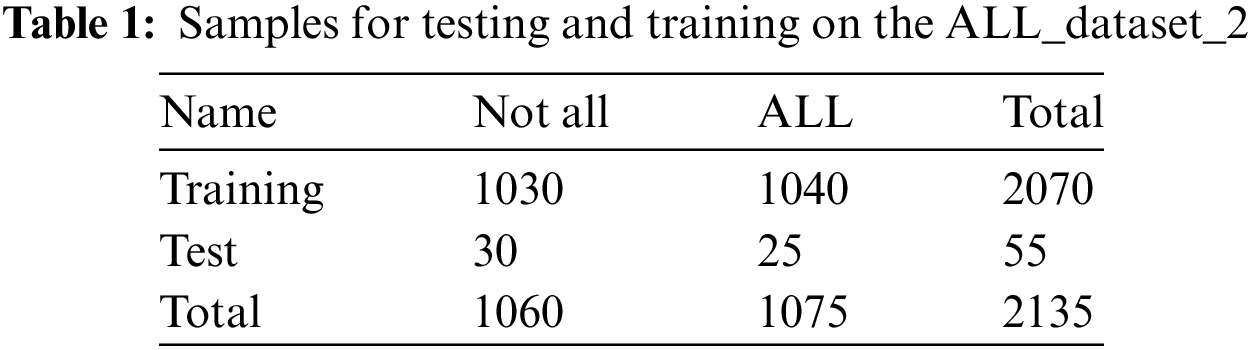

Figure 3: Confusion matrices of MPADL-LCC for dataset_2
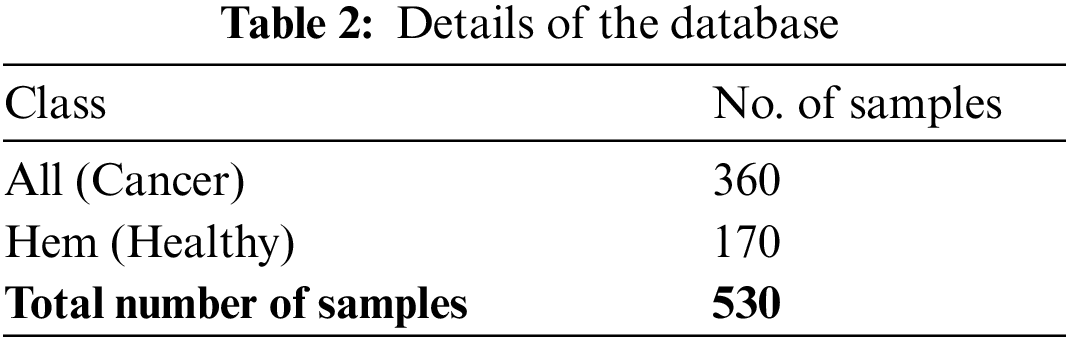


Figure 4: Samples images (a) Healthy (b) Cancer
In Fig. 5, the confusion matrices of the MPADL-LCC methodology are inspected under varying numbers of epochs. The MPADL-LCC algorithm perfectly recognizes cancer and healthy images.

Figure 5: Confusion matrices of MPADL-LCC methodology (a–f) Epochs 500–3000
In Table 3, the overall classifier outcome of the MPADL-LCC approach is inspected under several epochs. Fig. 6 depicts the
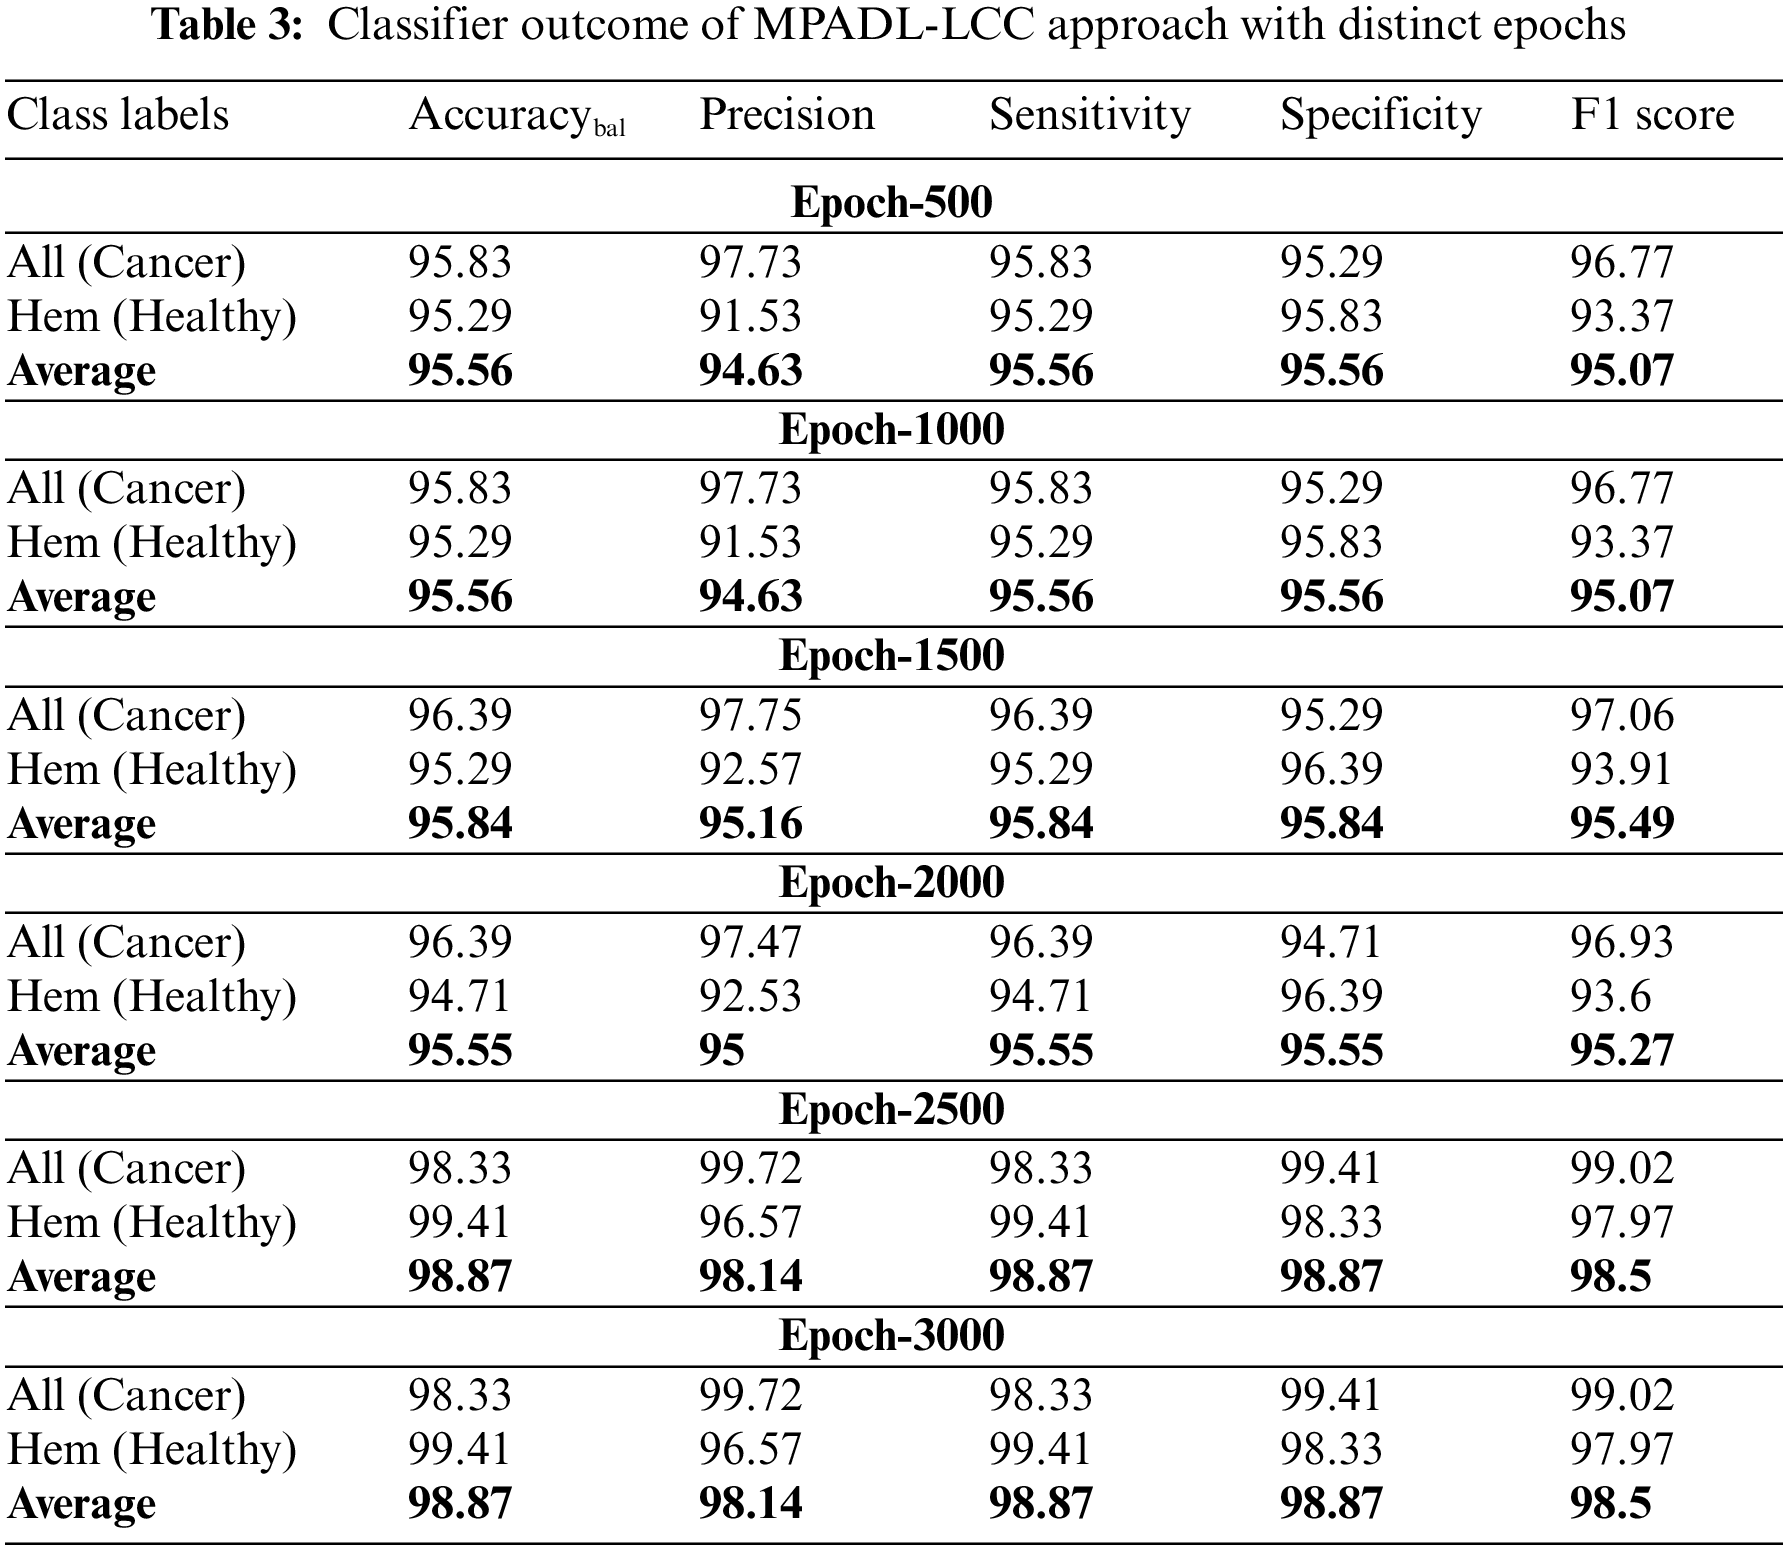

Figure 6:
Fig. 7 depicts the

Figure 7:
TRAC (Training Accuracy) and VDAC (Validation Accuracy) of the MPADL-LCC method are studied in the Leukemia cancer solution in Fig. 8. The outcome stated that the MPADL-LCC approach has maximal results with enhanced values of TRAC and VDAC. Visibly, the MPADL-LCC method has greater TRAC outcomes.

Figure 8: TRAC and VDAC outcome of MPADL-LCC methodology
The TRLS (Training Loss) and VDLS (Validation Loss) of the MPADL-LCC methodology are tested on Leukemia cancer performance in Fig. 9. The outcome inferred that the MPADL-LCC algorithm has a greater outcome with the lesser values of TRLS and VDLS. The MPADL-LCC system has minimal VDLS performance.

Figure 9: TRLS and VDLS outcome of MPADL-LCC system
An evident PR curve of the MPADL-LCC algorithm on the test database is presented in Fig. 10. The outcome highlighted that the MPADL-LCC methodology has greater PR values in two classes.

Figure 10: Precision-recall curve of MPADL-LCC methodology
A comprehensive ROC curve of the MPADL-LCC method on the test database is defined in Fig. 11. The result indicated that the MPADL-LCC approach can classify two classes.

Figure 11: ROC curve outcome of MPADL-LCC approach
Table 4 and Fig. 12 show a brief comparative outcome of the MPADL-LCC algorithm with recent DL methods [39]. The outcomes inferred that the YOLOv4, EfficientNet-B2, and Inception-ResNetV2 algorithms demonstrate moderately closer classification outcomes. Then, the Inception V3, Xception-ensemble, and DenseNet121 models exhibit reasonable classifier results. However, the MPADL-LCC technique highlights superior performance with a maximum accuracy of 98.87%, precision of 98.14%, sensitivity of 98.87%, and specificity of 98.87%.


Figure 12:
These outcomes highlighted the improved performance of the MPADL-LCC approach over other existing systems.
This study presents a novel MPADL-LCC methodology for detecting and classifying leukemia cancer on microscopic images. The presented MPADL-LCC algorithm primarily implements the BF method for the noise removal process. In addition, the MPADL-LCC algorithm employs the Faster SqueezeNet model to develop feature vectors with MPA as a hyperparameter optimizer. The DAE system is exploited for medical image classification at the final stage. The hyperparameter tuning process using MPA helps accomplish enhanced leukemia cancer classification performance. The series of simulations of the MPADL-LCC algorithm is tested on the medical imaging database, and the outcome demonstrates the best results of the MPADL-LCC technique over other recent approaches concerning various measures. In the future, the efficiency of the MPADL-LCC method will be boosted by hybrid DL classification models.
There are several promising avenues to integrate the Marine Predators Algorithm with Deep Learning for Leukemia Cancer Classification on Medical Images in future endeavors. It is crucial to enhance the algorithm’s adaptability to diverse datasets and improve its performance across various leukemia subtypes. Exploring real-time applications in clinical settings and integrating interpretability features into the model can heighten its practical utility. Regular updates are essential to incorporate advancements in deep learning and medical imaging technologies, ensuring the algorithm's relevance in leukemia diagnosis research. Collaboration with medical experts and rigorous validation through extensive clinical trials will solidify its applicability and facilitate seamless integration into healthcare systems.
Acknowledgement: The authors present their appreciation to King Saud University for funding the publication of this research through Researchers Supporting Program (RSPD2024R809), King Saud University, Riyadh, Saudi Arabia.
Funding Agency: The research is funded by Researchers Supporting Program at King Saud University, (RSPD2024R809).
Author Contributions: Study conception and design: Sonali Das, Saroja Kumar Rout, Pradyumna Kumar Mohapatra; data collection: Sujit Kumar Panda, Pradyumna Kumar Mohapatra; analysis and interpretation of results: Saroja Kumar Rout, Sonali Das, Sujit Kumar Panda, Abdulaziz S. Almazyad, Muhammed Basheer Jasser; draft manuscript preparation: Pradyumna Kumar Mohapatra, Saroja Kumar Rout, Muhammed Basheer Jasser; manuscript review and editing: Sujit Kumar Panda, Abdulaziz S. Almazyad, Muhammed Basheer Jasser, Guojiang Xiong, Ali Wagdy Mohamed; Funding Acquisition: Abdulaziz S. Almazyad. All authors reviewed the results and approved the final version of the manuscript.
Availability of Data and Materials: Data employed in this study is available from [16].
Conflicts of Interest: The authors declare that they have no conflict of interest. The manuscript was written with contributions from all authors. All authors have approved the final version of the manuscript.
References
1. Gupta A, Gehlot S, Gupta R. Microscopy cancer cell imaging in B-lineage acute lymphoblastic leukemia. In: State of the art in neural networks and their applications. London, UK: Academic Press; 2023. p. 1–28. [Google Scholar]
2. Raina R, Gondhi NK, Chaahat SD, Kaur M, Lee HN. A systematic review on acute leukemia detection using deep learning techniques. Arch Comput Methods Eng. 2023;30(1):251–70. doi:10.1007/s11831-022-09796-7. [Google Scholar] [CrossRef]
3. Ayyappan V, Chang A, Zhang C, Paidi SK, Bordett R, Liang T, et al. Identification and staging of B-cell acute lymphoblastic leukemia using quantitative phase imaging and machine learning. ACS Sens. 2020;5(10):3281–9. doi:10.1021/acssensors.0c01811. [Google Scholar] [PubMed] [CrossRef]
4. Gupta K, Jiwani N, Whig P. Effectiveness of machine learning in detecting early-stage leukemia. In: International Conference on Innovative Computing and Communications; 2022; Singapore. Springer Nature Singapore. vol. 2, p. 461–72. [Google Scholar]
5. Dese K, Raj H, Ayana G, Yemane T, Adissu W, Krishnamoorthy J, et al. Accurate machine-learning-based classification of leukemia from blood smear images. Clin Lymphoma Myeloma Leuk. 2021;21(11):e903–14. doi:10.1016/j.clml.2021.06.025. [Google Scholar] [PubMed] [CrossRef]
6. Ratley A, Minj J, Patre P. Leukemia disease detection and classification using machine learning approaches: a review. In: 2020 First International Conference on Power, Control and Computing Technologies (ICPC2T); 2020 Jan 3–5; Raipur, India: IEEE. p. 161–5. [Google Scholar]
7. Eckardt JN, Schmittmann T, Riechert S, Kramer M, Sulaiman AS, Sockel K, et al. Deep learning identifies acute promyelocytic leukemia in bone marrow smears. BMC Cancer. 2022;22(1):201. doi:10.1186/s12885-022-09307-8. [Google Scholar] [PubMed] [CrossRef]
8. Das PK, Pradhan A, Meher S. Detection of acute lymphoblastic leukemia using machine learning techniques. In: Machine learning, deep learning and computational intelligence for wireless communication; 2021; Singapore. Springer. p. 425–37. [Google Scholar]
9. Kasani PH, Park SW, Jang JW. An aggregated-based deep learning method for leukemic B-lymphoblast classification. Diagnostics. 2020;10(12):1064. doi:10.3390/diagnostics10121064. [Google Scholar] [PubMed] [CrossRef]
10. Bukhari M, Yasmin S, Sammad S, Abd El-Latif AA. A deep learning framework for leukemia cancer detection in microscopic blood samples using squeeze and excitation learning. Math Probl Eng. 2022;2022:18. [Google Scholar]
11. Devi TG, Patil N, Rai S, Philipose CS. Gaussian blurring technique for detecting and classifying acute lymphoblastic leukemia cancer cells from microscopic biopsy images. Life. 2023;13(2):348. doi:10.3390/life13020348. [Google Scholar] [PubMed] [CrossRef]
12. Jawahar M, Sharen H, Gandomi AH. ALNett: a cluster layer deep convolutional neural network for acute lymphoblastic leukemia classification. Comput Biol Med. 2022;148:105894. doi:10.1016/j.compbiomed.2022.105894. [Google Scholar] [PubMed] [CrossRef]
13. Ramaneswaran S, Srinivasan K, Vincent PDR, Chang CY. Hybrid inception v3 XGBoost model for acute lymphoblastic leukemia classification. Comput Math Methods Med. 2021;2021(1):2577375. [Google Scholar]
14. Sunil S, Sonu P. An effective approach for detecting acute lymphoblastic leukemia using deep convolutional neural networks. In: International Conference on Computational Techniques and Applications; 2021; Singapore: Springer Nature Singapore. p. 23–34. [Google Scholar]
15. Sethi BK, Singh D, Rout SK, Panda SK. Long short-term memory-deep belief network based gene expression data analysis for prostate cancer detection and classification. IEEE Access; 2023. p. 1508–24. doi:10.1109/ACCESS.2023.3346925. [Google Scholar] [CrossRef]
16. Zakir Ullah M, Zheng Y, Song J, Aslam S, Xu C, Kiazolu GD, et al. An attention-based convolutional neural network for acute lymphoblastic leukemia classification. Appl Sci. 2021;11(22):10662. doi:10.3390/app112210662. [Google Scholar] [CrossRef]
17. Abdulla AA. Efficient computer-aided diagnosis technique for leukemia cancer detection. IET Image Process. 2020;14(17):4435–40. doi:10.1049/ipr2.v14.17. [Google Scholar] [CrossRef]
18. Ahmad R, Awais M, Kausar N, Akram T. White blood cells classification using entropy-controlled deep features optimization. Diagnostics. 2023;13(3):352. doi:10.3390/diagnostics13030352. [Google Scholar] [PubMed] [CrossRef]
19. Balakrishnan K, Dhanalakshmi R, Mahadeo Khaire U. Analysing stable feature selection through an augmented marine predator algorithm based on opposition-based learning. Expert Syst. 2022;39(1):e12816. doi:10.1111/exsy.v39.1. [Google Scholar] [CrossRef]
20. Ahmad R, Awais M, Kausar N, Tariq U, Cha JH, Balili J. Leukocytes classification for leukemia detection using quantum inspired deep feature selection. Cancers. 2023;15(9):2507. doi:10.3390/cancers15092507. [Google Scholar] [PubMed] [CrossRef]
21. Özbay E, Özbay FA, Gharehchopogh FS. Peripheral blood smear images classification for acute lymphoblastic leukemia diagnosis with an improved convolutional neural network. J Bionic Eng. 2023;1–7. [Google Scholar]
22. Asghar R, Kumar S, Mahfooz A. Classification of blood cells using deep learning models. 2023. arXiv preprint arXiv:2308.06300. [Google Scholar]
23. Chen HY, Wang HM, Lin CH, Yang R, Lee CC. Lung cancer prediction using electronic claims records: A transformer-based approach. IEEE J Biomed Health Inform. 2023;27(12):6062–73. doi:10.1109/JBHI.2023.3324191. [Google Scholar] [PubMed] [CrossRef]
24. Cho M, Lee S, Park B, Han K. Prediction of cancer metastasis using correlations between miRNAs and competing endogenous RNAs. IEEE Trans Nanobioscience. 2023;22(4):771–9. doi:10.1109/TNB.2023.3274737. [Google Scholar] [PubMed] [CrossRef]
25. Bastico M, Fernández-García A, Belmonte-Hernández A, Mayoral SU. DrOGA: an artificial intelligence solution for driver-status prediction of genomics mutations in precision cancer medicine. IEEE Access. 2023;11:37378–91. doi:10.1109/ACCESS.2023.3266983. [Google Scholar] [CrossRef]
26. Emaminejad N, Qian W, Guan Y, Tan M, Qiu Y, Liu H, et al. Fusion of quantitative image and genomic biomarkers to improve prognosis assessment of early stage lung cancer patients. IEEE Trans Biomed Eng. 2015;63(5):1034–43. [Google Scholar] [PubMed]
27. Wajid B, Rashid U, Zahid S, Anwar F, Awan FG, Anwar AR, et al. Survival rate prediction of blood cancer (leukemia) patients using machine learning algorithms. In: 2022 International Conference on Emerging Trends in Electrical, Control, and Telecommunication Engineering (ETECTE); 2022; Lahore, Pakistan. p. 1–4. doi:10.1109/ETECTE55893.2022.10007402. [Google Scholar] [CrossRef]
28. Divyapreethi B, Mohanarathinam A. Analysis of automated leukemia cancer detection using feature selection and classification techniques. In: 2023 7th International Conference on I-SMAC (IoT in Social, Mobile, Analytics and Cloud) (I-SMAC); 2023; Kirtipur, Nepal. p. 740–5. doi:10.1109/I-SMAC58438.2023.10290621. [Google Scholar] [CrossRef]
29. Dey UK, Islam MS. Genetic expression analysis to detect type of leukemia using machine learning. In: 2019 1st International Conference on Advances in Science, Engineering and Robotics Technology (ICASERT); 2019; Dhaka, Bangladesh. p. 1–6. doi:10.1109/ICASERT.2019.8934628. [Google Scholar] [CrossRef]
30. Bouazza SH, Wakrim L, Benedress LG. Classifying leukemia through DNA expression data mining techniques. In: 2023 IEEE 3rd International Maghreb Meeting of the Conference on Sciences and Techniques of Automatic Control and Computer Engineering (MI-STA); 2023; Benghazi, Libya. p. 387–91. doi:10.1109/MI-STA57575.2023.10169443. [Google Scholar] [CrossRef]
31. Luo G. A review of automatic selection methods for machine learning algorithms and hyper-parameter values. Netw Model Anal Health Inform Bioinform. 2016;5:1–16. [Google Scholar]
32. Hossain MR, Timmer D. Machine learning model optimization with hyper parameter tuning approach. Glob J Comput Sci Technol. 2021;21(D2):7–13. [Google Scholar]
33. Awotunde JB, Imoize AL, Ayoade OB, Abiodun MK, Do DT, Silva A, et al. An enhanced hyper-parameter optimization of a convolutional neural network model for leukemia cancer diagnosis in a smart healthcare system. Sensors. 2022;22(24):9689. doi:10.3390/s22249689. [Google Scholar] [PubMed] [CrossRef]
34. Pullaiah GC, PM AK. Optimal feature selection from high-dimensional fusion of blood smear images for leukemia diagnosis. Scalable Comput: Pract Exp. 2024;25(3):1980–2000. doi:10.12694/scpe.v25i3.2690. [Google Scholar] [CrossRef]
35. Routray N, Rout SK, Sahu B, Panda SK, Godavarthi D. Ensemble learning with symbiotic organism search optimization algorithm for breast cancer classification & risk identification of other organs on histopathological images. IEEE Access. 2023;11:110544–57. doi:10.1109/ACCESS.2023.3322222. [Google Scholar] [CrossRef]
36. Xu Y, Yang G, Luo J, He J. Electronic component recognition algorithm based on deep learning with a faster SqueezeNet. Math Probl Eng. 2020;2020:1. doi:10.1155/2020/2940286. [Google Scholar] [CrossRef]
37. Sahu B, Rout SK, Ravindra JV, Mohanty SN. Multi-filter enhanced doctor and patient optimization algorithm for cancer diagnosis. In: Proceedings of the International Health Informatics Conference: IHIC; 2023; Singapore: Springer Nature Singapore. p. 69–78. [Google Scholar]
38. Rout SK, Sahu B, Mishra BK, Singh D. Artificial neural network modeling for prediction of coronavirus (COVID-19). In: Advances in distributed computing and machine learning; 2022; Springer Singapore. p. 328–39. [Google Scholar]
39. Mengash HA, Alamgeer M, Maashi M, Othman M, Hamza MA, Ibrahim SS, et al. Leveraging marine predators algorithm with deep learning for lung and colon cancer diagnosis. Cancers. 2023;15(5):1591. doi:10.3390/cancers15051591. [Google Scholar] [PubMed] [CrossRef]
Cite This Article
 Copyright © 2024 The Author(s). Published by Tech Science Press.
This work is licensed under a Creative Commons Attribution 4.0 International License , which permits unrestricted use, distribution, and reproduction in any medium, provided the original work is properly cited.
 Downloads
 Citation Tools