
 Submit a Paper
 Propose a Special lssue
 Open Access
ARTICLE

Enhancing Communication Accessibility: UrSL-CNN Approach to Urdu Sign Language Translation for Hearing-Impaired Individuals
1 Department of Computer Engineering, Modeling Electronics and Systems Engineering, University of Calabria, Rende Cosenza, 87036, Italy
2 Department of Information Systems, University of Management and Technology, Lahore, 54770, Pakistan
3 Department of Computer Engineering, Istanbul Sabahattin Zaim University, Istanbul, 34303, Turkey
4 Department of Software Engineering, Istanbul Nisantasi University, Istanbul, 34398, Turkey
5 Department of Computer Science, COMSATS University Islamabad, Lahore Campus, Lahore, 54700, Pakistan
6 Faculty of Medicine and Health Technology, Tampere University, Tampere, 33720, Finland
7 Department of Computer Science, College of Computer Engineering and Sciences in Al-Kharj, Prince Sattam Bin Abdulaziz University, P.O. Box 151, Al-Kharj, 11942, Saudi Arabia
8 Second Department of Computer Science, College of Engineering and Computing, George Mason University, Fairfax, VA 4418, USA
* Corresponding Authors: Jawad Rasheed. Email: ; Tunc Asuroglu. Email:
(This article belongs to the Special Issue: Artificial Intelligence Emerging Trends and Sustainable Applications in Image Processing and Computer Vision)
Computer Modeling in Engineering & Sciences 2024, 141(1), 689-711. https://doi.org/10.32604/cmes.2024.051335
Received 02 March 2024; Accepted 03 June 2024; Issue published 20 August 2024
 View Full Text
 Download PDF
Abstract
Deaf people or people facing hearing issues can communicate using sign language (SL), a visual language. Many works based on rich source language have been proposed; however, the work using poor resource language is still lacking. Unlike other SLs, the visuals of the Urdu Language are different. This study presents a novel approach to translating Urdu sign language (UrSL) using the UrSL-CNN model, a convolutional neural network (CNN) architecture specifically designed for this purpose. Unlike existing works that primarily focus on languages with rich resources, this study addresses the challenge of translating a sign language with limited resources. We conducted experiments using two datasets containing 1500 and 78,000 images, employing a methodology comprising four modules: data collection, pre-processing, categorization, and prediction. To enhance prediction accuracy, each sign image was transformed into a greyscale image and underwent noise filtering. Comparative analysis with machine learning baseline methods (support vector machine, Gaussian Naive Bayes, random forest, and k-nearest neighbors’ algorithm) on the UrSL alphabets dataset demonstrated the superiority of UrSL-CNN, achieving an accuracy of 0.95. Additionally, our model exhibited superior performance in Precision, Recall, and F1-score evaluations. This work not only contributes to advancing sign language translation but also holds promise for improving communication accessibility for individuals with hearing impairments.Keywords
Nomenclature
| CNN | Convolutional Neural Network |
| CSL | Chinese Sign Language |
| KNN | K-Nearest-Neighbors |
| PSL | Pakistani Sign Language |
| RF | Random Forest |
| SL | Sign Language |
| SLR | Sign Language Recognition |
| SVM | Support Vector Machine |
| UrSL | Urdu Sign Language |
The core concept of any language is to communicate with one another. Language can be in spoken or written form. But when we talk about SLs, it is not about spoken form; it can be in written form or visualization form. In visualization, we can consider images or series of images to define complex words and sentences.
People communicate by using several languages. But the people who cannot speak communicate using SL. No specific rule or universally recognized SL exists; each country or region has its distinct SL with its own set of established rules. Developed countries have developed SLs for their languages; they have created the signs for their language and made grammar, formations, and rules. SL is actually the mapping of signs over the generally speaking language like the American language has American SL, the Chinese language has CSL, the German language has German SL, and in a similar way, in Pakistan, we have PSL [1].
There exists a significant communication divide between individuals with disabilities and those without. This gap can be overcome with specific SL tools that normal and disabled people can use. Several researches have been done, while different tools and techniques have been generated by researchers worldwide [2]. In terms of research, there has been a huge amount of work done in American SL compared to others.
This research aims to elevate those with hearing impairments and assist them in interacting socially with regular people. SL data is a structured form of data where each gesture denotes a particular quality or character. Many researchers are working on various approaches that might increase the occurrence of hu-man-computerization to a much greater extent with the advent of development in science and engineering.
The study is proposed to recognize gestures in SL. For this study, we have used two datasets: PSL_Alphabets dataset, which is a publicly available SL dataset containing 40 images for each of the Urdu alphabets, and ASL_Sign_Data, which is the dataset of English sign alphabets having 78,000 total images of English alphabets. Both of the datasets are publicly available on Kaggle [3].
This study aims to advance the UrSL research field and investigate the potential machine learning and deep learning techniques, with a particular focus on the CNN approach, for classifying UrSL actions. In this paper, the UrSL-CNN deep learning model is proposed. The suggested UrSL-CNN is trained with images of hand signals made in various lighting situations and orientations to recognize 37 UrSL signs automatically. This paper makes significant contributions, including:
• Introduces a novel approach for translating UrSL using the UrSL-CNN model, a convolutional neural network architecture designed explicitly for this purpose.
• Addresses the challenge of translating sign language with limited resources, unlike existing works that primarily focus on languages with rich resources.
• Conducts experiments using two datasets containing 1500 and 78,000 images and employing a methodology comprising four modules: data collection, preprocessing, categorization, and prediction.
• Enhances prediction accuracy by transforming each sign image into a greyscale image and applying noise filtering.
• Demonstrates the superiority of the proposed UrSL-CNN over machine learning baseline methods on the UrSL alphabet dataset, achieving an accuracy of 0.95.
• Provides a comparative analysis of the PSL dataset using the proposed UrSL-CNN architecture against the American SL dataset.
• It contributes to advancing sign language translation and holds promise for improving communication accessibility for individuals with hearing impairments.
The paper is structured as follows: Section 2 presents a review of related work. Section 3 outlines the design and architecture of the UrSL-CNN model. Section 4 covers the results and experiments and compares the proposed UrSL-CNN with state-of-the-art techniques. Finally, Section 5 provides conclusions and suggests possible directions for future research.
In the current era of technological advancements, the main emphasis is on devices like cell phones, computers, the internet, and cloud computing. The world is shifting towards using gestures for various interactions. IT giants like Microsoft, Leap Motion, and Google are introducing innovative products such as Google Glass, Kinect, and the Leap Motion controller. These developments have the potential to offer valuable assistance to the deaf community by creating new communication possibilities [2]. Further, the research proposed an architectural diagram for Pakistan’s SL. SL can be translated into English using a conventional image classification algorithm using Google’s machine learning library, TensorFlow, and the pre-built Deep Learning CNN model Inception. The system accepts input as a camera-generated image and interprets voice and text for signs.
In a survey examining artificial intelligence within the realm of CSL recognition, the authors of [4] explored deep learning and machine learning methods used between 2000 and 2019, with a particular emphasis on recognizing CSL. They summarized that current language recognition techniques are divided into two parts, the traditional kind of machine learning and deep learning, while in terms of datasets, there is not much work done on dynamic data as compared with static data because of computational limitations and data difficulties but working on dynamic data can be vast valuable and more meaning.
In [5], They demonstrated a CSL recognition system based on the portable and inexpensive Leap Motion sensor and the KNN. They used a Leap Motion controller to capture 3D gesture data at 120 frames per second, detecting and tracking fingers’ hand movements with millimeter-level precision. It transmits data from the fingers and hands to the computer using a right-handed Cartesian coordinate system and a USB connection. Then, using KNN, they proposed a workable CSL recognition method.
SLR has two sub-problems: isolated SLR, which recognizes words one by one, and continuous SLR, which translates full phrases [6]. They presented the “Hierarchical Attention Network with Latent Space (LS-HAN),” a new constant sign appreciation system that avoids temporal breakdown preprocessing. Their model consists of three core elements: a two-stream CNN responsible for producing video feature representations, a Latent Space intended to bridge the semantic gap, and a Hierarchical Attention Network tailored for recognition using the latent space.
In their research, as described in [7], they introduced an approach that combines the Transformer model with reinforcement learning to perform continuous SLR. The Transformer employs an encoder-decoder architecture, where the encoder network transforms the sign video into a contextual vector representation, and the decoder network sequentially generates the target sentence, word by word, utilizing this context vector. Initially, a 3D CNN was utilized to extract visual details from the sign videos. Second, they translated sign videos into text sentences using a strong neural machine translation model.
Sugandhi et al. [8] worked on translating English text into Indian SL. The research described in [9] involves various components, including an ISL (International Sign Language) parser, the Hamburg Notation System, the Signing Gesture Mark-up Language, and 3D avatar animation. These components collectively contribute to the generation of SL using ISL syntax. The findings revealed that the proposed approach is highly efficient and gets an average accuracy score of 95%. The proposed system’s performance was further assessed using the BEU score, which yielded a 0.95 accuracy.
In PSL, as discussed in [10], translation models were developed for translating English into PSL. The study aimed to create a grammar-based machine translation model that could effectively convert English sentences into equivalent PSL sentences. This endeavor involved the creation of a sentence-level corpus comprising 2000 sentences encompassing various English sentence variations. Each English sentence in this corpus was meticulously translated into PSL with the assistance of native signers. The grammatical structure of PSL was formally documented, and a systematic approach combining data collection, analysis, and the development of grammar rules was employed to define PSL’s grammar using Context-Free Grammar representation, facilitating the textual representation of PSL sentences. A rule-based machine translation methodology was proposed to translate English text into PSL. This process involved morphological, syntactic, and semantic analysis of the English sentence to be translated into PSL, ensuring that the machine translation system generated phrases that adhered to the structure and syntax of the PSL language. Finally, the translation system was evaluated by two topic experts and deaf participants, and it achieved a BLEU score of 0.78 according to the evaluation, demonstrating its effectiveness in translating English into PSL.
Much existing literature highlights the challenges of bridging the communication gap forPakistan’s deaf community, and they put forth a framework based on information technology to outline the critical components required for creating applications that could facilitate communication between individuals who are deaf and those who can hear. To enable the Pakistani deaf community to interact and utilize information sources, the following primary issues must be addressed:
• Linguistic knowledge is scarce. PSL has not been thoroughly examined from a linguistic standpoint.
• Lack of a Standard Sign corpus based on several linguistic granularity units.
• There are no conventional grammar rules for constructing sentences in PSL.
• There is no sign writing indication for PSL.
• Automating everything necessitates assessment, and there is no evaluation corpus to test the systems.
In [6], researchers presented an intelligent SL number detection system using machine learning techniques based on electronics. At the same time, references [7] and [11] used machine learning classification techniques for American SL alphabet detection.
The research is solely based on the advancement of PSL, research in the field, and investigating the potential of deep learning and machine learning methods on SL image datasets, notably the CNN approach. Regarding the research goal, we are contributing by comparatively analyzing the baseline machine learning classification algorithms with deep learning algorithms on the PSL dataset, proposing UrSL-CNN, a CNN-based SL image classification architecture. It comparatively analyzes the PSL dataset with the American SL dataset on the proposed UrSL-CNN architecture.
CNNs have accomplished several advances as a basic deep learning technique, specifically for image classification-related problems like object detection and recognition. Further, CNN is comprised of less preprocessing than other deep learning algorithms for image classification. The neural network understands the filters manipulated manually in different classifications. One of the major benefits of CNN is that it downgrades the images into an easier structure to process while preserving the features that are necessary for giving predictions accurately. If we consider the basic structure of CNN, then CNN is divided into four operations: convolution, pooling, flattening, and fully connected layers. As far as the based system is concerned, the different researchers have used a variety of sequence numbers for each operation to generate a unique one that can outperform the state-of-the-art systems. The conventional structure of CNN is given in Fig. 1 [12].
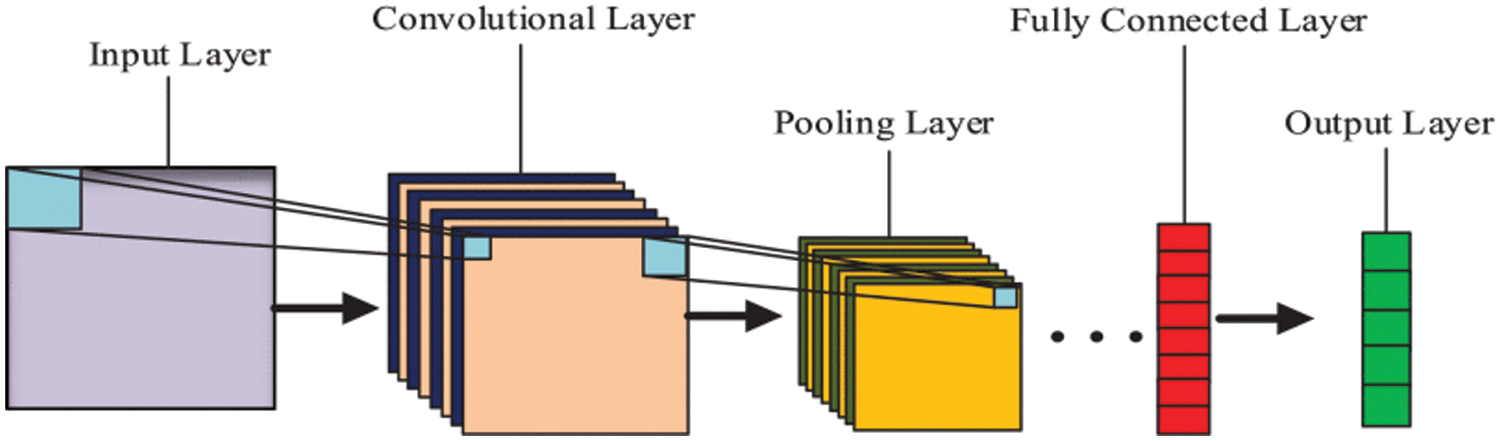
Figure 1: Conventional structure of convolutional neural network model [12]
If we have a square neuron layer with dimensions N × N, followed by our convolutional layer, and we employ an m × m filter ω, the output size of our convolutional layer will be (N − m + 1) × (N − m + 1). To calculate the input before applying nonlinearity to a particular unit
Regarding the proposed methodology, we have divided it into two parts: data description and proposed architecture. The data description and architecture are described below.
We utilized datasets for both UrSL and English SL. We used the English SL dataset to validate and compare our own dataset. To align with the ASL_Sign_Data, the English SL dataset, our research work decided to structure the dataset accordingly. In this dataset, each element is designated as either a training or a test case. The labels range from 0 to 37 for Urdu, corresponding to all the alphabets from Aliph to Yeh, and from 1 to 26 for English, covering the letters A to Z. This labeling system creates a consistent mapping between Urdu and English alphabets. The PSL_Alphabets dataset is a publicly available SL dataset containing 40 images for each Urdu alphabet, totaling 1500 images. Further, the ASL_Sign_Data is the dataset of English sign alphabets, which has 78,000 total images of the English alphabet. The dimension of each image in the dataset is 64 × 64. Further, to address the concern of potential bias introduced by the vastly different sizes of the datasets used in our study (1500 images for the Urdu alphabet dataset and 78,000 images for the English alphabet dataset), we took several steps to ensure fair comparison and minimize the impact of dataset size on our results. Firstly, we balanced the class distribution within each dataset to ensure that each alphabet had an equal representation. Additionally, we used appropriate evaluation metrics that are robust to class imbalance, such as F1-score and precision-recall curves. Furthermore, we employed data augmentation and regularization techniques to prevent overfitting on the larger dataset. These measures ensured our results were reliable and not skewed towards the larger dataset.
The datasets are pre-processed as all images of respected alphabets are first converted to alphabets using a label encoder. Then, data is converted into testing and training using the (70–30) formula, where 30 percent of data is used for training and 70 percent for testing. A sample of UrSL alphabets is given in Fig. 2 [13].

Figure 2: Samples of Urdu sign language alphabets [13]
Firstly, we trained both datasets on machine learning models, SVM, Gaussian Naïve Bayes, and KNN. Later on, we proposed a based model, UrSL-CNN, which outperformed in comparison with machine learning models.
3.2 Proposed UrSL-CNN Architecture for Sign Language Classification
We have designed the UrSL-CNN model to get the best possible results by keeping previous systems and basic CNN structure in mind. The proposed architecture consists of 5 steps: Step 1, First convolution layer; Step 2, Pooling; Step 3, Second convolution layer and third convolution layer, step 4, Flattening; and Step 5, Full connections. Each of the steps is explained below:
Step 1: In any CNN-based architecture, the convolutional layer plays a vital role in the major computational portion and bears most of the network’s load. If we are in the further depth of the convolutional layer, it works on matrices where it does dot product. The Matrices are also known as kernels, which are learnable parameters. If we use a hand gesture image example in UrSL-CNN, the kernel is not the matrix of the full image but is a set of matrices, and each matrix is a small portion of an image considered a kernel. All images always comprise three main RGB components in CNN: the kernel depth, width, and height. In the first convolutional layer, we pass input images of size 50 × 50. The activation function we have used throughout our architecture is ReLU. The first convolutional layer performs compaction on matrixes of image data, where after extracting features, it passes the output of the layer to the nextmost layer.
Step 2: In UrSL-CNN, the second layer is max pooling. In the broader context, pooling can be categorized into two primary types: max-pooling and min-pooling. The max-pooling is used where we need the larger value in any of the feature maps, while, unlike max-pooling, the min is used to get the minimum value in any given feature map. In our architecture, we used max-pooling because we needed a larger value in the given feature map. The max pooling is used here to avoid overfitting and getting the abstraction form of our given representation from layer 1.
Step 3: After applying max pooling, we got the computed matrices for further convolution. This second convolutional layer performs dot product operation as in the first layer for further feature extraction. After performing convolutional, we did drop out of giving 0.5 value and ReLU as an activation function. Dropout in CNN is used to prevent overfitting or nullifying some of the features we don’t want to use for further work. The ReLU activation function is widely used in CNN, where we want to activate all the neurons simultaneously in a layer. In UrSL-CNN, dropout is used to nullify the features of background and features other than hand gestures in sign image data input. After the dropout process, we gave that out to the pooling layer, and the pooling layer forwarded output to the 3rd convolutional layer to extract features based on an output of dropout. As explained in the first, we used ReLU in all of the layers of our architecture, so in the third convolutional layer, we used the activation function ReLU. We applied pooling after 3rd convolutional layer, too, as described in Fig. 3.

Figure 3: Proposed UrSL-CNN architecture for sign language classification
Step 4: The fourth step is one of the common steps in any CNN architecture. In this step, we added flatted to convert all the output features into a single long vector of point 3136 and forwarded that to the dense layer.
Step 5: This is the final step of UrSL-CNN architecture, where we added a dense layer, applied dropout, and a final dense layer to get the input number of classes form. In the final dense layer, we did different experiments on different optimizers and suggested softmax activation for the best possible results. Fig. 3 shows the description of the UrSL-CNN model.
Regarding the different results, we applied both English_alphabets and Urdu_alphabets datasets on machine classification algorithms as baseline methods. We first analyzed the results on baseline methods and then moved to UrSL-CNN-based architecture for comparatively better results.
When assessing how well a classification model performs, standard metrics such as precision, recall, F1-score, and accuracy come into play. These metrics hinge on the values of True Positive (TP), True Negative (TN), False Positive (FP), and False Negative (FN). These metrics provide valuable insights into the classification model’s performance by assessing its ability to correctly classify samples from both the positive and negative classes [14]. The performance metrics we used in the baseline and proposed models are explained below.
It can be defined as the proportion of true positive values divided by the sum of true positive and false positive values. In other words, its values go higher if values truly predicted go up. The precision value can reach a maximum of 1, which is 100% accuracy [15]. It is a positive predictive value. The formula for precision is shown below:
Recall, which is also known as sensitivity or the true positive rate, is computed by taking the ratio of true positive values to the sum of true positive and false negative values. In essence, when the recall value is lower, it indicates a higher number of instances incorrectly predicted as negative, underscoring the model’s capacity to identify positive cases [16]. The formula for the recall is shown below:
The F1-score is a metric based on both recall and precision; its value becomes 1 when we have a precision and recall value at 1. So, the higher the precision and recall, the higher the F1-score [17]. The formula F1-score is shown below:
Classification accuracy is a simple and intuitive metric calculated as the ratio of correct predictions to the total number of predictions. This value is typically multiplied by 100 to present it as a percentage. It provides a basic measure of a model’s ability to make correct predictions in a classification task. We used the sci-kit-learn module to compute the accuracy of each model [18,19].
In our machine learning algorithms, we employed several baseline methods, including SVM, Gaussian Naïve Bayes, RF, and the KNN algorithm. Each baseline model was assessed based on various performance metrics such as precision, recall, and F1-score to evaluate their effectiveness. Further, each baseline model was validated using a cross-validation technique at ten validation counts.
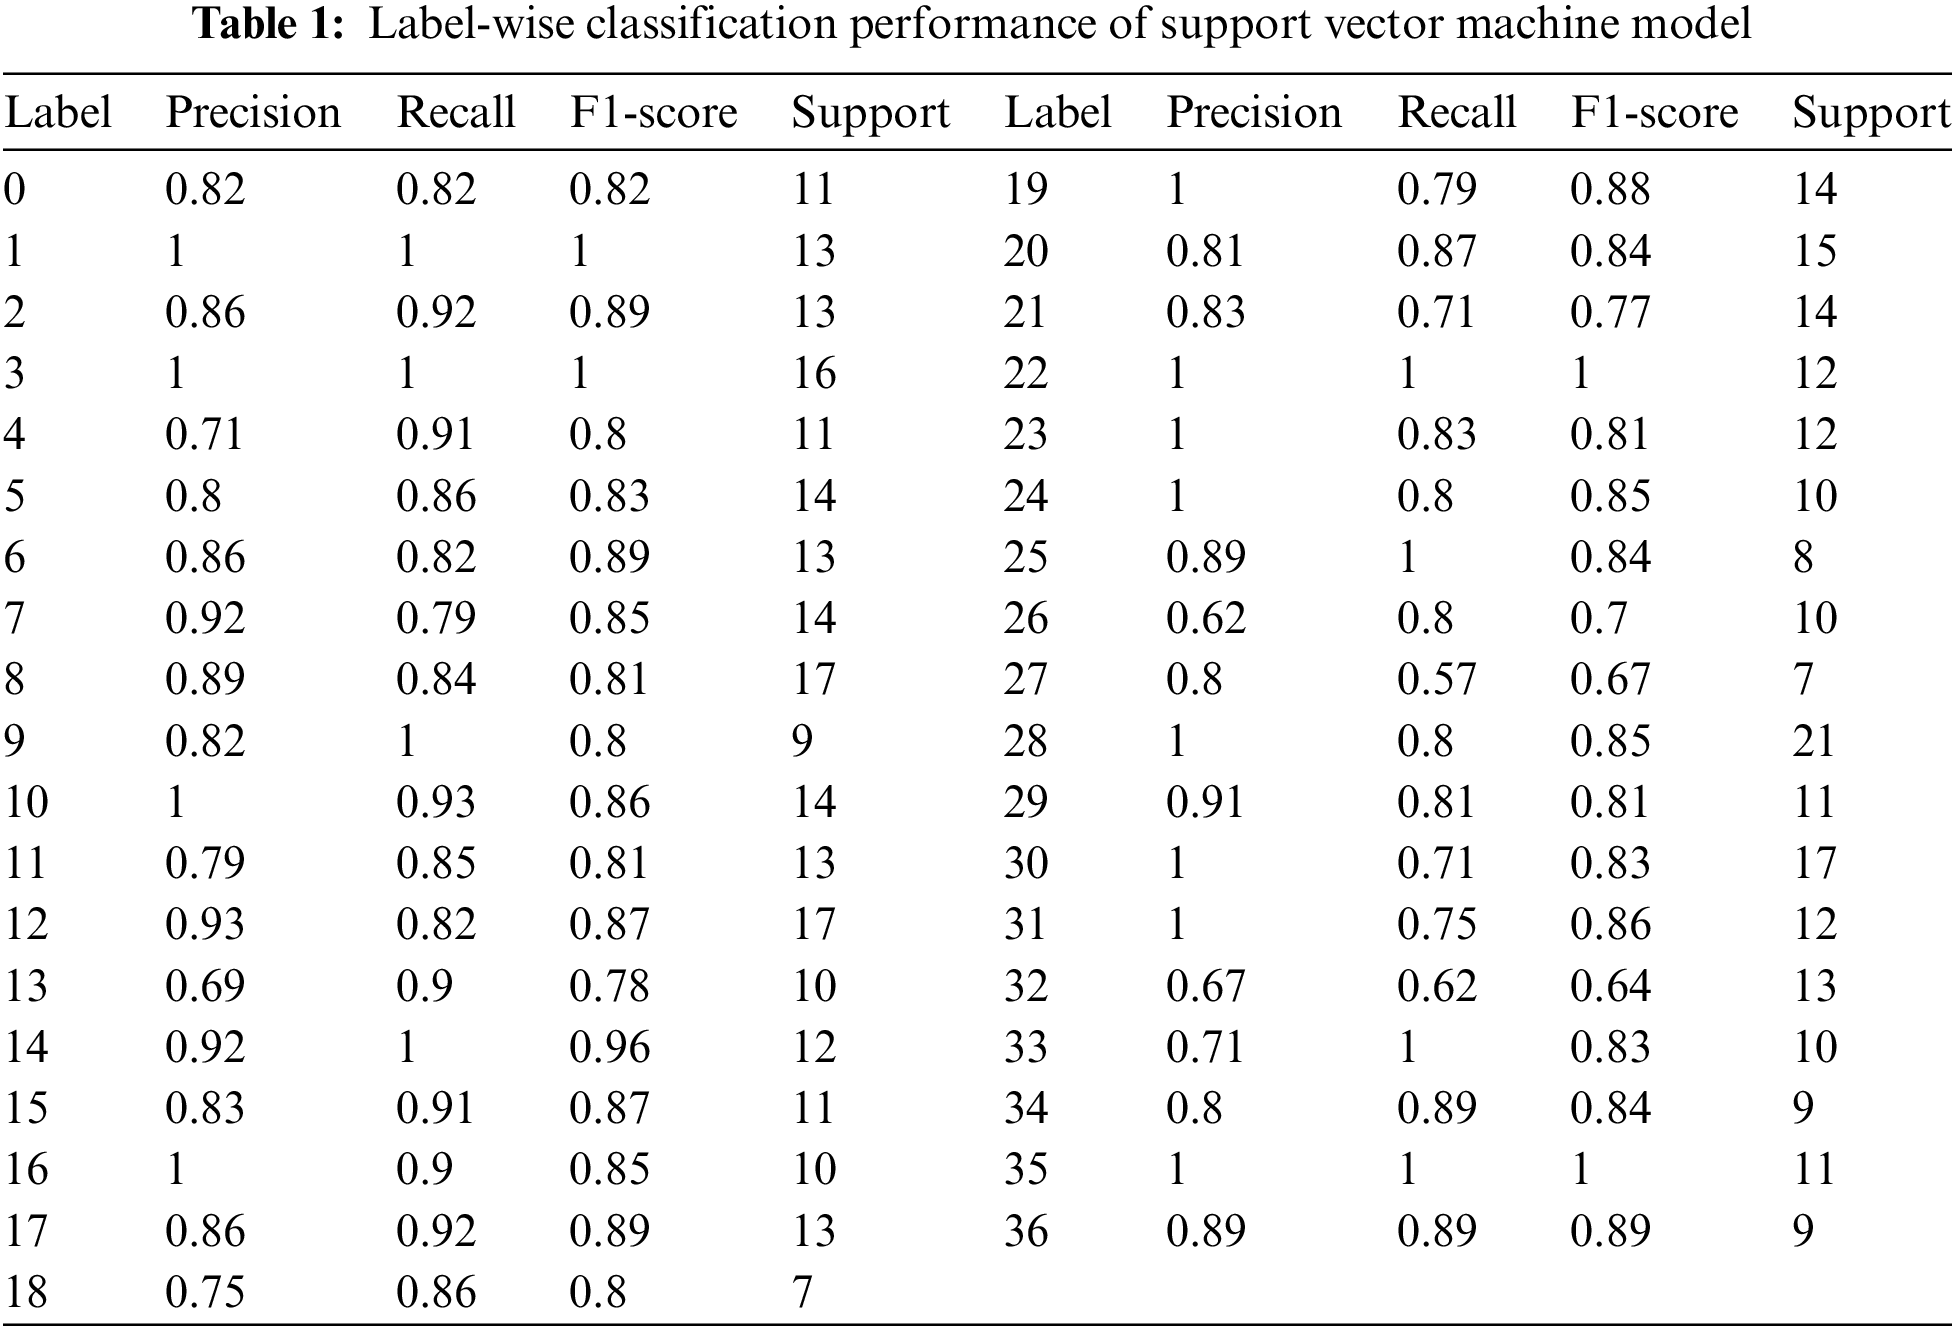
SVM is a sophisticated supervised method that can handle classification and regression tasks, while it is more effective for the latter. It can manage numerous categorical and continuous occurrences. It depicts the items or records from the dataset, each with “n” attributes, represented as points in an n-dimensional space divided into classes by the clear separation attainable, known as the hyperplane. Then, data pieces are mapped into the same n-dimensional space to obtain a guess of the category to which they should be assigned based on which side of the hyperplane they fall [20]. We applied SVM using a linear kernel with a max iteration count of 1000. The result on each label is shown in Fig. 4 and Table 1, where the classification report is shown in terms of precision, recall, and F1-score.
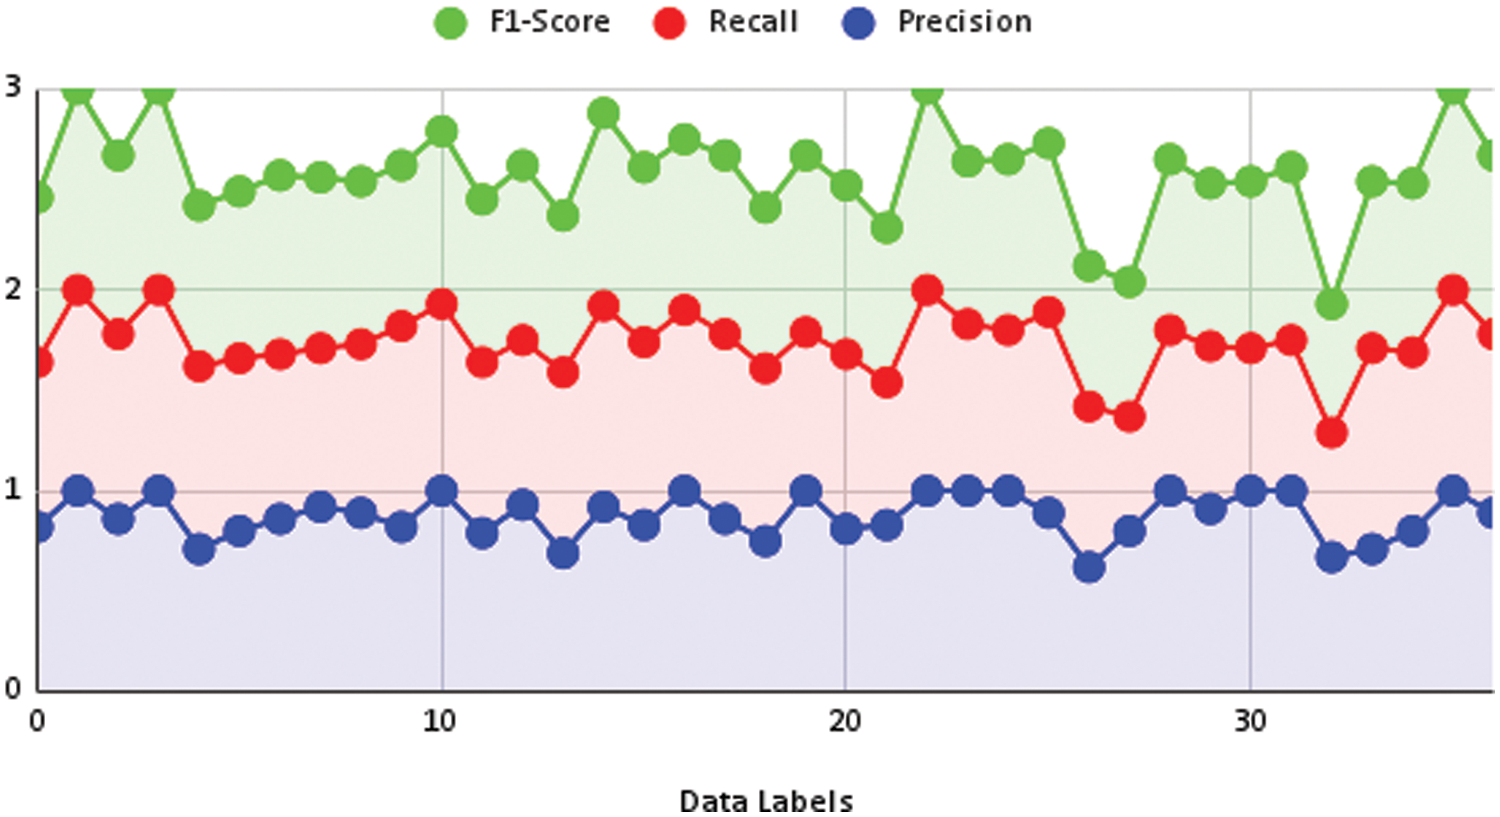
Figure 4: Performance measure achieved by SVM
Further, we used cross-validation with ten cross-validation counts. The cross-validation results are shown in Fig. 5. The maximum accuracy of got at cross-validation is 0.83. While testing sample data, the model’s accuracy is 0.81.

Figure 5: Accuracy vs. cross-validation of SVM
The Naïve Bayes algorithm works on probabilities, generating the highest probability for each class label based on the data. It is primarily used for classification tasks and is based on Bayes’ Theorem. Gaussian Naïve Bayes is an extension that uses Gaussian probability. The algorithm assumes features are independent, making it efficient for datasets with multiple independent features [9].
We applied Gaussian Naïve Bayes without using prior probabilities and var_smoothing of 0.2. The result on each label is shown in Table 2 and Fig. 6, where the classification report is shown in terms of precision, recall, and F1-score. Further, we used cross-validation with a ten cross-validation count. The cross-validation results are shown in Fig. 7. The maximum accuracy of got at cross-validation is 0.76. While testing sample data, the model’s accuracy is 0.75.
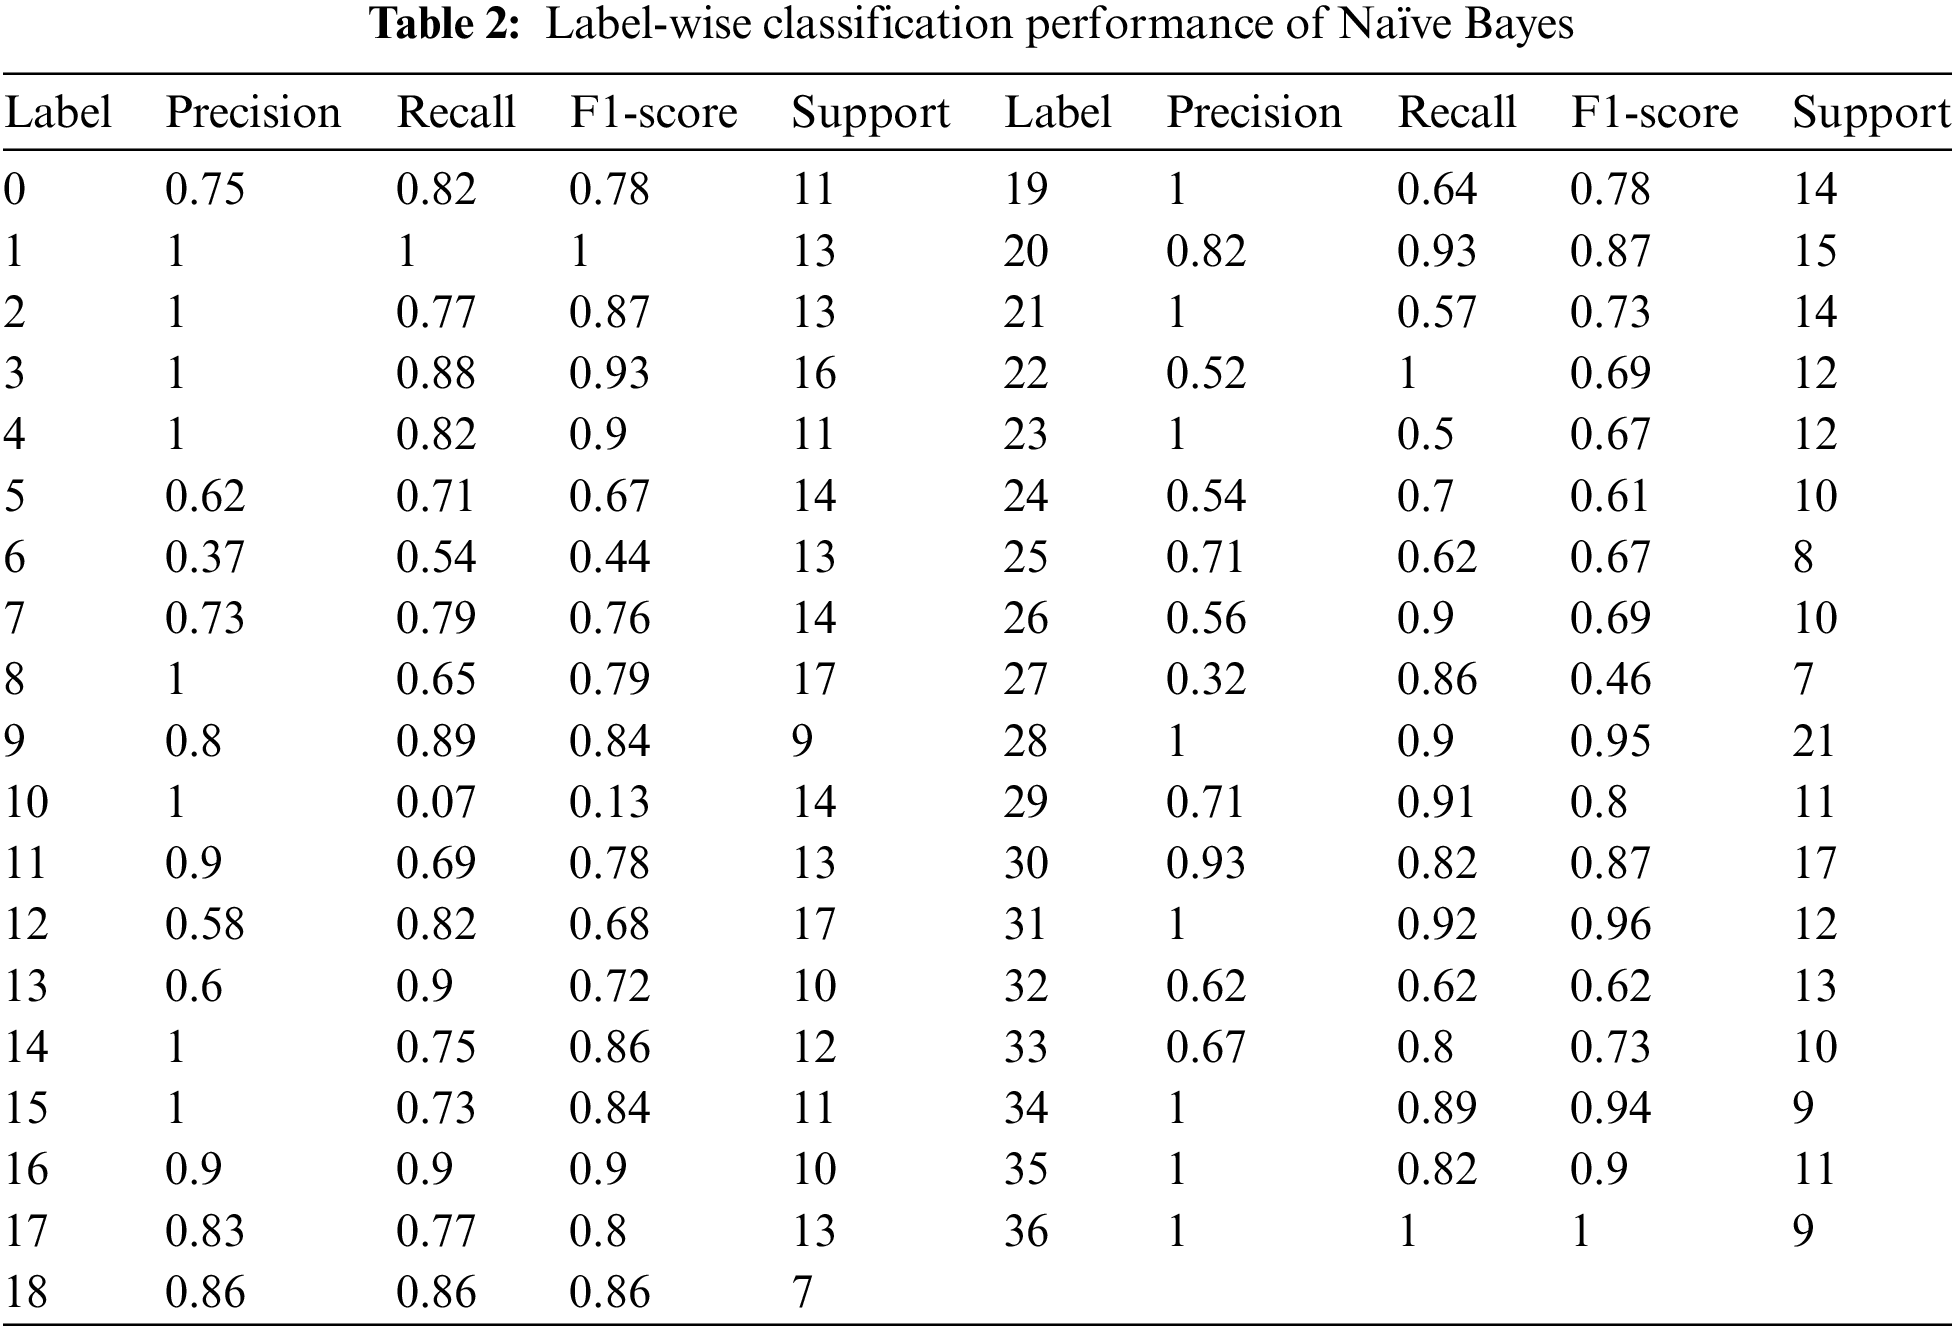

Figure 6: Performance measure achieved by Naïve Bayes

Figure 7: Accuracy vs. cross-validation of Naïve Bayes
RF is a widely used supervised classification of machine learning and a regression algorithm. It works on a decision tree. It works in a way that creates decision trees for each of the samples and takes most of the votes for classification. In the case of regression, it uses average. The RF algorithm is versatile in its ability to handle datasets containing both continuous variables, such as those in regression tasks, and categorical variables, typically seen in classification tasks. It possesses several key attributes that contribute to its superior performance, particularly in classification problems.
We applied RF at a maximum depth of 5. The results on each of the labels are shown in Table 3 and Fig. 8 shows classification reports regarding precision, recall, and F1-score. Further, we used cross-validation with a 10-fold cross-validation count. The cross-validation results are shown in Fig. 9. The maximum accuracy of got at cross-validation is 0.73. While testing sample data, the model’s accuracy is 0.88.
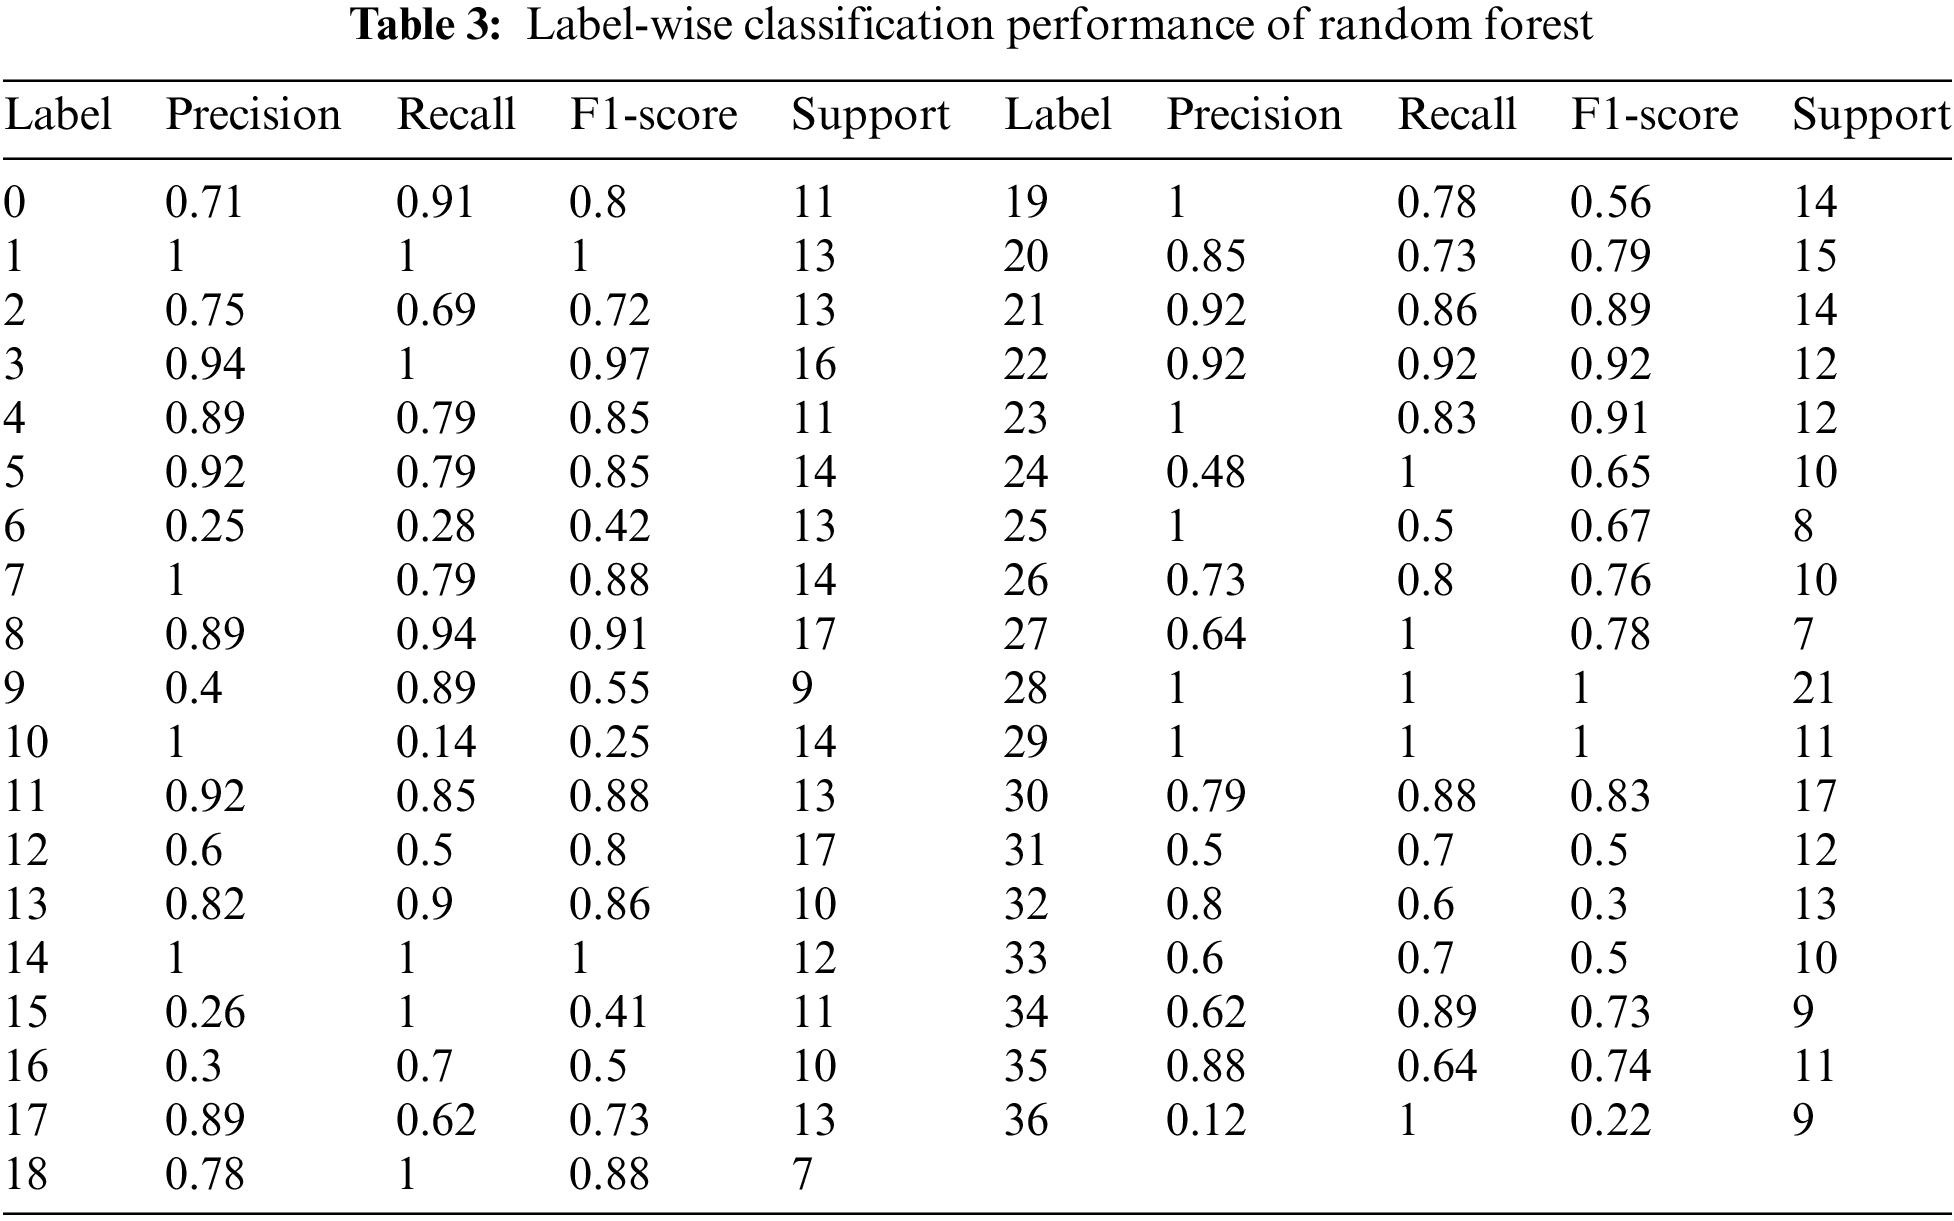

Figure 8: Performance measure achieved by random forest

Figure 9: Accuracy vs. cross-validation of random forest
4.2.4 K-Nearest Neighbors’ Algorithm (KNN)
It is a non-parametric, supervised machine learning classifier that employs an approach to classify or anticipate how a single data point will be grouped. Although it can be used for classification or regression issues, it is mainly applied as a classification algorithm because it primarily depends on the phenomenon that comparable points can be identified close to each other. A class label is selected for categorizing the problems based on most votes. This means the meaning is only articulated around a particular data point, technically known as “plurality voting.” We applied KNN at a total nearest-neighbors of 8. The result on each label is shown in Table 4 and Fig. 10, where the classification report is shown in terms of precision, recall, and F1-score. Further, we used cross-validation with a 10-cross-validation count. The cross-validation results are shown in Fig. 11. The maximum accuracy attained at cross-validation is 0.73. While testing sample data, the model achieves an accuracy of 0.68.
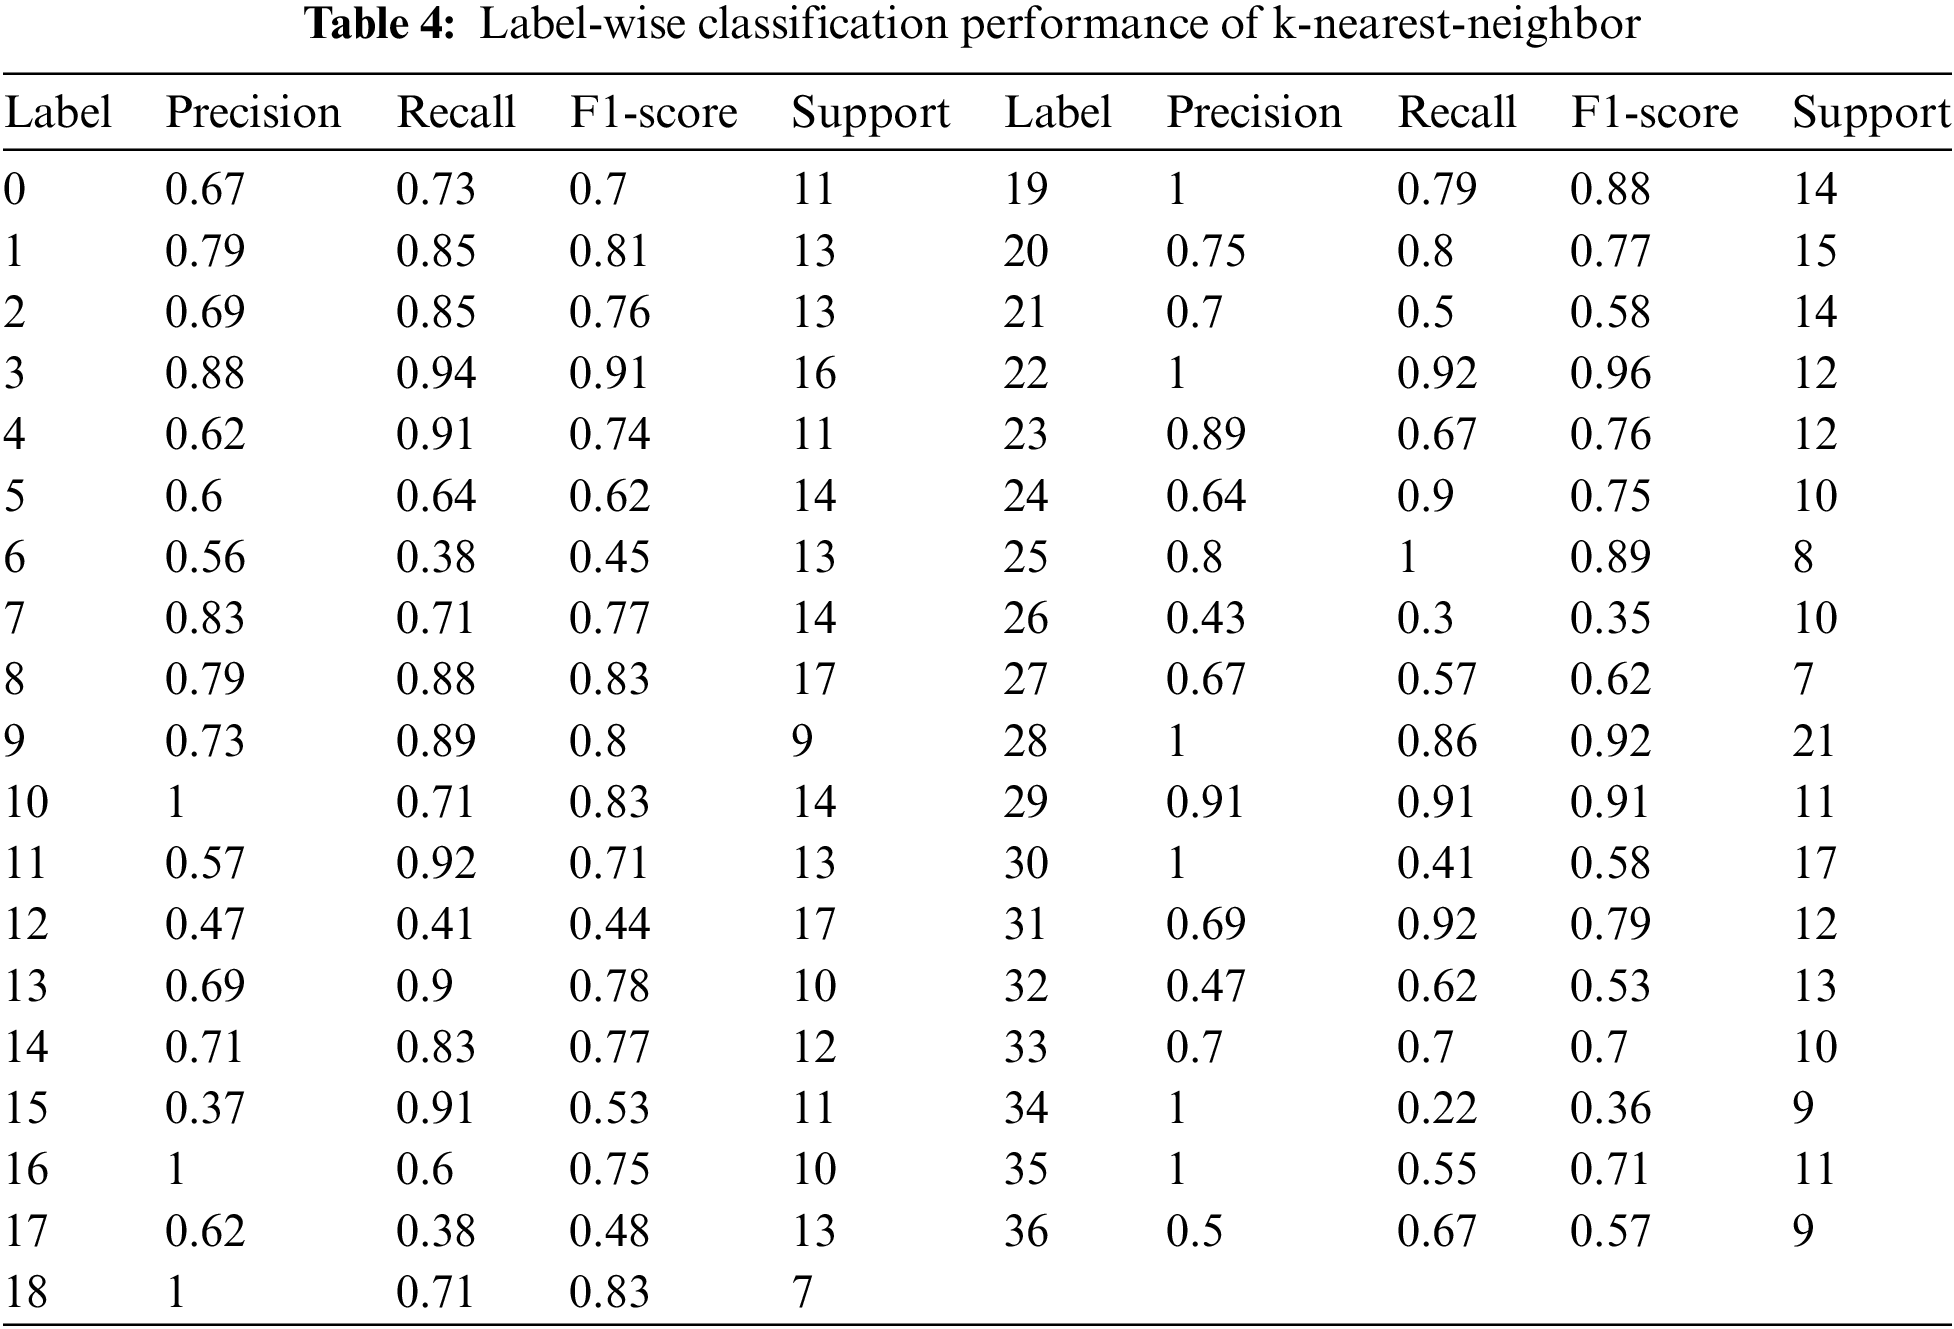

Figure 10: Performance measure achieved by k-nearest-neighbor

Figure 11: Accuracy vs. cross-validation of k-nearest-neighbor
The accuracy of machine learning algorithms on the UrSL dataset is shown in Fig. 12 and Table 5. The accuracy of English alphabets dataset accuracy is shown in Fig. 13 and Table 5. We got the best accuracy of RF in comparison with other baseline models like SVM, Naïve Bayes, and KNN. We also compared the results of both of the datasets and proposed that among baseline models RF performed best in boss cases.

Figure 12: Accuracy comparison of several machine learning algorithms on the Pakistan sign language dataset
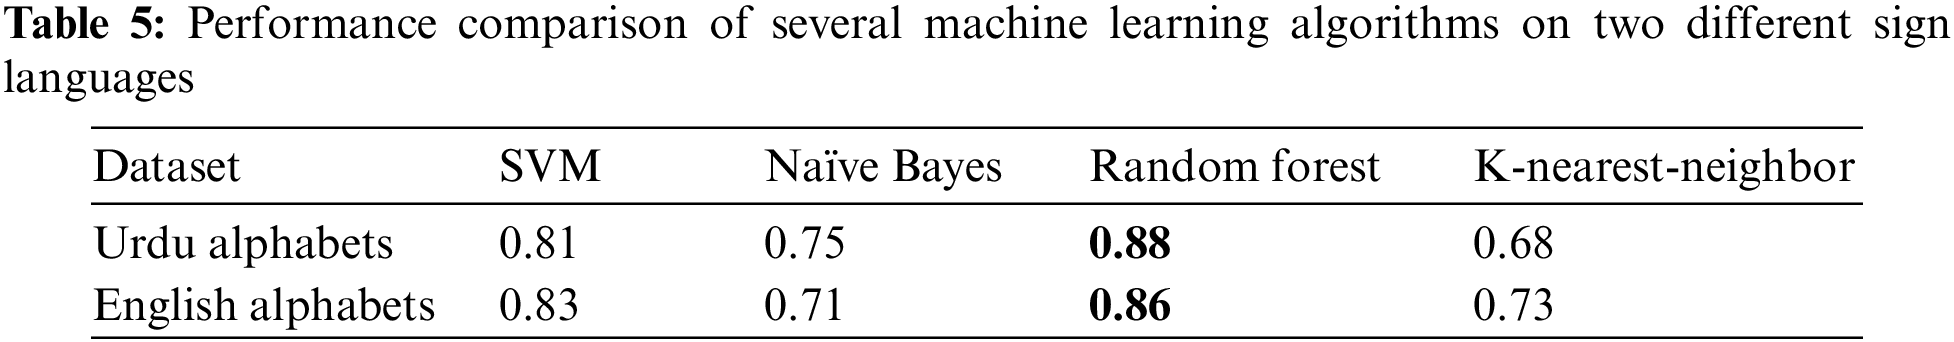
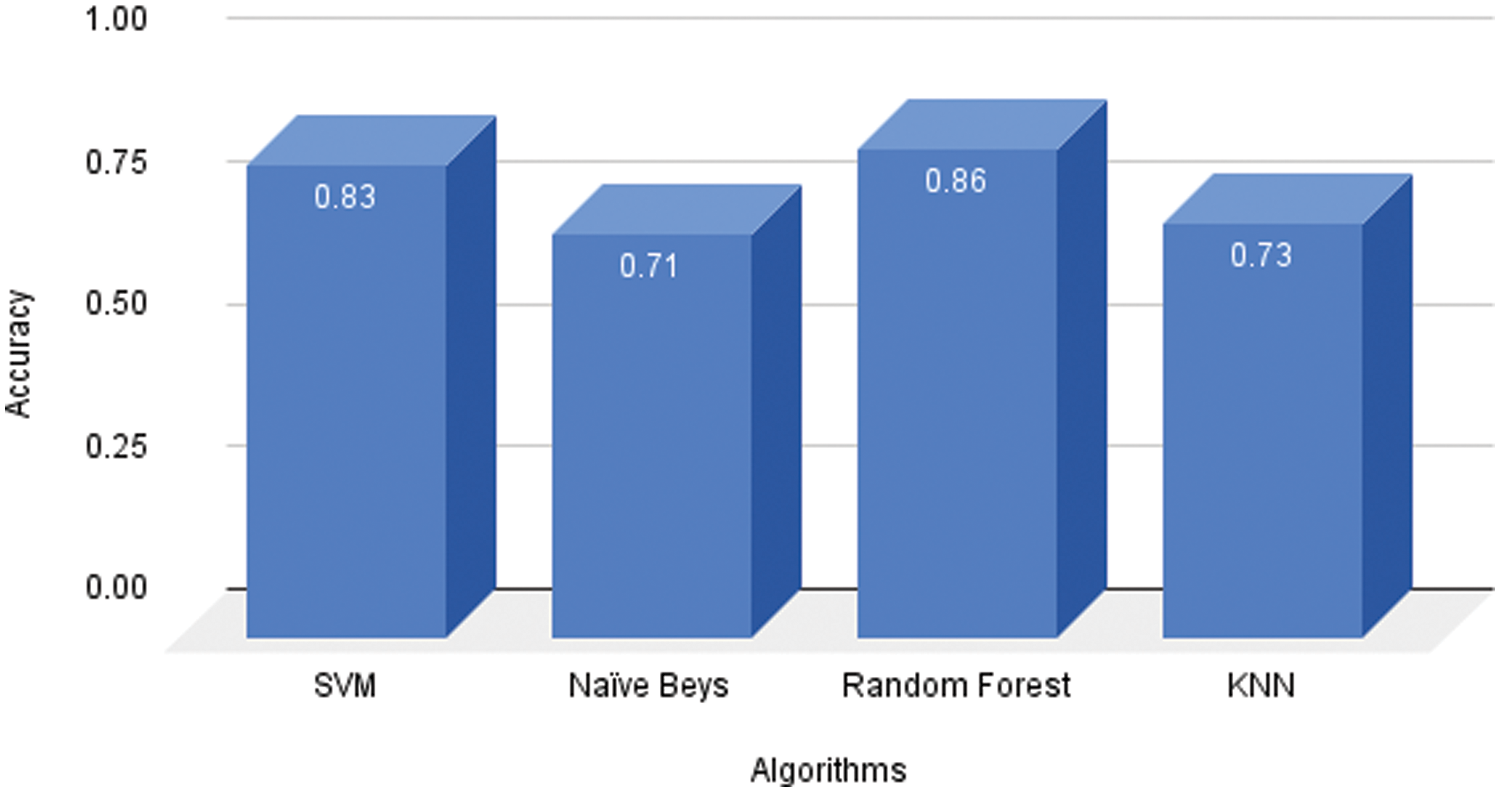
Figure 13: Accuracy comparison of several machine learning algorithms on the English sign language dataset
Furthermore, we assessed the model’s performance by calculating Matthew’s correlation coefficient. Matthew’s correlation coefficient is generally used in classification-related problems to measure the quality classifications in both binary and multiclass classification cases. A coefficient value of 1 signifies a perfect classification, with values always falling between −1 and +1. In our testing data, we achieved a Matthew’s correlation coefficient of 0.92. In summary, after our comparative assessment of machine learning and deep learning algorithms, it is evident that the proposed UrSL-CNN architecture delivered superior results. Furthermore, we conducted experiments using various optimizers on the UrSL-CNN architecture, and details are depicted in Fig. 14 and Table 6.

Figure 14: Accuracy comparison of several optimizers exploited in the proposed scheme for label classification in the Pakistan sign language dataset
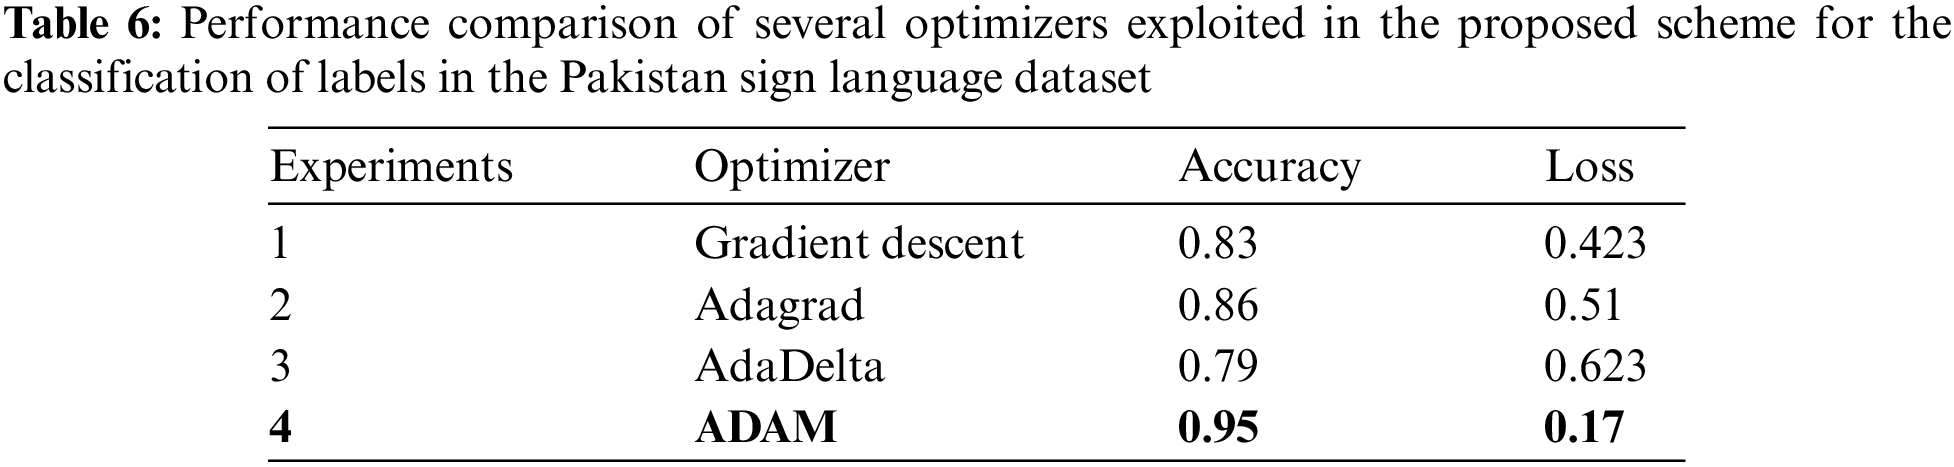
In all four experiments, we differentiated by using different optimizers while the remaining parameters were the same. The image size of the data was 50 × 50 in each of the experiments. In convolutional layers, the parameters were (50 × 50 × 32), (25,25,32), (13,13,64) in convolutional layers 1, 2 and 3, respectively. The changing optimizer had a huge impact on the value of accuracy.
Firstly, we used gradient descent. In the gradient descent optimizer, we got 0.83 accuracy and 0.423 loss. Gradient descent works on a local minimum and local maximum basis.
Secondly, we used Adagrad. In Adagrad optimizer, we got 0.86 accuracy with 0.51 loss. The gradient-based optimization algorithm Adagrad accomplishes this by customizing the learning rate for the model parameters. It ensures that smaller updates are applied to parameters linked to frequently encountered features while larger updates are assigned to those associated with less common features.
Thirdly, we employed the AdaDelta optimizer, which yielded an accuracy of 0.79 along with a loss of 0.623. AdaDelta, an extension of Adagrad, is designed to mitigate the aggressive, continuously decreasing learning rate. Instead of aggregating all previously squared gradients, AdaDelta restricts the window of accumulated prior gradients to a specific size. This modification plays a crucial role in enhancing the stability of the learning process.
In the end, we implemented the Adaptive momentum estimation (ADAM) optimizer, which yielded the highest level of accuracy. We got 0.95 accuracy with 0.17 loss using the ADAM optimizer. It is also one of the methods that compute adaptive learning rates. Like AdaDelta, ADAM preserves an exponentially decaying average of previous squared gradients but also stores an exponential.
The UrSL-CNN architecture was recommended based on a series of experiments conducted on it. The experiments are performed on different epoch counts and different activation functions. The experiment where we propose UrSL-CNN architecture is based on an Adam optimizer with categorical cross-entropy loss. The best accuracy we got was 0.95. The loss evaluation, involving both the loss and val_loss, is visually presented in Fig. 15. The accuracy evaluation containing accuracy and val_accuracy at 30 epochs is given in Fig. 16.

Figure 15: Loss curves of the proposed UrSL CNN model on the Pakistan sign language dataset

Figure 16: Accuracy curves of the proposed Ur-SL CNN model on the Pakistan sign language dataset
Further, we assessed the model by generating a classification report, which includes metrics such as precision, recall, and F1-score. These metrics provide a comprehensive evaluation of the model’s performance in classification tasks. Table 7 and Fig. 17 show the model’s classification report generated on UrSL-CNN architecture based on each label.
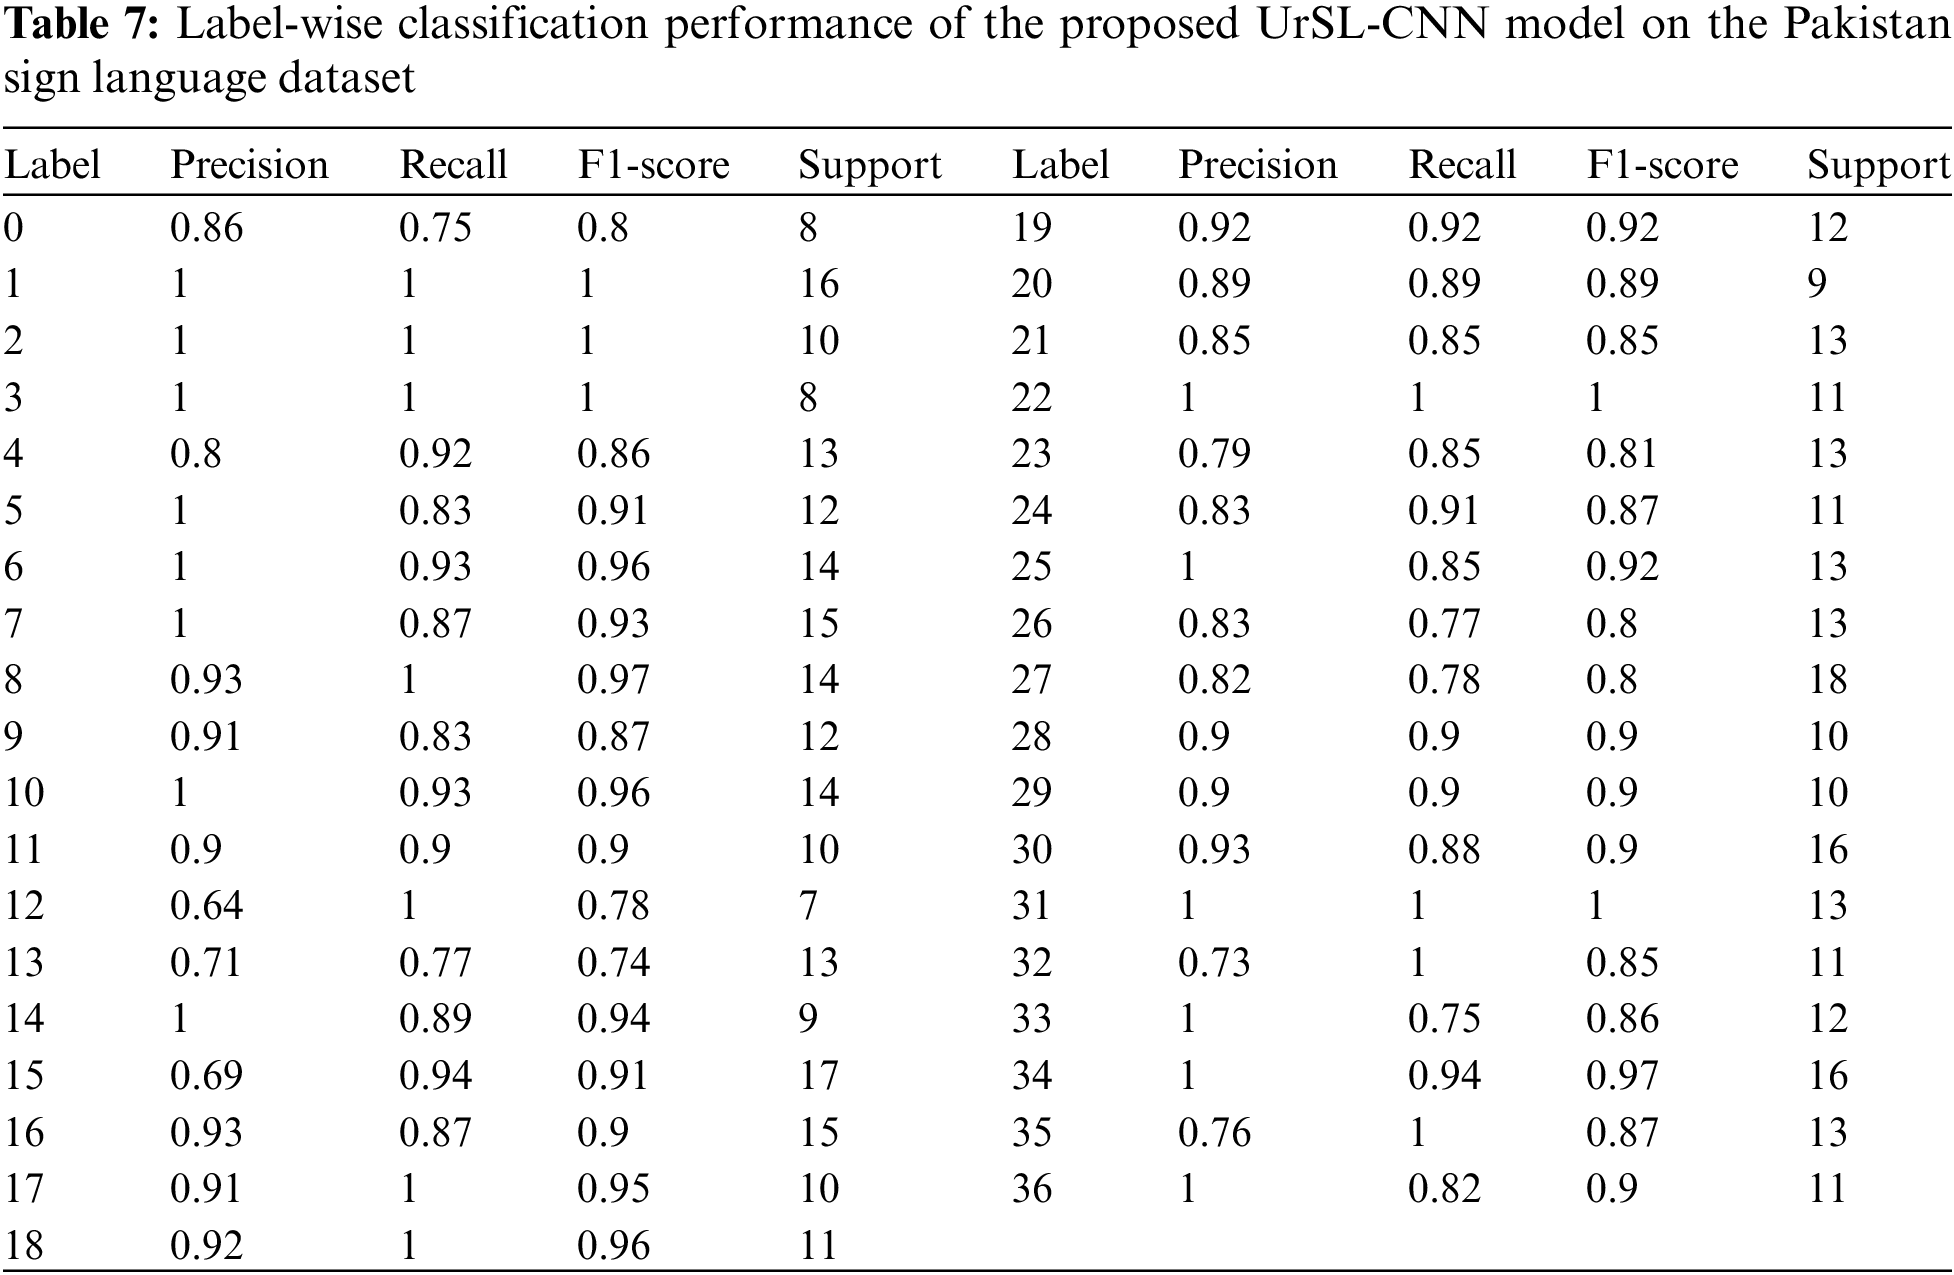

Figure 17: Performance measures achieved by the proposed UrSL-CNN model on the Pakistan sign language dataset
In Figs. 8, 10 and 17, we present the F1-score and recognition rate metrics together to provide a comprehensive view of the model’s performance. While these metrics serve different purposes, they are both important indicators of the model’s effectiveness in sign language recognition. The F1-score considers both precision and recall, providing a balanced measure of the model’s ability to correctly identify sign language gestures while minimizing false positives and false negatives. On the other hand, the recognition rate is a measure of the model’s overall accuracy in correctly classifying sign language gestures. By presenting these metrics together, we aim to provide a holistic understanding of the model’s performance across different evaluation criteria.
In the realm of recent research, deep learning has emerged as a powerful and widely adopted approach. Its significance becomes especially apparent when we contrast its achievements with those of conventional machine learning algorithms in the domain of automated analysis and recognition. In conclusion, our study highlights the superiority of deep learning, specifically the UrSL-CNN model, in automated analysis and recognition. In this research, we used two datasets: one for Urdu alphabet classification, which is the PSL dataset, and the other for the English SL dataset. We used this state of the dataset, which several researchers widely use to authenticate the proposed architecture. The major purpose of using the English alphabet dataset was to authenticate our proposed architecture and validate that the proposed architecture applies to any SL dataset irrespective of the dataset’s size. Further, we performed classification on machine learning algorithms to analyze comparatively because machine learning algorithms outperform when dataset size is not huge. However, in our case, we proved that our proposed model outperformed the machine learning algorithms by achieving a reliable accuracy of 0.95. Also, UrSL-CNN has outperformed on sign images of two languages, English and Urdu, and on the huge difference of dataset sizes, images of count 1500 and 78,000 in Urdu and English SL datasets, respectively. Through experiments on the PSL and English SL datasets, we validated the effectiveness of UrSL-CNN, achieving remarkable accuracy and outperforming traditional machine learning algorithms. Looking ahead, the horizon holds the promise of further enhancements and refinements for the UrSL-CNN architecture. These enhancements could open doors to bidirectional classification tasks, enabling the model to handle both image-to-text and text-to-image conversions. This expanded functionality would position the model as a versatile and indispensable tool for a wide array of SL applications in the future.
We recognize the importance of evaluating our model in real-world scenarios and integrating it into assistive technologies for practical use. To ensure its robustness and reliability in practical applications, we plan to conduct additional experiments to assess the model’s performance under varying conditions, such as different lighting, hand orientations, and occlusions. Furthermore, we are exploring deployment strategies prioritizing accessibility and user-friendliness, such as developing a mobile application and collaborating with relevant organizations. By addressing these aspects, we aim to enhance our model’s practical applicability and impact in improving communication accessibility for deaf individuals.
Acknowledgement: None.
Funding Statement: The authors received no specific funding for this study.
Author Contributions: The authors confirm their contribution to the paper as follows: study conception and design: Jawad Rasheed, Kamlish, Tunc Asuroglu, Shtwai Alsubai; data collection: Fazeel Abid, Jawad Rasheed, Kamlish, Shtwai Alsubai; analysis and interpretation of results: Khushal Das, Jawad Rasheed, Safeeullah Soomro; draft manuscript preparation: Khushal Das, Fazeel Abid, Jawad Rasheed. All authors reviewed the results and approved the final version of the manuscript.
Availability of Data and Materials: The data that support the findings of this study are available on request from the corresponding authors.
Conflicts of Interest: The authors declare that they have no conflicts of interest to report regarding the present study.
References
1. Abid K, Khan NS, Farooq U, Farooq MS, Naeem MA, Abid A. A roadmap to elevate Pakistan sign language among regional sign languages. South Asian Stud. 2018;33(2):461. [Google Scholar]
2. Khan NS, Abid A, Abid K, Farooq U, Farooq MS, Jameel H. Speak Pakistan: challenges in developing Pakistan sign language using information technology. South Asian Stud Res J South Asian Stud. 2015;30(2):367–79. [Google Scholar]
3. Ibrahim N, Zayed H, Selim M. Advances, challenges, and opportunities in continuous sign language recognition. J Eng Appl Sci. 2019;15(5):1205–27. [Google Scholar]
4. Jiang X, Satapathy SC, Yang L, Wang SH, Zhang YD. A survey on artificial intelligence in Chinese sign language recognition. Arab J Sci Eng. 2020 Dec 22;45(12):9859–94. [Google Scholar]
5. Xue Y, Gao S, Sun H, Qin WA. Chinese sign language recognition system using leap motion. In: 2017 International Conference on Virtual Reality and Visualization (ICVRV); 2017; Zhengzhou, China; IEEE. p. 180–5. doi:10.1109/ICVRV.2017.00044. [Google Scholar] [CrossRef]
6. Huang J, Zhou W, Zhang Q, Li H, Li W. Video-based sign language recognition without temporal segmentation. In: Thirty-Second AAAI Conference on Artificial Intelligence and Thirtieth Innovative Applications of ArtificialIntelligence Conference and Eighth AAAI Symposium on Educational Advances in Artificial Intelligence(AAAI'18/IAAI'18/EAAI'18); 2018; New Orleans, Louisiana, USA; AAAI Press. p. 2257–64. doi:10.5555/3504035.3504310. [Google Scholar] [CrossRef]
7. Zhang Z, Pu J, Zhuang L, Zhou W, Li H. Continuous sign language recognition via reinforcement learning. In: 2019 IEEE International Conference on Image Processing (ICIP); 2019; Taipei, Taiwan; IEEE. p. 285–9. doi:10.1109/ICIP.2019.8802972. [Google Scholar] [CrossRef]
8. Sugandhi, Kumar P, Kaur S. Sign language generation system based on Indian sign language grammar. ACM Trans Asian Low Resour Lang Inf Process. 2020 Jul 31;19(4):1–26. doi:10.1145/3384202. [Google Scholar] [CrossRef]
9. Kumar M, Gupta P, Jha RK, Bhatia A, Jha K, Shah BK. Sign language alphabet recognition using convolution neural network. In: 2021 5th International Conference on Intelligent Computing and Control Systems (ICICCS); 2021; Madurai, India; IEEE. p. 1859–65. doi:10.1109/ICICCS51141.2021.9432296. [Google Scholar] [CrossRef]
10. Khan NS, Abid A, Abid K. A novel natural language processing (NLP)–based machine translation model for English to Pakistan sign language translation. Cognit Comput. 2020 Jul 31;12(4):748–65. doi:10.1007/s12559-020-09731-7. [Google Scholar] [CrossRef]
11. Xia K, Lu W, Fan H, Zhao Q. A sign language recognition system applied to deaf-mute medical consultation. Sensors. 2022 Nov 24;22(23):9107. doi:10.3390/s22239107. [Google Scholar] [PubMed] [CrossRef]
12. Ashraf M, Geng G, Wang X, Ahmad F, Abid F. A globally regularized joint neural architecture for music classification. IEEE Access. 2020 Dec 7;1:220980–9. doi:10.1109/ACCESS.2020.3043142. [Google Scholar] [CrossRef]
13. Imran A, Razzaq A, Baig IA, Hussain A, Shahid S, Rehman T. Dataset of Pakistan sign language and automatic recognition of hand configuration of Urdu alphabet through machine learning. Data Brief. 2021 Jun;36:107021. [Google Scholar] [PubMed]
14. Flesca S, Mandaglio D, Scala F, Tagarelli A. Learning to active learn by gradient variation based on instance importance. In: 2022 26th International Conference on Pattern Recognition (ICPR); 2022; Montreal, QC, Canada; IEEE. p. 2224–30. doi:10.1109/ICPR56361.2022.9956039. [Google Scholar] [CrossRef]
15. Stoll S, Camgoz NC, Hadfield S, Bowden R. Text2Sign: towards sign language production using neural machine translation and generative adversarial networks. Int J Comput Vis. 2020 Apr 2;128(4):891–908. [Google Scholar]
16. Shi B, Brentari D, Shakhnarovich G, Livescu K. Searching for fingerspelled content in American sign language. In: Proceedings of the 60th Annual Meeting of the Association for Computational Linguistics; 2022; Stroudsburg, PA, USA; Association for Computational Linguistics.p. 1699–712. [Google Scholar]
17. Sharma P, Anand RS. A comprehensive evaluation of deep models and optimizers for Indian sign language recognition. Graph Vis Comput. 2021 Dec;5:200032. [Google Scholar]
18. Bull H, Gouiffès M, Braffort A. Automatic segmentation of sign language into subtitle-units. In: Bartolli A, Fusiello A, editors. Computer Vision–ECCV 2020 Workshops. Cham: Springer; 2020. p. 186–98. doi:10.1007/978-3-030-66096-3_14. [Google Scholar] [CrossRef]
19. Ayadi K, ElHadj YOM, Ferchichi A. Automatic translation from Arabic to Arabic sign language: a review. In: 2018 JCCO Joint International Conference on ICT in Education and Training, International Conference on Computing in Arabic, and International Conference on Geocomputing (JCCO: TICET-ICCA-GECO); 2018; Tunisia/Hammamet, Tunisia; IEEE. p. 1–5. doi:10.1109/ICCATICET.2018.8726197z. [Google Scholar] [CrossRef]
20. Bragg D, Koller O, Bellard M, Berke L, Boudreault P, Braffort A, et al. Sign language recognition, generation, and translation. In: The 21st International ACM SIGACCESS Conference on Computers and Accessibility; 2019; New York, NY, USA; ACM. p. 16–31. [Google Scholar]
Cite This Article
 Copyright © 2024 The Author(s). Published by Tech Science Press.
This work is licensed under a Creative Commons Attribution 4.0 International License , which permits unrestricted use, distribution, and reproduction in any medium, provided the original work is properly cited.
 Downloads
 Citation Tools