
 Submit a Paper
 Propose a Special lssue
 Open Access
ARTICLE

Anomaly Detection in Imbalanced Encrypted Traffic with Few Packet Metadata-Based Feature Extraction
1 Department of Financial Information Security, Kookmin University, Seoul, 02707, Republic of Korea
2 Department of Information Security Cryptography Mathematics, Kookmin University, Seoul, 02707, Republic of Korea
* Corresponding Author: Hwankuk Kim. Email:
(This article belongs to the Special Issue: Advanced Security for Future Mobile Internet: A Key Challenge for the Digital Transformation)
Computer Modeling in Engineering & Sciences 2024, 141(1), 585-607. https://doi.org/10.32604/cmes.2024.051221
Received 29 February 2024; Accepted 19 June 2024; Issue published 20 August 2024
 View Full Text
 Download PDF
Abstract
In the IoT (Internet of Things) domain, the increased use of encryption protocols such as SSL/TLS, VPN (Virtual Private Network), and Tor has led to a rise in attacks leveraging encrypted traffic. While research on anomaly detection using AI (Artificial Intelligence) is actively progressing, the encrypted nature of the data poses challenges for labeling, resulting in data imbalance and biased feature extraction toward specific nodes. This study proposes a reconstruction error-based anomaly detection method using an autoencoder (AE) that utilizes packet metadata excluding specific node information. The proposed method omits biased packet metadata such as IP and Port and trains the detection model using only normal data, leveraging a small amount of packet metadata. This makes it well-suited for direct application in IoT environments due to its low resource consumption. In experiments comparing feature extraction methods for AE-based anomaly detection, we found that using flow-based features significantly improves accuracy, precision, F1 score, and AUC (Area Under the Receiver Operating Characteristic Curve) score compared to packet-based features. Additionally, for flow-based features, the proposed method showed a 30.17% increase in F1 score and improved false positive rates compared to Isolation Forest and OneClassSVM. Furthermore, the proposed method demonstrated a 32.43% higher AUC when using packet features and a 111.39% higher AUC when using flow features, compared to previously proposed oversampling methods. This study highlights the impact of feature extraction methods on attack detection in imbalanced, encrypted traffic environments and emphasizes that the one-class method using AE is more effective for attack detection and reducing false positives compared to traditional oversampling methods.Keywords
With the advancement of mobile communication technologies such as 5G and the upcoming 6G, the connectivity of IoT devices is steadily increasing. Especially, IoT devices and sensors installed on vehicles [1], smart UAVs (Unmanned Aerial Vehicles) [2], smart infrastructure, and similar platforms may contain sensitive information. Therefore, using SSL/TLS is crucial in mitigating risks such as data exposure and man-in-the-middle attacks. According to Google’s transparency report, as of 18 February, 2024, the HTTPS traffic rate through Google for websites and services has reached 96%. Consequently, research on the utilization of SSL/TLS in mobile applications and web browsers is underway worldwide [3–5]. Additionally, IoT devices are also beginning to adopt SSL/TLS protocols.
However, there is concern that attackers could exploit the SSL/TLS protocol to perform attacks using hidden data on IoT (Internet of Things) devices that provide web-based services [6]. From a network security perspective, a significant issue with encryption protocols is the inability to view traffic payload data. Therefore, traditional rule-based attack detection and DPI (Deep Packet Inspection) techniques, commonly used for non-encrypted traffic, cannot be applied.
As a result, most SSL/TLS inspection solutions employ SSL/TLS proxy servers. Inspection through SSL/TLS proxy servers involves decrypting encrypted traffic, examining packet data, re-encrypting it, and forwarding it. However, this process raises concerns about privacy breaches. Additionally, decrypting and encrypting traffic can introduce overhead and affect network speed. Moreover, collecting encrypted traffic data in real-world environments poses challenges. The encryption of traffic poses challenges for data labeling, causing difficulties in data collection for ML/DL (Machine Learning/Deep Learning) model training.
Particularly in the case of IoT data, privacy concerns make data collection challenging [7]. This ultimately leads to imbalanced or insufficient training data, impacting the generalization and classification performance of the models. Efforts are being made across various fields to address this issue, including the utilization of data generation models [8] and model combination techniques.
To analyze encrypted traffic without decryption, researchers are approaching it from three main perspectives: (1) utilizing packet metadata, (2) utilizing encrypted payload-based feature extraction data, and (3) utilizing deep learning-based raw packet feature extraction data. Packet metadata involves extracting data from packet headers, similar to the analysis of non-encrypted data, to generate statistical features based on network behavior at the packet or flow level. Encrypted payload-based feature extraction involves methods using entropy [9] or vectorization with deep learning. Using raw packets themselves is mainly applied to service classification problems, often by vectorizing through DNS (Domain Name System) networks or transforming into images using convolutional neural network (CNN) models [10,11].
To analyze encrypted traffic without decryption, this paper compared two types of feature extraction methods using an autoencoder-based one-class anomaly detection (OC-AD) approach. Feature extraction involved using a small amount of packet metadata as learning vectors and summarizing a large amount of rows using a sliding-window algorithm. Additionally, to address the issue of class imbalance caused by a significantly larger amount of normal data, this paper adopted a method of training the Autoencoder using only normal data. Furthermore, in the feature extraction stage, this method did not use metadata representing specific node information such as IP and Port.
Especially, due to the limited number of nodes used in creating the training data, the dataset contains a small number of unique IPs and Ports, unlike real-world scenarios. Therefore, the model may suffer from bias towards the IPs and Ports present in the training data, making it unsuitable for real-world applications. Additionally, our proposed model uses the reconstruction error of the Autoencoder for anomaly detection, enabling an explanation of the reasons for anomalies detected. This addresses the issue of unexplainable decisions in traditional deep learning-based classification and anomaly detection models. The contributions of our work are as follows:
1. We propose an autoencoder-based one-class anomaly detection (OC-AD) model that learns only from normal data and utilizes the reconstruction error for explainable anomaly detection, tailored for environments with limited encrypted attack data.
2. The results demonstrate that when using a small amount of packet metadata for feature extraction, flow-based feature extraction methods are more effective for anomaly detection compared to packet-based methods.
3. Compare the differences in anomaly detection performance when using the same feature extraction method for two types of attacks targeting IoT devices with encrypted traffic.
4. When compared to previously proposed oversampling methods, the proposed model demonstrated greater effectiveness in both attack detection and reducing false positives.
2.1 Anomaly Detection Approaches
Statistical-based approach. This approach utilizes metadata obtained from packets to generate statistical features for model learning and detection.
Zhang et al. [12] focused their research on feature extraction and traffic clustering using a sliding window algorithm with traffic distribution data. Their study demonstrated the ability to obtain more clustering distribution features compared to traditional grid-based traffic clustering methods.
Yan et al. [13] demonstrated an effective classification of Tor network flows using time window-based flow segmentation and bidirectional statistical feature extraction. The classification obtained using packet length, fixed-length intervals, entropy, and similar parameters exhibited superior speed and recognition rates compared to deep learning methods.
Dahiya [14] demonstrated DDoS (Distributed Denial of Service) detection in 5G systems using only statistical features and showed up to a 22.73% improvement compared to traditional models. This research utilized higher-order statistical features, in addition to basic statistical metrics like mean, median, and standard deviation (SD). Furthermore, they proposed entropy features considering the relationship between data points.
Yang et al. [15] generated packet-level and flow-level features by utilizing packet metadata and flow metadata. It is noteworthy that they focused on considering both levels of network flow, employing a total of 249 statistical features. However, the sheer number of features may pose challenges in terms of resource consumption for data processing and storage, making it difficult to directly apply in the IoT field.
Applying the slicing window algorithm to network traffic data can better represent behavior compared to a mere sequence of consecutive packets. While the statistical characteristics of individual features are important, this algorithm is particularly useful for observing the overall behavior of network traffic.
Deep learning-based approach. This approach involves training models directly on data features through neural networks and being explored in various fields to enable models to extract and learn features directly from raw data without preprocessing [16].
In papers [10,11], 2D CNN models were utilized for service classification of encrypted traffic. While CNN-based methods are helpful for pattern extraction, they come with the drawback of requiring significant computing power or large memory space at once. To be practical, lighter feature extraction methods and utilization strategies are needed.
On the other hand, Fatani et al. [17] proposed a deep learning-based feature extraction and feature selection algorithm for intrusion detection and malicious identification in IoT environments. They employed a convolutional neural network (CNN) consisting of two 1D convolution layers and four fully connected (FC) layers to perform feature extraction from raw input packets.
Additionally, in the paper [11], 1D CNN was used for service identification of encrypted traffic. When compared to previous image-based research on various identification problems, their proposed model demonstrated superior effectiveness in identifying encryption types, Tor traffic types, and Non-VPN (Virtual Private Network) traffic types.
Autoencoder-based approach. In many cases, supervised learning-based algorithms have been widely used in traditional machine learning-based detection. However, labeling real-world encrypted data as normal or abnormal entails significant costs, making it challenging to collect and label data.
To address these limitations, research is being conducted on anomaly detection using Autoencoder deep learning structures with self-supervised learning algorithms. Yao et al. [18] performed unsupervised anomaly detection using feature extraction with Variational Auto-Encoder (VAE). They found that the VAE-based feature extraction method outperformed other methods, including Autoencoder (AE) and Kernel Principal Component Analysis (KPCA).
Ruikun et al. [19] proposed a method for determining discriminative thresholds using reconstruction errors by detecting the density of compressed features in the hidden layer of a Denoising Autoencoder. Despite employing a complex model, this method demonstrated superiority over other Autoencoder models.
Xu et al. [20] introduced an outlier removal method and compared the performance of reconstruction error functions to alleviate bias caused by data imbalance using a 5-layer Autoencoder. This led to improved anomaly detection performance on the NSL-KDD dataset.
Many studies utilize Autoencoders for data preprocessing. However, reference [19] standed out by utilizing the reconstruction error data generated during the training process of Autoencoders. The reconstruction error, which represents the difference between the data the model was trained on and the reconstructed data, can be crucial for anomaly detection.
2.2 ML/DL Training in Imbalanced Data
Oversampling approach. The most actively researched oversampling method involves using generative adversarial network (GAN)-based algorithms.
Papers [21–24] utilized GAN-based variant models to address imbalanced data. Well-designed GAN variant algorithms can effectively address issues caused by imbalanced data more efficiently than traditional oversampling techniques like the synthetic minority oversampling technique (SMOTE).
In paper [25], a method was proposed to control the data generation mode of Conditional GAN using application types of traffic to address the imbalance problem in encrypted traffic data. Although GAN-based algorithms demonstrate overwhelmingly superior performance among generative models, they may face issues with unstable data generation due to non-convergence oscillation or mode collapse during training. Additionally, the problem of generating incorrect data arises when fake data is mixed with real data for oversampling [26].
In paper [27], a method was proposed to input the latent variables of an autoencoder into a linear separator for oversampling, showing robustness against overfitting due to the linear separator.
In paper [28], attention was drawn to the time-consuming aspect of most oversampling methods, particularly concerning the use of k-nearest neighbors. They significantly reduced computation time by calculating the absolute values between the minimum and maximum values of each feature of the minority class, achieving similar effects to SMOTE.
Undersampling approach. Undersampling is a method that reduces the data of the majority class, opposite to oversampling. To accomplish this, it is crucial to establish criteria for determining which data from the majority class to remove.
Papers [29,30] proposed two methods for undersampling: random undersampling (RUS), which randomly removes data, and removing data from high-density clusters in the majority class to minimize information loss. RUS showed good performance when used with deep learning classifiers, while the method of removing data from high-density clusters outperformed traditional undersampling methods when using ML/DL classifiers on various datasets.
One-class training approach. The one-class training approach is advantageous for imbalanced data because it only uses one class for training. Additionally, it is effective in saving time and cost [31].
In the paper [32], various variations of autoencoders were evaluated and compared as classifiers. A total of 5 autoencoder variant models performed classification on IDS (Intrusion Detection System) data. As a result, all AE classifiers showed an F1 score of 88 or higher, indicating effectiveness in building unsupervised learning-based IDS.
Furthermore, papers [33,34] proposed methods to ensemble one-class classifiers. In particular, Krawczyk et al. [33] suggested a dynamic ensemble method to address multi-class classification problems. It applied a threshold to discard incompetent classifiers among multiple classifiers. It demonstrated stable performance across 22 different datasets.
Vaiyapuri et al. [32] demonstrated the possibility of using Autoencoders as classifiers. Additionally, One-Class training is advantageous in highly imbalanced datasets as it allows training with only one class. Moreover, the algorithms used for One-Class training are mostly unsupervised learning algorithms, which makes them well-suited for handling unseen data.
This study employed a self-supervised model, the Autoencoder, to overcome the challenge of labeling encrypted data. Furthermore, to address the issue of class imbalance in encrypted attack data, an Autoencoder-based one-class learning approach was utilized.
3.1 Feature Extraction Methods
This section explains the processes of two statistical feature extraction methods for network anomaly detection from TCP (Transmission Control Protocol) traffic data containing SSL/TLS protocol packets. Both of these feature extraction methods utilize identical packet metadata for feature extraction. Furthermore, the quantity of features extracted was minimized to utilize as little computational resources as possible, making it suitable for application in IoT environments.
Packet-based feature extraction: This method involves extracting statistical features on a packet-by-packet basis from the PCAP (Packet Capture) files. This process was performed in two steps:
First, we stored the metadata of individual packets. The metadata used in this step included information on the packet itself, such as frame size and epoch time, as well as transmission status information (e.g., TCP flags) and encrypted user data information (e.g., TLS application data length). We excluded information that could specifically identify attacking nodes, such as IP addresses, to prevent bias during model training.
Second, we extracted statistical features for every set of 10 packets using their metadata and the 10-sliding window algorithm. Table 1 lists statistical features based on packets that were ultimately extracted through these two steps.

Flow-based feature extraction: This method involved extracting features from the accumulated packet information flowing in one direction between two endpoints from the PCAP file. This process was performed in three steps:
First, we stored metadata of individual packets, categorized by flow, based on a 5-tuple. The metadata used in this step were the same as those used in packet-based feature extraction.
Second, we extracted statistical features using the accumulated metadata for flows in which new metadata were added.
Third, we extracted statistical features for every set of 10 packets using their metadata and the 10-sliding window algorithm. Table 2 lists the final statistical features based on flows that extracted through these two steps. Additionally, in flow-based feature extraction, we considered the direction of packet flow within a single flow, extracting features related to inbound and outbound traffic.

Dataset. This study utilized the CIC IoT Dataset 2023 (CICIoT2023), created by the Canadian Institute for Cyber-security (CIC) at the University of New Brunswick in Canada. This dataset provides data from real-time traffic generated by various attacks attempted in an actual IoT environment. It includes original PCAP files with traffic data and CSV files containing extracted features from the packet capture (PCAP) files.
Additionally, it provides example code in an ipynb file for ML-based multi-class classification using this dataset, as well as source code and tool descriptions used for data feature extraction. The dataset includes 33 types of IoT attacks categorized into 7 classes. Among them, encrypted traffic of browser hijacking and SQL (Structured Query Language) injection attacks are included.
This paper utilized benign traffic composed within the dataset for model training. Additionally, to measure the anomaly detection performance of models trained based on normal data, both browser hijacking and SQL injection attacks were employed as different types of attacks. As depicted on the left side of Fig. 1, the Benign PCAP and Attack PCAP provided by the CICIoT2023 dataset are prepared as training and testing datasets through three steps.

Figure 1: Experiments workflow
Step (1): Select traffic related to devices involved in providing web-based services from IoT devices. Step (2): Use Python’s Scapy library to extract metadata for each protocol layer of the packets. Exclude specific node unique data like IP and Port. Extracted metadata is transformed into feature vectors. Feature data is converted into CSV format, and the averaged values for every 10 rows are saved into files. Step (3): Distribute the data to construct datasets for training and evaluation.
The train set comprises 50% of benign data, the validation set includes 25% of benign data, and the test set consists of the remaining 25% of benign data and 100% of malicious data. The actual amount of data used is as shown in Table 3, with 39,119 rows for Benign traffic, 1739 rows for browser hijacking, and 1699 rows for SQL injection.

One-class anomaly detection. The anomaly detection process, as illustrated on the right side of Fig. 1, consists of five main steps. Step (1): Normalize the range of all datasets using StandardScaling and MinMaxScaling. Step (2): Train the Autoencoder (AE) using the Train Set containing only benign data. The AE aims to minimize the reconstruction error between the output data, obtained after compression and de-compression, and the input data, which is the benign data. Step (3): Input the Test Set, containing a mixture of benign and malicious data, into the trained AE.
The AE reconstructs the input similar to the benign data used during training. However, the reconstructed output for the malicious data input will have significant errors compared to the benign data. Step (4): Select the threshold that maximizes the F1 score based on the reconstruction errors of both benign and malicious data from the Test Set. Step (5): Detect anomalies using the selected optimal threshold.
Auto-encoder architecture. The layers of the AE model consisted of four Dense layers and two Dropout layers, as shown in Fig. 2. The number of units in each layer of the encoder gradually decreased by 25% from the number of input features to a maximum reduction of 50%. In contrast, the number of units in each layer of the decoder increased by 25%, mirroring the AE’s input feature count to maintain consistency.

Figure 2: Auto-encoder layer architecture for experimental
Training setting. The AE was trained with a batch size of 32, and shuffle set to false. The number of epochs was set to 20, based on manual determination of when the validation loss did not improve for more than 4 consecutive epochs. Only the same normal data was used for both input X and output Y, with separately segmented validation data.
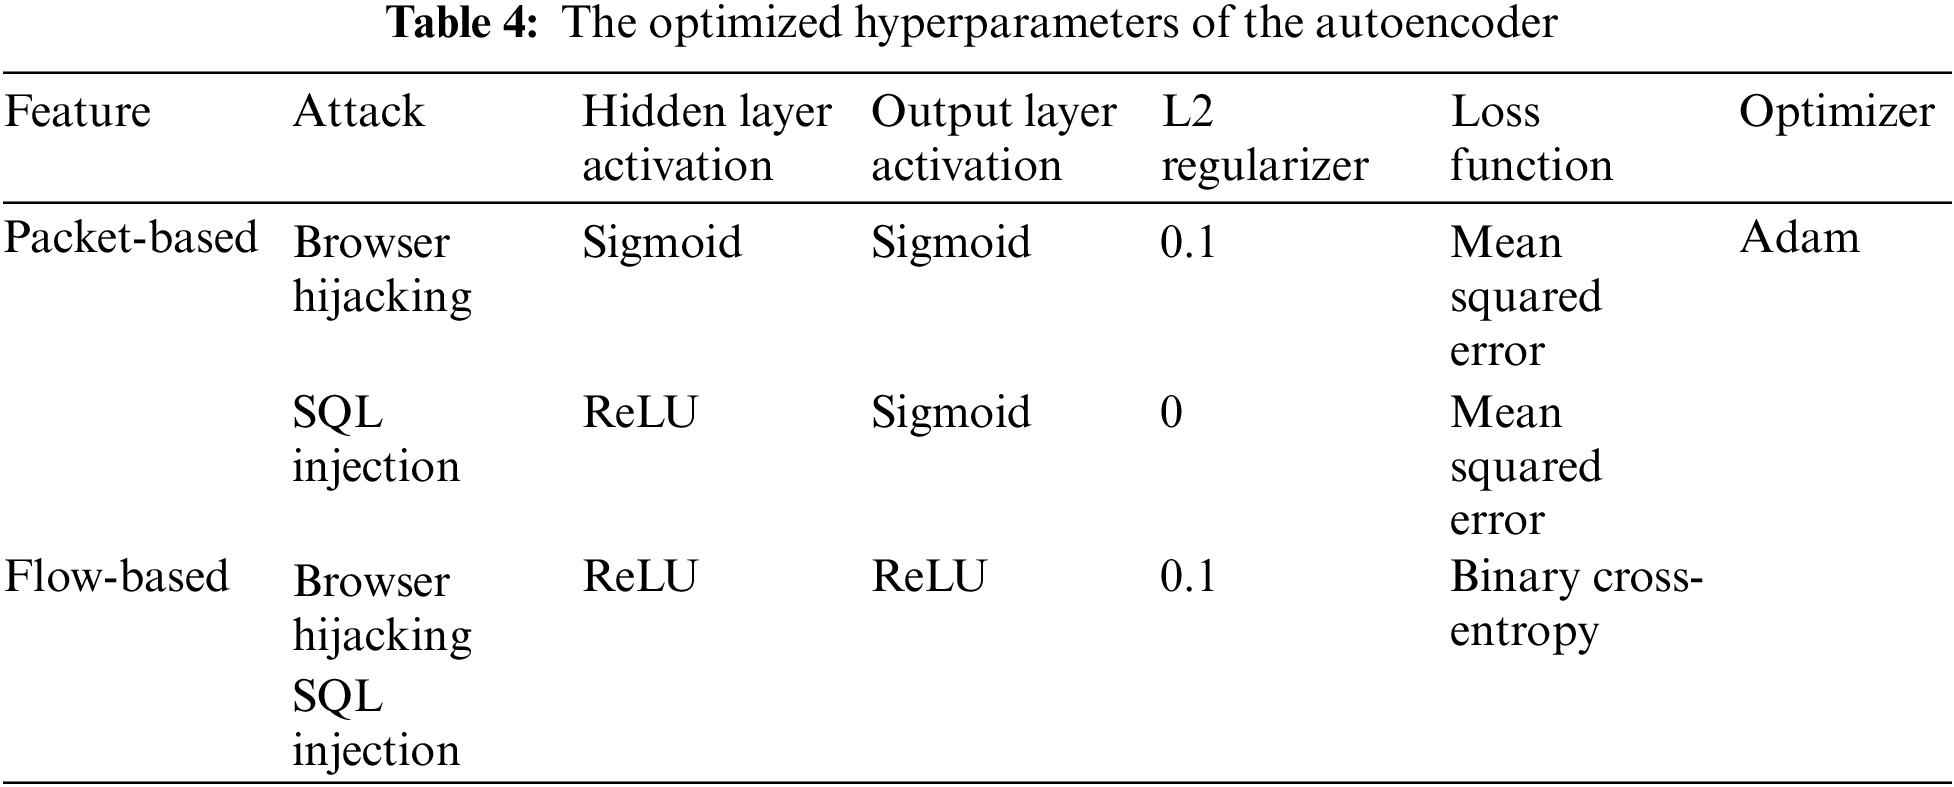
Layer hyperparameter tuning. Manual parameter optimization was conducted for the activation function of the hidden layers, the activation function of the output layer, the loss function, and the optimizer of the Autoencoder. The parameters yielding the smallest validation data loss during training were selected as the optimal parameters. The optimized parameters for the Autoencoder are presented in Table 4.
Environment. All experiments were conducted on a PC equipped with an Intel Core i9-10980XE CPU, 128 GB RAM, and an NVIDIA GeForce RTX 3090 24 GB GPU. Furthermore, for evaluating the performance of the anomaly detection model, we utilized metrics such as Confusion Metrics, precision-recall curve, and F1 score.
The anomaly detection results of the deep learning model employed in the proposed approach can be represented using a Confusion matrix. The Confusion matrix distinguishes between four categories: True Positive (TP), False Positive (FP), False Negative (FN), and True Negative (TN), which are utilized in evaluating accuracy, precision, recall, and F1 score.
Accuracy refers to correctly classifying cases as anomalies or normal. Precision represents the ratio of actual anomaly data among those classified as anomalies by the model, including false positives. Recall is the proportion of actual anomaly data classified as anomalies by the model among all actual anomaly data.
Precision is based on the model’s anomaly judgment data, while recall reflects the performance based on actual anomaly data. Precision and recall are in a trade-off relationship. thus, the model with the highest scores for both is considered to have the best performance.
The harmonic mean of these two scores is represented by the F1 score. While all metrics in Eqs. (1)–(4) are used in evaluating the model’s performance in the experiments, the F1 score is predominantly used for performance comparison.
4.3 OC-AD Result with Packet-Based Feature Extraction
This experiment conducted one-class anomaly detection using packet-based feature extraction. Additionally, the AE trained with packet-based features determined the best threshold value for detecting Browser Hijacking and SQL Injection attacks by identifying the threshold value that maximizes the F1 score.
In this experiment, packet-based of 7 dimensions were used, and the training of the AE was performed with 20 epochs. The architecture of the Autoencoder (AE) consists of layers with node numbers as follows, based on the dimensionality of the features mentioned in Section 4.1: 7, 5, 5, 3, 5, 5, 7. Except for the code part, which constitutes 50% of the dimensions, dropout layers are configured with the same number of nodes as the input and output parts.
Fig. 3 depicts the reconstruction error histograms for the AE trained on the Browser Hijacking test set and SQL Injection test set. In the case of the Browser Hijacking test set, Fig. 3a shows a noticeable overlap in the reconstruction error value ranges between the benign class and the Browser Hijacking class. Conversely, for the SQL Injection test set, Fig. 3b reveals a substantial overlap in the reconstruction error value ranges between the benign class and the SQL Injection class.

Figure 3: (a) Reconstruction error histogram for browser hijacking test set (b) Reconstruction error his-togram for SQL injection test set
In order to perform anomaly detection for Browser Hijacking and SQL Injection attacks, it is necessary to determine the threshold for the Reconstruction Error. The threshold value was chosen to be the one that yields the highest F1 score for each attack dataset. As shown in Fig. 4, for the Browser Hijacking test set, the best threshold value is 0.036, resulting in a maximum F1 score of 0.820. In the case of the SQL Injection test set, the best threshold value is 0.009, with a maximum F1 score of 0.425.

Figure 4: (a) Best threshold to maximum F1 score with browser hijacking test set, (b) Precision and recall value for different threshold values with browser hijacking test set, (c) Best threshold to maximum F1 score with SQL injection test set, (d) Precision and recall value for different threshold values with SQL injection test set
Using the Best Threshold, anomaly detection was performed on the Browser Hijacking test set and the SQL Injection test set, and accuracy, precision, recall, and F1 score were measured. Table 5 presents the anomaly detection scores for the two test sets.

The results of one-class anomaly detection using packet-based feature extraction indicate that the performance of Browser Hijacking attack detection was approximately 1.5 times better in terms of accuracy, 2.6 times better in precision, and 1.9 times better in F1 score compared to SQL Injection attack detection. However, the recall score was approximately 1.008 times better for SQL Injection attack detection.
4.4 OC-AD Result with Flow-Based Feature Extraction
This experiment involves one-class anomaly detection using flow-based feature extraction. Similarly to Section 4.2, an AE trained with flow-based features was used to determine the best threshold value for detecting Browser Hijacking and SQL Injection attacks by identifying the threshold value that maximizes the F1 score. Flow-based features of 12 dimensions were used in this experiment, and the AE’s training was conducted with 20 epochs.
The architecture of the autoencoder consists of layers with node numbers as follows, based on the dimensionality of the features mentioned in Section 4.1: 12, 9, 9, 6, 9, 9, 12. Except for the code part, which constitutes 50% of the dimensions, dropout layers are configured with the same number of nodes as the input and output parts.
Fig. 5 depicts the reconstruction error histograms for the AE trained on the Browser Hijacking test set and SQL Injection test set. In the case of the Browser Hijacking test set, Fig. 5a shows some overlap in the reconstruction error value ranges between the benign class and the Browser Hijacking class. However, for the SQL Injection test set, Fig. 5b demonstrates a considerable overlap in the reconstruction error value ranges between the benign class and the SQL Injection class. This pattern aligns with the results of the Reconstruction Error distribution analyzed using packet-based feature extraction in Section 4.2.

Figure 5: (a) Reconstruction error histogram for browser hijacking test set (b) Reconstruction error his-togram for SQL injection test set
To perform anomaly detection for browser hijacking and SQL injection attacks, it is essential to determine the threshold for the Reconstruction Error, following the same approach as in Section 4.2. The threshold value was chosen to be the one that yields the highest F1 score for each attack dataset. As shown in Fig. 6, for the Browser Hijacking test set, the best threshold value is 0.028, resulting in a maximum F1 score of 0.852. In the case of the SQL Injection test set, the best threshold value is 0.003, with a maximum F1 score of 0.552.

Figure 6: (a) Best threshold to maximum F1 score with browser hijacking test set, (b) Precision and recall value for different threshold values with browser hijacking test set, (c) Best threshold to maximum F1 score with SQL injection test set, (d) Precision and recall value for different threshold values with SQL injection test set
Using the best threshold, anomaly detection based on flow features was performed on the browser hijacking test set and the SQL injection test set, and accuracy, precision, recall, and F1 score were measured. Table 6 presents the anomaly detection scores for the two test sets.

The results of one-class anomaly detection using packet-based feature extraction indicate that the performance of Browser Hijacking attack detection was approximately 1.2 times better in terms of accuracy, 2.4 times better in precision, and 1.6 times better in F1 score compared to SQL Injection attack detection. However, the recall score was approximately 1.1 times better for SQL Injection attack detection.
4.5 Comparison OC-AD Score Each Feature Extraction Method
In this section, we compare the results from Sections 4.2 and 4.3. For the Browser Hijacking Test set, when using flow-based feature extraction instead of packet-based feature extraction, the accuracy, precision, and F1 score all increased by approximately 1.02 to 1.21 times, while the recall decreased by approximately 1.14 times. Similarly, for the SQL Injection test set, when using flow-based feature extraction as opposed to packet-based feature extraction, accuracy, precision, and F1 score all exhibited an increase of approximately 1.21 to 1.33 times, while the recall decreased by approximately 1.04 times.
In Fig. 7, when comparing (a) and (c) for the browser hijacking test set’s ROC (Receiver Operating Characteristic) curve, it’s noticeable that the curve for (c), which employs flow-based feature extraction, is shifted more towards the upper-right corner for threshold values below 0.1 compared to (a), which uses packet-based feature extraction. Additionally, the AUC (Area Under the ROC) score increased slightly from 0.9445 to 0.9694 with flow-based feature extraction.

Figure 7: (a) ROC curve using packet-based feature extraction with browser hijacking test set, (b) ROC curve using packet-based feature extraction with SQL injection test set, (c) ROC curve using flow-based feature extraction with browser hijacking test set, (d) ROC curve using flow-based feature extraction with SQL injection test set
Similarly, for the SQL injection test set, (b) using flow-based feature extraction shows a significant improvement in the curve compared to (d) using packet-based feature extraction. Particularly, when using packet-based feature extraction, the AUC value for SQL injection attacks was below proper classification at 0.7042, while with flow-based feature extraction, the AUC value increased to 0.7978, approximately 1.13 times better.
Through this, we can discern that using flow-based feature extraction results in an increase in precision compared to using packet-based feature extraction, which in turn reduces false positives. However, the decrease in recall, leading to an increase in false negatives, is relatively modest. This discrepancy, as illustrated in Fig. 7, suggests that the difference in the extent of improvement is more pronounced in the case of flow-based feature extraction. Therefore, flow-based feature extraction proves to be more effective in permitting fewer missed detections while mitigating a higher number of false alarms compared to packet-based feature extraction.
In the Browser Hijacking attack dataset, OneClassSVM and IsolationForest performed better with packet-based feature extraction methods. However, for SQL Injection, IsolationForest demonstrated better effectiveness with packet-based feature extraction, while OneClassSVM showed more effectiveness with flow-based feature extraction.
In Fig. 8, both models exhibited high recall but lower precision on the attack test datasets, indicating effective attack detection but a significant number of false positives, classifying normal instances as anomalies.
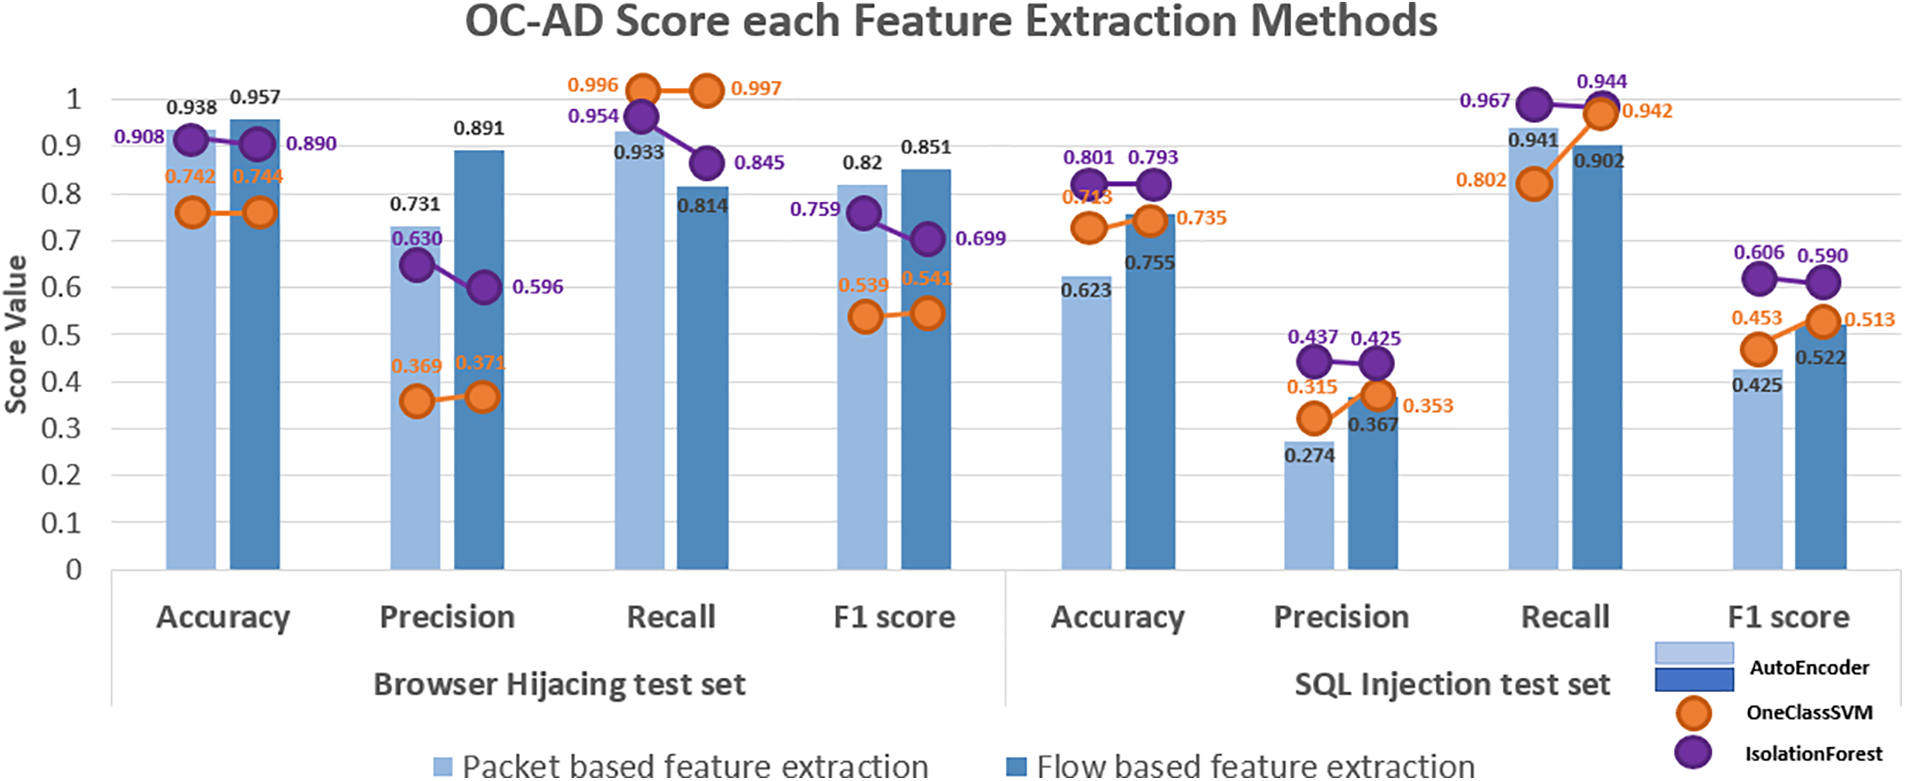
Figure 8: Comparison OC-AD score each feature extraction method
Furthermore, the study compared the performance by applying the SMOTE-based method, one of the existing solutions for addressing data imbalance, to the dataset used in this research. Additionally, hyperparameter optimization was conducted for the KNN (K-Nearest Neighbor) model used as the classifier. The optimization parameters were set for n_neighbors ranging from 1 to 10.
Table 7 presents the comprehensive (average) detection performance of the two attack datasets when the best-performing feature extraction methods for each model were applied.

The proposed model showed the highest values for Accuracy, Precision, and F1 score. However, the Recall value was highest for OneClassSVM. The F1 score of the Isolation model showed a similar value to the proposed model. However, there was a larger difference between the Recall and Precision values, indicating a higher false positive rate compared to the proposed model.
4.6 Comparison OC-AD Score Each Feature Extraction Method
To address data imbalance, numerous data augmentation methods have been proposed historically. To compare the performance of our proposed model, we implemented the packetCGAN model suggested in [25] and the Fest-SMOTE model presented in [28]. Both models were used to augment attack data.
The packetCGAN model utilized an MLP (Multi-Layer Perceptron) classifier, while Fest-SMOTE employed a KNN classifier to classify malicious traffic. The MLP classifier used the layer structure and hyperparameters specified in [25], with a threshold set at 0.5. The KNN classifier’s optimal hyperparameter ‘k’ was determined using GridSearchCV with 5-fold cross-validation before performance evaluation.
The datasets used for performance evaluation included both the browser hijacking attack set and the SQL injection attack set. Additionally, evaluations were conducted separately for packet-based feature sets and flow-based feature sets for each attack, resulting in a total of four evaluation scenarios.
As shown in Table 8, the data used for testing each model was consistently set. To simulate real attack scenarios using CICIoT data, augmented data was employed for both training and validation datasets.

Performance evaluation was conducted by calculating the average detection performance across both attacks using a single feature set, to determine how effectively each model detected the two types of attacks.
Table 9 shows the detection performance for browser hijacking and SQL injection attack traffic using packet-based features.

For packetCGAN, all classifications were predicted as normal, resulting in TP and FP values of 0, and thus precision, recall, and F1 score values of 0. However, the AUC value was 0.7074, indicating that the issue might be related to the threshold used by the MLP classifier. This AUC value was the second highest among the three models.
For Fest-SMOTE, the accuracy and precision values were higher than those of the other models. However, the recall value was very low at 0.0778, indicating poor performance in detecting attacks. Additionally, the AUC value was 0.5376, the lowest among the compared models.
The proposed model had higher recall and F1 score values compared to the other models. Since a higher recall value indicates better attack detection performance, the proposed model showed the best attack detection performance among the compared models. Furthermore, the AUC value, which considers the threshold, was 0.824, the highest among the compared models.
The detection performance for browser hijacking and SQL injection attack traffic using flow-based features is shown in Table 10.

For packetCGAN, similar to the previous case, all classifications were predicted as normal, resulting in TP and FP values of 0, and thus precision, recall, and F1 score values of 0. Additionally, the AUC value was 0.2092, which is lower than when using packet-based features, indicating decreased performance. This was the lowest performance among the compared models.
For Fest-SMOTE, the accuracy and precision values were higher than those of the other models. The recall value improved to 0.2468 compared to when using packet-based features, but it still showed insufficient performance in detecting attacks. The AUC value was 0.6267, which was the second highest performance among the compared models.
For the proposed model, the recall and F1 score values were higher than those of the other models. The recall value decreased to 0.858 compared to when using packet-based features, but it still showed the best attack detection performance among the compared models. Additionally, the AUC value was 0.8836, which was the highest performance among the compared models.
Fig. 9 presents a chart comparing the performance results derived above at a glance. The performance metrics of the three models are listed for each feature used. The same model is indicated using similar color shades.
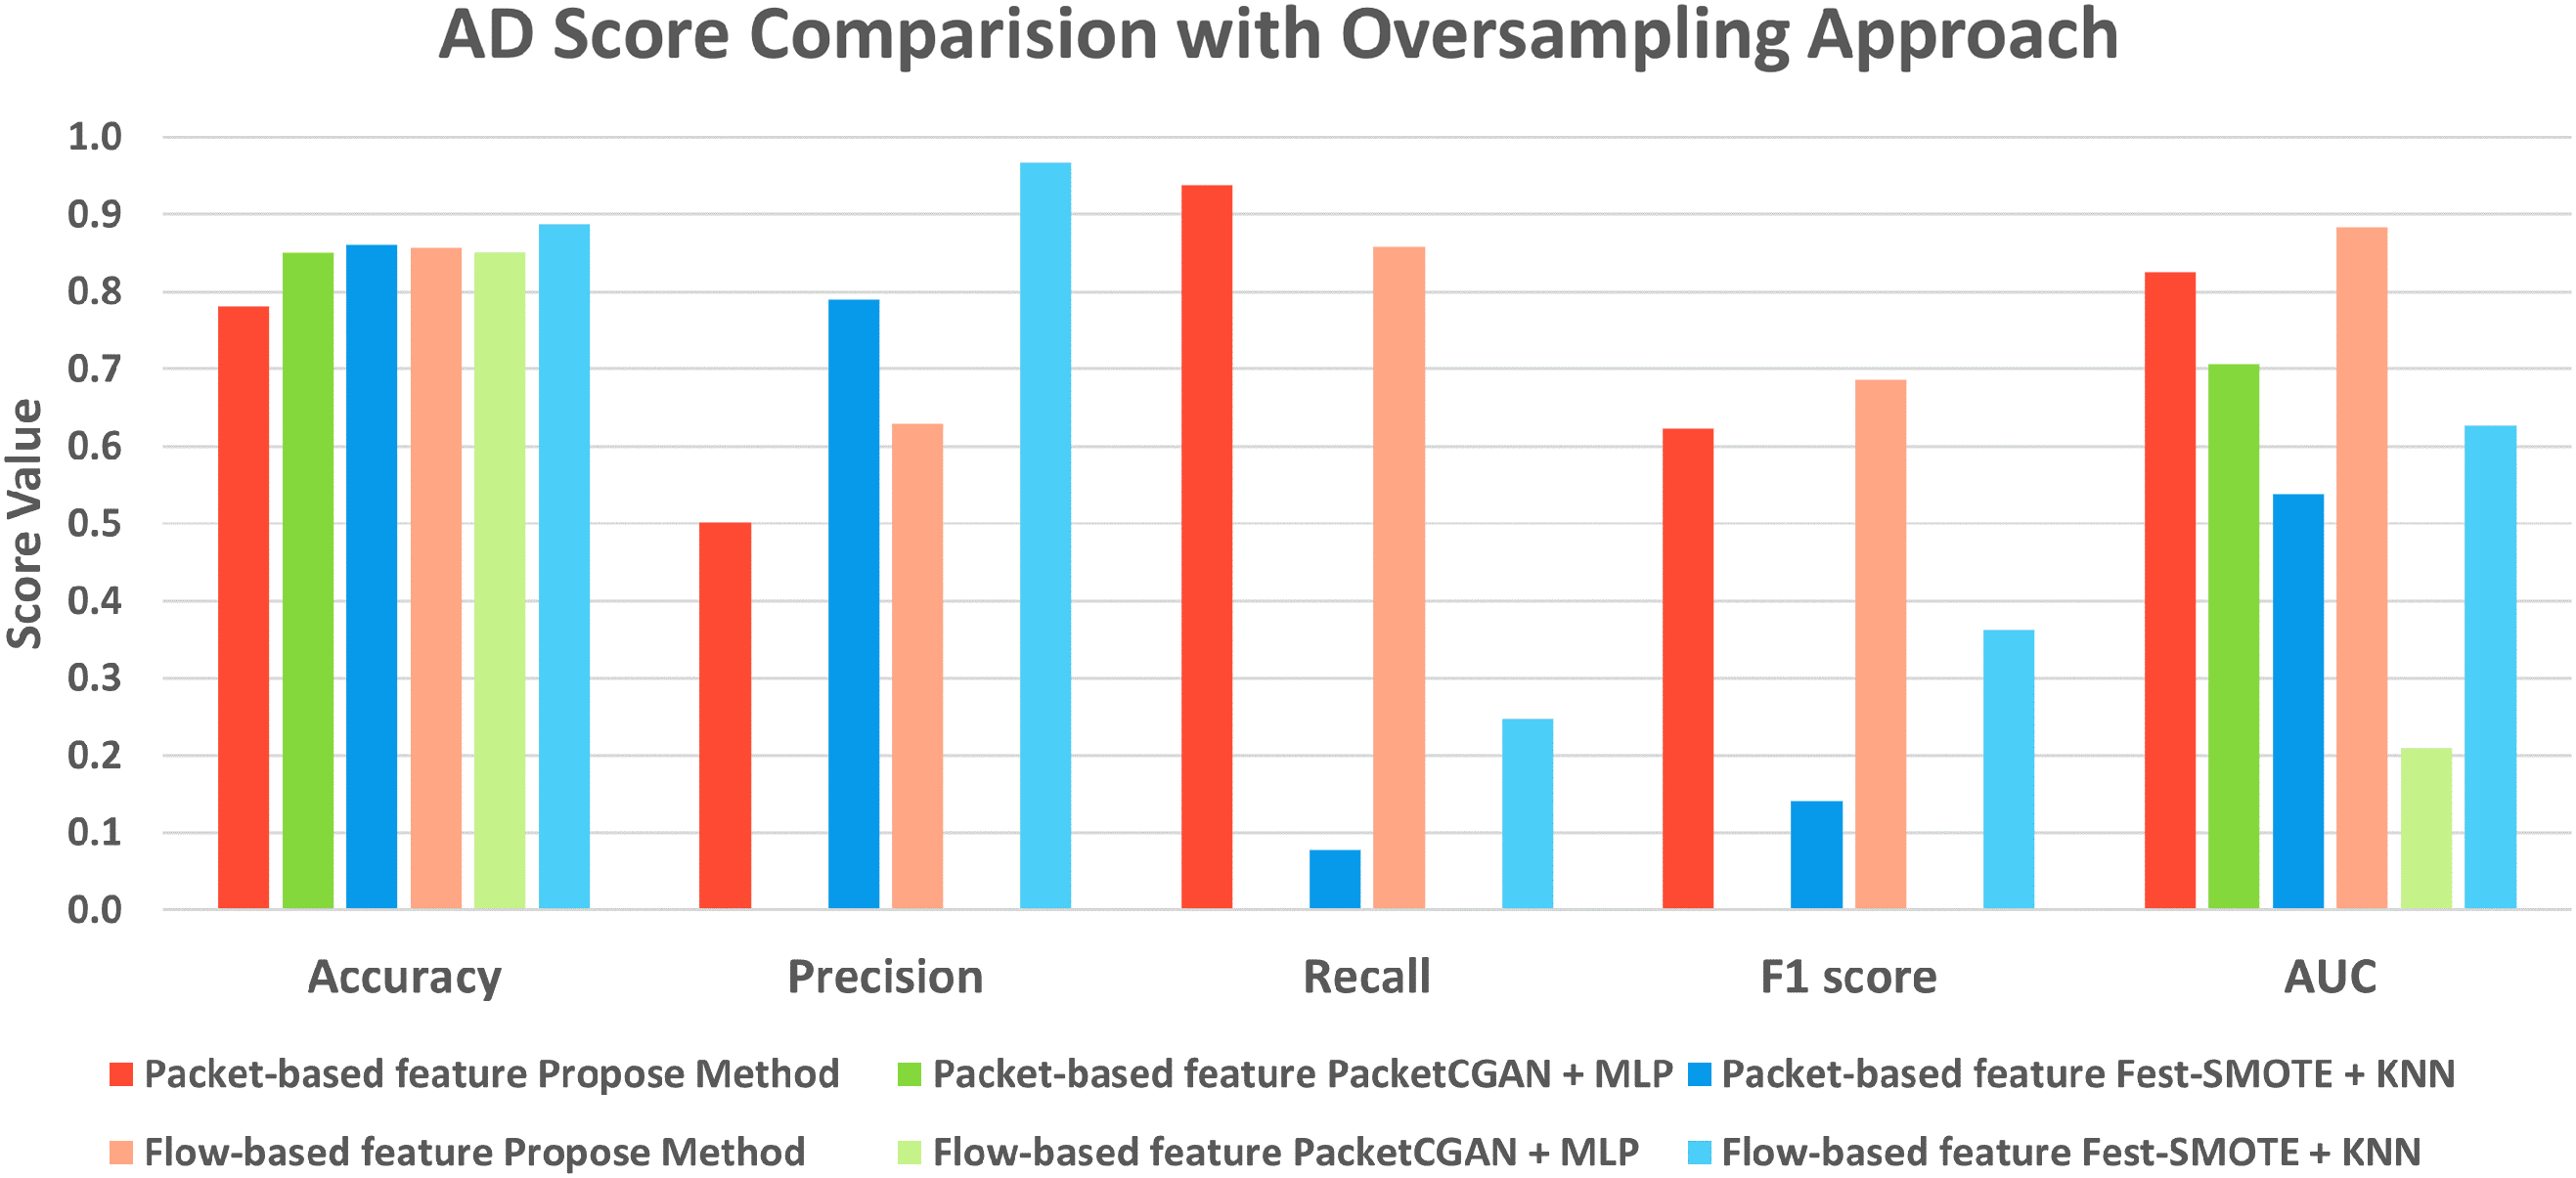
Figure 9: AD score comparison with oversampling approach
For accuracy and precision, the combination of the Fest-SMOTE-based KNN classifier with flow-based features showed the highest performance, with an accuracy of 0.8873, which is 5.69% higher than the average of 0.8395 for other cases.
In terms of recall, the proposed model using packet-based features achieved the highest performance with a recall of 0.9370. This indicates that it detects the tested attacks most effectively.
For the F1 score, the proposed model using flow-based features showed the highest performance with a score of 0.6865. The F1 score, being the harmonic mean of precision and recall, is a good metric to use when dealing with imbalanced data. This indicates that the proposed model with flow-based features effectively distinguishes between normal and malicious traffic, detecting attacks harmoniously.
The performance metrics can vary depending on the threshold used for detecting attacks. Therefore, we also compared the performance using the AUC value, which considers various thresholds. The proposed model using flow-based features had an AUC value of 0.8836, which is 52.06% higher than the average AUC value of 0.5811 for the other models.
We proposed an autoencoder-based method for anomaly detection using a small amount of packet metadata and training only on normal data to detect anomalies based on reconstruction error values. In this method, we excluded simple packet metadata that could bias model training from being used as training features in the data feature extraction process.
With the selected small amount of packet metadata, we applied packet-based and flow-based feature extraction methods to the CICIoT2023 dataset and compared their performance with the proposed autoencoder-based anomaly detection model. The dataset was created using various IoT devices commonly found in smart homes, including 105 cameras, plugs, lighting systems, home automation devices, and more.
The proposed method is expected to be applicable in environments where diverse IoT devices are interconnected, offering versatility across different IoT setups. Furthermore, the proposed method utilizes metadata from the Frame and TCP layers. Additionally, metadata related to TLS only utilizes the payload length of encrypted traffic. Therefore, the proposed method is applicable to all encryption protocols that ensure TLS-based connectivity, indicating scalability across various protocols.
Through two experimental results, we verified which feature type is more effective for autoencoder-based one-class anomaly detection and compared the performance with the previously proposed oversampling approaches.
In the feature type experiment, the flow-based extraction method showed significant improvement over the packet-based extraction method. Specifically, for the browser hijacking malicious data, the F1 score increased from 0.802 to 0.851, a 6.23% improvement, and for the SQL injection malicious data, it increased from 0.425 to 0.522, a 22.82% improvement.
When comparing performance differences by attack type, there was no significant difference between the two feature extraction methods for browser hijacking. However, a substantial difference was observed for SQL injection. This suggests that the importance or necessity of features can vary depending on the attack type and model.
In the comparison experiment with the previously proposed oversampling approaches, the proposed model demonstrated the best performance in terms of recall, focusing on detecting attacks, with a recall value of 0.9370.
Additionally, the F1 score, which evaluates the harmonious distinction between normal and attack traffic, showed the best performance with a score of 0.6865.
Notably, when comparing performance using the AUC value, which considers the classifier’s threshold, the proposed model showed superior performance. For packet-based features, it achieved an AUC value of 0.8244, which is 32.43% higher than the average of 0.6225 for other models. For flow-based features, it achieved an AUC value of 0.8836, which is 111.39% higher than the average of 0.418 for other models.
However, this paper has the following limitations: (1) Performance was evaluated for only one type of attack, and (2) The number of SSL/TLS traffic data in the attack samples was limited. (3) The normal data used for training was sampled from only one dataset, and (4) The handling of outliers that may be present within normal data and the optimal selection of the number of nodes for each model layer were not considered. Future research will explore anomaly detection using session-based feature extraction methods. This will involve comparing the performance of existing payload-based methods with the method proposed in this study. Furthermore, there are plans to research attack multi-classification using reconstruction errors.
Acknowledgement: This work was supported by Institute of Information & Communications Technology Planning & Evaluation (IITP) grant funded by the Korea government (MSIT).
Funding Statement: This work was supported by Institute of Information & Communications Technology Planning & Evaluation (IITP) grant funded by the Korea government (MSIT) (No. RS-2023-00235509, Development of Security Monitoring Technology Based Network Behavior against Encrypted Cyber Threats in ICT Convergence Environment).
Author Contributions: The authors confirm contribution to the paper as follows: study conception and design: Min-Gyu Kim, Hwankuk Kim; data collection: Min-Gyu Kim; analysis and interpretation of results: Min-Gyu Kim, Hwankuk Kim; draft manuscript preparation: Min-Gyu Kim. All authors reviewed the results and approved the final version of the manuscript.
Availability of Data and Materials: The datasets generated during and/or analyzed during the current study are available in the Canadian institute for cybersecurity (CIC) repository, https://www.unb.ca/cic/datasets/iotdataset-2023.html (accessed on 8 January 2024).
Conflicts of Interest: The authors declare that they have no conflicts of interest to report regarding the present study.
References
1. Hasan MK, Jahan N, Nazri MZA, Islam S, Khan MA, Alzahrani AI, et al. Federated learning for computational offloading and resource management of vehicular edge computing in 6G-V2X network. IEEE Trans Consum Electron. 2024 Feb;70(1):3827–47. doi:10.1109/TCE.2024.3357530. [Google Scholar] [CrossRef]
2. Behera TK, Bakshi S, Khan MA, Albarakati HM. A lightweight multiscale-multiobject deep segmentation architecture for UAV-based consumer applications. IEEE Trans Consum Electron. 2024;70(1):3740–53. doi:10.1109/TCE.2024.3367531. [Google Scholar] [CrossRef]
3. Oltrogge M, Huaman N, Amft S, Acar Y, Backes M, Fahl S. Why eve and mallory still love android: revisiting TLS (In)security in android applications. In: 30th USENIX Security Symposium (USENIX Security 21); 2021 Aug 11–13. p. 4347–64. [Google Scholar]
4. Orikogbo D, BüCRiOS M, Egele M. CRiOS: toward large-scale iOS application analysis. In: Proceedings of the 6th Workshop on Security and Privacy in Smartphones and Mobile Devices: 2016 Oct 24; Vienna, Austria. p. 33–42. doi:10.1145/2994459.2994473. [Google Scholar] [CrossRef]
5. Felt AP, Barnes R, King A, Palmer C, Bentzel C, Tabriz P. Measuring {HTTPS} adoption on the web. In: 26th USENIX Security Symposium (USENIX Security 17); 2017 Aug 16–18; Vancouver, BC, Canada: Sheraton Vancouver Wall Centre. p. 1323–38. [Google Scholar]
6. Alrawi O, Lever C, Antonakakis M, Monrose F. SoK: security evaluation of home-based IoT deployments. In: 2019 IEEE Symposium on Security and Privacy (SP); 2019; San Francisco, CA, USA: IEEE. p. 1362–80. doi:10.1109/SP.2019.00013. [Google Scholar] [CrossRef]
7. Tariq U, Ahmed I, Khan MA, Bashir AK. Fortifying IoT against crimpling cyber-attacks: a systematic review. Karbala Int J Mod Sci. 2023;9(4):665. [Google Scholar]
8. Naqvi SMA, Shabaz M, Khan MA, Hassan SI. Adversarial attacks on visual objects using the fast gradient sign method. J Grid Comput. 2023;21(4):1–20. [Google Scholar]
9. Özdel S, Ateş A, Ateş PD, Koca M, Anarım SME. Payload-based network traffic analysis for application classification and intrusion detection. In: 2022 30th European Signal Processing Conference (EUSIPCO); 2022; Belgrade, Serbia. p. 638–42. doi:10.23919/EUSIPCO55093.2022.9909683. [Google Scholar] [CrossRef]
10. Wang Y, Gao Y, Li X, Yuan J. Encrypted traffic classification model based on SwinT-CNN. In: 2023 4th International Conference on Computer Engineering and Application (ICCEA); 2023; Hangzhou, China. p. 138–42. doi:10.1109/ICCEA58433.2023.10135305. [Google Scholar] [CrossRef]
11. Okonkwo Z, Foo E, Li Q, Hou Z. A CNN based encrypted network traffic classifier. In: Proceedings of the 2022 Australasian Computer Science Week; 2022; New York, NY, USA: Association for Computing Machinery. p. 47–83. doi:10.1145/3511616.3513101. [Google Scholar] [CrossRef]
12. Zhang J, Zhou L, Xiao A, Zeng S, Zhao H, Wei J. Sliding window based feature extraction and traffic clustering for green mobile cyberphysical systems. Mob Inf Syst. 2017;2017(1):1–10. doi:10.1155/2017/2409830. [Google Scholar] [CrossRef]
13. Yan H, He L, Song X, Yao W, Li C, Zhou Q. Bidirectional statistical feature extraction based on time window for tor flow classification. Symmetry. 2022;14(10):2002. [Google Scholar]
14. Dahiya D. DDoS attacks detection in 5G networks: hybrid model with statistical and higher-order statistical features. Cybern Syst. 2023;54(6):888–913. doi:10.1080/01969722.2022.2122002. [Google Scholar] [CrossRef]
15. Yang Y, Yan Y, Gao Z, Rui L, Lyu R, Gao B, et al. A network traffic classification method based on dual-mode feature extraction and hybrid neural networks. IEEE Trans Netw Serv Manage. 2023;20(4):4073–84. doi:10.1109/TNSM.2023.3262246. [Google Scholar] [CrossRef]
16. Arshad QUA, Raza M, Khan WZ, Siddiqa A, Muiz A, Khan MA, et al. Anomalous situations recognition in surveillance images using deep learning. Comput Mater Contin. 2023;76(1):1103–25. doi:10.32604/cmc.2023.039752. [Google Scholar] [CrossRef]
17. Fatani A, Dahou A, Al-qaness MAA, Lu S, Abd Elaziz M. Advanced feature extraction and selection approach using deep learning and aquila optimizer for IoT intrusion detection system. Sensors. 2022;22(1):140. doi:10.3390/s22010140. [Google Scholar] [PubMed] [CrossRef]
18. Yao R, Liu C, Zhang L, Peng P. Unsupervised anomaly detection using variational autoencoder based feature extraction. In: 2019 IEEE International Conference on Prognostics and Health Management (ICPHM); 2019 Jun 17–20; San Francisco, CA, USA. p. 1–7. doi:10.1109/ICPHM.2019.8819434. [Google Scholar] [CrossRef]
19. Ruikun L, Yun L, He W, Chen LR, Luo JC. Multi-layer reconstruction errors autoencoding and density estimate for network anomaly detection. Comput Model Eng Sci. 2021;128(1):381–98. doi:10.32604/cmes.2021.016264. [Google Scholar] [CrossRef]
20. Xu W, Jang-Jaccard J, Singh A, Wei Y, Sabrina F. Improving performance of autoencoder based network anomaly detection on NSL-KDD dataset. IEEE Access. 2021;9:140136–46. doi:10.1109/ACCESS.2021.3116612. [Google Scholar] [CrossRef]
21. Yilmaz I, Masum R, Siraj A. Addressing imbalanced data problem with generative adversarial network for intrusion detection. In: 2020 IEEE 21st International Conference on Information Reuse and Integration for Data Science (IRI); 2020; Las Vegas, NV, USA. p. 25–30. [Google Scholar]
22. Jamoos M, Mora AM, AlKhanafseh M, Surakhi O. A new data-balancing approach based on generative adversarial network for network intrusion detection system. Electronics. 2023;12(13):2851. doi:10.3390/electronics12132851. [Google Scholar] [CrossRef]
23. Yuan L, Yu S, Yang Z, Duan M, Li K. A data balancing approach based on generative adversarial network. Future Gener Comput Syst. 2023;141:768–76. doi:10.1016/j.future.2022.12.024. [Google Scholar] [CrossRef]
24. Rao YN, Suresh Babu K. An imbalanced generative adversarial network-based approach for network intrusion detection in an imbalanced dataset. Sensors. 2023;23(1):550. doi:10.3390/s23010550. [Google Scholar] [PubMed] [CrossRef]
25. Wang P, Li S, Ye F, Wang Z, Zhang M. PacketCGAN: exploratory study of class imbalance for encrypted traffic classification using CGAN. In: ICC 2020 – 2020 IEEE International Conference on Communications (ICC); 2020 Jun 07–11; Dublin, Ireland. p. 1–7. doi:10.1109/ICC40277.2020.9148946. [Google Scholar] [CrossRef]
26. Hassanat AB, Tarawneh AS, Altarawneh GA, Almuhaimeed A. Stop oversampling for class imbalance learning: a critical review; 2022. doi:10.48550/arXiv.2202.03579. [Google Scholar] [CrossRef]
27. Mondal AK, Singhal L, Tiwary P, Singla P, AP P. Minority oversampling for imbalanced data via class-preserving regularized auto-encoders. In: Proceedings of the 26th International Conference on Artificial Intelligence and Statistics. PMLR; 2023. vol. 206 [Google Scholar]
28. Rodríguez-Torres F, Martínez-Trinidad JF, Carrasco-Ochoa JA. An oversampling method for class imbalance problems on large datasets. Appl Sci. 2022;12(7):3424. doi:10.3390/app12073424. [Google Scholar] [CrossRef]
29. Saripuddin M, Suliman A, Syarmila Sameon S, Jorgensen BN. Random undersampling on imbalance time series data for anomaly detection. In: Proceedings of the 2021 4th International Conference on Machine Learning and Machine Intelligence; 2022; New York, NY, USA: Association for Computing Machinery. doi:10.1145/3490725.349074. [Google Scholar] [CrossRef]
30. Bach M, Werner A, Palt M. The proposal of undersampling method for learning from imbalanced datasets. Procedia Comput Sci. 2019;159:125–34. doi:10.1016/j.procs.2019.09.167. [Google Scholar] [CrossRef]
31. Li Q, Zhao C, He X, Chen K, Wang R. The impact of partial balance of imbalanced dataset on classification performance. Electronics. 2022;11(9):1322. doi:10.3390/electronics11091322. [Google Scholar] [CrossRef]
32. Vaiyapuri T, Binbusayyis A. Application of deep autoencoder as an one-class classifier for unsupervised network intrusion detection: a comparative evaluation. PeerJ Comput Sci. 2020;6:e327. doi:10.7717/peerj-cs.327. [Google Scholar] [PubMed] [CrossRef]
33. Krawczyk B, Galar M, WoÅžniak M, Bustince H, Herrera F. Dynamic ensemble selection for multi-class classification with one-class classifiers. Pattern Recognit. 2018;83:34–51. doi:10.1016/j.patcog.2018.05.015. [Google Scholar] [CrossRef]
34. Klikowski J, Wozniak M. Employing one-class SVM classifier ensemble for imbalanced data stream classification. In: Lecture notes in computer science. Cham: Springer; 2020. vol. 12140. p. 117–27. doi:10.1007/978-3-030-50423-6_9. [Google Scholar] [CrossRef]
35. Liu FT, Ting KM, Zhou ZH. Isolation forest. In: 2008 Eighth IEEE International Conference on Data Mining; 2008; Pisa, Italy. p. 413–22. doi:10.1109/ICDM.2008.17. [Google Scholar] [CrossRef]
36. Schölkopf B, Williamson RC, Smola A, Shawe-Taylor J, Platt J. Support vector method for novelty detection. In: Proceedings of the 12th International Conference on Neural Information Processing Systems (NIPS’99); 1999; Cambridge, MA, USA. p. 582–8. doi:10.5555/3009657.3009740. [Google Scholar] [CrossRef]
Cite This Article
 Copyright © 2024 The Author(s). Published by Tech Science Press.
This work is licensed under a Creative Commons Attribution 4.0 International License , which permits unrestricted use, distribution, and reproduction in any medium, provided the original work is properly cited.
 Downloads
 Citation Tools