
 Submit a Paper
 Propose a Special lssue
 Open Access
ARTICLE

A Probabilistic Trust Model and Control Algorithm to Protect 6G Networks against Malicious Data Injection Attacks in Edge Computing Environments
1 Department of Computer Systems, Universidad Politécnica de Madrid, Madrid, 28031, Spain
2 Department of Geospatial Engineering, Universidad Politécnica de Madrid, Madrid, 28031, Spain
* Corresponding Author: Borja Bordel Sánchez. Email:
(This article belongs to the Special Issue: Advanced Security for Future Mobile Internet: A Key Challenge for the Digital Transformation)
Computer Modeling in Engineering & Sciences 2024, 141(1), 631-654. https://doi.org/10.32604/cmes.2024.050349
Received 03 February 2024; Accepted 25 June 2024; Issue published 20 August 2024
 View Full Text
 Download PDF
Abstract
Future 6G communications are envisioned to enable a large catalogue of pioneering applications. These will range from networked Cyber-Physical Systems to edge computing devices, establishing real-time feedback control loops critical for managing Industry 5.0 deployments, digital agriculture systems, and essential infrastructures. The provision of extensive machine-type communications through 6G will render many of these innovative systems autonomous and unsupervised. While full automation will enhance industrial efficiency significantly, it concurrently introduces new cyber risks and vulnerabilities. In particular, unattended systems are highly susceptible to trust issues: malicious nodes and false information can be easily introduced into control loops. Additionally, Denial-of-Service attacks can be executed by inundating the network with valueless noise. Current anomaly detection schemes require the entire transformation of the control software to integrate new steps and can only mitigate anomalies that conform to predefined mathematical models. Solutions based on an exhaustive data collection to detect anomalies are precise but extremely slow. Standard models, with their limited understanding of mobile networks, can achieve precision rates no higher than 75%. Therefore, more general and transversal protection mechanisms are needed to detect malicious behaviors transparently. This paper introduces a probabilistic trust model and control algorithm designed to address this gap. The model determines the probability of any node to be trustworthy. Communication channels are pruned for those nodes whose probability is below a given threshold. The trust control algorithm comprises three primary phases, which feed the model with three different probabilities, which are weighted and combined. Initially, anomalous nodes are identified using Gaussian mixture models and clustering technologies. Next, traffic patterns are studied using digital Bessel functions and the functional scalar product. Finally, the information coherence and content are analyzed. The noise content and abnormal information sequences are detected using a Volterra filter and a bank of Finite Impulse Response filters. An experimental validation based on simulation tools and environments was carried out. Results show the proposed solution can successfully detect up to 92% of malicious data injection attacks.Keywords
Future 6G networks [1] are characterized by the provision of new communication services with extreme Quality-of-Service [2]. While 4G networks limited mobility to 350 km per hour (approximately), and 5G networks raised this limit to 500 km per hour, 6G technologies are expected to enable paradigms such as extreme mobility [3], where mobile devices can reach speeds of up to 1000 km per hour. In addition, extremely ultra-reliable low-latency communications (eURRLC) are enabled where network latencies are below 100 ms. This is a robust reduction compared to 5G networks (expected latencies below one millisecond) and 4G networks (latencies in the range of hundreds of milliseconds). Finally, ultra-massive machine-type communications (umMTC) [4], where base stations must serve up to 10 million devices per square kilometer, are also envisioned in 6G networks. While the maximum density in 5G was one million devices per square kilometer, this parameter was not even defined in 4G networks.
Through this renewed service catalog, a large collection of innovative applications will be enabled. By combining 6G mobile services, Artificial Intelligence [5], Cyber-Physical Systems [6] and edge computing devices [7], the fifth industrial revolution [8] will be accelerated. Real-time feedback control loops will be defined to efficiently manage everything from industrial production systems and digital agriculture to critical infrastructure such as energy or military equipment [9]. This massive automation will significantly increase global efficiency by almost completely eliminating inefficiencies caused by human intervention. Social and economic benefits, such as intense product personalization or increased well-being in the workplace, are clear positive outcomes of this new revolution [10]. However, automated network edge computing devices also have negative aspects, and this type of distributed architecture opens the door to new cyber risks and vulnerabilities [11].
When networked devices oversee most control and monitoring tasks in a developed economy, most systems must remain unmanaged and unattended. Isolated deployments in remote areas (for example, in digital agriculture or environmental monitoring) are quite common. Challenges such as energy supply have been thoroughly examined, and open questions related to communication infrastructure are anticipated to be addressed by the advent of 6G networks and their expected ultra-coverage (99% of the geographical territory will be provided with mobile services) [12]. However, unattended or isolated devices and networks are exceptionally vulnerable to manipulation. In fact, trust threats are the most concerning security challenges in 6G networks and edge computing deployments [13]. Attacks such as false information injection are relatively easy to develop [14]. Various attack vectors, including the insertion of malicious nodes within the network, noise flooding to induce a Denial-of-Service, or generation of anomalous information, have minimal costs for attackers in unattended environments. Nonetheless, the potential impact on control loops and decision and monitoring software is huge.
Current mitigation schemes to make 6G technologies and edge computing deployments resilient to malicious data are based on enriched control loops that can subtract the effect of false information and keep global operations stable [15]. However, this approach has two major problems. On the one hand, only malicious data or abnormal information matching a given mathematical function or model should be detected and mitigated. The improved control loop is only resilient against those effects for which a compensation loop is included. The remaining attacks or false data are not corrected. On the other hand, even for those malicious data that match the proposed mathematical model, the entire control software must be updated and transformed to include any trust protection module. Although this is feasible, it limits the application of these technologies to a limited number of scenarios. Therefore, more transversal and general protection mechanisms against malicious data injections are needed, and they must be able to operate transparently and regardless of the nature of the false information. This paper fills this gap.
In this paper, we introduce a probabilistic trust model and a control algorithm designed to assess the reliability of edge computing nodes. The model quantifies the probability that a given node is trustworthy by integrating three distinct components, each representing a specific probability. These probabilities are derived from a trust control algorithm, which is executed through a sequence of three systematic steps. In the first step, nodes are represented in a bidimensional phase space and grouped in clusters using a clustering algorithm and Gaussian mixture models. Nodes with outlier behavior are potentially untrustworthy. In the second step, the traffic pattern generated by nodes is analyzed. This involves calculating the distance between the actual traffic profile and a reference template based on digital Bessel functions using the functional scalar product. Greater distances indicate a higher probability of the node being unreliable. Finally, the content and coherence of the data are studied. A Volterra filter is employed to differentiate between valuable information and non-essential noise within data flows. Besides, a bank of Finite Impulse Response filters is utilized to detect anomalous internal data structures. Non-valuable information makes an edge node more likely to be untrustworthy.
When all three probabilities are combined in the global probabilistic trust model, all nodes for which the final value is below a given threshold are pruned. The model also considers a historical data series to avoid transitory effects.
Thus, three key contributions are presented in this study. Namely:
• A holistic mathematical probabilistic model to compute trust, considering several different perspectives from which data streams (and 6G devices) can be malicious and untrustworthy, including noise injection at the physical level and information level, Denial-of-Service attacks, and false data injections.
• A new mathematical model to represent traffic patterns in embedded 6G devices, based on the oscillatory behavior of Bessel functions.
• An innovative application of signal processing technologies, such as the Volterra filter, to detect false information attacks in real-time data streams in 6G nodes.
The rest of the manuscript is organized as follows. Section 2 introduces the state of the art in trust management and anomaly detection in 6G mobile networks and edge computing environments. Section 3 presents the proposed contribution, including the global probabilistic trust model and all required computational algorithms. Section 4 describes the experimental methodology and experiments. Section 5 discusses the experimental results, and Section 6 concludes the paper.
Several authors have analyzed trust management issues in 6G networks. Although some works are just white papers or position papers on this topic [16,17], the most common proposals define various blockchain-enabled solutions. In these schemes, asymmetric encryption is used to guarantee the identity of data sources [18], or distributed file storage supports the collection of various proofs describing the trustworthiness of devices [19]. Blockchain-enabled reputation systems, based on various statistics, have also been proposed [20]. The final decision is based on a fixed threshold that can only detect stationary behavior. The results show that this technology takes up to 50 days to converge, which is several orders of magnitude longer than the performance of our proposal.
In general, trust in the context of 6G networks is equivalent to network reliability, and typical trust models are based on Quality-of-Service (QoS) metrics such as packet loss or bit error rate [21]. Measurements can be registered using blockchain to add transparency and accountability to the management system [22]. However, on the one hand, blockchain-based solutions are very inefficient for managing large amounts of data or devices and have several limitations regarding data formats, latency, etc. Many of these limitations are not compatible with the extreme QoS of 6G. On the other hand, these network-based approaches have a limited understanding of trust because they only analyze QoS. Thus, the accuracy is limited to a maximum of approximately 75%. In contrast, the technology proposed in this paper aims to improve performance by up to 20% compared to these conventional models.
Artificial Intelligence is an enabling technology typically employed in trust management solutions. Many researchers have described how Artificial Intelligence can protect users from illegitimate data capture attacks in a zero-trust architecture [23]. However, works tend to be descriptive, focusing on limitations and opportunities [24]. Typical real contributions are synthetic data generators to confuse intrusive learning tools, which can be based on simple random distributions [25] or advanced generative models [26]. However, all these technologies require large and exhaustive datasets for training, which are not always available. Therefore, the accuracy is limited and only reaches 70% in scenarios with a low presence of malicious nodes (less than 10%). In fact, accuracy drops to 40% (or lower) as the number of malicious nodes increases. Although a higher number of nodes is an obstacle to achieving high success rates, the behavior of the proposed technology in this paper is better because the rates become stable (they do not increase, but they do not decrease either). Furthermore, deep learning techniques are implemented in resource management protocols for 6G networks [27] to ensure that all users are treated with equity and increase social trust in mobile technologies [28].
Similarly, artificial intelligence is integrated into other subsystems, such as the authentication module [29], to ensure objective network operation. Although preliminary results show these approaches achieve the expected goals, they focus on protocol enrichment or illegitimate data acquisition. In contrast, we focus on malicious information injection attacks in this paper.
Other trust models have been reported for various distributed systems [30]. The models are usually based on direct and indirect observations, which are later combined by a Bayesian expression [31]. The accuracy of these models is high, and the processing time is low, which is comparable to the results of the proposed solution in this paper. However, they require such heavy processing and large data messages to operate that they are limited to cloud services or similar distributed applications. Sensing nodes or other edge devices are not capable of operating these mechanisms.
Other technologies, such as hash functions or machine learning, are employed [32]. But again, many works consider trust equivalent to network reliability, so most proposals aim to identify the interface [33] or proxy [34] with the optimum QoS. Furthermore, these heterogeneous models have not been evaluated in edge computing environments or 6G networks but in smart grids or vehicular ad hoc networks [35]. This paper fills this gap by proposing a probabilistic trust model for 6G edge computing deployments.
On the other hand, several previous studies have focused not on addressing trust threats but rather on detecting anomalies or false data. The majority of these approaches are enabled by Artificial Intelligence techniques. Machine Learning technologies are applied to historical offline datasets [36] to rectify false information, and reinforcement learning is utilized to discourage devices from generating undesirable data flows [37]. Moreover, intelligent trajectory prediction schemes are reported too to mitigate or remove abnormal data from communication channels in real time [38]. Other conventional mathematical models have also been employed to characterize malicious data flows based on QoS indicators [39], control signals [40], or statistical coefficients [41]. The main problem with these solutions is their lack of flexibility. Trained models are limited to detecting anomalies that have been previously identified and labeled. Consequently, numerous similar technologies have been developed for varying scenarios, ranging from healthcare applications [42] to software-defined networks [43]. Results are promising, but the external validity of these solutions is not guaranteed, and further analysis and more transversal solutions are needed.
3 A Probabilistic Trust Model against False Information Injection
Future 6G networks will follow a Cloud Radio Access Network (C-RAN) topology. A set of

Figure 1: Proposed scenario
For each device

Figure 2: Hysteresis in the proposed trust model
However, even with this hysteresis behavior, mobile networks are affected by several different exogenous effects, so trust values may eventually fluctuate. To avoid these transient effects, the trust value at the
3.1 Outlier Detection: Gaussian Mixture Models and Clustering Algorithms
The proposed trust model and control algorithm are fully transparent to edge computing nodes and rely only on non-intrusive measurements. To analyze the node behavior and obtain the
In general, edge computing nodes execute infinite loops with a limited number of repetitive operations. Then, the two stochastic processes described above are expected to be stationary ((10) and (11)), with standard deviation
Additionally, we assume that both stochastic processes are ergodic. Then, the central and non-central moments computed from a time series can be used to estimate the general (statistical) moments. Specifically, we can estimate the first non-central moment (mean or expected value) and the second central moment (variance) by taking one measurement for each time slot
These four values are also independent and can be considered as the position coordinates of each device

Figure 3: Edge devices represented in a four-dimensional phase space
In general terms, all edge nodes have similar behavior, so they tend to appear grouped in point clouds in phase space. Any isolated device is a clear indicator of outlier behavior. To detect these outliers, we use a Gaussian mixture model (GMM).
We assume that the point (device) distribution in phase space is a realization of a four-dimensional random variable
In order to calculate the parameters
Since the expressions for estimating
Finally, probability
3.2 Traffic Patterns: Digital Bessel Functions
In some cases, edge devices may show average behavior that appears normal, but instantaneous traffic patterns follow a harmful or malicious flow. The probability
Software for embedded devices typically generates data following an oscillatory but decreasing pattern. For short periods, configuration and control messages must be exchanged (for media access negotiation with 6G nodes, for example), followed by a sequence of data using a low bitrate and, finally, a quite long period when the edge node is slept (not transmitting). 6G verticals (network segments specialized in some applications) for edge computing are typically designed according to this expected behavior, and other traffic patterns can cause a Denial-of-Service quite easily (given the ultra-massive device density in edge environments).
For each time frame, we can define a time series
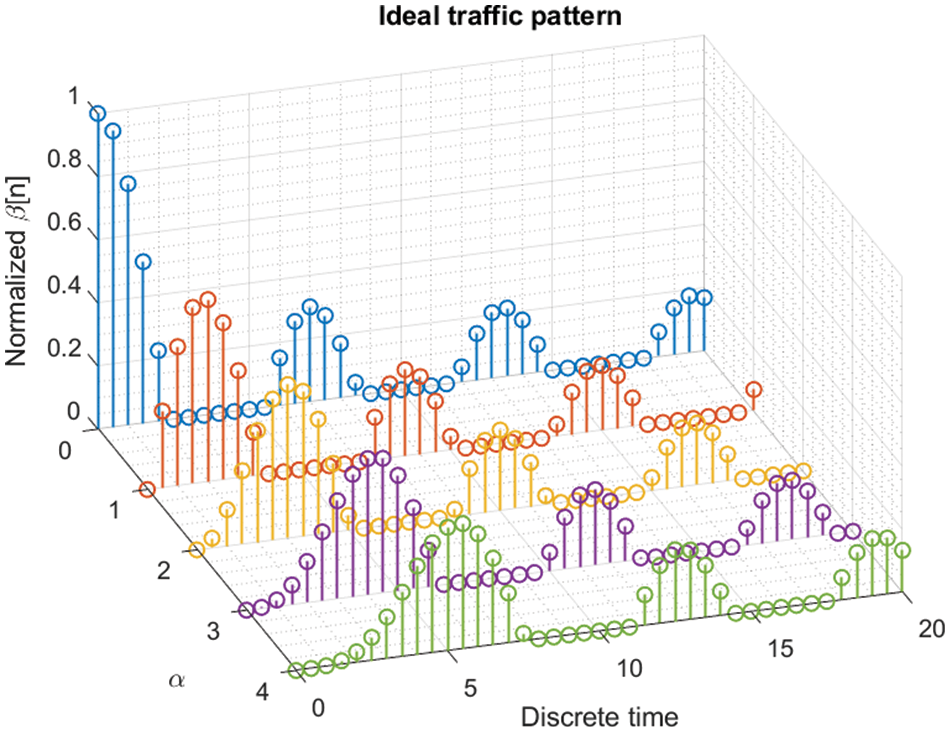
Figure 4: Proposed ideal traffic pattern

The distance
3.3 Data Filtering and Noise Detection
Finally, even if the traffic patterns are perfectly trustworthy, the information content can be malicious: noise or false information can be injected. The probability
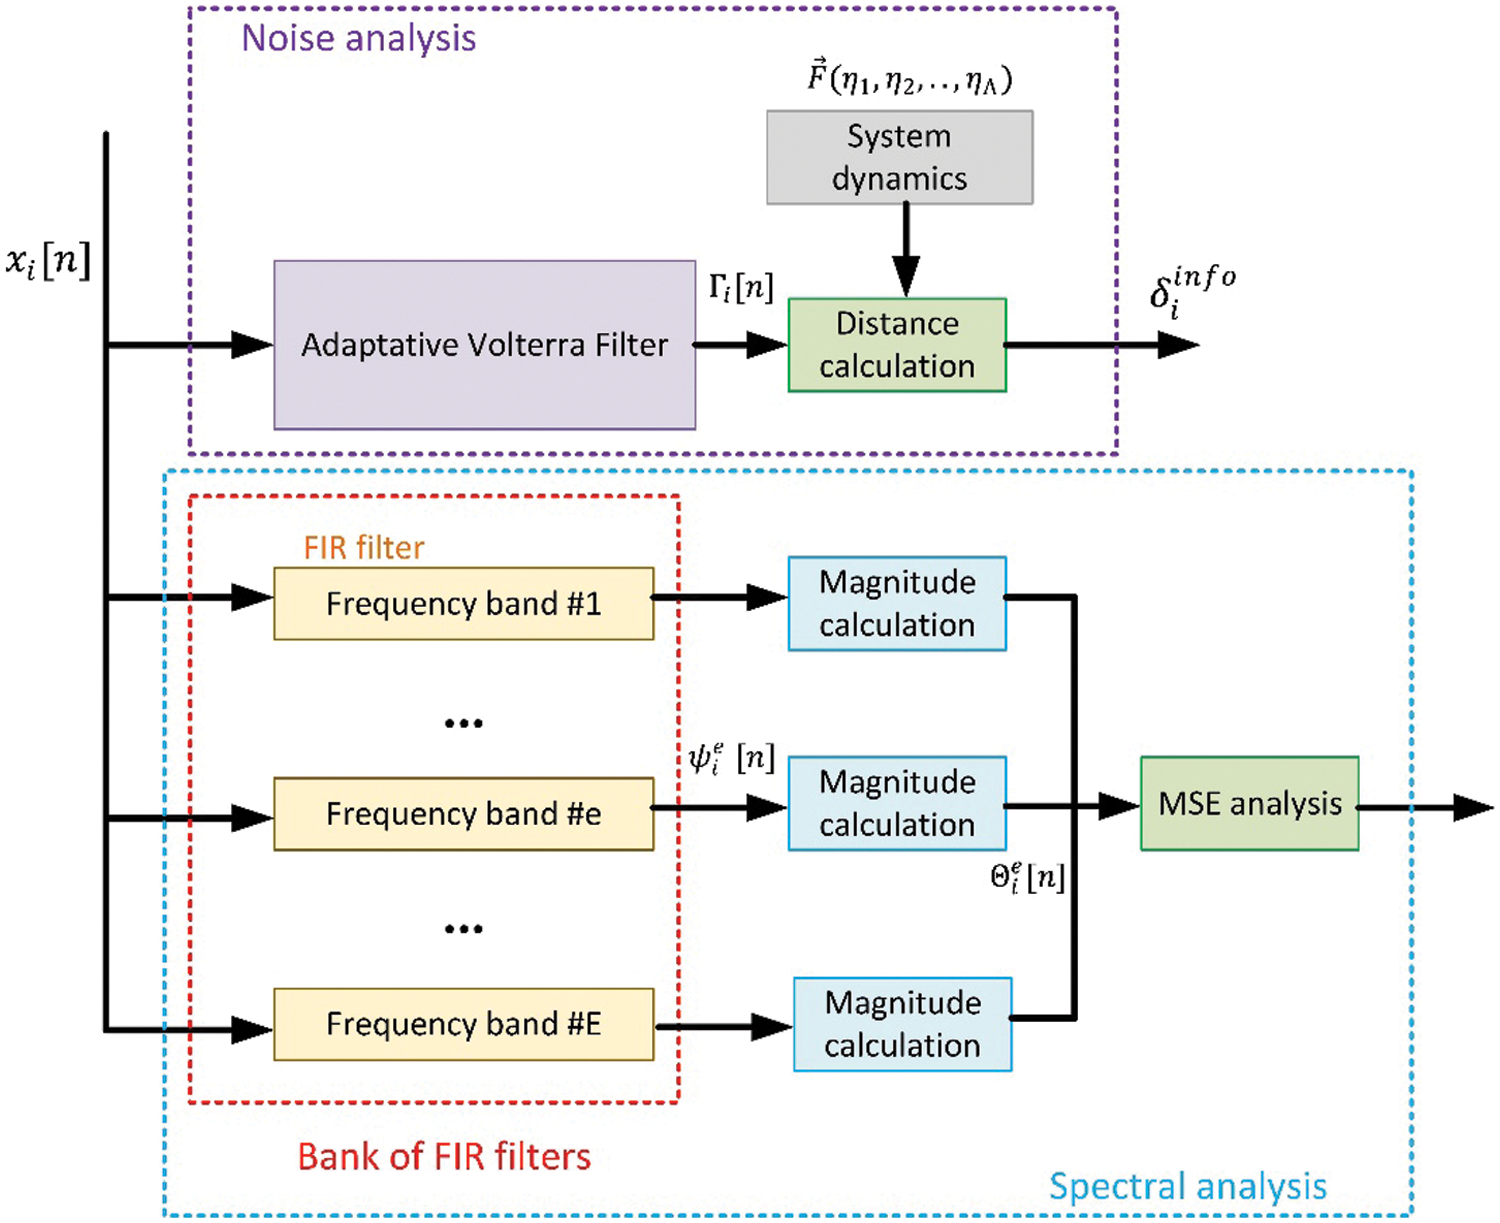
Figure 5: Filtering for malicious information and noise detection
On the other hand, edge nodes monitor physical variables that are governed by a previously known dynamic
This dynamic can be developed as Tylor series (36), where
The distance
Additionally, non-noisy false information could be generated and injected so that the Volterra filter produces a coherent flow even though the edge environment is under attack. A spectral analysis using a bank of
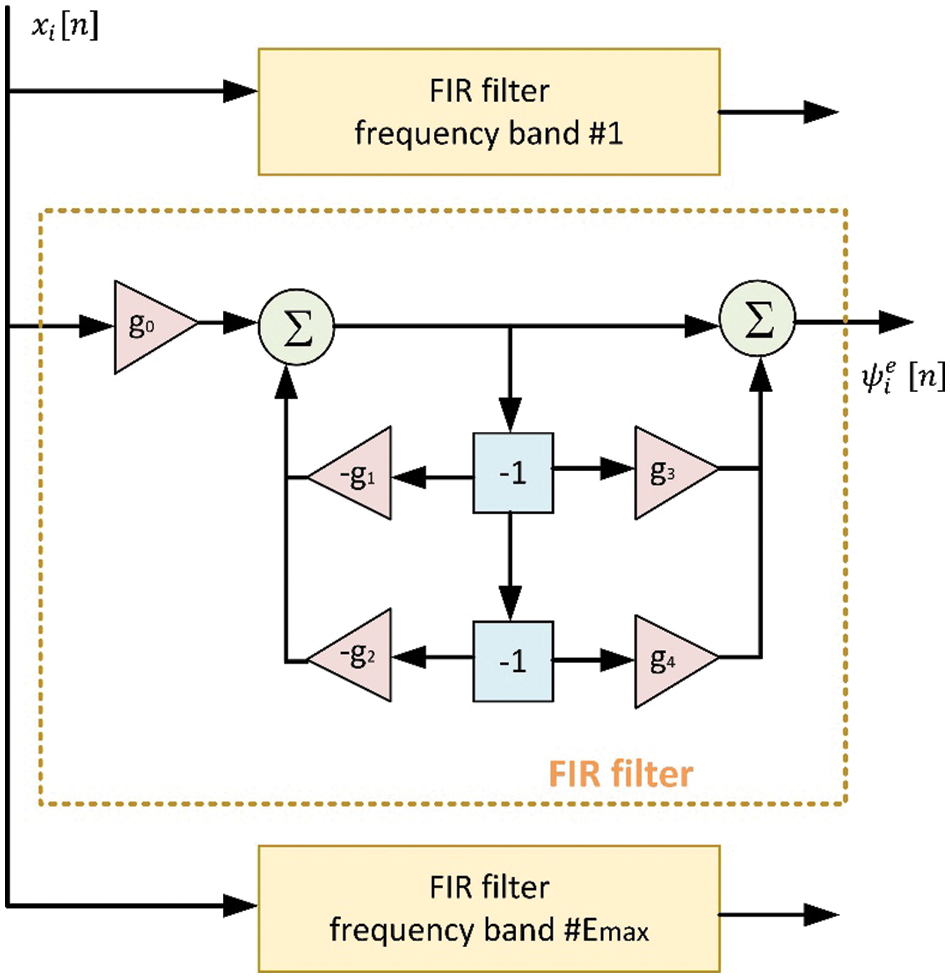
Figure 6: Bank of FIR filters and internal structure
The output of each FIR filter
Considering the MSE and the distance
An experimental validation was designed and performed to evaluate the performance of the proposed trust model and protection solution. Simulation scenarios and tools supported the validation, as commercial 6G networks and hardware are unavailable.
The validation included two different aspects. On the one hand, the level of protection provided by the proposed trust model and control algorithm is evaluated by the success detection rate against false injection attacks. Different types of attacks (false information and noise injection) were considered. False positive detections were also monitored. On the other hand, the performance regarding detection delay and scalability is analyzed in a second experiment. The required processing time is controlled by native instruments within the simulation framework.
The proposed scenario represents an industrial environment where comfort and working conditions are monitored. Temperature, humidity, and carbon dioxide levels are monitored through a dense deployment of edge computing nodes. The number of nodes was variable, but in different simulations, it evolved from ten (10) devices to twenty-five thousand (25,000) devices homogenously distributed over a geographical area of thirty thousand (30,000) square meters. Data streams were generated using a ‘replay’ process, where the source was a dataset taken from a real industrial edge deployment [50]. Edge nodes represented a 16-bit architecture. Malicious nodes and the attacks they perform are randomly selected for each different simulation. In each simulation, a percentage ranging from 1% to 10% of malicious nodes are generated. For the second experiment, higher percentages (40%) are considered to represent several scenarios, from very low risk to applications where the number of malicious nodes is higher than expected. The attacks are not continuous, and they start and end randomly throughout the simulation period. However, attacks have a minimum duration of one hundred (100) time frames. The entire scenario was served by two different 6G base stations.
Both attacks (noise injection and false information injection) are performed using numerical techniques. Noise injection attacks were supported by white noise generators (e.g., the wng function in MATLAB). The noise power was calculated to be at least 3 dB above the power of the information signals (calculated offline from datasets). On the other hand, false information injection attacks were supported by differential equations solved in real time using the Runge-Kutta method. These equations represented the climate evolution in a tropical forest (different from the industrial scenario considered in the dataset). The resulting trajectory is fictitious and is injected into the legitimate system to confuse end-user applications. In both cases, data samples are generated and sent to the base stations as regular messages.
Since this scenario was not exposed to any particular cyber risk and all types of attacks were equally likely, the configuration parameters were chosen to be homogeneous and uniform. Then, all parameters, including thresholds and weights, were determined from the theoretical standard and generic definitions from traffic or network theory. Table 1 shows the selected values.

The simulation scenario was implemented and executed using MATLAB 2022a software to perform the experiments. 6G wireless technologies were simulated using the MATLAB 5G Toolbox. Edge devices and remote cloud servers were represented by numerical functions that were periodically executed. The proposed trust model and control algorithm were also implemented using the MATLAB language, and existing libraries for common calculations (average, scalar products, sum, etc.) were extensively used to avoid any possible errors. In the second experiment, execution time monitoring functions were used.
In the first experiment, the success detection rate and false detection rate are monitored for different numbers of edge devices. Specific analyses for different types of attacks are also developed. In the second experiment, the processing delay required to complete a successful detection is monitored. The study is repeated for different numbers of edge devices, types of attacks, and percentages of malicious nodes. The results are also presented using the MATLAB suite.
All simulations were performed on a Linux architecture (Ubuntu 20.04 LTS) with the following hardware specifications: Dell R540 Rack 2U, 96 GB RAM, two processors, Intel Xeon Silver 4114 2.2 G, HD 2TB SATA 7.2 K rpm. All simulations represented an operating time of seventy-two (72) h. Each simulation was repeated twelve times, and the final results were obtained as the average of all partial results. With this configuration, and according to the t-student distribution, the error is below 3.055% with a probability of 99.5%. In addition, to ensure the internal validity of the results, outlier simulations are discarded and repeated to remove any exogenous effect.
Figs. 7 and 8 show the results of the first experiment. As can be seen, the success detection rate is higher than 80% for all types of attacks and for edge environments with a significant number of nodes. Since the spectral analysis and MSE calculation (see Section 3.3), as well as the clustering technique for outlier detection (Section 3.1), depending on the average behavior of the nodes, the results tend to be more stable and accurate when considering a significant number of edge devices. For small deployments, variability and non-convergent behavior are common and severely impact overall performance.
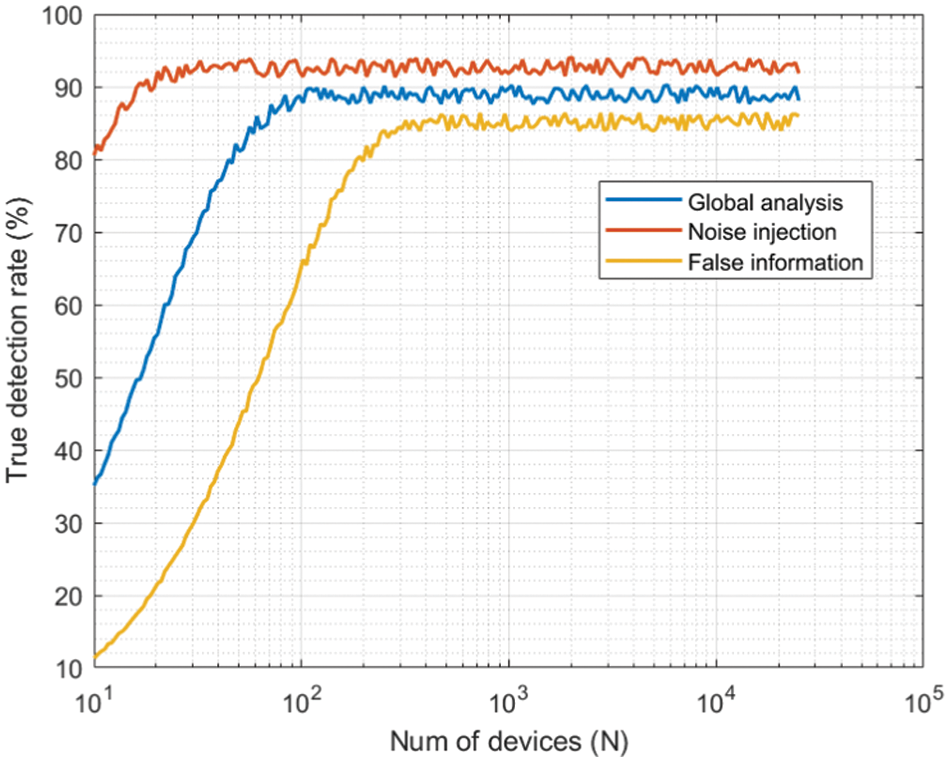
Figure 7: First experiment: results. True detection rate
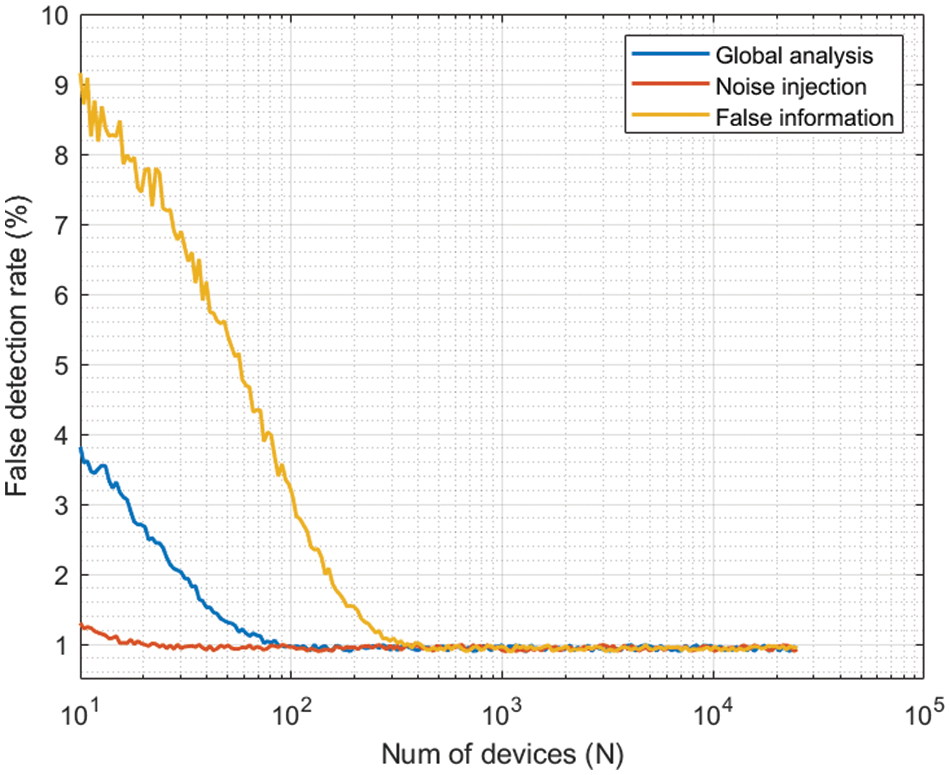
Figure 8: First experiment: results. False detection rate
The results for noise injection attacks are generally more favorable. Since noise can be easily detected by the Volterra filter (Section 3.3) and the traffic pattern analysis algorithm (Section 3.2), both of which are independent of the size of the edge environment, success detection rates for these attacks tend to be higher and almost invariant to the number of edge devices. The success detection rate for noise injection attacks can reach 92%. On the other hand, the true detection rate for false-information injection attacks diminishes when the number of edge devices within the 6G network is limited. That is because of two different causes, the proposed pattern-based outlier detection algorithm. As the number of independent samples (data sources) to be analyzed increases, the precision and significance of the results from this outlier detection algorithm also increase. Therefore, global detection rates improve. In contrast, for small sets of devices, the results can fluctuate and may not be fully reliable. Second, false information injection attacks are highly dependent on spectral analysis (which in turn is significantly influenced by the number of devices under consideration), so the performance is poorer. The detection success rate for these attacks follows an exponential-like pattern, starting from very low values (around 10%) and increasing to approximately 85% for larger deployments. The global behavior (considering both kinds of attacks) is clearly affected by the suboptimal performance in detecting false information, so it shows an exponential-like evolution as well, with the minimum detection rate being around 38% and the maximum rate approaching 90%.
Although this evidence is inconclusive, since 6G networks will be dense (with up to ten million devices per square kilometer), we can conclude that the proposed trust model and control algorithm are valid solutions for future edge computing environments. The reported true detection rate is actually higher than the performance provided by other advanced conventional models. For example, generative artificial intelligence models [26] report precision values around 70%, while network-based approaches [22] can only achieve a success rate of 75% (approximately). Reported results show a significant improvement.
Regarding the false detection rate (see Fig. 8), it follows a complementary behavior. Again, since false information injection attacks depend strongly on the calculation of an average behavior, the performance is worse for small edge deployments (for very small networks, the rate is around 9%). However, in this case, all curves converge to a very similar value for large deployments, and the false detection rate is kept slightly below 1%. Anyway, in all situations, the false detection rate is below 10%, which is acceptable in most engineered solutions and scientific experiments.
Figs. 9–12 show the results for the second experiment.
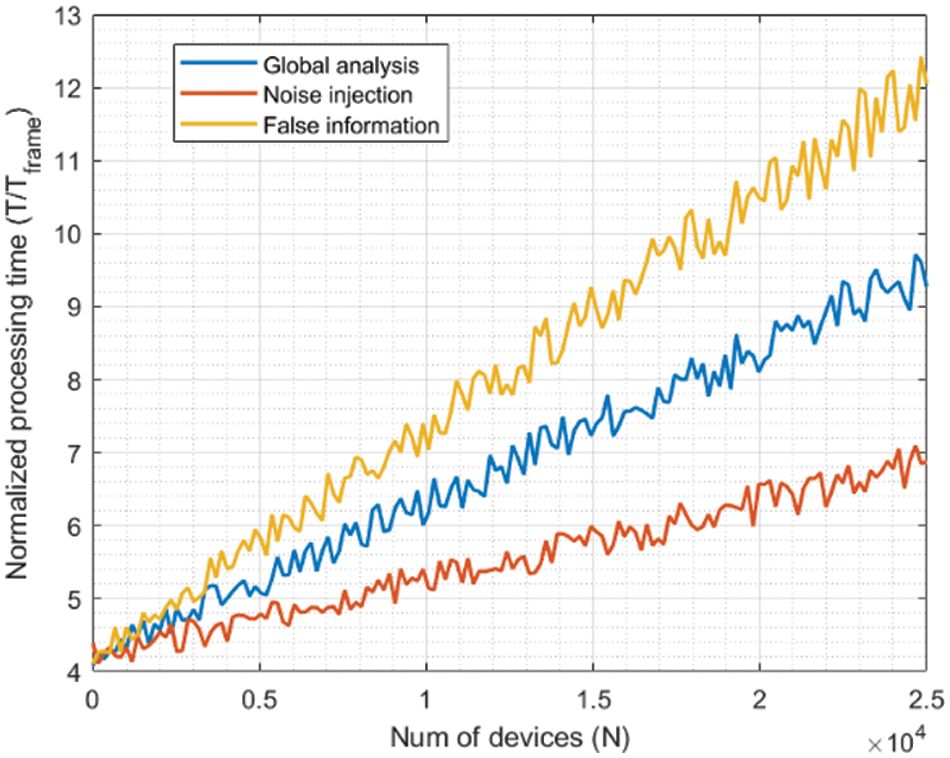
Figure 9: Second experiment: results for 1% of malicious nodes
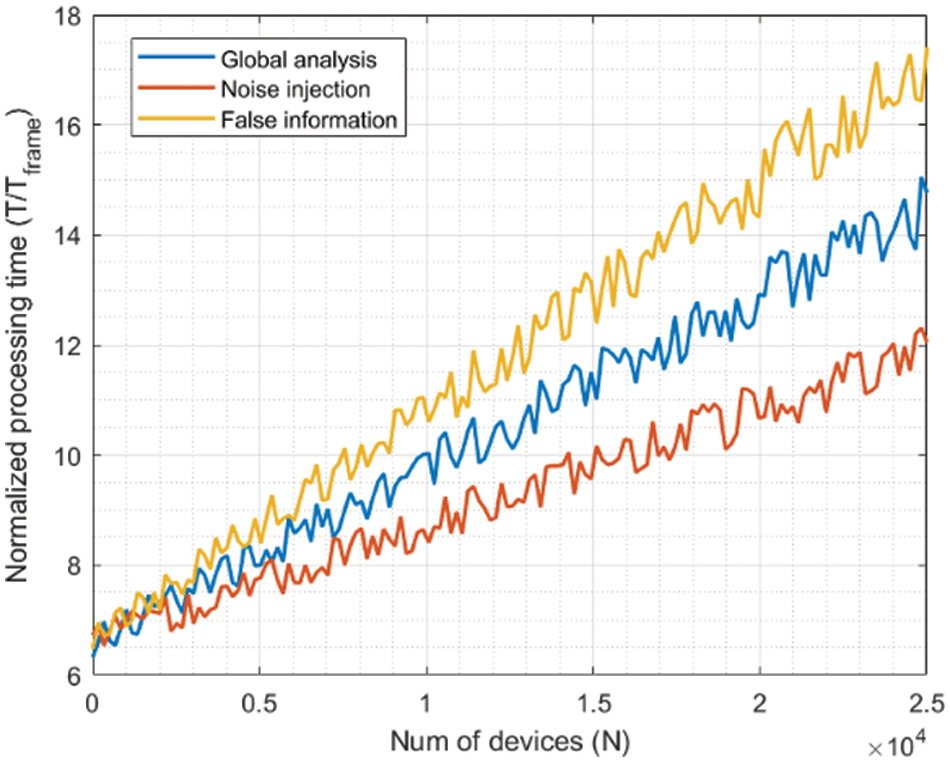
Figure 10: Second experiment: results for 5% of malicious nodes
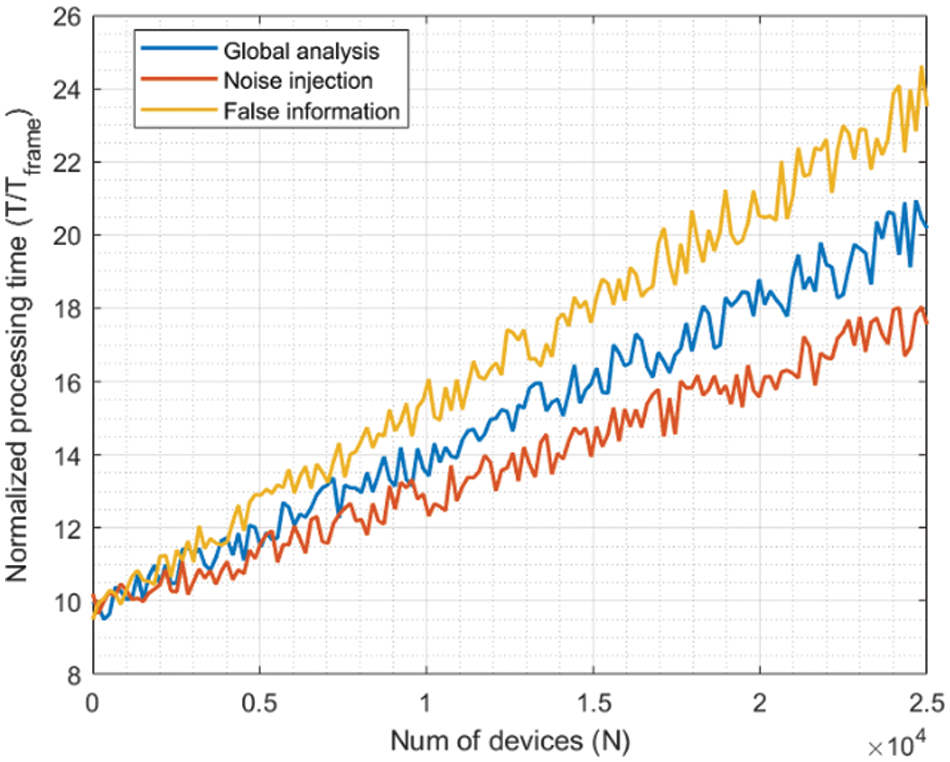
Figure 11: Second experiment: results for 10% of malicious nodes
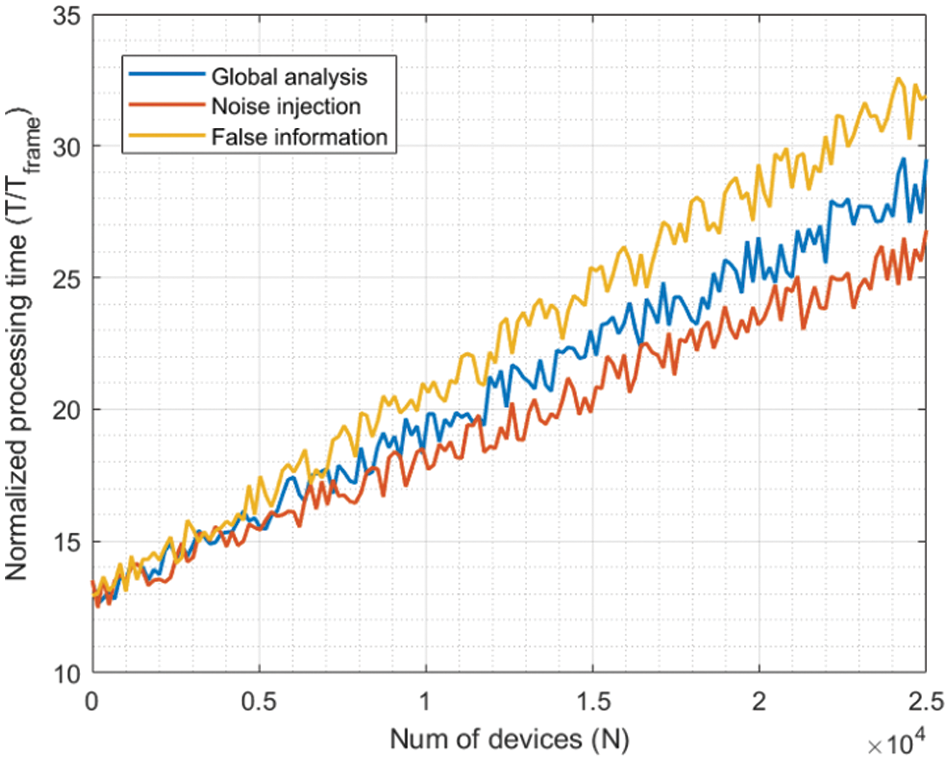
Figure 12: Second experiment: results for 40% of malicious nodes
As can be seen, the evolution is almost linear in all cases, as the number of operations in the proposed trust model and control algorithms also increases linearly with the number of edge nodes within the deployment to be protected. While environments with a malicious node rate between 1% and 5% show values in the same order of magnitude, the processing delay duplicates when the rate grows up to 10%. Similarly, when the rate achieves 40%, the processing delay also increases, but not as much as the number of malicious nodes. Thus, we can see that the increasing rate of processing delay is slower than linear evolution. That indicates that scalability is ensured regarding the number of nodes within the edge environment. Still, if a massive attack is performed, the model needs a longer time to converge, and only slow attacks would be successfully detected. If the attacks are shorter than the processing delay, they could be successful. Although the time frame could be adjusted to mitigate this challenge, different trust domains could be defined [51] to reduce processing delay.
In addition, noise injection attacks are detected faster in all cases. All indicators (outlier behavior, malicious traffic patterns, and unusual information content) are affected for noise injection attacks, so the final trust value suffers a more relevant decrease, and detection delays are shorter. However, for false information injection attacks, only spectral analysis is able to fully detect malicious behavior, and trust values decrease more slowly. And processing delays are longer. However, as more edge nodes are malicious, the differences become less significant (the differences between Figs. 9 and 12 are very significant). In these situations, the complexity of the data structures required to execute the proposed control algorithm (mainly the Gaussian mixture models) is high, and the computational delays start to become more relevant in the final processing delay than the convergence delays associated with the trust model. This phenomenon can be seen by comparing Figs. 9 and 12.
Despite all these limitations, the reported results significantly improve over state-of-the-art solutions. In most approaches, the processing or convergence time is longer and much less scalable. For example, in existing blockchain-enabled solutions [19], detection delays can grow up to 50 days. This is completely unsuitable for real-time scenarios.
In any case, even a linear evolution is typically considered a scalable growing order. The processing delays (global) range from ten (1% malicious nodes) to twenty (10% malicious nodes) and thirty (40% malicious nodes) time frames, which is a reduced delay compared to the duration of the most common malicious data injection attacks [14]. In conclusion, the proposed solution is scalable and can operate in all edge environments.
This paper presents a probabilistic trust model and control algorithm designed to detect and mitigate malicious information injection attacks within edge computing environments. The model determines the probability of any node to be trustworthy. Communication channels are pruned for those nodes whose probability is below a given threshold. Historical time series data with prior trust values are incorporated into the calculations to ensure stability and account for long-term behavior. The trust control algorithm includes three main phases, which feed the model with three different weighted and combined probabilities. Initially, using Gaussian mixture models and clustering techniques, nodes with anomalous behaviors are identified as outliers. In the subsequent phase, traffic patterns are analyzed by applying digital Bessel functions and the functional scalar product. Finally, the coherence of the information and content are analyzed. Utilizing a Volterra filter and a suite of Finite Impulse Response filters, the noise content and abnormal information sequences are detected.
The proposed solution is validated using MATLAB 2022 suite and simulation scenarios. Two experiments were conducted, demonstrating a detection success rate of up to 92% and exhibiting favorable linear scalability.
Future work will involve the application of the model to real 6G hardware devices and networks as soon as commercial equipment becomes available. Other possible opportunities for future research will be the exploration of alternative spectral analysis strategies and filters, such as Kalman filters or custom-designed solutions. Additionally, further studies could be conducted to determine optimal threshold values and weights. Moreover, future research may consider other types of attacks, such as fast Denial-of-Service attacks, where many illegitimate samples are injected within a short timeframe. Traffic theory strategies, such as traffic shaping, may offer a viable solution to this challenge.
Acknowledgement: The authors also gratefully acknowledge the helpful comments and suggestions of the reviewers, which have improved the presentation.
Funding Statement: The research leading to these results has received funding by Comunidad de Madrid within the framework of the Multiannual Agreement with Universidad Politécnica de Madrid to encourage research by young doctors (PRINCE project).
Author Contributions: The authors confirm contribution to the paper as follows: study conception and design: Borja Bordel Sánchez; data collection: Ramón Alcarria, Borja Bordel Sánchez; analysis and interpretation of results: Ramón Alcarria, Tomás Robles; draft manuscript preparation: Borja Bordel Sánchez, Tomás Robles. All authors reviewed the results and approved the final version of the manuscript.
Availability of Data and Materials: All the data used and analyzed is available in the manuscript.
Conflicts of Interest: The authors declare that they have no conflicts of interest to report regarding the present study.
References
1. Bordel B, Alcarria R, Robles T. Interferenceless coexistence of 6G networks and scientific instruments in the Ka-band. Expert Syst. 2023;e13369. [Google Scholar]
2. Wang LC, Peng H, Huang AC, Tsai AH. Latest advances in spectrum management for 6G communications. In: 2021 30th Wireless and Optical Communications Conference (WOCC); 2021; Taipei, Taiwan: IEEE. p. 295–7. [Google Scholar]
3. Alraih S, Shayea I, Behjati M, Nordin R, Abdullah NF, Abu-Samah A, et al. Revolution or evolution? Technical requirements and considerations towards 6G mobile communications. Sensors. 2022;22(3):762. [Google Scholar] [PubMed]
4. Bordel B, Alcarria R, Chung J, Kettimuthu R. Predictor-corrector models for lightweight massive machine-type communications in Industry 4.0. Integr Comput-Aided Eng. 2023; 30: 369–393. [Google Scholar]
5. Ahammed TB, Patgiri R, Nayak S. A vision on the artificial intelligence for 6G communication. ICT Express. 2023;9(2):197–210. [Google Scholar]
6. Bordel B, Alcarria R, Robles T, Martín D. Cyber-physical systems: extending pervasive sensing from control theory to the internet of things. Pervasive Mob Comput. 2017;40:156–84. [Google Scholar]
7. Zhao L, Zhou G, Zheng G, Chih-Lin I, You X, Hanzo L. Open-source multi-access edge computing for 6g: opportunities and challenges. IEEE Access. 2021;9:158426–39. [Google Scholar]
8. Leng J, Sha W, Wang B, Zheng P, Zhuang C, Liu Q, et al. Industry 5.0: prospect and retrospect. J Manuf Syst. 2022;65:279–95. [Google Scholar]
9. Liu X, Qian C, Hatcher WG, Xu H, Liao W, Yu W. Secure internet of things (IoT)-based smart-world critical infrastructures: survey, case study and research opportunities. IEEE Access. 2019;7:79523–44. [Google Scholar]
10. Callaghan CW. The global productivity growth and research productivity declines: the (urgent) need for a ‘fifth industrial revolution’ imperative. Int J Bus Innov Res. 2021;24(2):197–217. [Google Scholar]
11. Bordel B, Alcarria R, Robles T, Sánchez-Picot Á. Stochastic and information theory techniques to reduce large datasets and detect cyberattacks in ambient intelligence environments. IEEE Access. 2018;6:34896–910. [Google Scholar]
12. Hokazono Y, Kohara H, Kishiyama Y, Asai T. Extreme coverage extension in 6G: cooperative non-terrestrial network architecture integrating terrestrial networks. In: 2022 IEEE Wireless Communications and Networking Conference (WCNC); 2022; Austin, TX, USA: IEEE. p. 138–43. [Google Scholar]
13. Ziegler V, Schneider P, Viswanathan H, Montag M, Kanugovi S, Rezaki A. Security and trust in the 6G Era. IEEE Access. 2021;9:142314–27. [Google Scholar]
14. Sánchez BB, Alcarria R, Robles T. Stochastic models to mitigate sparse sensor attacks in continuous-time non-linear cyber-physical systems. Comput Mater Contin. 2023;76(3):3189–218. doi:10.32604/cmc.2023.039466. [Google Scholar] [CrossRef]
15. Keshk M, Sitnikova E, Moustafa N, Hu J, Khalil I. An integrated framework for privacy-preserving based anomaly detection for cyber-physical systems. IEEE Trans Sustain Comput. 2019;6(1):66–79. doi:10.1109/TSUSC.2019.2906657. [Google Scholar] [CrossRef]
16. Hewa T, Gür G, Kalla A, Ylianttila M, Bracken A, Liyanage M. The role of blockchain in 6G: challenges, opportunities and research directions. In: 2020 2nd 6G Wireless Summit (6G SUMMIT); 2020; Levi, Finland: IEEE. p. 1–5. [Google Scholar]
17. Ylianttila M, Kantola R, Gurtov A, Mucchi L, Oppermann I, Yan Z, et al. 6G white paper: research challenges for trust, security and privacy; arXiv preprint arXiv:2004.11665. 2020. [Google Scholar]
18. Wang X, Zhu H, Xiao H, Zhou Z, Yang S, Sun L. Blockchain-enhanced trust management for mobile edge computing-enabled intelligent vehicular collaboration in the 6G era. Trans Emerg Telecomm Technol. 2023;34(7):e4791. doi:10.1002/ett.4791. [Google Scholar] [CrossRef]
19. Putra GD, Dedeoglu V, Kanhere SS, Jurdak R. Toward blockchain-based trust and reputation management for trustworthy 6G networks. IEEE Netw. 2022;36(4):112–9. doi:10.1109/MNET.011.2100746. [Google Scholar] [CrossRef]
20. Li W, Meng W. BCTrustFrame: enhancing trust management via blockchain and IPFS in 6G era. IEEE Netw. 2022;36(4):120–5. doi:10.1109/MNET.013.2100768. [Google Scholar] [CrossRef]
21. Yin Y, Fang H. A novel multiple role evaluation fusion-based trust management framework in blockchain-enabled 6G network. Sensors. 2023;23(15):6751. [Google Scholar] [PubMed]
22. Kalla A, de Alwis C, Gochhayat SP, Gür G, Liyanage M, Porambage P. Emerging directions for blockchainized 6G. IEEE Consum Electron Mag. 2024;13(2):42–51. [Google Scholar]
23. Sedjelmaci H, Tourki K, Ansari N. Enabling 6G security: the synergy of zero trust architecture and artificial intelligence. IEEE Netw. 2023;38(3):171–7. [Google Scholar]
24. Ramezanpour K, Jagannath J. Intelligent zero trust architecture for 5G/6G networks: principles, challenges, and the role of machine learning in the context of O-RAN. Comput Netw. 2022;217:109358. [Google Scholar]
25. Li C, Guo W, Sun SC, Al-Rubaye S, Tsourdos A. Trustworthy deep learning in 6G-enabled mass autonomy: from concept to quality-of-trust key performance indicators. IEEE Vehicular Technol Mag. 2020;15(4):112–21. [Google Scholar]
26. Yang L, Li Y, Yang SX, Lu Y, Guo T, Yu K. Generative adversarial learning for intelligent trust management in 6G wireless networks. IEEE Netw. 2022;36(4):134–40. [Google Scholar]
27. Khan N, Coleri S, Abdallah A, Celik A, Eltawil AM. Explainable and robust artificial intelligence for trustworthy resource management in 6G networks. IEEE Commun Mag. 2024;62(4):50–6. [Google Scholar]
28. Guo W. Explainable artificial intelligence for 6G: improving trust between human and machine. IEEE Commun Mag. 2020;58(6):39–45. [Google Scholar]
29. Basha PH, Prathyusha G, Rao DN, Gopikrishna V, Peddi P, Saritha V. AI-driven multi-factor authentication and dynamic trust management for securing massive machine type communication in 6G networks. Int J Intell Syst Appl Eng. 2024;12(1s):361–74. [Google Scholar]
30. Wang J, Yan Z, Wang H, Li T, Pedrycz W. A survey on trust models in heterogeneous networks. IEEE Commun Surv Tutorials. 2022;24(4):2127–62. [Google Scholar]
31. Ramu N, Pandi V, Lazarus JD, Radhakrishnan S. A novel trust model for secure group communication in distributed computing. J Organ End User Comput (JOEUC). 2020;32(3):1–14. doi:10.4018/JOEUC. [Google Scholar] [CrossRef]
32. Junejo MH, Ab Rahman AAH, Shaikh RA, Mohamad Yusof K, Memon I, Fazal H, et al. A privacy-preserving attack-resistant trust model for internet of vehicles ad hoc networks. Sci Program. 2020;2020(2):1–21. doi:10.1155/2020/8831611. [Google Scholar] [CrossRef]
33. Siemers B, Fischer L, Lehnhoff S. A trust model in control systems to enhance and support cybersecurity. In: 2022 IEEE 7th International Energy Conference (ENERGYCON); 2022; Latvia: IEEE. p. 1–6. [Google Scholar]
34. Alarcon ML, Nguyen M, Debroy S, Bhamidipati NR, Calyam P, Mosa A. Trust model for efficient honest broker based healthcare data access and processing. In: 2021 IEEE International Conference on Pervasive Computing and Communications Workshops and other Affiliated Events (PerCom Workshops); 2021; Kassel, Germany: IEEE. p. 201–6. [Google Scholar]
35. Fernando NS, Acken JM, Bass RB. Developing a distributed trust model for distributed energy resources. In: 2021 IEEE Conference on Technologies for Sustainability (SusTech); 2021; Orange County, CA, USA: IEEE. p. 1–6. [Google Scholar]
36. Saeed MM, Saeed RA, Abdelhaq M, Alsaqour R, Hasan MK, Mokhtar RA. Anomaly detection in 6G networks using machine learning methods. Electronics. 2023;12(15):3300. doi:10.3390/electronics12153300. [Google Scholar] [CrossRef]
37. Prathiba SB, Raja G, Anbalagan S, Arikumar KS, Gurumoorthy S, Dev K. A hybrid deep sensor anomaly detection for autonomous vehicles in 6G-V2X environment. IEEE Trans Netw Sci Eng. 2022;10(3):1246–55. doi:10.1109/TNSE.2022.3188304. [Google Scholar] [CrossRef]
38. Raja G, Begum M, Gurumoorthy S, Rajendran DS, Srividya P, Dev K, et al. AI-empowered trajectory anomaly detection and classification in 6G-V2X. IEEE Trans Intell Transp Syst. 2022;24(4):4599–607. doi:10.1109/TITS.2022.3197446. [Google Scholar] [CrossRef]
39. Mendoza J, de-la-Bandera I, Burgueño J, Morillas C, Palacios D, Barco R. Anomaly detection and analysis framework for mobile networks. In: 2021 Joint European Conference on Networks and Communications & 6G Summit (EuCNC/6G Summit); 2021; Porto, Portugal: IEEE. p. 359–64. [Google Scholar]
40. Ghorbani H, Mohammadzadeh MS, Ahmadzadegan MH. Modeling for malicious traffic detection in 6G next generation networks. In: 2020 International Conference on Technology and Entrepreneurship-Virtual (ICTE-V); 2020; San José, CA, USA: IEEE. p. 1–6. [Google Scholar]
41. Han G, Tu J, Liu L, Martínez-García M, Peng Y. Anomaly detection based on multidimensional data processing for protecting vital devices in 6G-enabled massive IIoT. IEEE Internet Things J. 2021;8(7):5219–29. doi:10.1109/JIOT.2021.3051935. [Google Scholar] [CrossRef]
42. Wu X, Yang Y, Bilal M, Qi L, Xu X. 6G-enabled anomaly detection for metaverse healthcare analytics in internet of things. IEEE J Biomed Health Inform. 2023;1–10. [Google Scholar]
43. Nazar MJ, Alhudhaif A, Qureshi KN, Iqbal S, Jeon G. Signature and flow statistics based anomaly detection system in software-defined networking for 6G internet of things network. Int J Syst Assur Eng Manag. 2021;14:1–11. [Google Scholar]
44. Garzon SR, Yildiz H, Küpper A. Decentralized identifiers and self-sovereign identity in 6G. IEEE Netw. 2022;36(4):142–8. doi:10.1109/MNET.009.2100736. [Google Scholar] [CrossRef]
45. Silver EA. An overview of heuristic solution methods. J Oper Res Soc. 2004;55(9):936–56. doi:10.1057/palgrave.jors.2601758. [Google Scholar] [CrossRef]
46. Bordel B, Alcarria R, Robles T. Recognizing human activities in Industry 4.0 scenarios through an analysis-modeling-recognition algorithm and context labels. Integr Comput Aided Eng. 2022;29(1):83–103. doi:10.3233/ICA-210667. [Google Scholar] [CrossRef]
47. Wang D, Tan D, Liu L. Particle swarm optimization algorithm: an overview. Soft Comput. 2018;22(2):387–408. doi:10.1007/s00500-016-2474-6. [Google Scholar] [CrossRef]
48. Vaidyanathan PP. Design and implementation of digital FIR filters. In: Handbook of digital signal processing. Cambridge, Massachusetts, Estados Unidos: Academic Press; 1987. p. 55–172. [Google Scholar]
49. Duhamel P, Vetterli M. Fast fourier transforms: a tutorial review and a state of the art. Signal Process. 1990;19(4):259–99. doi:10.1016/0165-1684(90)90158-U. [Google Scholar] [CrossRef]
50. Bordel B, Alcarria R, de la Torre G, Carretero I, Robles T. Increasing the efficiency and workers wellbeing in the European bakery industry: an Industry 4.0 case study. In: International Conference on Information Technology & Systems; 2022; Cham: Springer International Publishing. p. 646–58. [Google Scholar]
51. Bordel B, Alcarria R, Martín D, Sánchez-de-Rivera D. An agent-based method for trust graph calculation in resource constrained environments. Integr Comput Aided Eng. 2020;27(1):37–56. doi:10.3233/ICA-190604. [Google Scholar] [CrossRef]
Cite This Article
 Copyright © 2024 The Author(s). Published by Tech Science Press.
This work is licensed under a Creative Commons Attribution 4.0 International License , which permits unrestricted use, distribution, and reproduction in any medium, provided the original work is properly cited.
 Downloads
 Citation Tools