
 Submit a Paper
 Propose a Special lssue
 Open Access
ARTICLE

LSTM Based Neural Network Model for Anomaly Event Detection in Care-Independent Smart Homes
1 Department of Computer Science and Information Engineering, Asia University, Taichung, 413, Taiwan
2 Symbiosis Centre for Information Technology (SCIT), Symbiosis International University, Pune, 411057, India
3 Center for Interdisciplinary Research, University of Petroleum and Energy Studies (UPES), Dehradun, 248007, India
4 Computer Engineering, Ronin Institute, Montclair, NJ 07043, USA
5 Management Department, College of Business Administration, Princess Nourah bint Abdulrahman University, P.O. Box 84428, Riyadh, 11671, Saudi Arabia
6 Department of Business Administration, Asia University, Taichung, 413, Taiwan
7 Department of Electrical and Computer Engineering, Lebanese American University, Beirut, 1102, Lebanon
8 Department of Computer Sciences, Faculty of Computing and Information Technology, Northern Border University, Rafha, 91911, Saudi Arabia
9 School of Science and Technology, Hong Kong Metropolitan University (HKMU), Hong Kong, China
* Corresponding Author: Brij B. Gupta. Email:
Computer Modeling in Engineering & Sciences 2024, 140(3), 2689-2706. https://doi.org/10.32604/cmes.2024.050825
Received 19 February 2024; Accepted 16 May 2024; Issue published 08 July 2024
 View Full Text
 Download PDF
Abstract
This study introduces a long-short-term memory (LSTM)-based neural network model developed for detecting anomaly events in care-independent smart homes, focusing on the critical application of elderly fall detection. It balances the dataset using the Synthetic Minority Over-sampling Technique (SMOTE), effectively neutralizing bias to address the challenge of unbalanced datasets prevalent in time-series classification tasks. The proposed LSTM model is trained on the enriched dataset, capturing the temporal dependencies essential for anomaly recognition. The model demonstrated a significant improvement in anomaly detection, with an accuracy of 84%. The results, detailed in the comprehensive classification and confusion matrices, showed the model’s proficiency in distinguishing between normal activities and falls. This study contributes to the advancement of smart home safety, presenting a robust framework for real-time anomaly monitoring.Keywords
Smart homes are revolutionizing how healthcare is delivered, offering a wide range of applications and services that contribute to the well-being and safety of individuals. Classified smart home services include healthcare, indicating the growing role of smart homes in this domain [1]. Smart homes provide a variety of devices such as security, health, assisted living, communication, convenience, and comfort, which can be categorized into lifestyle support, energy consumption and management, and safety [2,3]. In addition, smart healthcare is gaining momentum among the plethora of application contexts, signifying its increasing significance [4]. The applications of wireless sensor networks have prompted the development of smart healthcare, smart environment monitoring, and smart homeland security [5,6].
The functions and roles of smart homes are continuously evolving due to recent developments in Information and Communication Technology (ICT) and the Internet of Things (IoT) [7,8]. Smart healthcare is one of the domains in smart cities, with a different approach and business model, including assisting diagnosis and treatment, drug research, health management, disease prevention, risk monitoring, virtual assistants, and smart hospitals [9,10]. The rapid growth of IoT technology has revolutionized human life by inaugurating the concept of smart healthcare, among others [11,12]. With the help of modern technologies, such as the smart healthcare kit, networking devices, cloud service systems, and health information integration platforms, healthcare, security, and well-being services are provided to users at home [13].
Smart home systems provide a safe, comfortable, and convenient living environment for users, whereby users enjoy featured home services supported by the data collected and generated by smart devices in smart home systems. The rapid proliferation of embedded devices has led to the growth of IoT with applications in numerous domains such as home automation, healthcare, education, and agriculture [14,15]. A smart home is a collaborative collection of devices and subsystems, indicating its potential to integrate various technologies for healthcare purposes [16].
Smart homes are increasingly playing a vital role in healthcare, providing a wide array of services and applications that contribute to the well-being and safety of individuals. The continuous evolution of smart home functions and roles, coupled with advancements in ICT and IoT, indicates the growing significance of smart homes in the healthcare domain. In this context, robust anomaly detection systems that can accurately identify and alert caregivers to fall events are paramount. This research focuses on addressing this critical need using the capabilities of smart homes for healthcare. The contributions of this study are as follows:
• Innovative Application of Long Short-Term Memory (LSTM) Neural Networks for Smart Home Safety: This study introduces a novel LSTM-based neural network model designed to detect anomaly events in care-independent smart homes. The proposed approach focuses on the critical application of elderly fall detection, addressing a significant challenge in smart home healthcare.
• Addressing the Challenge of Unbalanced Datasets: The Synthetic Minority Over-sampling Technique (SMOTE) effectively balances the dataset and recognizes the prevalent issue of unbalanced datasets in time-series classification tasks. This crucial preprocessing step neutralizes bias, ensuring a fair and unbiased model training process.
• Temporal Dependency Modeling for Anomaly Recognition: The proposed LSTM model is trained on the enriched dataset to capture temporal dependencies essential for anomaly recognition. This enables the model to distinguish between normal activities and falls, significantly improving anomaly detection accuracy.
• Comprehensive Evaluation and Validation: The effectiveness of our model is thoroughly evaluated through a comprehensive set of classification and confusion matrices. The results detail the model’s proficiency in accurately identifying anomalies, with an overall detection accuracy of 84.
• Contribution to Smart Home Safety and Elderly Care: This study contributes significantly to advancing smart home safety by presenting a robust framework for real-time anomaly monitoring. It mainly emphasizes elderly fall prevention, enhancing the well-being and safety of individuals in care-independent living environments.
The rest of the paper is organized as follows: Section 2 presents the related work; the proposed approach is described in Section 3. Sections 4 and 5 indicate the results and conclusion.
This section gives a detailed analysis of recent research in anomaly detection. A comparative analysis of the research is presented in Table 1.
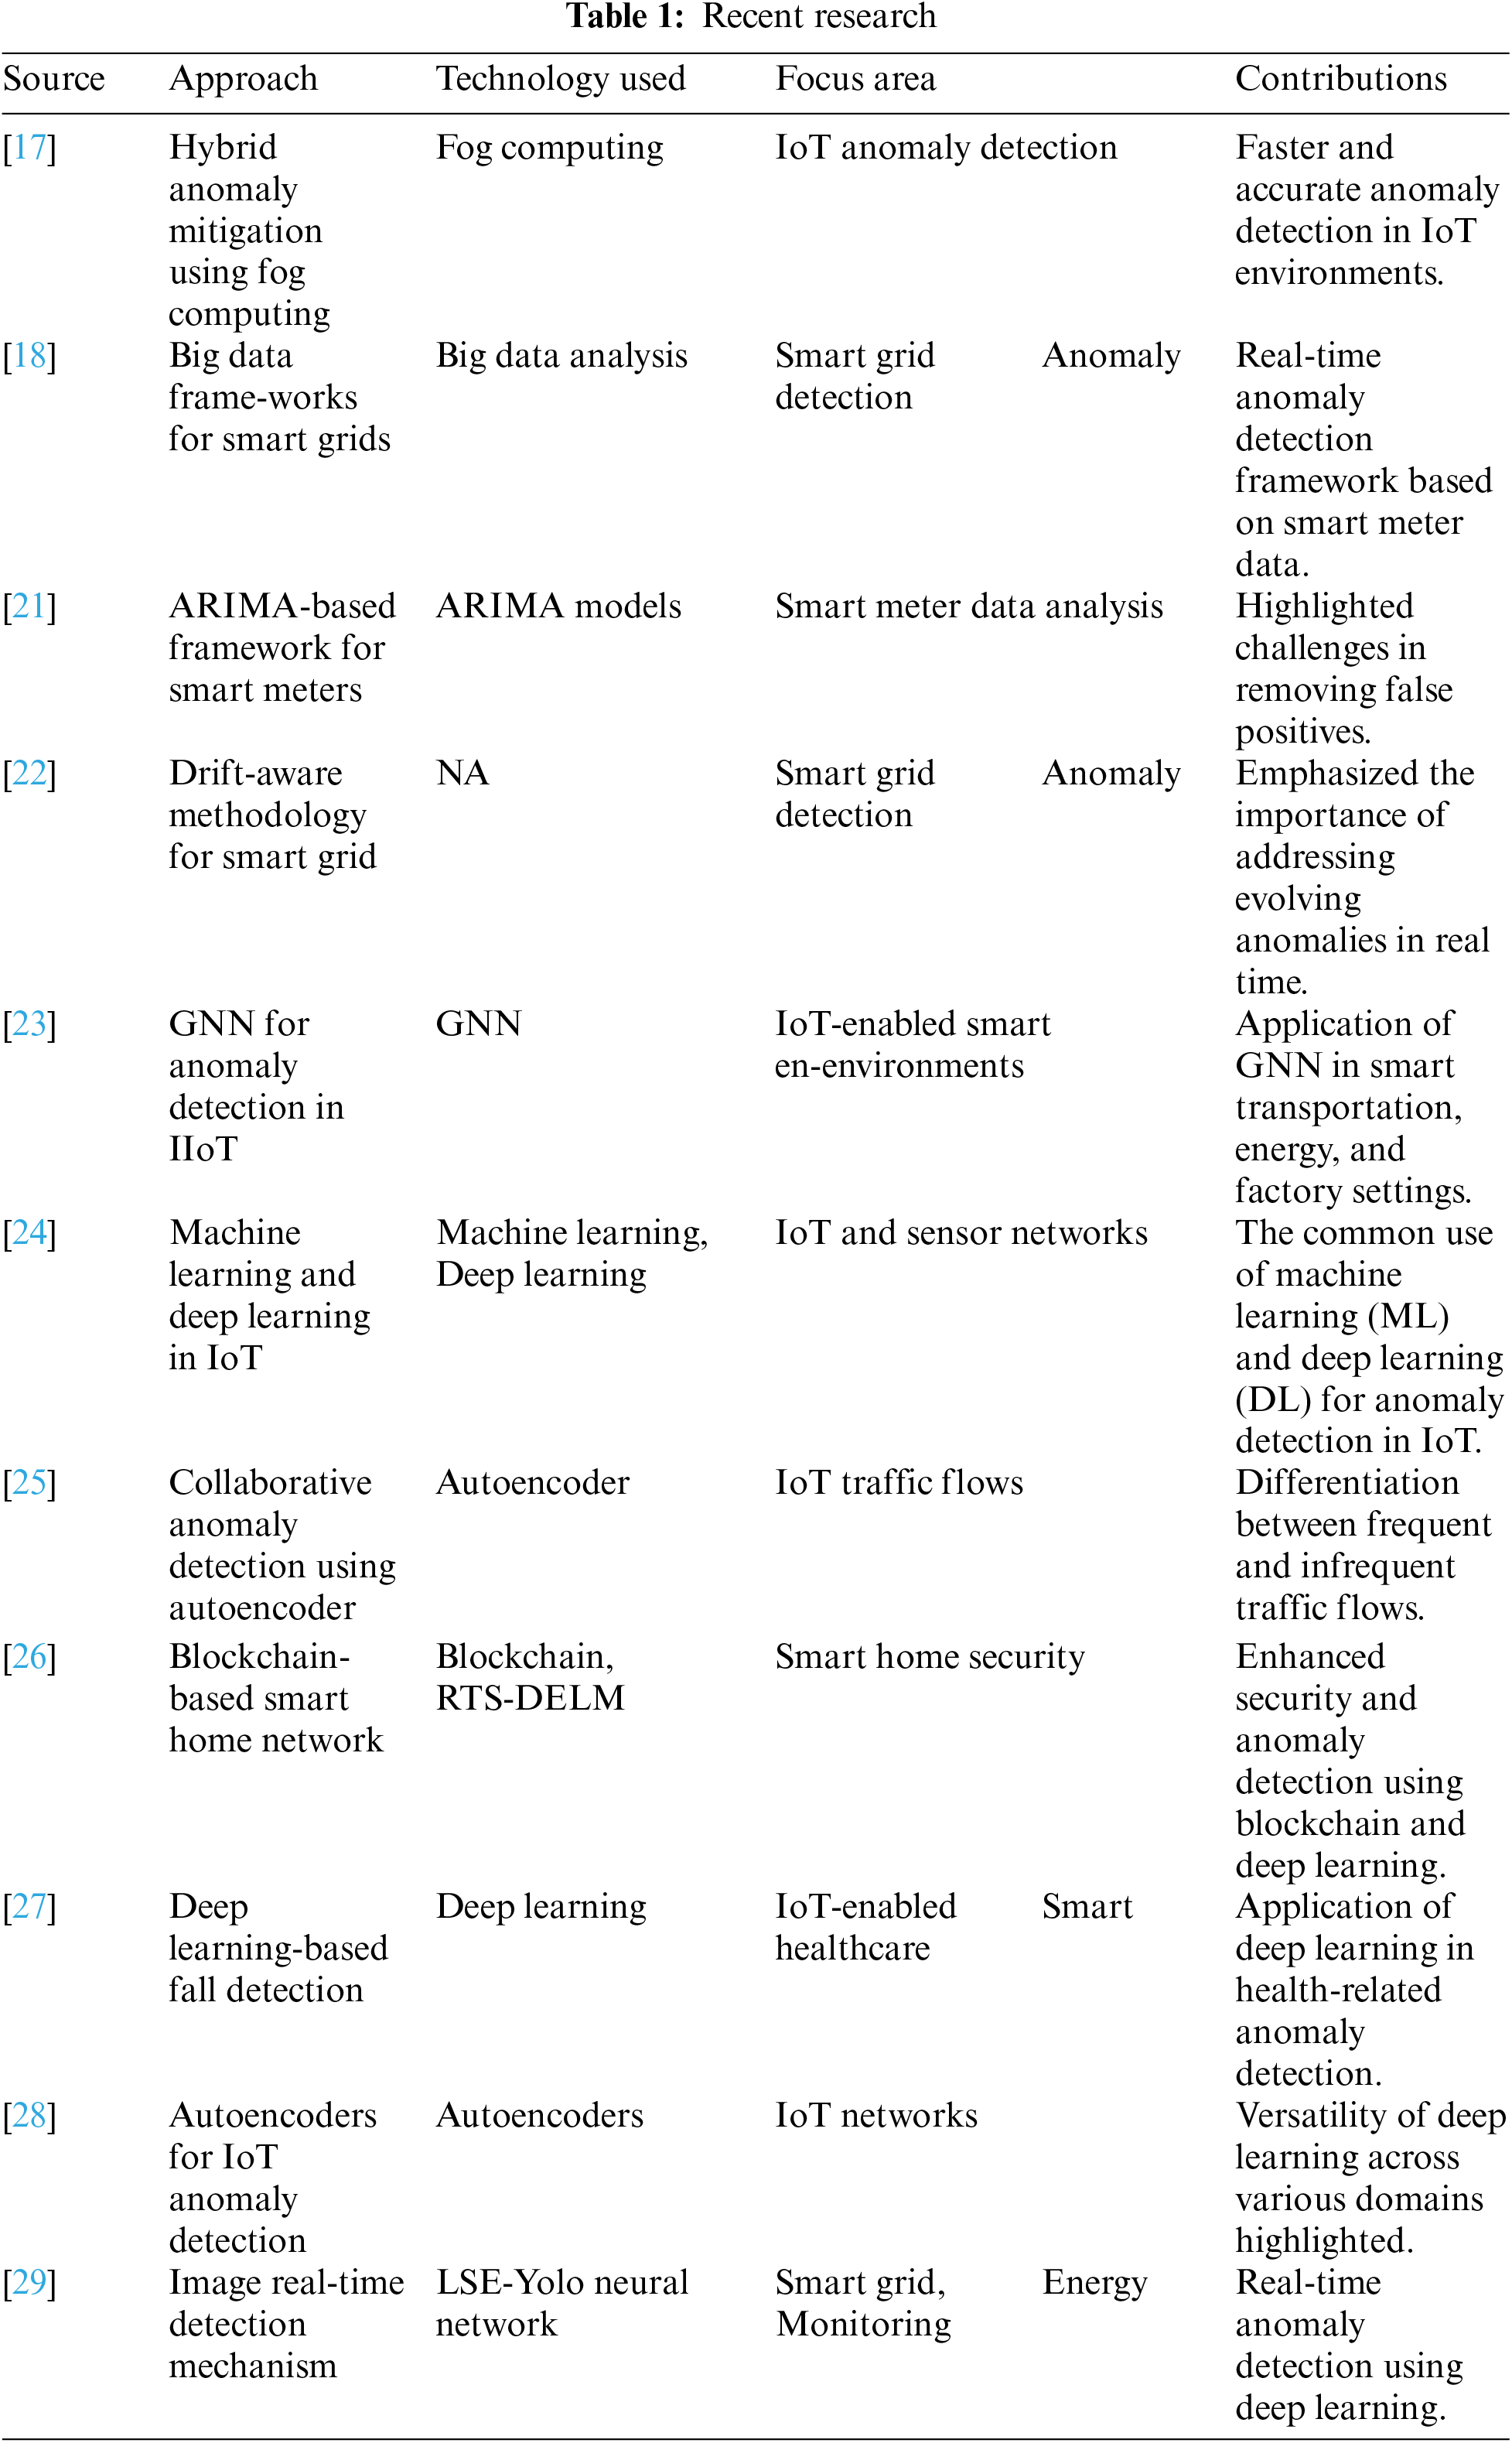
Anomaly detection in smart homes is critical to ensuring the security and well-being of individuals. Various frameworks have been proposed to address this challenge using technologies such as fog computing, big data analysis, cloud computing, and machine learning. Lawal et al. [17] proposed a hybrid anomaly mitigation framework for IoT using fog computing to ensure faster and more accurate anomaly detection. Similarly, Ansari et al. [18] evaluated big data frameworks for the analysis of smart grids and proposed a real-time anomaly detection framework based on smart meter data collected in smart grid big data. These frameworks demonstrated the integration of advanced technologies to address anomaly detection challenges in smart home environments. Hammad et al. [19] proposed an unsupervised TinyML approach for detecting urban noise anomalies in smart city environments. Trilles et al. [20] introduced an anomaly detection model that is based on artificial intelligence.
Apostol et al. [21] analyzed the data collected by smart meters using an autoregressive integrated moving average (ARIMA)-based framework for anomaly detection, highlighting the challenges in removing false positives. They underscored the complexity of anomaly detection in smart home environments and the need for robust frameworks. In addition, reference [22] discussed the drift-aware methodology for anomaly detection in the smart grid, emphasizing the importance of addressing evolving anomalies in real-time.
Moreover, the use of advanced technologies such as graph neural networks (GNN) for anomaly detection in the Industrial Internet of Things (IIoT)-enabled smart transportation, smart energy, and smart factories was proposed by [23]. This highlighted the application of cutting-edge technologies in addressing anomaly detection challenges in diverse smart home settings.
Machine learning and deep learning have also been applied to detect anomalies in smart homes. Demedeiros et al. [24] highlighted the common use of machine learning and deep learning for anomaly detection in IoT and sensor networks.
Similarly, Meidan et al. [25] proposed a collaborative anomaly detection method using an autoencoder to differentiate frequent and infrequent traffic flows. These frameworks demonstrated the integration of advanced computational techniques for effective anomaly detection.
Farooq et al. [26] proposed a blockchain-based smart home network architecture for intrusion detection empowered with a fused real-time sequential deep extreme learning machine (RTS-DELM) system model. They highlighted the potential of blockchain technology in enhancing security and anomaly detection in smart home environments.
Overall, the proposed frameworks for anomaly detection in smart homes encompass a wide range of technologies, including fog computing, big data analysis, machine learning, and blockchain. These frameworks aim to address the evolving challenges of anomaly detection in smart home environments, emphasizing the need for real-time, accurate, and robust detection methods.
The development of the proposed model was divided into two critical stages: data preprocessing and model training. A pivotal aspect of the preprocessing stage involved addressing the class imbalance inherent in the dataset. Fig. 1 depicts the original distribution of the ‘Normal’ and ‘Anomalous’ classes, showing a significant disparity with the ‘Normal’ class vastly outnumbering the ‘Anomalous’ class. Such an imbalance can introduce biases in the model, leading to poor generalization performance, particularly for the minority class.
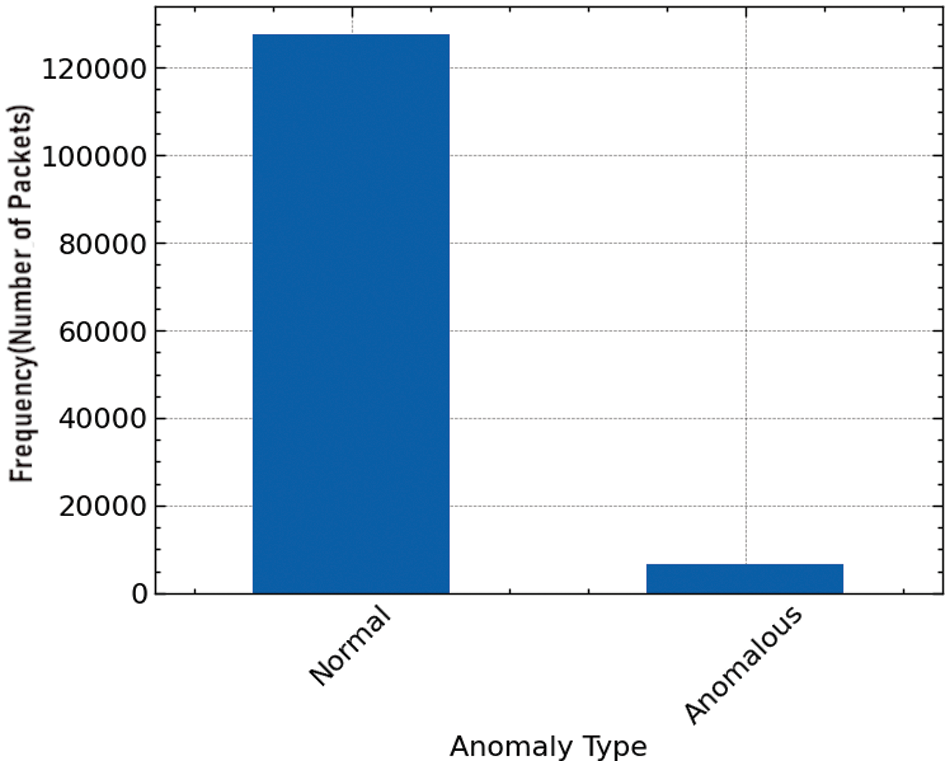
Figure 1: Distribution of target
The SMOTE was employed to mitigate this issue. This technique generated synthetic examples of the minority class, aiming to balance the class distribution without losing valuable information. The efficiency of this operation is illustrated in Fig. 2, which exhibits the post-SMOTE distribution where the frequency of ‘Normal’ and ‘Anomalous’ classes is nearly identical, demonstrating successfully balancing the dataset.
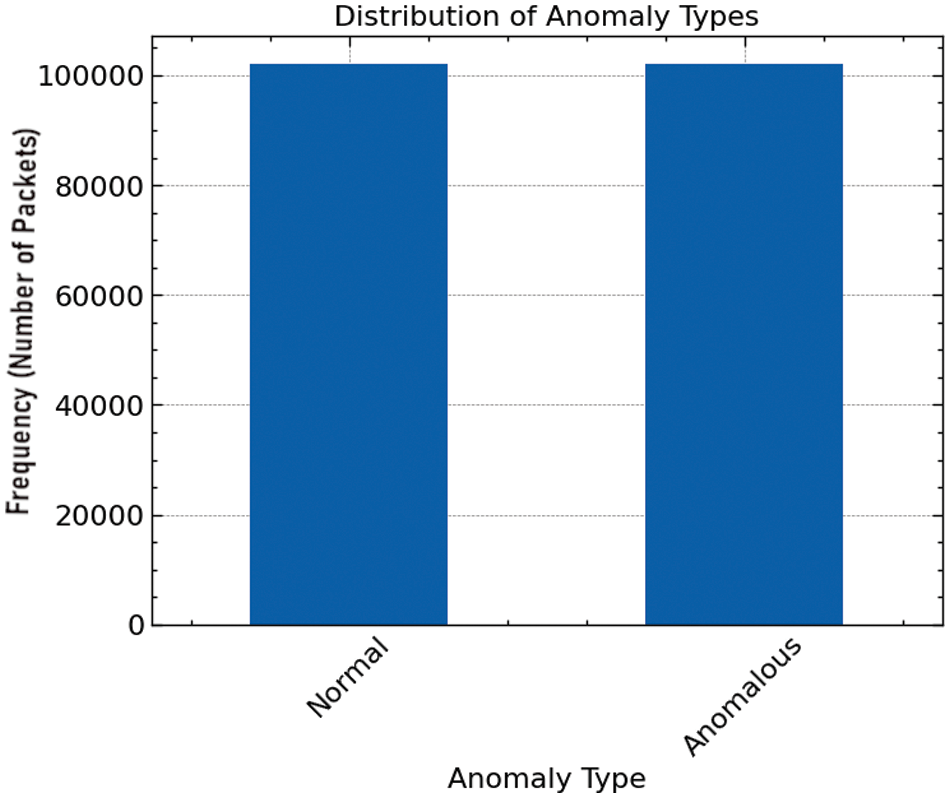
Figure 2: Distribution of target after SMOT
Preparing a balanced dataset is essential for training robust anomaly detection models, ensuring the model is not overly biased towards the majority class. This foundational preprocessing step facilitates a more equitable and accurate evaluation of the model’s performance across all classes, which is crucial in anomaly detection, where the cost of misclassifying an anomaly can be significant.
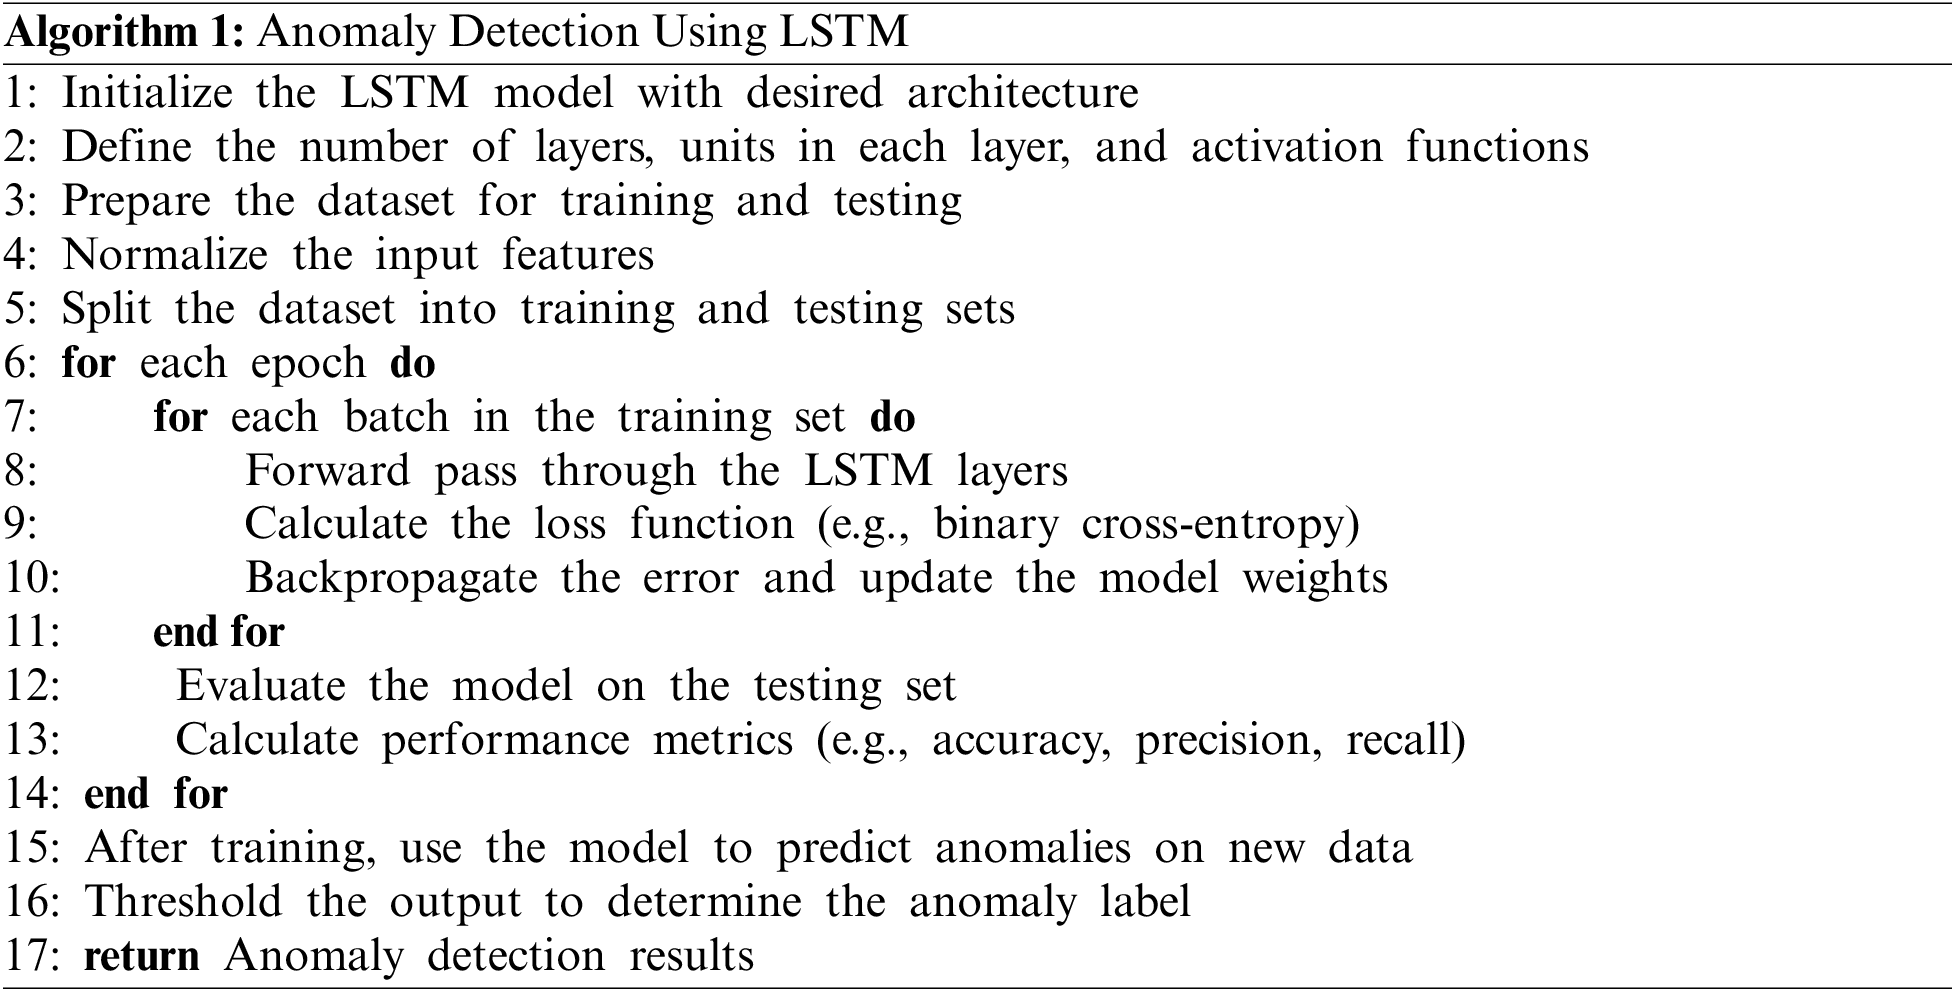
In the second stage of the methodology, the LSTM network was employed to identify anomalies within the balanced dataset. The LSTM model (Fig. 3) was initialized with an architecture to capture temporal dependencies and anomalies in time series data (Algorithm 1). The network comprised multiple layers with a predefined number of hidden units and utilized activation functions apt for sequence modeling. This study processed the data to ensure normalization of input features, enhancing the model’s ability to learn effectively.
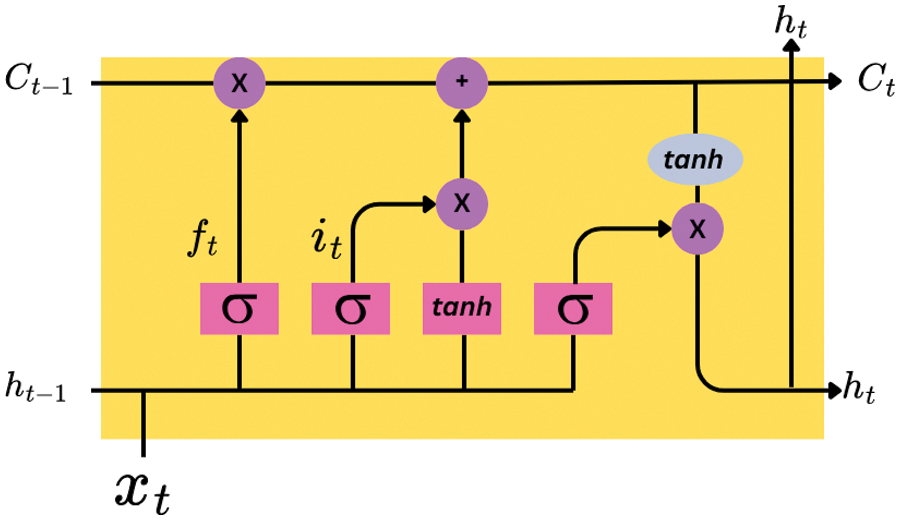
Figure 3: LSTM cell
The data was divided into distinct training and testing sets to facilitate the evaluation of the model’s generalization capabilities. During training, the model underwent numerous epochs where each batch was sequentially fed through the LSTM layers. A binary cross-entropy loss function was utilized to quantify the discrepancy between the predicted outcomes and the actual labels, and the gradients of this loss were backpropagated to refine the model parameters. After each epoch, the model was assessed on the testing set, and key performance metrics, including accuracy, precision, and recall, were computed to gauge the detection efficacy.
Upon completing the training process, the LSTM model was tasked with predicting anomalies in new, unseen data. The predictions were thresholded to classify events into ‘normal’ or ‘anomalous’, providing a discrete indication of the model’s anomaly detection results. This LSTM-based approach (Algorithm 1) is a robust framework for identifying anomalous patterns, which is critical in ensuring timely and accurate detection within smart environments.
In the study of enhancing safety within smart home environments, mainly focusing on the independent living of the elderly, a pivotal dataset from Kaggle titled “Anomaly Detection Falling People” has been employed [30]. This dataset originates from a thesis aiming to develop safer smart environments by detecting falls among elderly individuals. In order to address the challenge of fall detection, the dataset comprises three-dimensional parameters: X, Y, and Z, that represent sensor positions on the body at each recorded sample. The dataset excludes timestamps from each measurement to mitigate the low dimensionality often encountered in time series classification tasks and prevent timestamps from becoming the principal component for classification, which can lead to unbalanced learning tasks and restrict the generalizability of the findings. The sensor data, obtained through four sensors affixed to the person’s chest, ankles, and belt, is encoded through one-hot encoded representations to delineate each sensor’s activity. In addition, the dataset is annotated with labels to indicate the nature of the event being recorded, where ‘0’ signifies a normal event and ‘1’ represents an anomalous event, specifically a fall. This structured approach facilitates the development of machine learning models capable of distinguishing between normal activities and fall events, thereby contributing to the creation of safer living environments for the elderly through anomaly detection techniques in neural networks.
Violin plots were generated to indicate the relationship between the features and the target variable within the dataset. Fig. 4 presents a violin plot that illustrates the distribution and density of the sensor position values (X, Y, Z) for the target variable, which categorizes the events as normal (0) or anomalous (1). This visual representation allows for examining the feature distributions across the two classes, providing insights into how each sensor position correlates with the occurrence of a fall. Similarly, Fig. 5 showcases a violin plot of the one-hot encoded sensor activity features (010-000-024-033, 010-000-030-096, 020-000-032-221, and 020-000-033-111) against the target variable. This plot offers an intuitive understanding of the sensor activation patterns in relation to the labeled events, highlighting the potential predictors of a falling incident. The breadth and contours of the violins in both plots are indicators of the feature value distributions, revealing significant differences between normal activities and fall events, which are crucial for the model’s ability to distinguish between these two scenarios.
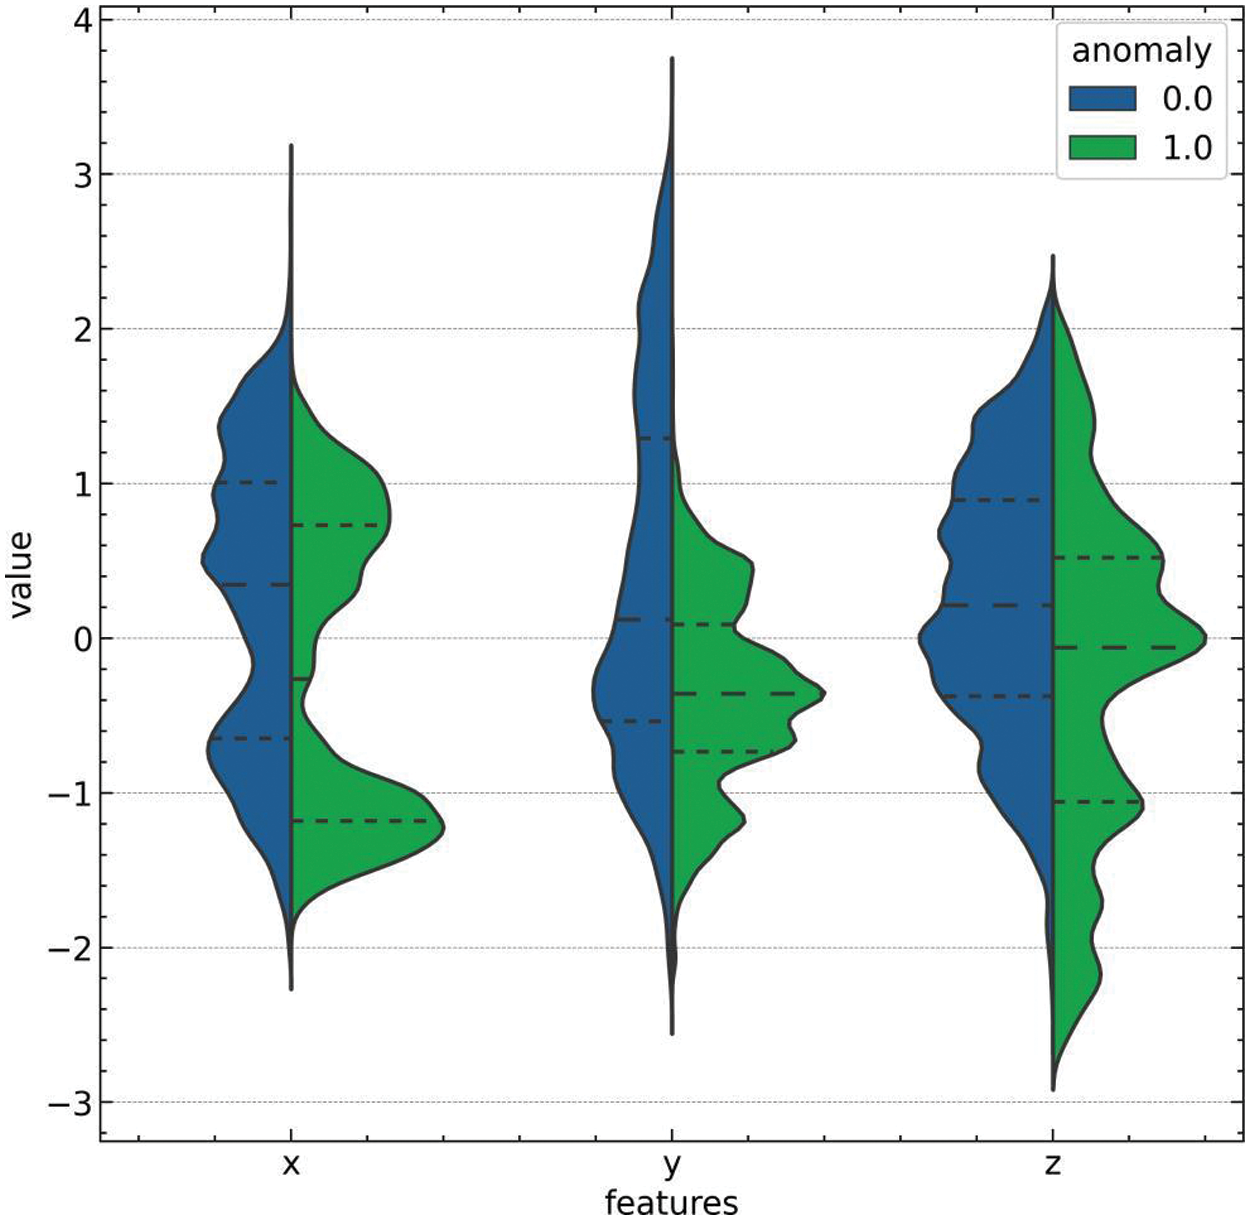
Figure 4: Violin plot of position
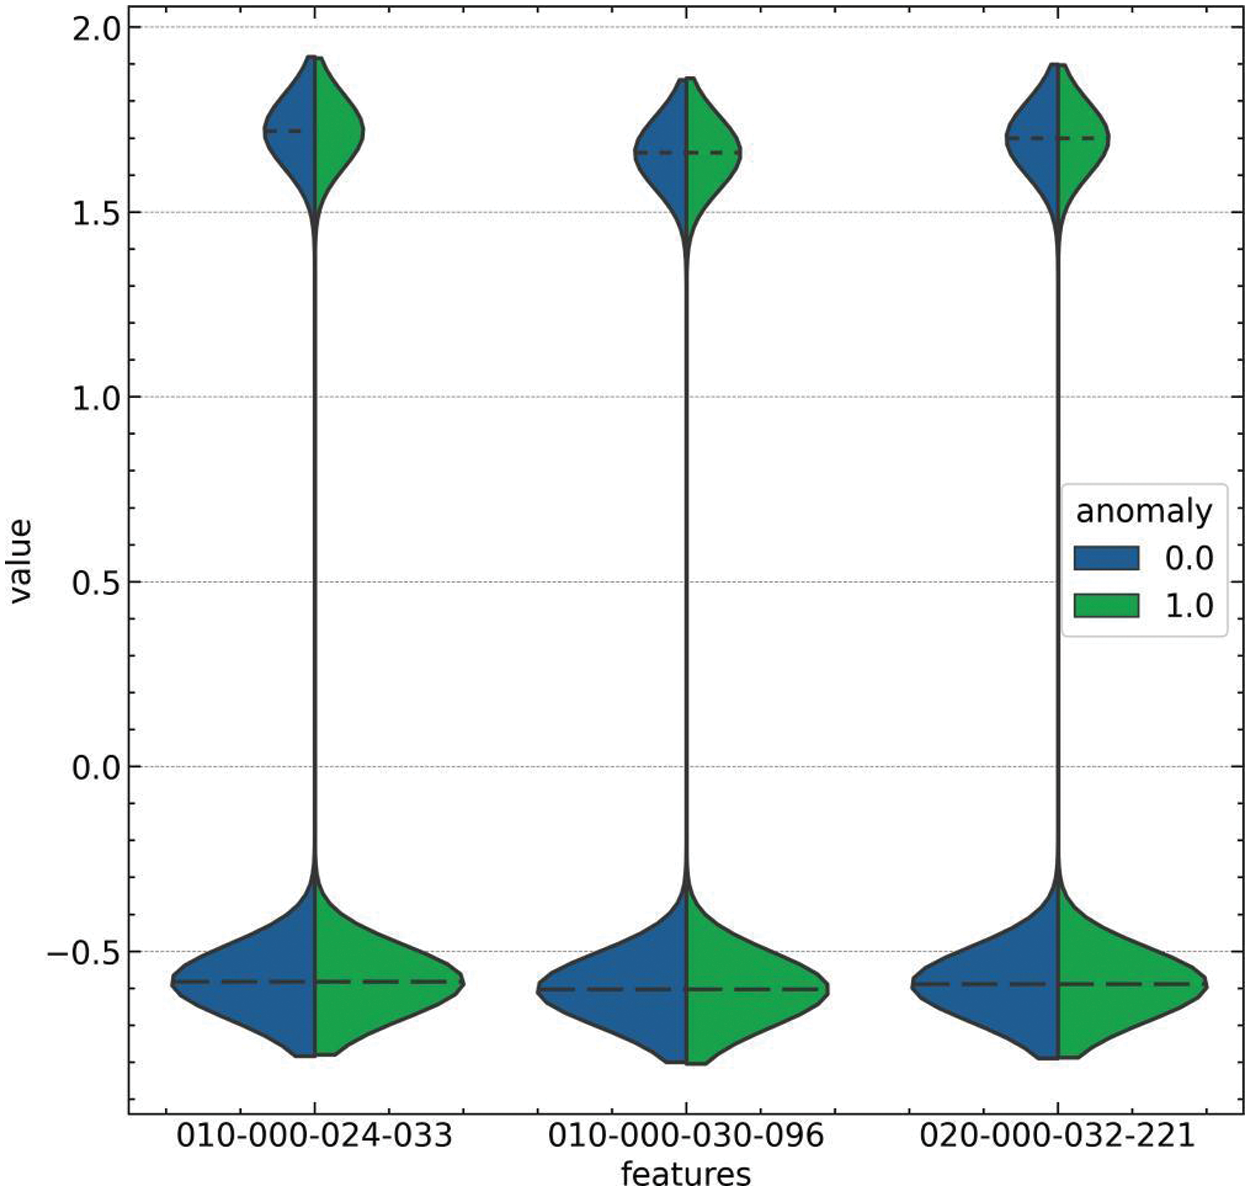
Figure 5: Violin plot of sensors
Pair plots were constructed to comprehend the intricate relationships between the features and the target variable indicative of normal and anomalous events, as depicted in Fig. 6. Fig. 6 provides a granular view of the pairwise relationships between the sensor position features (X, Y, Z) and the target, with a distinct separation observable between the normal (0) and anomalous (1) data points. The plots provide a multidimensional perspective of the feature interactions and how they collectively relate to the occurrence of falls, which is essential for developing robust anomaly detection models. Fig. 7, on the other hand, visualizes the pairwise relationships between the one-hot encoded sensor activity features (010-000-024-033, 010-000-030-096, 020-000-032-221, and 020-000-033-111) and the target. These representations are particularly telling, highlighting the disparities in sensor activations corresponding to normal and fall events. The density distributions along the diagonals of both pair plots illuminate the underlying data structure, which can be applied to enhance the predictive performance of machine learning algorithms employed in detecting falls within smart home environments for the elderly.
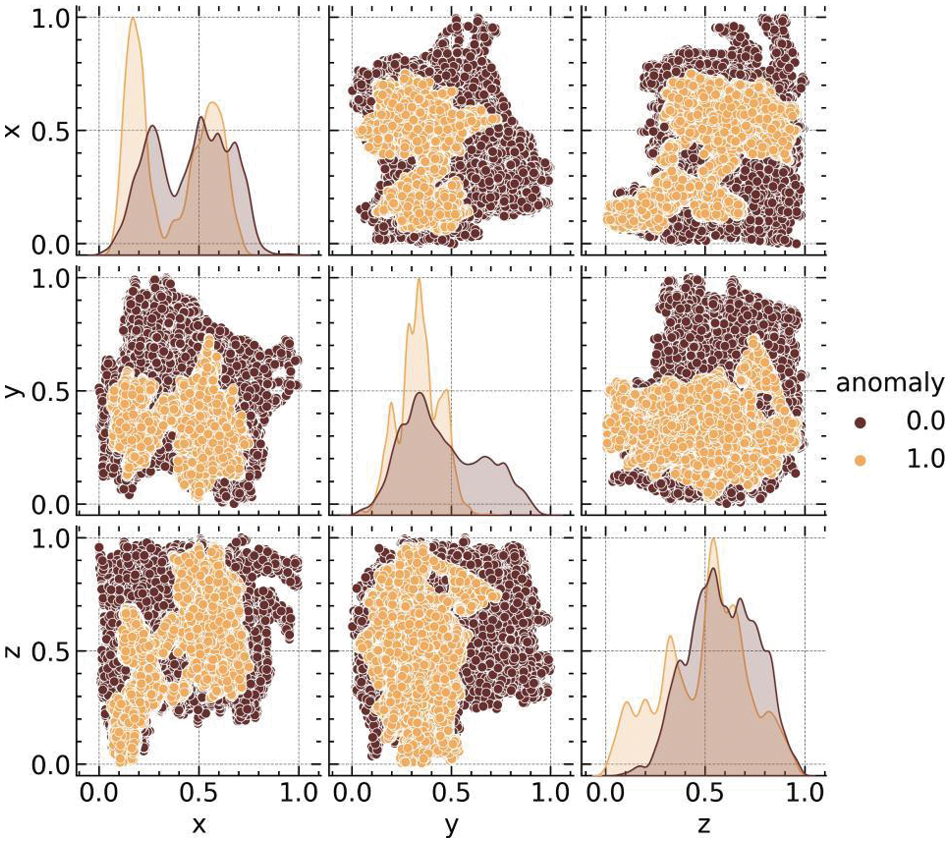
Figure 6: Pair plot of position
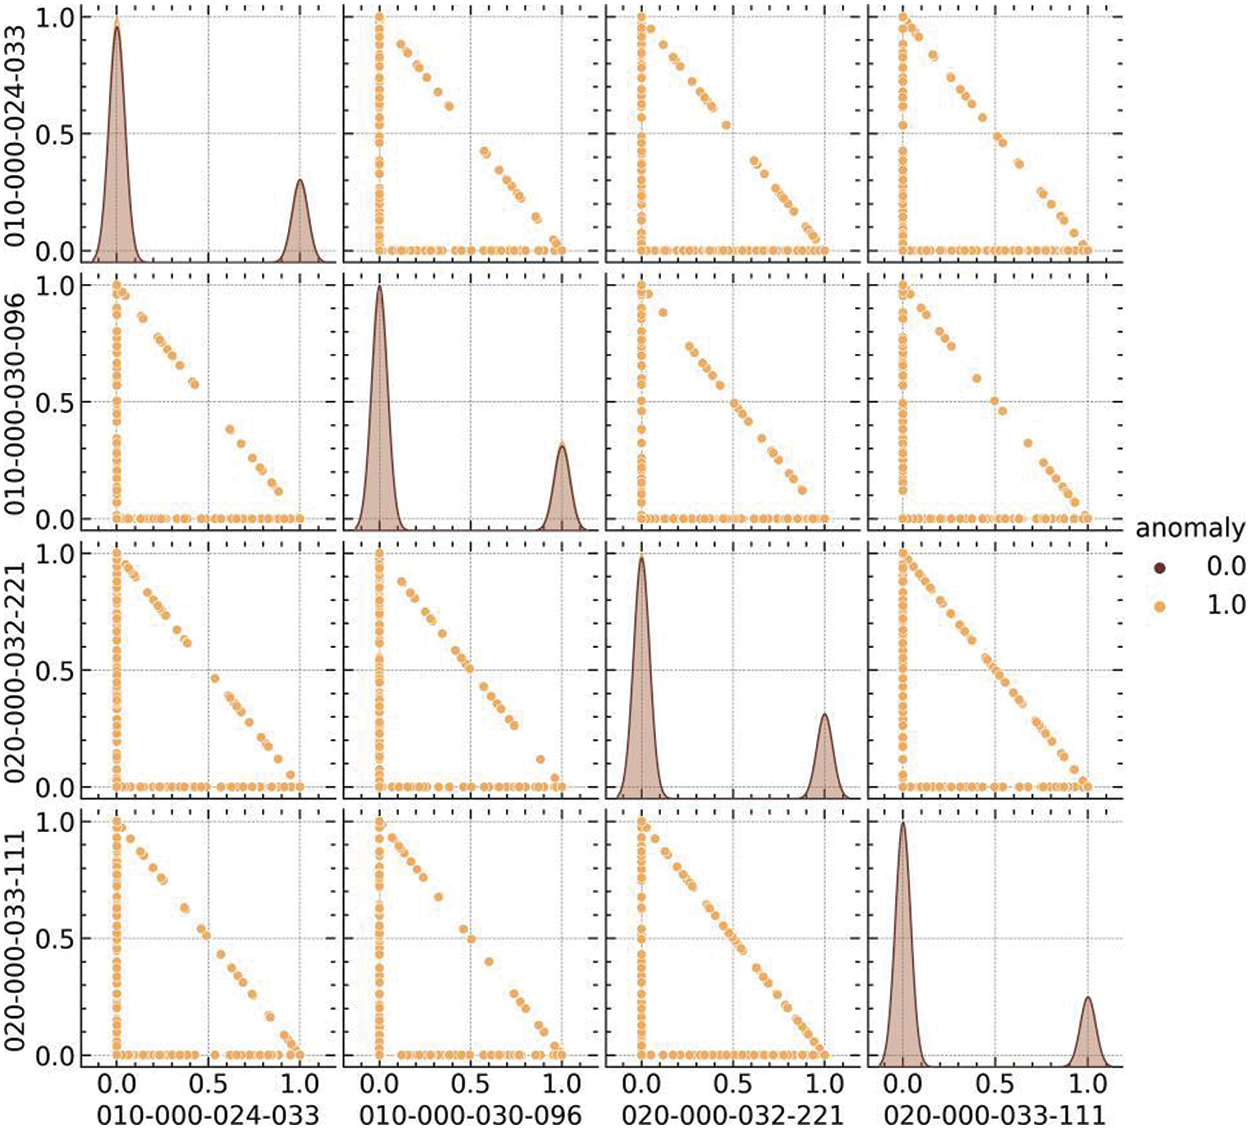
Figure 7: Pair plot of sensors
A series of histogram plots were examined to deepen understanding of the relationship between the sensor positions and the target variable. These figures illustrate the distribution of the X, Y, and Z sensor position values by anomaly type. Fig. 8 displays the distribution of the X position, with separate histograms for normal (0) and anomaly (1) classes, highlighting the differences in the density of sensor readings that correspond to normal activities vs. fall events. Similarly, Fig. 9 exhibits the distribution of the Y position values, and Fig. 10 shows the Z position values, both partitioned by the same anomaly classification. In these histograms, the overlaid density plots provide a smooth distribution estimate, which aids in visualizing the probability density of the sensor readings across the two categories. The variance and skewness of these distributions indicate the feature’s discriminative power in differentiating between normal behavior and falls. These insights derived from the histogram analysis are instrumental in informing the feature selection process for the subsequent development of anomaly detection models.
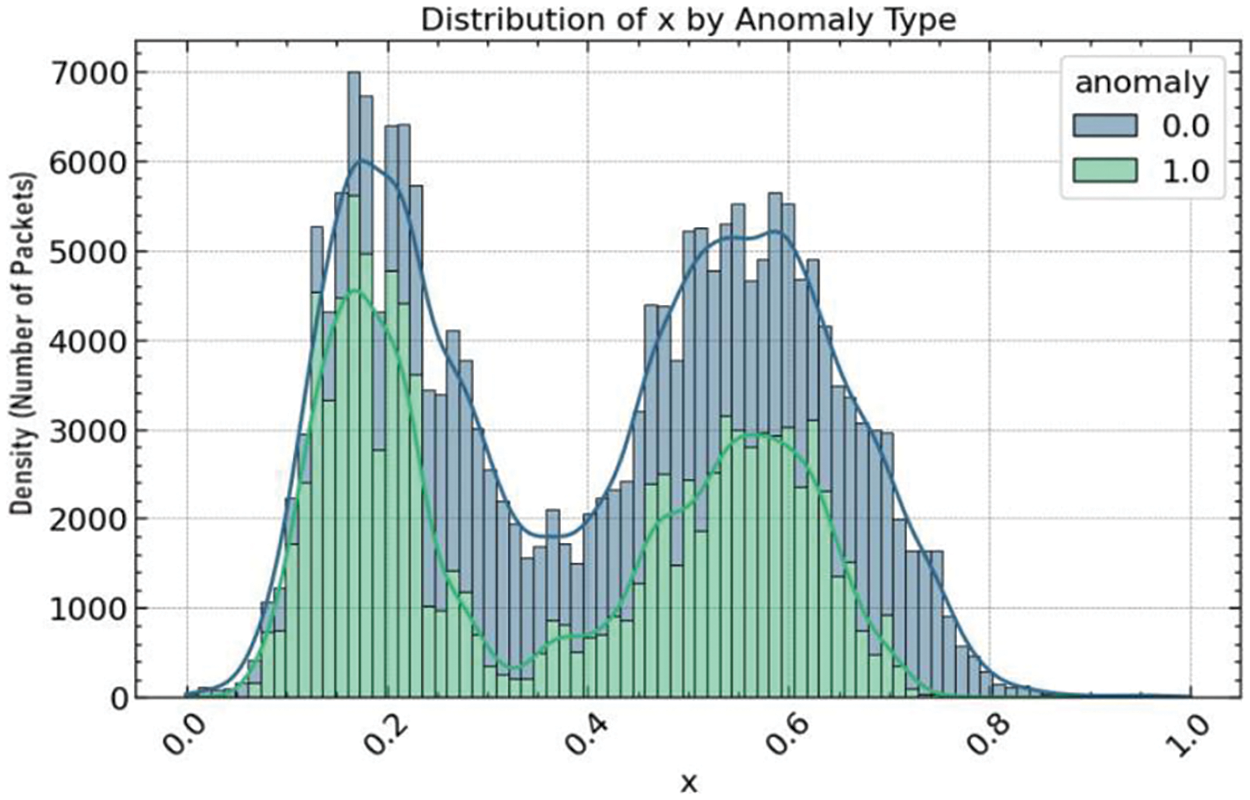
Figure 8: Hist plot for X
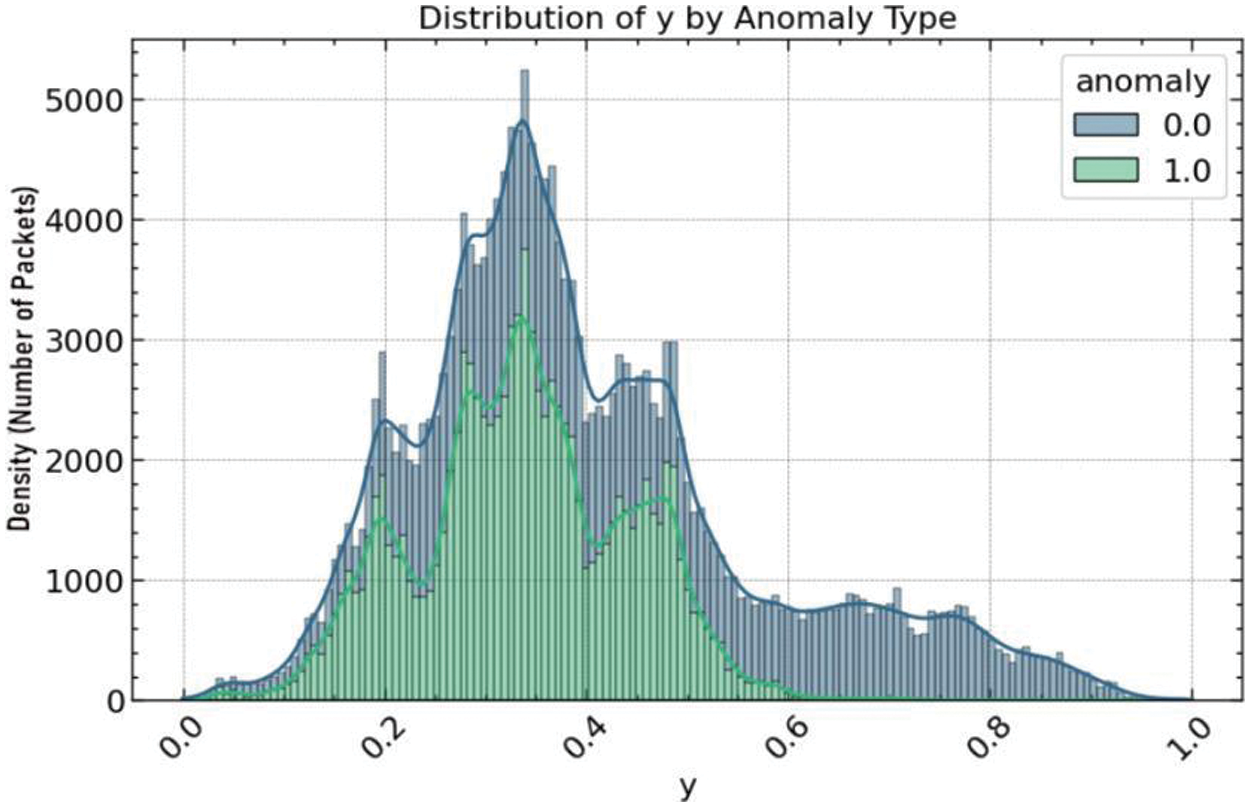
Figure 9: Hist plot of Y
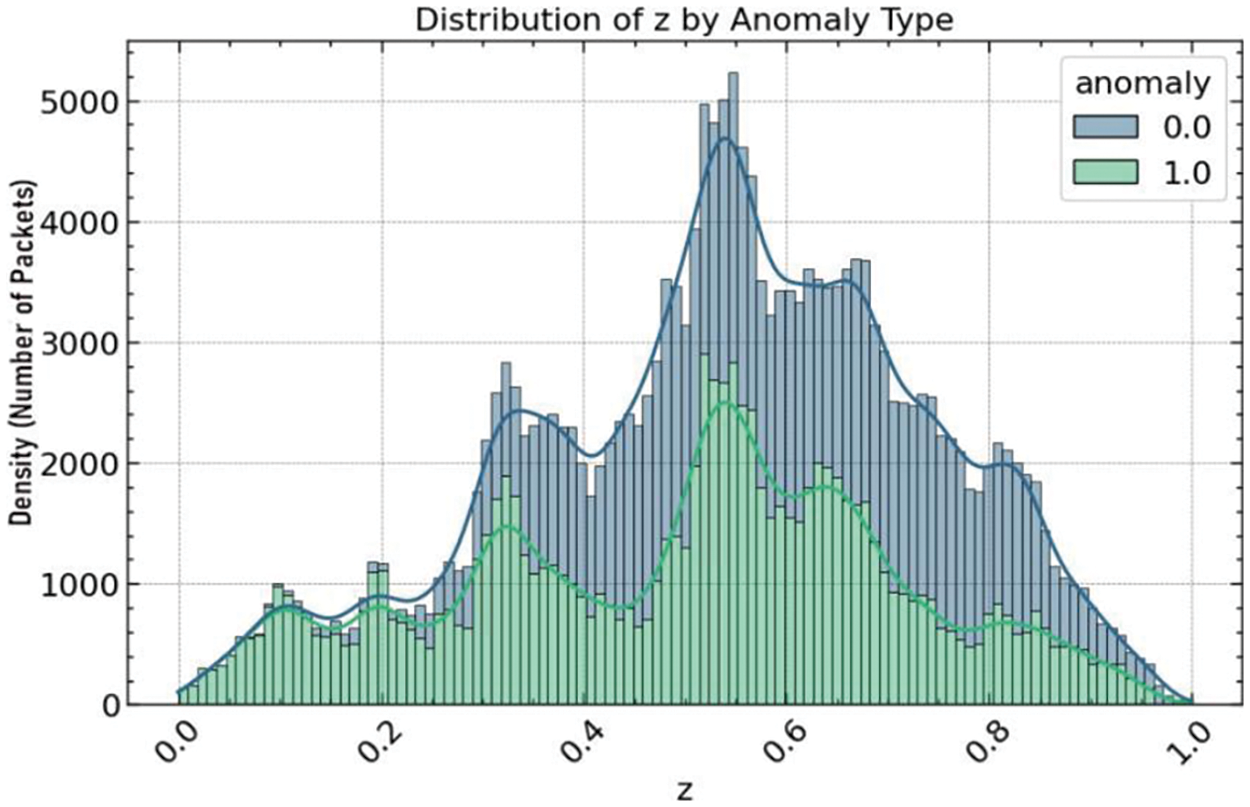
Figure 10: Hist plot of Z
An integral component of the exploratory data analysis is the correlation matrix, depicted in Fig. 11, which quantifies the linear relationships between the sensor-based features and the target variable. This matrix provides a color-coded heatmap, facilitating the immediate visual discernment of the strength and direction of the correlations. Sensor positions X, Y, and Z exhibit modest correlations with each other, indicative of some degree of interdependence likely attributable to the nature of human movement. The one-hot encoded sensor activity features (010-000-024-033, 010-000-030-096, 020-000-032-221, and 020-000-033-111) demonstrate negligible correlations with the position features, suggesting that they contribute distinct information regarding the sensor activities. All features show relatively low correlations with the anomaly target, with the most notable relationships being negative correlations observed in the Y position and 010-000-030-096 features. This correlation matrix is pivotal in our analysis as it underscores the potential of each feature as an independent predictor for anomaly detection, thereby informing the feature engineering and selection process for the development of our neural network model.
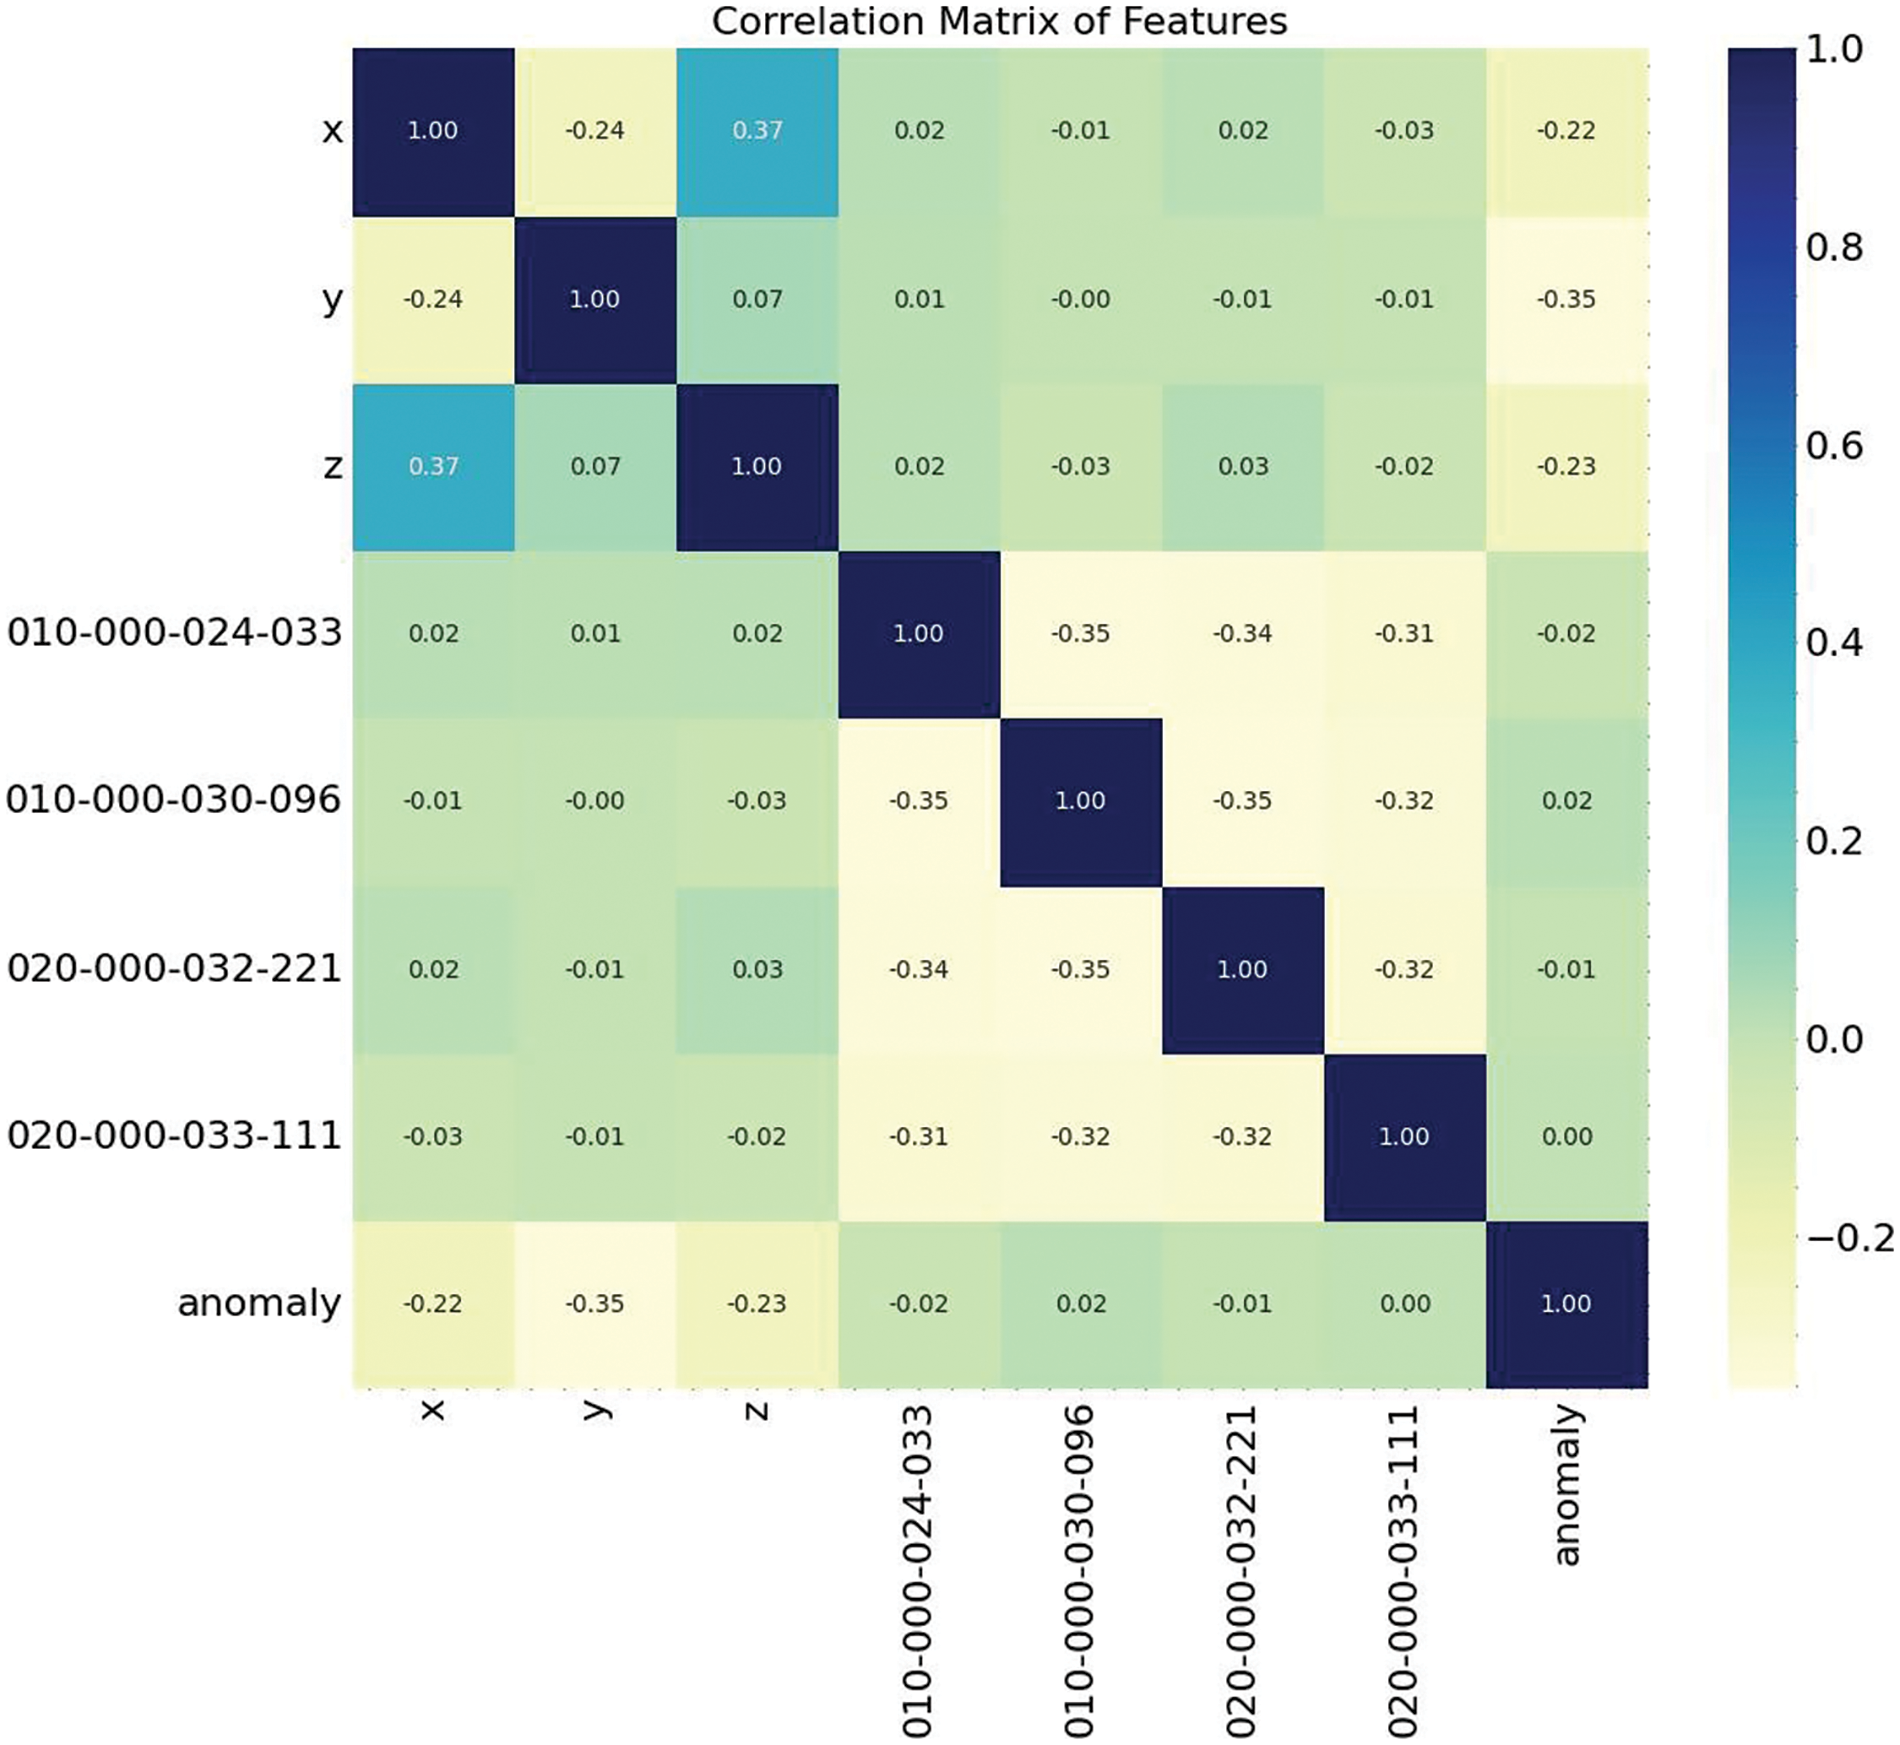
Figure 11: Correlation matrix
The LSTM model’s effectiveness in predicting anomalies in the dataset was evaluated by observing the variation in accuracy and loss over training epochs. Fig. 12 illustrates these metrics, where the left panel displays the loss curves and the right panel the accuracy curves for both the training and testing sets. Initially, at epoch 0, the model exhibited a training loss of 0.544760 and an accuracy of 74.19%, alongside a test loss of 0.530500 and 75.57%. Over successive epochs, the training loss consistently decreased, indicating an improvement in the model’s ability to generalize from the training data. Correspondingly, training accuracy increased to 87.79% by epoch 9, demonstrating the model’s enhanced predictive capabilities.
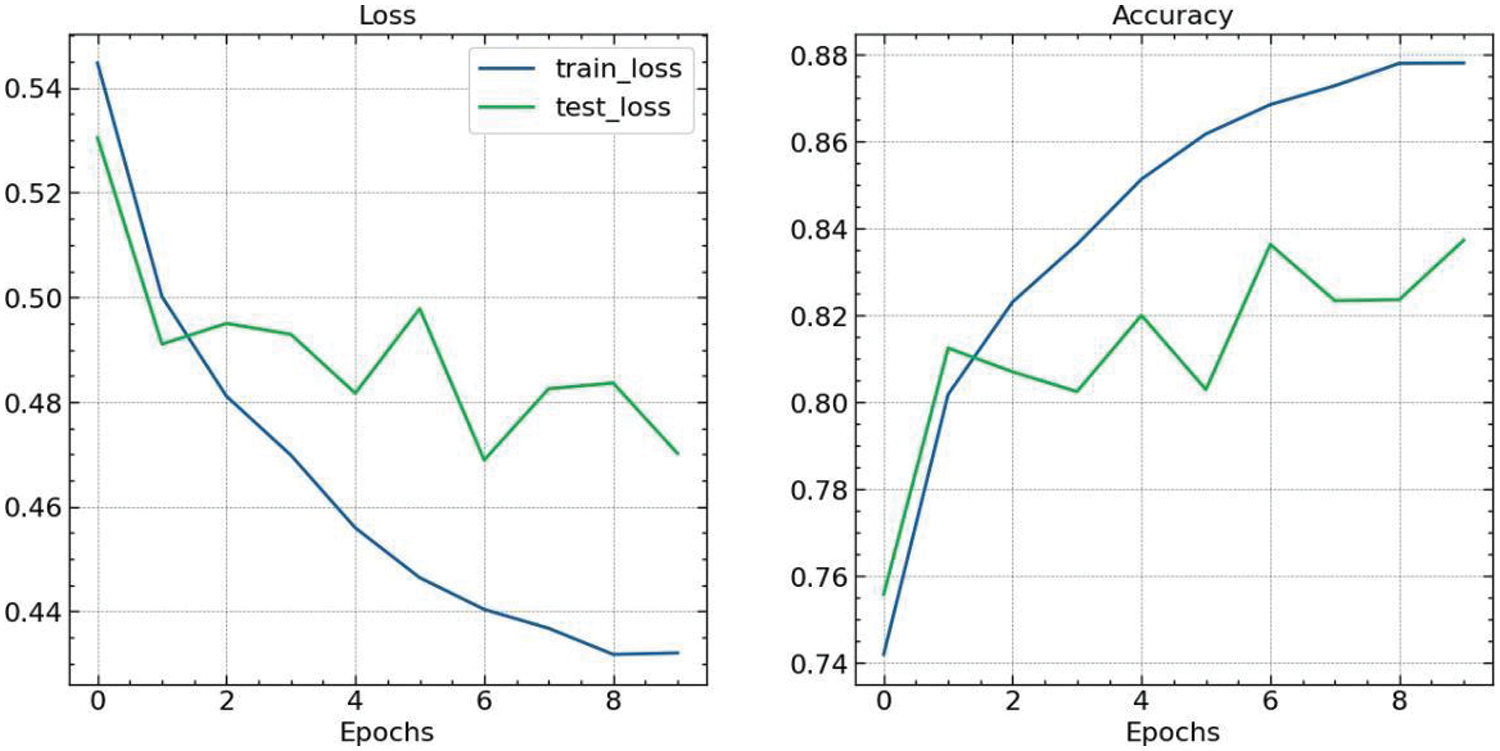
Figure 12: Accuracy and loss function
The test loss and accuracy exhibited more variability, suggesting a nuanced response to the model’s generalization on unseen data. The lowest test loss recorded was 0.468904 at epoch 6, with a corresponding test accuracy of 83.62%, the highest accuracy achieved during the evaluation period. Despite fluctuations, the general trend in test accuracy also showed an upward trajectory, affirming the model’s ability to generalize well. The slight increase in test loss at epochs 7 and 8, followed by a decrease at epoch 9, can indicate the onset of overfitting; however, the test accuracy at epoch 9 reached 83.72%, implying that the model maintained its predictive performance. These trends underscore the LSTM model’s potential in detecting anomalies within the given dataset, with a clear indication of learning over time as reflected by the convergence of the loss curves and the incremental increase in accuracy.
The performance of the anomaly detection model is encapsulated in the classification report presented in Fig. 13. The report comprehensively assesses the model’s precision, recall, F1-score, and support for both normal and anomalous classes. The model achieved a high precision of 0.97 for the normal class, showing it is highly effective at identifying true normal cases. However, the precision for the anomalous class was significantly lower at 0.19, indicating a higher rate of false positives for anomaly detection. The recall scores exhibit an inverse pattern; the model showed a recall of 0.85 for the normal class and a higher recall of 0.60 for the anomalous class, indicating that the model is reasonably sensitive to detecting true anomalies.
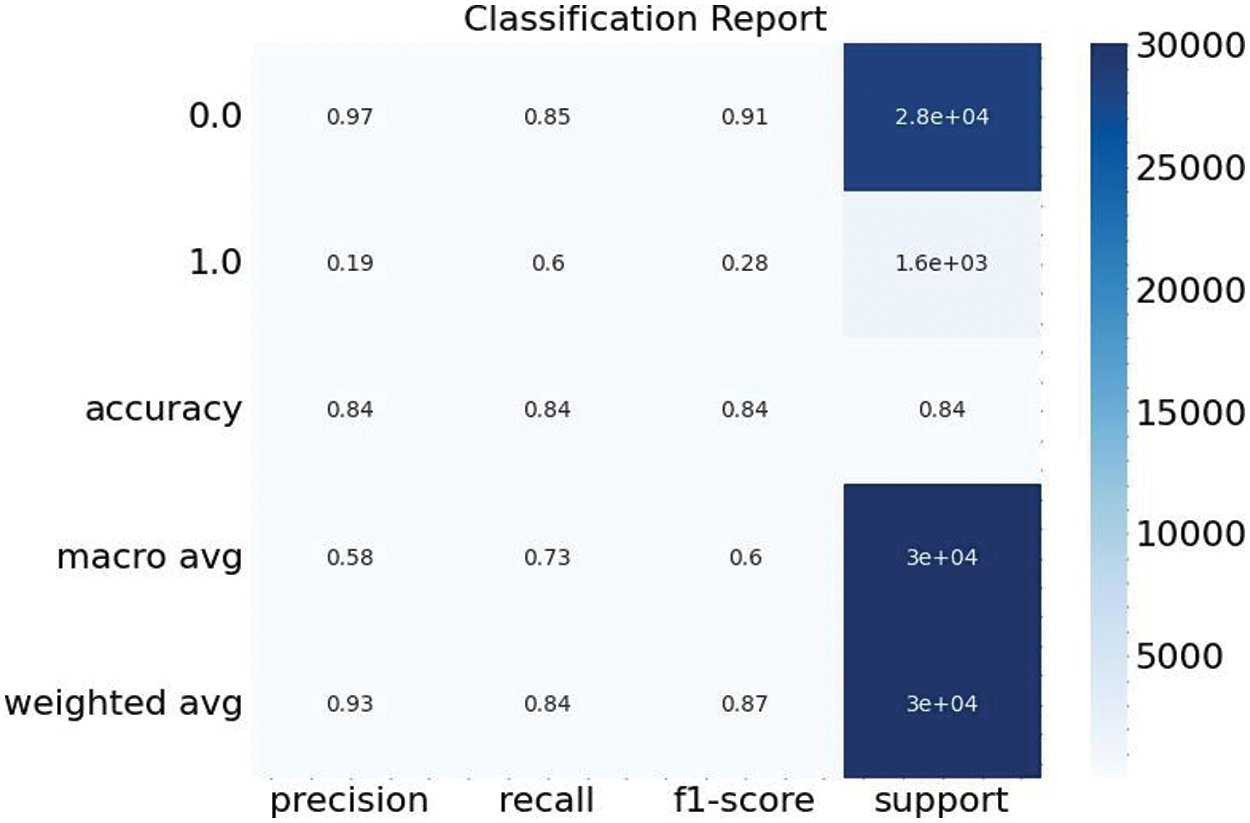
Figure 13: Classification report
The F1-score, which balances precision and recall, stood at 0.91 for the normal class, underscoring the model’s robustness in correctly classifying normal events. The anomalous class had an F1-score of 0.28, reflecting the difficulties in achieving a balance between precision and recall for this class. The support for the classes shows the number of true instances for each class in the dataset, with 28,420 normal events and 1610 anomalous events.
The efficacy of the anomaly detection model was further analyzed using a confusion matrix, as illustrated in Fig. 14. The matrix delineates the number of true positive, true negative, false positive, and false negative predictions. The model correctly identified 24,167 instances (true negatives) for the ‘Normal’ class while misclassifying 4253 instances as ‘Anomalous’ (false positives). In contrast, the model accurately detected 971 instances (true positives) for the ‘Anomalous’ class but incorrectly labeled 639 instances as ‘Normal’ (false negatives). The relatively high number of false positives, in comparison to true positives, mirrors the precision challenges highlighted in the classification report and indicates a propensity of the model to alarm for normal events incorrectly. Despite this, the model demonstrated a substantial true positive rate, capturing a significant proportion of true anomalies. This performance is critical in contexts where detecting anomalies is paramount, even at the risk of a higher false positive rate.
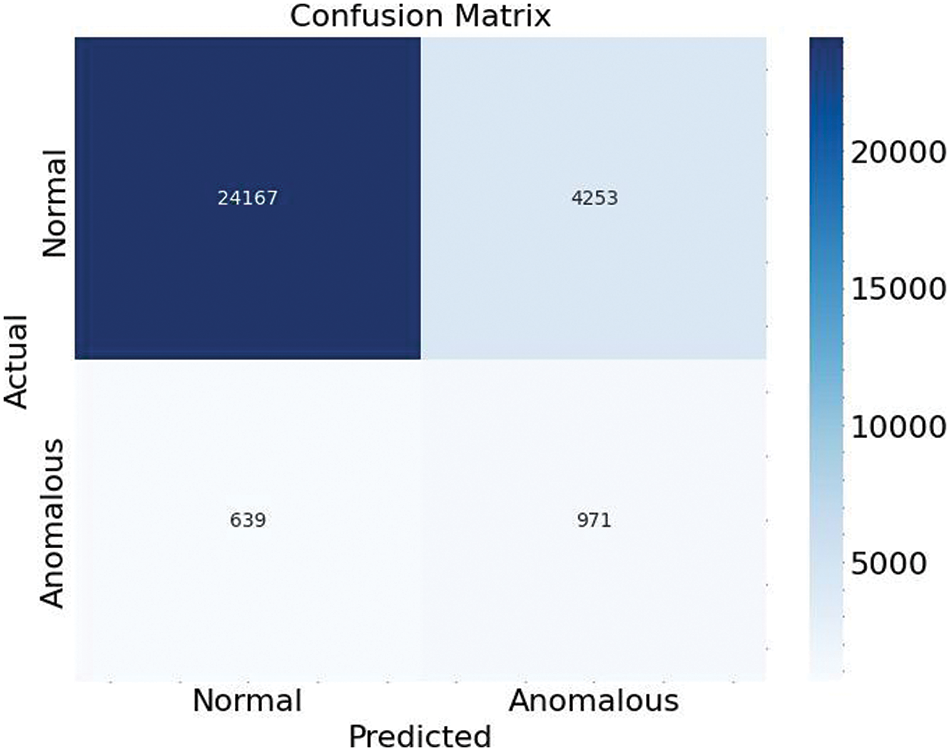
Figure 14: Confusion matrix
The confusion matrix provides a clear visual and quantitative assessment of the model’s performance, revealing a trade-off between sensitivity to actual anomalies and the acceptance of false alarms. Future work should aim to enhance the model’s precision for anomaly detection, potentially through more complex feature engineering or additional contextual data to reduce the rate of false positives without compromising the true positive rate.
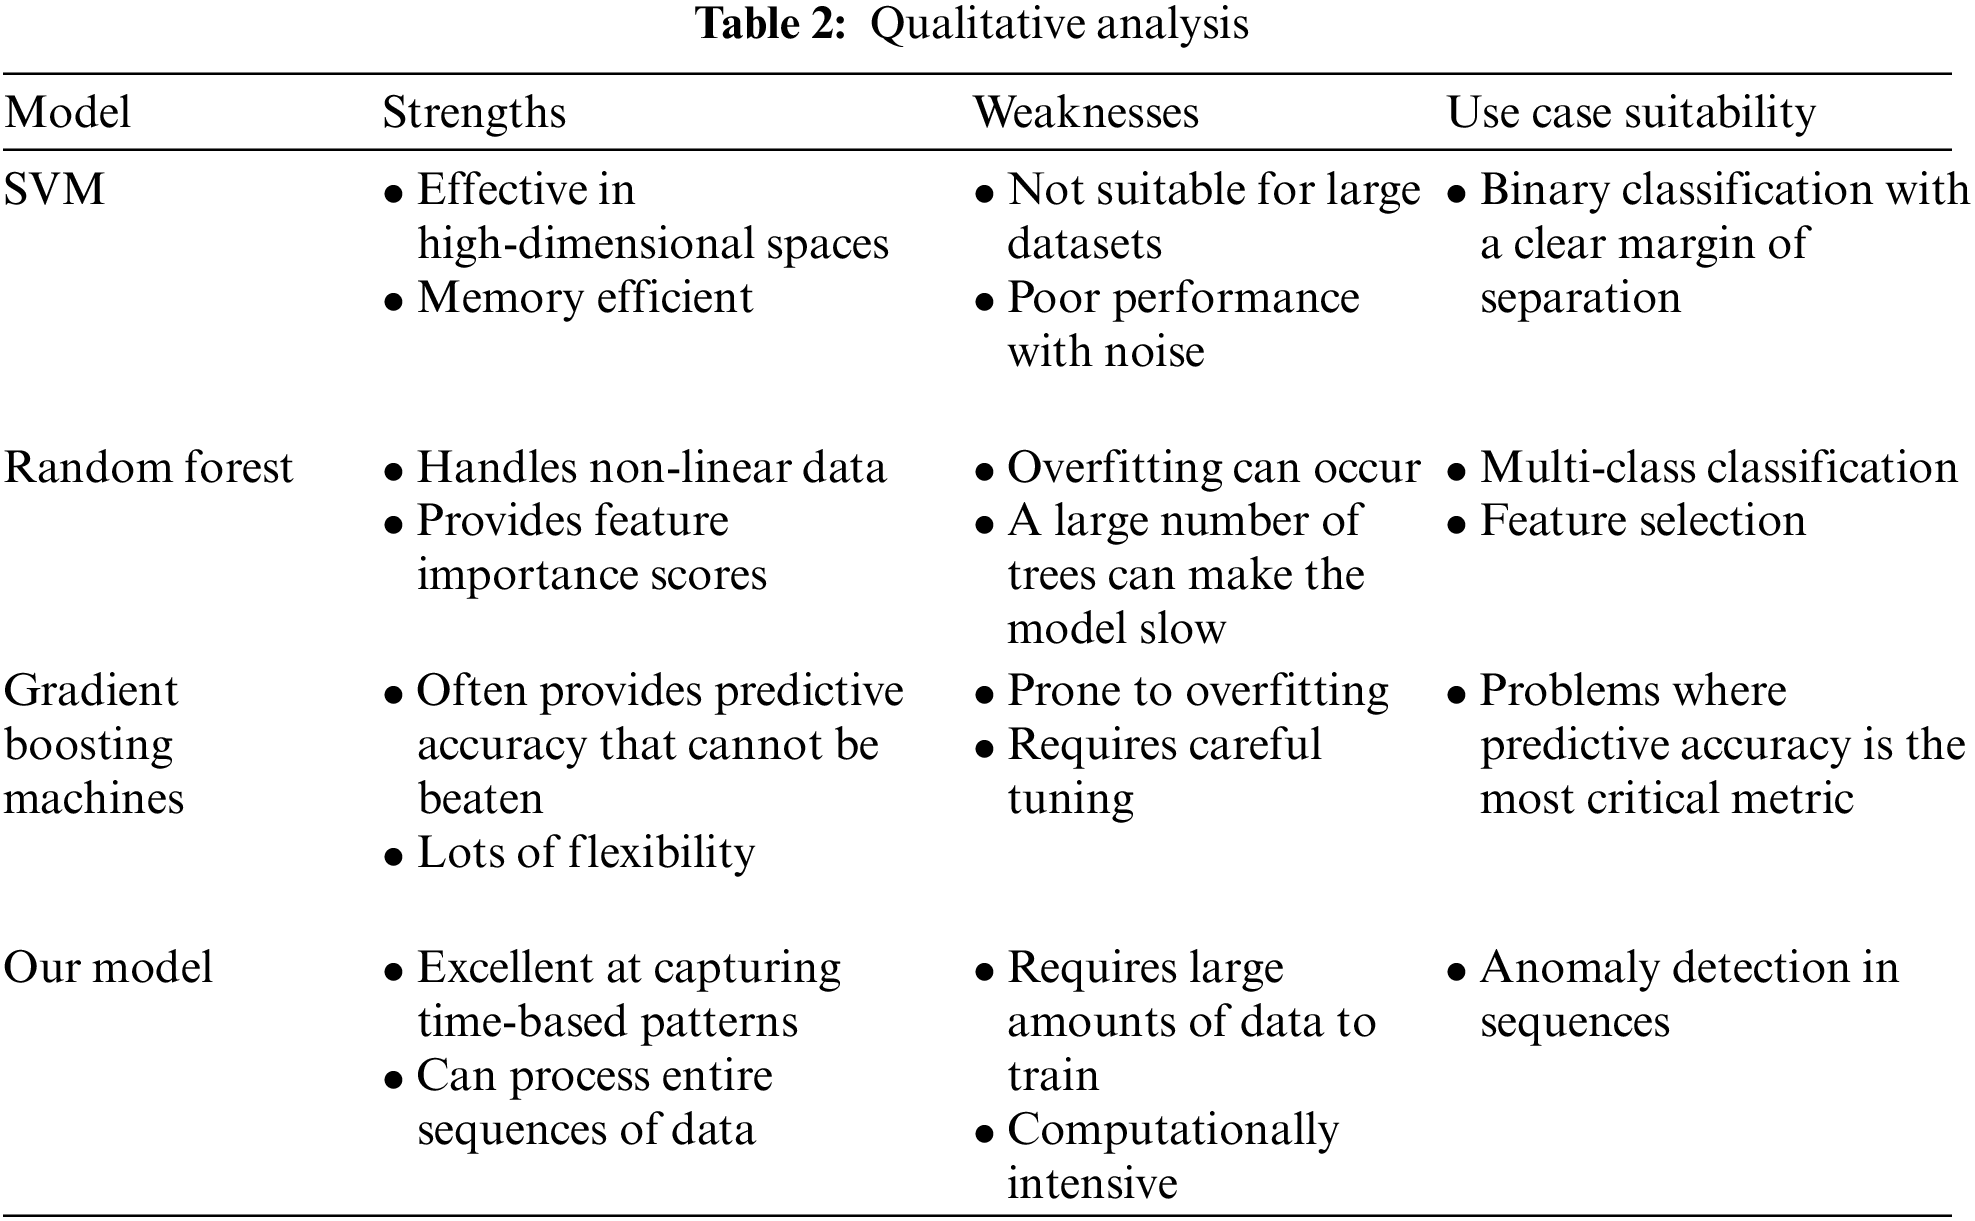
A qualitative analysis was conducted to compare the performance characteristics of various traditional machine learning models with our LSTM-based approach for anomaly detection. Table 2 indicates that Support Vector Machines (SVMs) excel in high-dimensional spaces and are memory efficient, but they falter when applied to large datasets and exhibit poor performance in the presence of noise, making them less ideal for complex anomaly detection tasks. Random Forest models stand out for their ability to handle non-linear data and provide valuable feature importance scores. However, they are prone to overfitting and can become computationally burdensome with many trees, potentially limiting their scalability in real-time applications. Gradient Boosting Machines (GBMs) are often unmatched in predictive accuracy and offer considerable flexibility but require careful tuning to avoid overfitting. Their suitability tends to be for applications where accuracy is paramount. In contrast, our LSTM model demonstrates a superior capability to capture temporal dependencies and process entire data sequences, which is crucial for identifying anomalies in time series. Despite the LSTM’s need for substantial data for training and its computational intensity, its applicability to time series forecasting and anomaly detection in sequential data is unmatched, especially in scenarios where temporal context is key to distinguishing between normal and anomalous patterns.
This research presents an LSTM-based neural network model that identifies anomalous events in care-independent smart home settings, specifically engineered for fall detection among the elderly. The model’s efficacy is rooted in its ability to process and learn from balanced time-series data, achieved through applying SMOTE to the initially unbalanced dataset. Empirical results showcase the model’s substantial accuracy and enhanced capability to discern between normal and anomalous events, achieving an overall accuracy of 84%. This study not only reinforces the potential of LSTM networks in anomaly detection but also underscores the significance of preprocessing in developing reliable predictive models for real-world applications in elderly care, contributing to safer smart home environments. In the future, it will collect real-time data and include various datasets to test the proposed model’s performance.
Acknowledgement: Princess Nourah bint Abdulrahman University Researchers Supporting Project number (PNURSP2024R 343), Princess Nourah bint Abdulrahman University, Riyadh, Saudi Arabia. The authors extend their appreciation to the Deanship of Scientific Research at Northern Border University, Arar, KSA for funding this research work through the Project Number “NBU-FFR-2024-1092-04”.
Funding Statement: Princess Nourah bint Abdulrahman University Researchers Supporting Project number (PNURSP2024R 343), Princess Nourah bint Abdulrahman University, Riyadh, Saudi Arabia. The authors extend their appreciation to the Deanship of Scientific Research at Northern Border University, Arar, KSA for funding this research work through the Project Number “NBU-FFR-2024-1092-04”.
Author Contributions: Final Manuscript Revision, funding, Supervision: Brij B. Gupta, Kwok Tai Chui; study conception and design, analysis and interpretation of results, methodology development: Akshat Gaurav, Varsha Arya; data collection, draft manuscript preparation, figure and tables: Akshat Gaurav, Razaz Waheeb Attar. All authors reviewed the results and approved the final version of the manuscript.
Availability of Data and Materials: All data generated or analyzed during this study are included in this published article.
Conflicts of Interest: The authors declare that they have no conflicts of interest to report regarding the present study.
References
1. Cho Y, Choi A. Application of affordance factors for user-centered smart homes: a case study approach. Sustainability. 2020 Apr 10;12(7):3053. doi:10.3390/su12073053. [Google Scholar] [CrossRef]
2. Mashal I, Shuhaiber A. What makes Jordanian residents buy smart home devices? A factorial investigation using PLS-SEM. Kybernetes. 2018 Oct 23;48(8):1681–98. doi:10.1108/K-01-2018-0008. [Google Scholar] [CrossRef]
3. Xu Z, He D, Vijayakumar P, Gupta BB, Shen J. Certificateless public auditing scheme with data privacy and dynamics in group user model of cloud-assisted medical WSNs. IEEE J Biomed Health Inform. 2021 Nov 17;27(5):2334–44. doi:10.1109/JBHI.2021.3128775. [Google Scholar] [CrossRef]
4. Rghioui A, Oumnad A. Challenges and opportunities of internet of things in healthcare. Int J Electr Comput Eng. 2018 Oct 1;8(5):2753. doi:10.11591/ijece.v8i5.pp2753-2761. [Google Scholar] [CrossRef]
5. Almutairi M, Gabralla LA, Abubakar S, Chiroma H. Detecting elderly behaviors based on deep learning for healthcare: recent advances, methods, real-world applications and challenges. IEEE Access. 2022 Jun 27;10:69802–21. doi:10.1109/ACCESS.2022.3186701. [Google Scholar] [CrossRef]
6. Nguyen GN, Le Viet NH, Elhoseny M, Shankar K, Gupta BB, Abd El-Latif AA. Secure blockchain enabled cyber-physical systems in healthcare using deep belief network with ResNet model. J Parallel Distr Comput. 2021 Jul 1;153:150–60. doi:10.1016/j.jpdc.2021.03.011. [Google Scholar] [CrossRef]
7. Lee Y, Rathore S, Park JH, Park JH. A blockchain-based smart home gateway architecture for preventing data forgery. Hum Centric Comput Inf Sci. 2020 Mar 17;10(1):9. doi:10.1186/s13673-020-0214-5. [Google Scholar] [CrossRef]
8. Wang H, Li Z, Li Y, Gupta BB, Choi C. Visual saliency guided complex image retrieval. Pattern Recognit Lett. 2020 Feb 1;130:64–72. doi:10.1016/j.patrec.2018.08.010. [Google Scholar] [CrossRef]
9. Pasandideh S, Pereira P, Gomes L. Cyber-physical-social systems: taxonomy, challenges, and opportunities. IEEE Access. 2022 Apr 14;10:42404–19. doi:10.1109/ACCESS.2022.3167441. [Google Scholar] [CrossRef]
10. Hu B, Gaurav A, Choi C, Almomani A. Evaluation and comparative analysis of semantic web-based strategies for enhancing educational system development. Int J Semant Web Inform Syst (IJSWIS). 2022 Jan 1;18(1):1–4. doi:10.4018/IJSWIS.302895. [Google Scholar] [CrossRef]
11. Hussain F, Abbas SG, Shah GA, Pires IM, Fayyaz UU, Shahzad F, et al. A framework for malicious traffic detection in IoT healthcare environment. Sensors. 2021 Apr 26;21(9):3025. doi:10.3390/s21093025. [Google Scholar] [PubMed] [CrossRef]
12. Yu HQ, Reiff-Marganiec S. Learning disease causality knowledge from the web of health data. Int J Semant Web Inform Syst (IJSWIS). 2022 Jan 1;18(1):1–9. doi:10.4018/IJSWIS.297145. [Google Scholar] [CrossRef]
13. Xiao J, Liu X, Zeng J, Cao Y, Feng Z. Recommendation of healthcare services based on an embedded user profile model. Int J Semant Web Inform Syst (IJSWIS). 2022 Jan 1;18(1):1–21. doi:10.4018/IJSWIS.313198. [Google Scholar] [CrossRef]
14. Nimmy K, Sankaran S, Achuthan K, Calyam P. Lightweight and privacy-preserving remote user authentication for smart homes. IEEE Access. 2021 Dec 21;10:176–90. doi:10.1109/ACCESS.2021.3137175. [Google Scholar] [CrossRef]
15. Sarivougioukas J, Vagelatos A. Fused contextual data with threading technology to accelerate processing in home UbiHealth. Int J Softw Sci Comput Intell (IJSSCI). 2022 Jan 1;14(1):1–4. [Google Scholar]
16. Taj S, Asad U, Azhar M, Kausar S. Interoperability in IOT based smart home: a review. J Homepage. 2018 Sep;5(3):50–5. doi:10.18280/rces.050302. [Google Scholar] [CrossRef]
17. Lawal MA, Shaikh RA, Hassan SR. An anomaly mitigation framework for IoT using fog computing. Electronics. 2020 Sep 24;9(10):1565. doi:10.3390/electronics9101565. [Google Scholar] [CrossRef]
18. Ansari MH, Tabatab Vakili V, Bahrak B. Evaluation of big data frameworks for analysis of smart grids. J Big Data. 2019 Dec 3;6(1):109. doi:10.1186/s40537-019-0270-8. [Google Scholar] [CrossRef]
19. Hammad SS, Iskandaryan D, Trilles S. An unsupervised TinyML approach applied to the detection of urban noise anomalies under the smart cities environment. Internet of Things. 2023 Oct 1;23:100848. doi:10.1016/j.iot.2023.100848. [Google Scholar] [CrossRef]
20. Trilles S, Hammad SS, Iskandaryan D. Anomaly detection based on artificial intelligence of things: a systematic literature mapping. Internet of Things. 2024 Jan;11:101063. [Google Scholar]
21. Apostol ES, Truică CO, Pop F, Esposito C. Change point enhanced anomaly detection for IoT time series data. Water. 2021 Jan;13(12):1633. doi:10.3390/w13121633. [Google Scholar] [CrossRef]
22. Fenza G, Gallo M, Loia V. Drift-aware methodology for anomaly detection in smart grid. IEEE Access. 2019 Jan 6;7:9645–57. doi:10.1109/Access.6287639. [Google Scholar] [CrossRef]
23. Wu Y, Dai HN, Tang H. Graph neural networks for anomaly detection in industrial internet of things. IEEE Internet Things J. 2021 Jul 2;9(12):9214–31. [Google Scholar]
24. DeMedeiros K, Hendawi A, Alvarez M. A survey of AI-based anomaly detection in IoT and sensor networks. Sensors. 2023 Jan 25;23(3):1352. doi:10.3390/s23031352. [Google Scholar] [CrossRef]
25. Meidan Y, Avraham D, Libhaber H, Shabtai A. CADeSH: collaborative anomaly detection for smart homes. IEEE Internet Things J. 2022 Jul 28;10(10):8514–8532. [Google Scholar]
26. Farooq MS, Khan S, Rehman A, Abbas S, Khan MA, Hwang SO. Blockchain-based smart home networks security empowered with fused machine learning. Sensors. 2022 Jun 15;22(12):4522. doi:10.3390/s22124522. [Google Scholar] [PubMed] [CrossRef]
27. Basahel SB, Bajaba S, Yamin M, Mohanty SN, Lydia EL. Teamwork optimization with deep learning based fall detection for IoT-enabled smart healthcare system. Comput Mat Continua. 2023 Jan 1;75(1):1353–69. doi:10.32604/cmc.2023.036453. [Google Scholar] [CrossRef]
28. Diro A, Chilamkurti N, Nguyen VD, Heyne W. A comprehensive study of anomaly detection schemes in IoT networks using machine learning algorithms. Sensors. 2021 Dec 13;21(24):8320. doi:10.3390/s21248320. [Google Scholar] [PubMed] [CrossRef]
29. Zheng ZX, Zhang F. Image real-time detection using LSE-Yolo neural network in artificial intelligence-based internet of things for smart cities and smart homes. Wirel Commun Mob Comput. 2022 Mar 9;2022:8. doi:10.1155/2022/2608798. [Google Scholar] [CrossRef]
30. Kaluža B, Mirchevska V, Dovgan E, Luštrek M, Gams M. An agent-based approach to care in independent living. In: Ambient Intelligence: First International Joint Conference; 2010 Nov 10–12; Malaga, Spain; Springer Berlin Heidelberg. p. 177–86. [Google Scholar]
Cite This Article
 Copyright © 2024 The Author(s). Published by Tech Science Press.
This work is licensed under a Creative Commons Attribution 4.0 International License , which permits unrestricted use, distribution, and reproduction in any medium, provided the original work is properly cited.
 Downloads
 Citation Tools