
 Submit a Paper
 Propose a Special lssue
 Open Access
ARTICLE

Integrating Neighborhood Geographic Distribution and Social Structure Influence for Social Media User Geolocation
1 Key Laboratory of Cyberspace Situation Awareness of Henan Province, Zhengzhou, 450001, China
2 State Key Laboratory of Mathematical Engineering and Advanced Computing, Zhengzhou, 450001, China
* Corresponding Author: Xiangyang Luo. Email:
Computer Modeling in Engineering & Sciences 2024, 140(3), 2513-2532. https://doi.org/10.32604/cmes.2024.050517
Received 08 February 2024; Accepted 30 April 2024; Issue published 08 July 2024
 View Full Text
 Download PDF
Abstract
Geolocating social media users aims to discover the real geographical locations of users from their publicly available data, which can support online location-based applications such as disaster alerts and local content recommendations. Social relationship-based methods represent a classical approach for geolocating social media. However, geographically proximate relationships are sparse and challenging to discern within social networks, thereby affecting the accuracy of user geolocation. To address this challenge, we propose user geolocation methods that integrate neighborhood geographical distribution and social structure influence (NGSI) to improve geolocation accuracy. Firstly, we propose a method for evaluating the homophily of locations based on the -order neighborhood geographic distribution (-NGD) similarity among users. There are notable differences in the distribution of -NGD similarity between location-proximate and non-location-proximate users. Exploiting this distinction, we filter out non-location-proximate social relationships to enhance location homophily in the social network. To better utilize the location-proximate relationships in social networks, we propose a graph neural network algorithm based on the social structure influence. The algorithm enables us to perform a weighted aggregation of the information of users’ multi-hop neighborhood, thereby mitigating the over-smoothing problem of user features and improving user geolocation performance. Experimental results on real social media dataset demonstrate that the neighborhood geographical distribution similarity metric can effectively filter out non-location-proximate social relationships. Moreover, compared with 7 existing social relationship-based user positioning methods, our proposed method can achieve multi-granularity user geolocation and improve the accuracy by 4.84% to 13.28%.Keywords
Man is a natural social animal [1]. In the era of Internet advancement, social media have emerged as dynamic and thriving platforms for social engagement. These platforms provide individuals with a convenient, real-time, and expansive means of communication, leading to a growing inclination towards information acquisition and social interactions on social media [2]. As of January 2024, the monthly active users of popular social media platforms such as Twitter/X1, Instagram2, and Facebook3 have surpassed 7.5 billion4. The openness and interactivity of social media, coupled with the ever-increasing number of users, have resulted in a wealth of diverse information within online social media, such as personal interests, consumption habits, etc. Among them, the geographic locations of social media users serve as a bridge between the virtual and physical worlds, which can be applied to various location-based real-world applications [3–6]. By leveraging user location data, relevant organizations can gain more accurate insights into population distribution and activities, facilitating timely alerts and the implementation of corresponding rescue and protection measures [7,8]. Additionally, it enables the delivery of localized content to users, enhancing their quality of life [9]. However, challenges arise in directly accessing users’ residential location information due to factors such as personal privacy protection and platform policies [10,11]. Consequently, the task of leveraging publicly available social relationship data to infer users’ residential locations becomes particularly crucial.
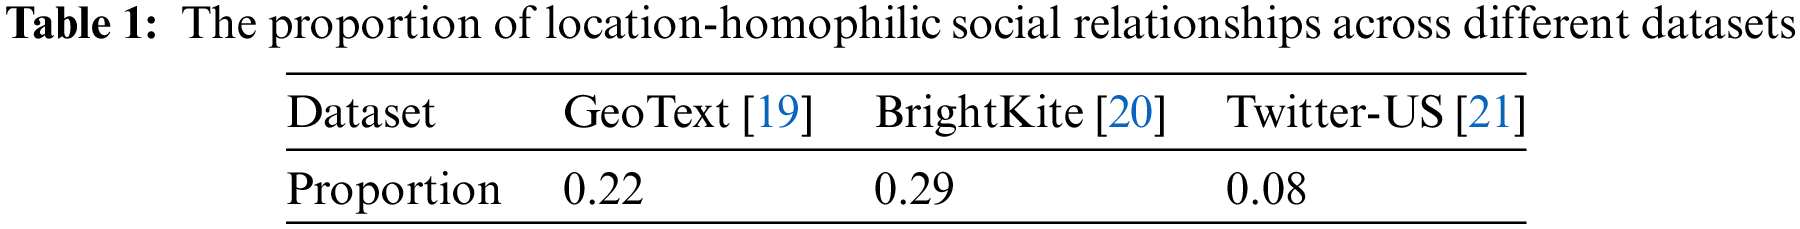
Previous methods based on social relationships geolocate users under the assumption that users tend to engage in social interactions with other users in close proximity, allowing for the inference of user locations based on the distribution of neighbors’ locations [12–16]. However, the high ratio of location-proximate social relationships is required to achieve accurate geolocation accuracy, as demonstrated in previous studies, which does not align with the characteristics observed in real-world datasets. Similarity breeds connection [17]. In real-world social interactions, individuals tend to engage in frequent social connections with others who share similar interests, rather than location. This implies that users who have social relationships often exhibit high similarity in terms of their interests. For instance, we may interact with individuals who share our admiration for a particular celebrity, mentioning or liking their tweets. For user geolocation, relationships based on location proximity are crucial, but other multi-type relationships serve as structure noise which impacts geolocation accuracy [18]. We analyzed the location homophily of user social relationships in multiple social media datasets [19–21], as shown in Table 1. In online social media, relationships driven by location proximity constitute a relatively small proportion of the overall social relationships. Therefore, it is necessary to design appropriate metrics to distinguish location-driven social relationships from other categories, filter out location-independent ones, and thereby increase the proportion of location-driven relationships, which is more conducive to user geolocation.
Several studies [16,22] have attempted to determine location-homophilic social relationships using structure characteristic. Research [22] proposes the social closeness metric to measure the number of common neighbors between two users with a social relationship. It demonstrates that when the proportion of common first-order neighbors between two users exceeds 50%, the probability of them being within 10 km of each other is 83%. When the number of mutual friends decreases to 10%, the probability of the two users being within 10 km drops drastically to 2.4%. Based on this funding, research [16] filters out social relationships with social closeness below a certain threshold. However, as shown in Fig. 1, on a dataset from real social media, using the social closeness makes it difficult to discern whether users’ social relationships are location proximity. Figs. 1a and 1b show the distribution of social closeness in location-homophilic social relationships and location-heterophilic social relationships, respectively. It is obvious that the distribution of social closeness in these two types of relationships is similar, and both are predominantly concentrated in the lower interval (
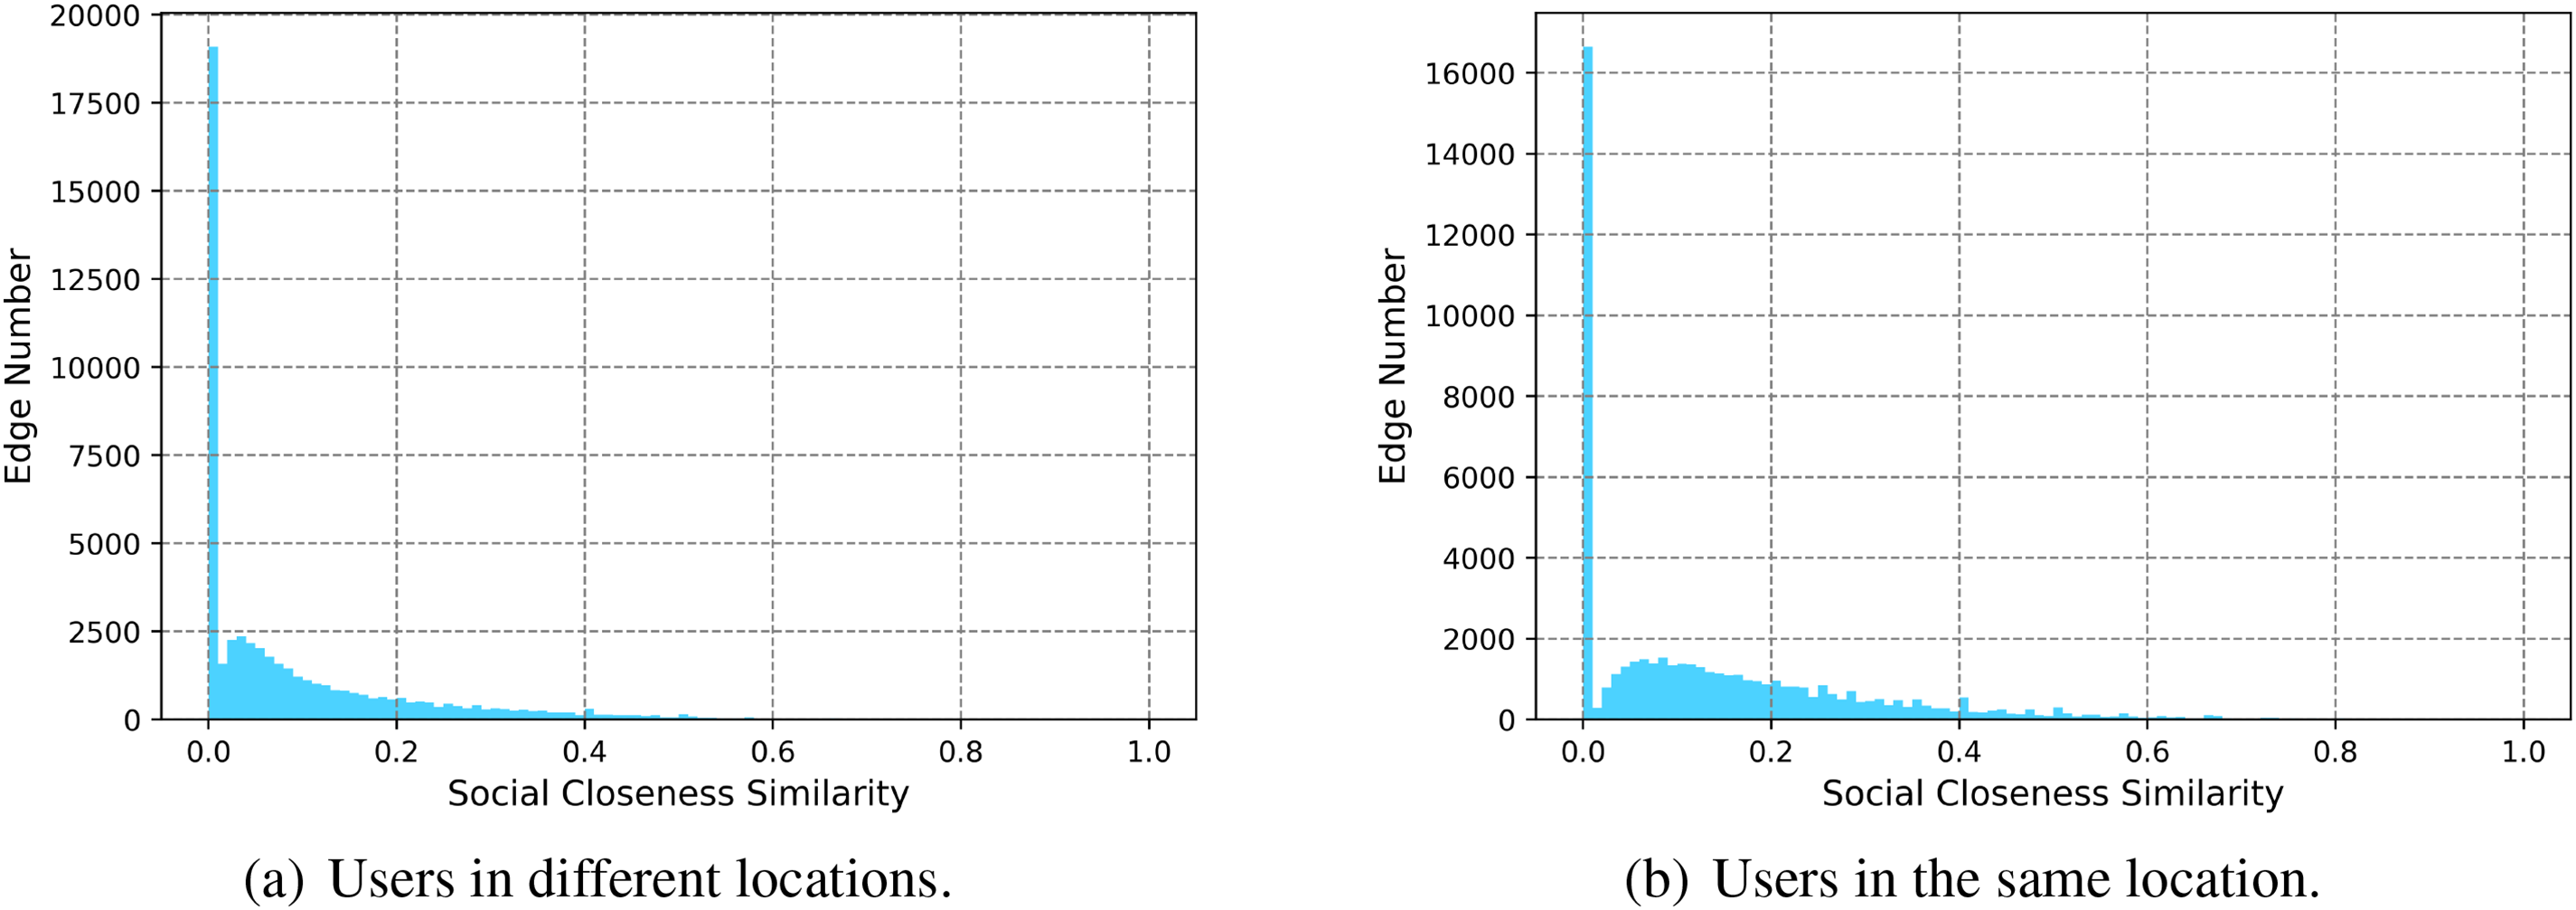
Figure 1: Distribution of social closeness across different relations. The horizontal axis represents the level of social closeness, while the vertical axis represents the number of edges. Each bar represents the number of edges at the corresponding level of social closeness
Therefore, we focus on designing an appropriate metric of discerning location-driven relationships and better utilizing the location homophily in social networks. In this paper, we propose a social media user geolocation method integrating neighborhood geographic distribution and social structure influence (NGSI). In detail, to better distinguish between location homophilic and heterophilic relationships, we design a novel metric called
The main contributions of this paper are as follows:
• A novel method to evaluate the homophily of relationships based on the
• A GNN-based method utilizing social network structure influence for inferring user locations is designed. By using PPR, we obtain the structure influence between users, allowing for weighted aggregation of neighboring users. This approach enhances the exploration and utilization of location influence within the social structure, thereby improving user localization performance.
• Series of experiments on real-world social media dataset to evaluate the effectiveness of proposed method are conducted. Compared to 7 existing social relationship-based user geolocation methods, our proposed approach outperforms others in terms of geolocation accuracy.
The remaining sections of this paper are organized as follows: In Section 2, we provide an overview of literature relevant to our study. In Section 3, we present the preliminaries required for understanding the content of this paper. Our proposed method is thoroughly described in Section 4. In Section 5, we analyze the performance of user localization in social media. Finally, we conclude the paper with a summary of our work and provide future directions for further research in Section 6.
In this section, we provide a review of previous methods for social media user geolocation based on social relationships and introduce the graph deep learning methods utilized by geolocation methods.
2.1 User Geolocation Based on Social Relationships
Social relationship is the prevalent data in social media, and users tend to engage in social behavior based on certain similarities. Location similarity is one of the reasons for user interaction. Therefore, based on social relationships, it is possible to infer user location by utilizing known locations of friends. Existing approaches for geolocating users based on social relationships can be broadly classified into two categories: (1) constructing probabilistic models between social proximity and geographic distance to leverage neighbor distances and friend probabilities for location inference; (2) propagating information through edges within social network to incorporate high-order information.
For the first category of methods, Backstorm et al. [14] propose FindMe which utilizes the distances between users with known locations and their friends to construct a distance-friend probability model, establishing an association between distance magnitude and the likelihood of becoming friends. FindMe takes the locations of friends as candidate locations. The location which maximizes the probability of becoming friends with other neighbors is selected as the user’s location. Based on the research by Backstrom et al. [14], McGee et al. [24] further discriminate geographically close social relationships by utilizing a decision tree, which establishes connections between various properties of social relationships (such as direction, categories, etc.) and location proximity. The Spot-Tightness [22] analyzes the relation between distance and social closeness to construct a probability model. Building on the geolcoation from FindMe, Spot-Tightness incorporate social closeness as another factor in calculating probabilities. On the basis of Spot-Tightness, Spot-Energy [22] leverages social coefficient to further consider the structural information of user neighborhoods. In these methods, they rely primarily on the spatial distribution of the user’s first-order neighborhood, which is susceptible to the impact of sparse first-order location information.
The approach based information propagation within social networks has evolved beyond the confines of first-order friendships. Jurgens [15] propose the Spatial Label Propagation (SLP) algorithm, which treats a user’s latitude and longitude as user labels and uses the geometric median of propagated locations from neighbors as the user’s location. Through multiple rounds of propagation, higher-order information can be utilized, which can tackle the issue of sparse location information of first-order neighbors. Compton et al. [25] extend the SLP algorithm by introducing the frequency of social relationships as weights to infer user locations through weighted user location information. The Sequence Spatial Label Propagation (SSLP) [16] further considers the impact of location outliers in a user’s neighborhood on the accuracy of location inference. Therefore, SSLP filters out neighbor nodes with few common neighbors in the first order, which reduces the time required for propagation, and improves the accuracy of user geolocation. Rahimi et al. [26] propose a method based on Graph Convolutional Networks (GCN) [27] module to propagate and aggregate neighbor features. They apply adjacency matrix of social network as input features, and establish the correlation between aggregated features and location labels. By leveraging high-order social relationships, these methods enable a more comprehensive understanding of the spatial information within the network and enhances the geolocation accuracy.
Existing works have paid limited attention to non-location-proximate social relationships in user social networks. Among them, SSLP [16] utilizes user social closeness to discover and filter non-location-proximate social relationships. However, the distinction between location-homogeneous social relationships and non-homogeneous social relationships in the distribution of social closeness is not clear. In addition, previous methods based on information propagation ignore user social graph structural characteristics in user geolocation. To tackle above limitations, we propose the k-order neighborhood geographical distribution, which discerns and filters heterophilic social relationships by comparing the geographical distribution similarity of user neighborhoods. Additionally, based on the filtered social network, we calculate the structural influence between users and introduce structural influence-weighted aggregation of user neighborhood features to more accurately geolocates users.
2.2 Graph Deep Learning Method
Social network can be viewed as a natural graph structure, where users are nodes and social relationships between them are edges. As such, existing social relationship-based user geolocation algorithms are closely related to graph algorithms. This subsection will introduce commonly used graph algorithms in user geolocation.
Label Propagation (LP) algorithm [28] leverages label information of a network as node features to iteratively propagate labels among nodes based on local similarity and connectivity relationships, achieving label prediction for unlabeled nodes. DeepWalk [29] is a graph embedding method based on random walks. It generates node sequences by performing random walks on graphs, which are then used as input for word2vec [30] learning. The learned low-dimensional embedding capture adjacency relation features of nodes. Building upon DeepWalk, node2vec [31] introduces a biased random walk graph embedding algorithm. It incorporates a bias towards selecting the next node during the generation of node sequences. Recently, the rapid development of deep learning has greatly promoted the effective representation of graph data by graph neural networks, leading to significant advancements and improvements in graph-based tasks [32]. Among them, Graph Convolutional Networks (GCNs) [27] utilize the adjacency matrix to capture node relationships, propagating and aggregating features based relationships through multiple layers. Graph Attention Networks (GAT) [33] use attention mechanisms [34] to compute aggregation weights based on similarity, considering varying neighbor influences. In order to better scale GNN models to large graphs, GraphSAINT [35] introduces a GNN paradigm based on sampling subgraphs, decoupling sampling from GNN to facilitate the extension of various GNN models.
In this section, we provide definitions for the terminologies used throughout the paper and introduce the concept of user geolocation based on social relationships.
Definition 1 (User Social Network). The user social network, denoted as
Definition 2 (Geographical Homophilic Edge). For
Definition 3 (Geographical Heterophilic Edge). For
Definition 4 (Global Location Homophily). Global Location Homophily is the ratio of the number of geographical homophilic edges to the total number of edges in the graph, denoted as Eq. (1).
Definition 5 (
User Geolocation Based on Social Networks. Given a social network
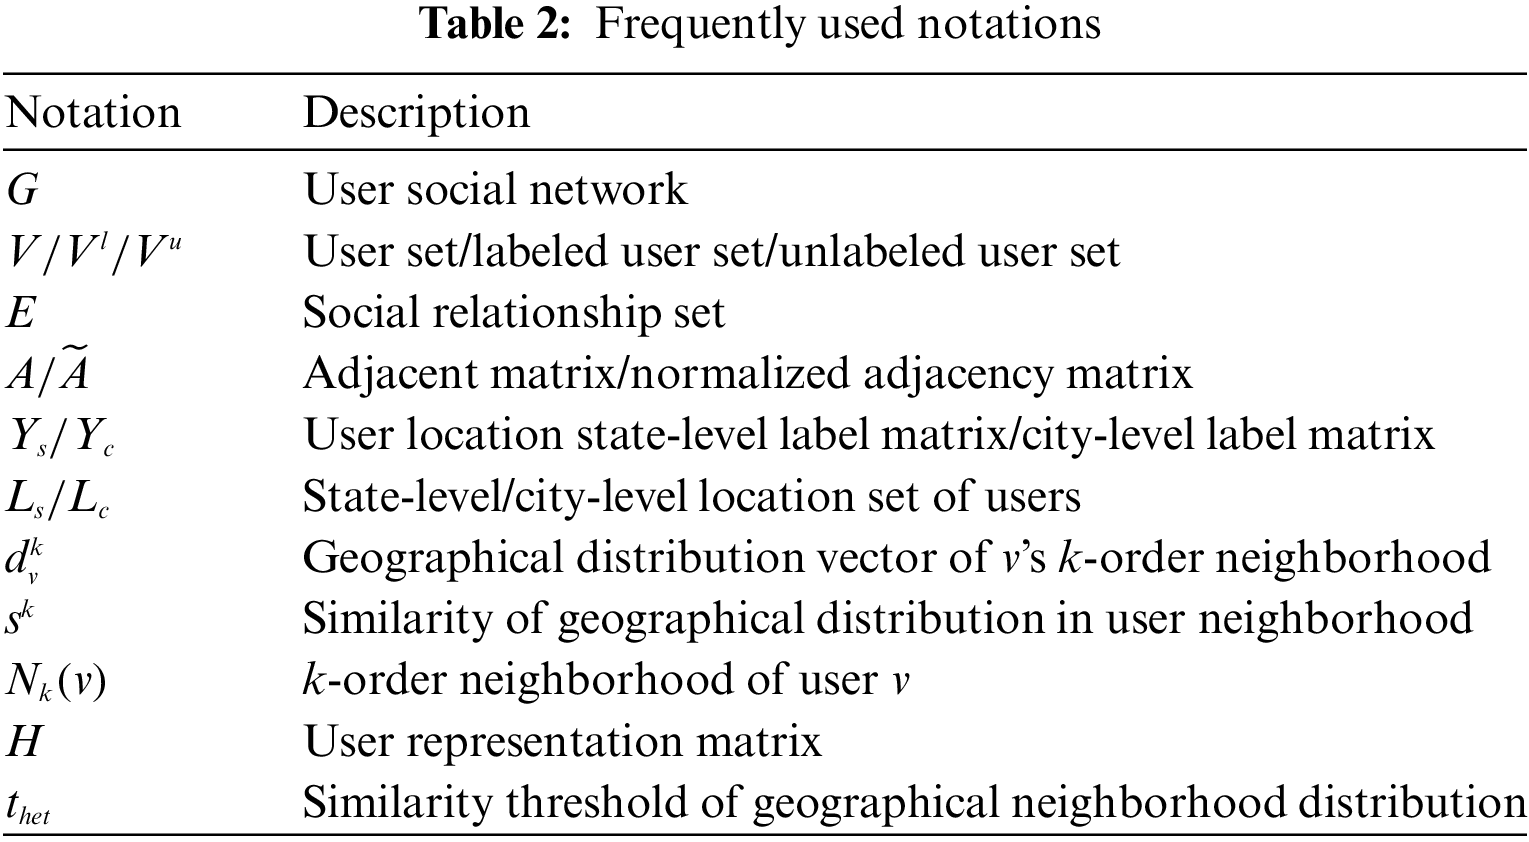
We summarize the notations used in this paper as shown in Table 2.
To better explore and utilize the location homophilic relationships in user social networks, this paper proposes a joint approach that combines neighborhood geographical distribution and social structural influence for social media user geolocation. It consists of two parts: location homophilic relationship distinguish based on
For the first part, we first construct the geographical distribution characteristics of user
For the second part, we incorporate multi-order neighborhood information of users for aggregation, further leveraging the social network structure. To avoid over-smoothing of node features caused by aggregating too much neighborhood information, we introduce personalized PageRank [23] to learn the network structural influence between users in multi-order neighborhoods, and perform a weighted aggregation of user information accordingly. Finally, user location inference is performed based on the aggregated features.
4.1 Location Homophilic Relationship Discerning Based on
Existing methods for evaluating location homophily between two users in a social network often rely on the number of common neighbors to assess [16,22]. As shown in Fig. 1, this approach may not clearly reflect the correlation between the number of common friends and location homophily in social networks with low location homophily. As a result, filtering location-heterophilic social relationships based on social closeness alone makes it challenging for location inference algorithms to achieve satisfactory results. Therefore, we distinguish the location homophily strength of social relationships from the perspective of the geographical distribution of user neighborhoods, as Fig. 2.
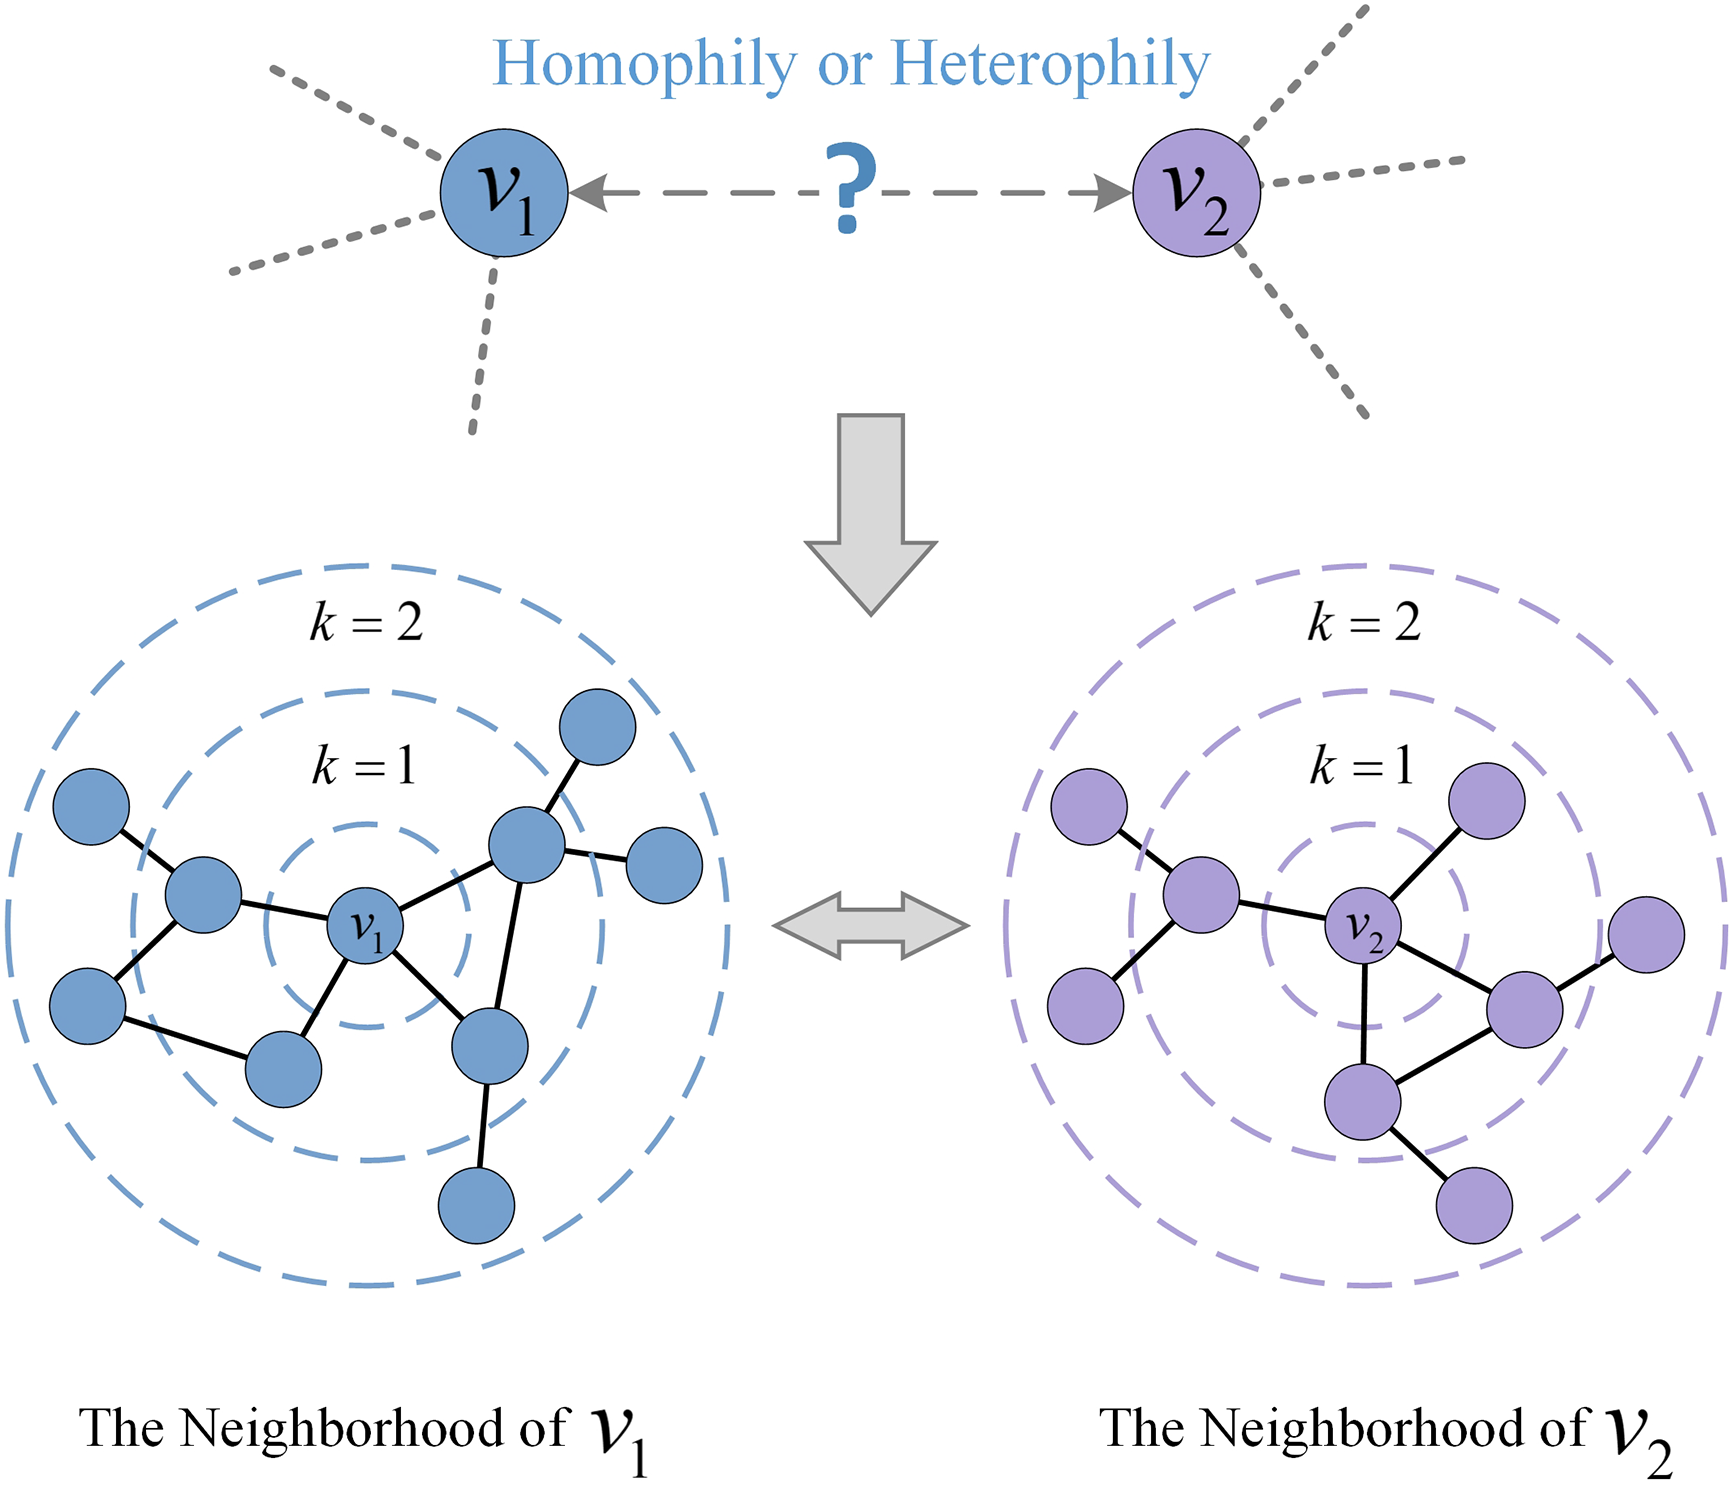
Figure 2: Illustration of homophily strength between nodes
Firstly, we extract the neighboring nodes within
where
where
Next, for two users
In Eq. (4),
where
4.2 User Geolocation Based on Social Structure Influence
In user location inference, using only the first-order neighborhood of users to infer their locations may encounter issues of sparse neighboring users and missing location information. Therefore, effectively utilizing higher-order neighborhood information of users is a primary focus of our study. GNN methods such as GCN [27], when incorporating higher-order information, may suffer from the problem of over-smoothing with excessive stacking of layers. This leads to increased similarity in node representations, making it more challenging to distinguish node location in the network. In this section, we propose a user geolocation method based on the strength of social structure influence. By leveraging structural influence to assign varying weights to neighboring nodes, weighted aggregation of neighbors’ features can effectively mitigate the over-smoothing issue.
Personalized PageRank can assess the influence of an individual user on other users within a social network by leveraging its connectivity. We calculate the positional impact between users based on social network characteristics using the filtered user social network, starting from an individual user, as follows:
where
Based on the global influence matrix
where the initial feature matrix of the nodes is denoted by
The global structure influence matrix among users is constructed based on their social relationships and through random walks with certain probabilities. During the random walk process, on one hand, PPR has a probability of stopping and returning to the starting node, resulting in higher weights for the low-order neighboring nodes in the influence matrix. On the other hand, when PPR continues to walk towards neighbors, the structural information such as the number of paths between two nodes contributes to varying influence weights for higher-order nodes. Therefore, based on these two factors, the PPR-based GNN exhibits significant variations in the aggregation weights of different nodes when aggregating higher-order neighborhoods. This approach not only facilitates better learning of structural information in social networks but also effectively alleviates the over-smoothing issue.
Due to the high computational complexity of computing the inverse matrix in PPR, we propose a model based on the insights from research [36]. The model formulated in Eq. (4) is shown to be equivalent to the PPR-based GNN when stacked with an infinite number of layers.
where
where
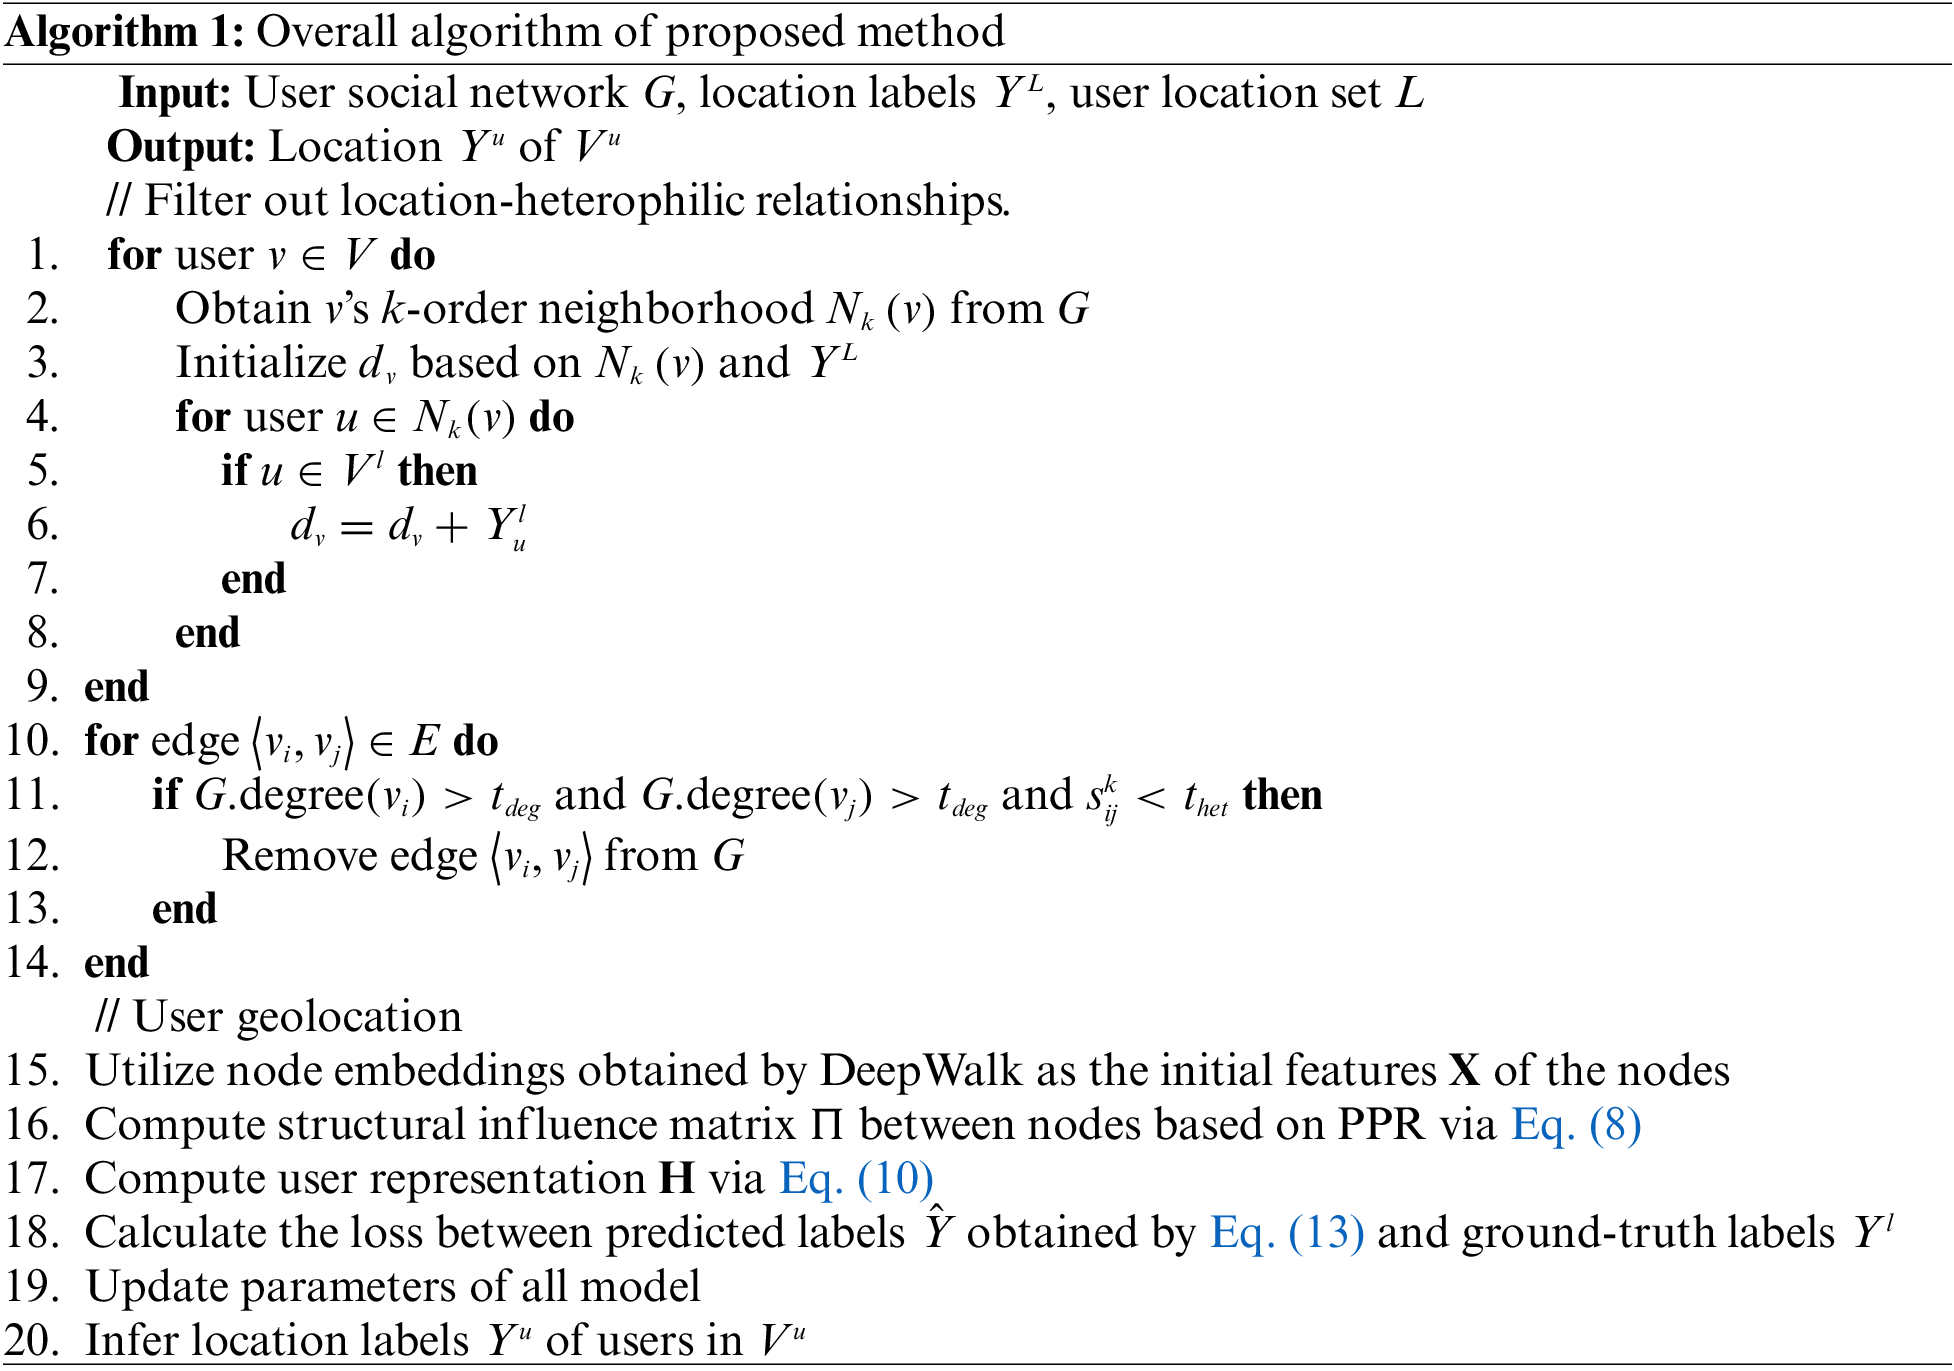
Based aforementioned methods, we summarize the overall algorithm proposed as Algorithm 1.
In this section, we evaluate the proposed method on real-world dataset from various aspects.
In our experiments, we use the Brightkite dataset provided by SNAP, which includes the initial social network of users and their check-in records. In this paper, our primary objective is to infer the user’s primary residence address. Therefore, we first need to determine the user’s primary residence address. We perform clustering on the check-in coordinates of users using the Density-Based Spatial Clustering of Applications with Noise algorithm (DBSCAN) [37], and determine the center location of the largest cluster as the user’s primary residence. We then use reverse geocoding to convert the user’s coordinates into “Country-State-City” format. Due to the concentration of users primarily in the United States region, we select 30,127 users located in the United States and divide them into a training set and a test set with an 8:2 ratio for geolocation experiments. We summarize the information of the dataset in Table 3. Based on the users’ primary residence locations, we plot the geographic distribution map of the users, as shown in Fig. 3.
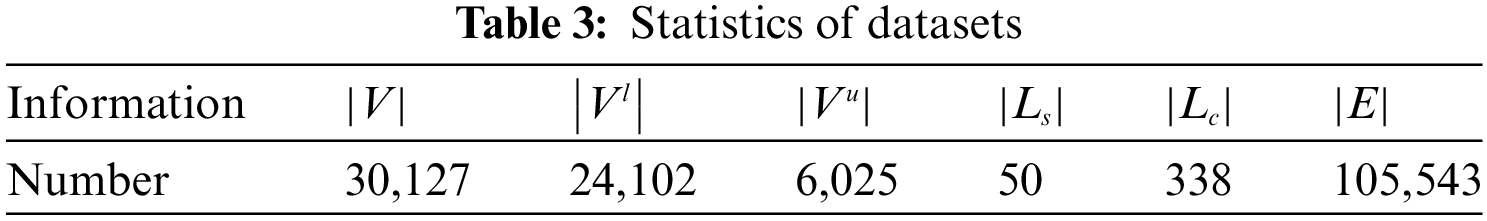
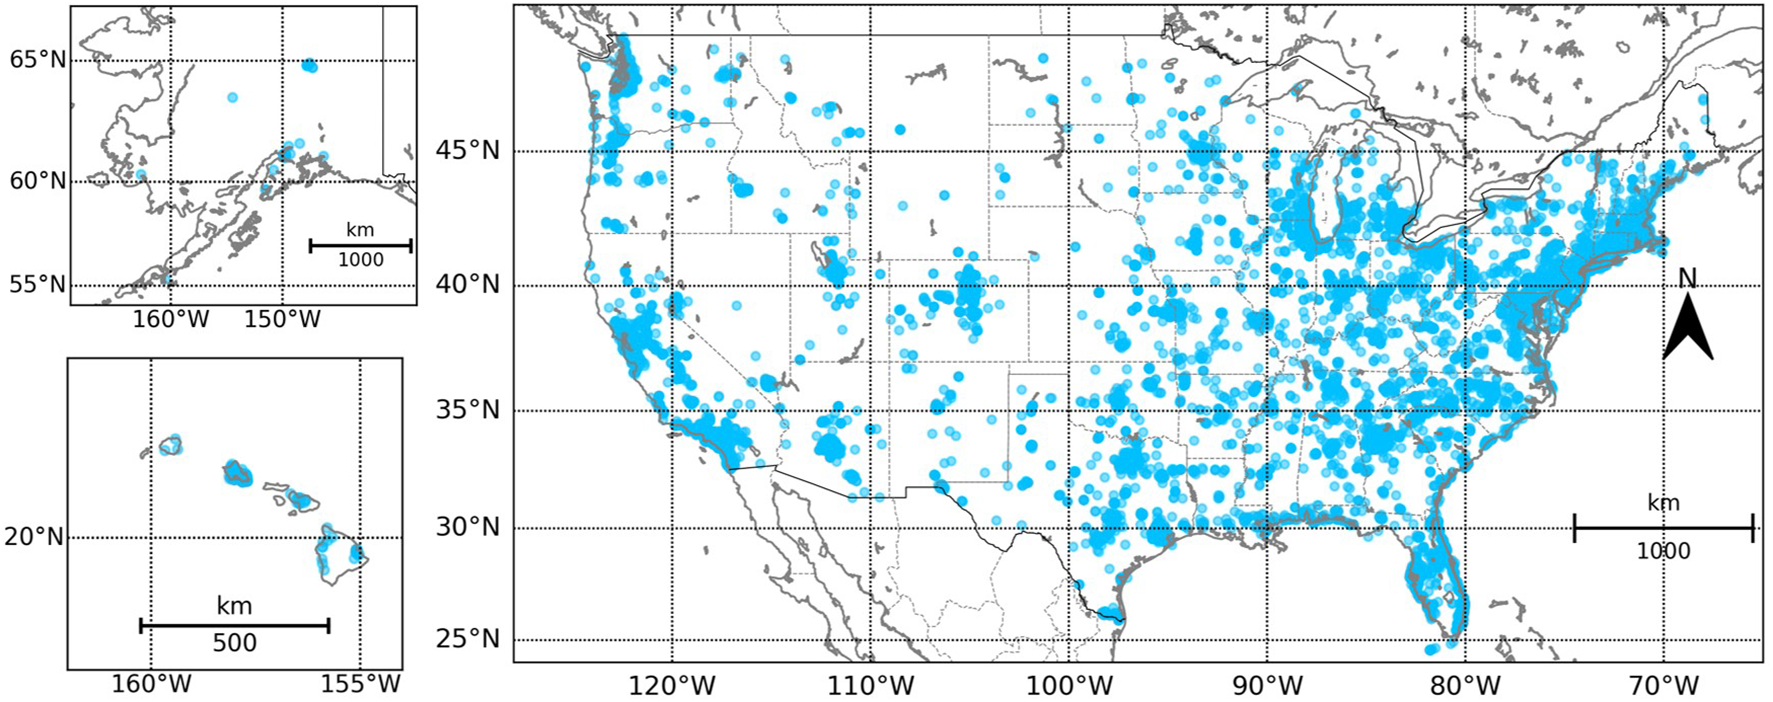
Figure 3: Geographic distribution map of the users
To comprehensively evaluate our proposed method, we compare it with two existing classes of social relationship-based user geolocation methods.
• FindMe [14] employs the fitting distance-friend probability model and selects the friend location that maximizes the friend probability as the user’s location.
• Friendly [24] classifies social relationships and improves the fitting formula based on the FindMe.
• Spot-Tightness [22] constructs a probabilistic model between social intimacy and distance, estimating the user’s location based on the social intimacy estimation between the target and the neighbors.
• Spot-Energy [22] uses the energy and social coefficient between users as measures of neighbors’ locations, selecting the neighbor with the maximum value of the joint indicators as the target user’s location.
• SLP [15] utilizes the known latitude and longitude of users as node labels, propagates through the social network, and determines the user’s location by calculating the geometric median of neighboring locations.
• Deepwalk-MLP [29] employs deepwalk to learn node representations of the user social network, followed by Multi-Layer Perception (MLP) for node geolocation.
• SSLP [16] builds upon SLP by incorporating a filtering mechanism based on social intimacy scores to select neighboring users.
• GCN-LP [26] utilizes the user adjacency matrix as the input to highway-GCN for user classification and positioning.
During the user location inference experiments, we defined two categories of labels, namely state and city. The inferred location of a user corresponds to the latitude and longitude of the city-level city. The inference error of a user is measured as the distance between the true latitude and longitude of the user and the inferred latitude and longitude, denoted as
where
To comprehensively assess the geolocation performance of methods, we utilize five commonly used metrics in existing research: state-level accuracy, metropolitan-level accuracy (accuracy within 161 kilometers), mean distance error, median distance error, and coverage rate. Equations for calculating the above metrics are as Eqs. (16)–(20).
Acc@State: The accuracy of user location classification at the state level.
Acc@161: The accuracy of user localization within a 161-kilometer radius.
MedianED: The median error distance between inferred locations and true locations for users with unknown locations.
MeanED: The mean error distance between inferred locations and true locations for users with unknown locations.
Coverage: The ratio between the number of locatable users and the total number of users with unknown locations.
In Eqs. (16)–(20),
We utilize DeepWalk [29] to obtain node embeddings as initial features
5.2 Analysis of k-NGD on Homophilic and Heterophilic Relationships
The metric proposed by existing methods have very similar distributions on location homophily and heterophily relationships, making them difficult to distinguish (as shown in Fig. 1). To verify the differential distribution of
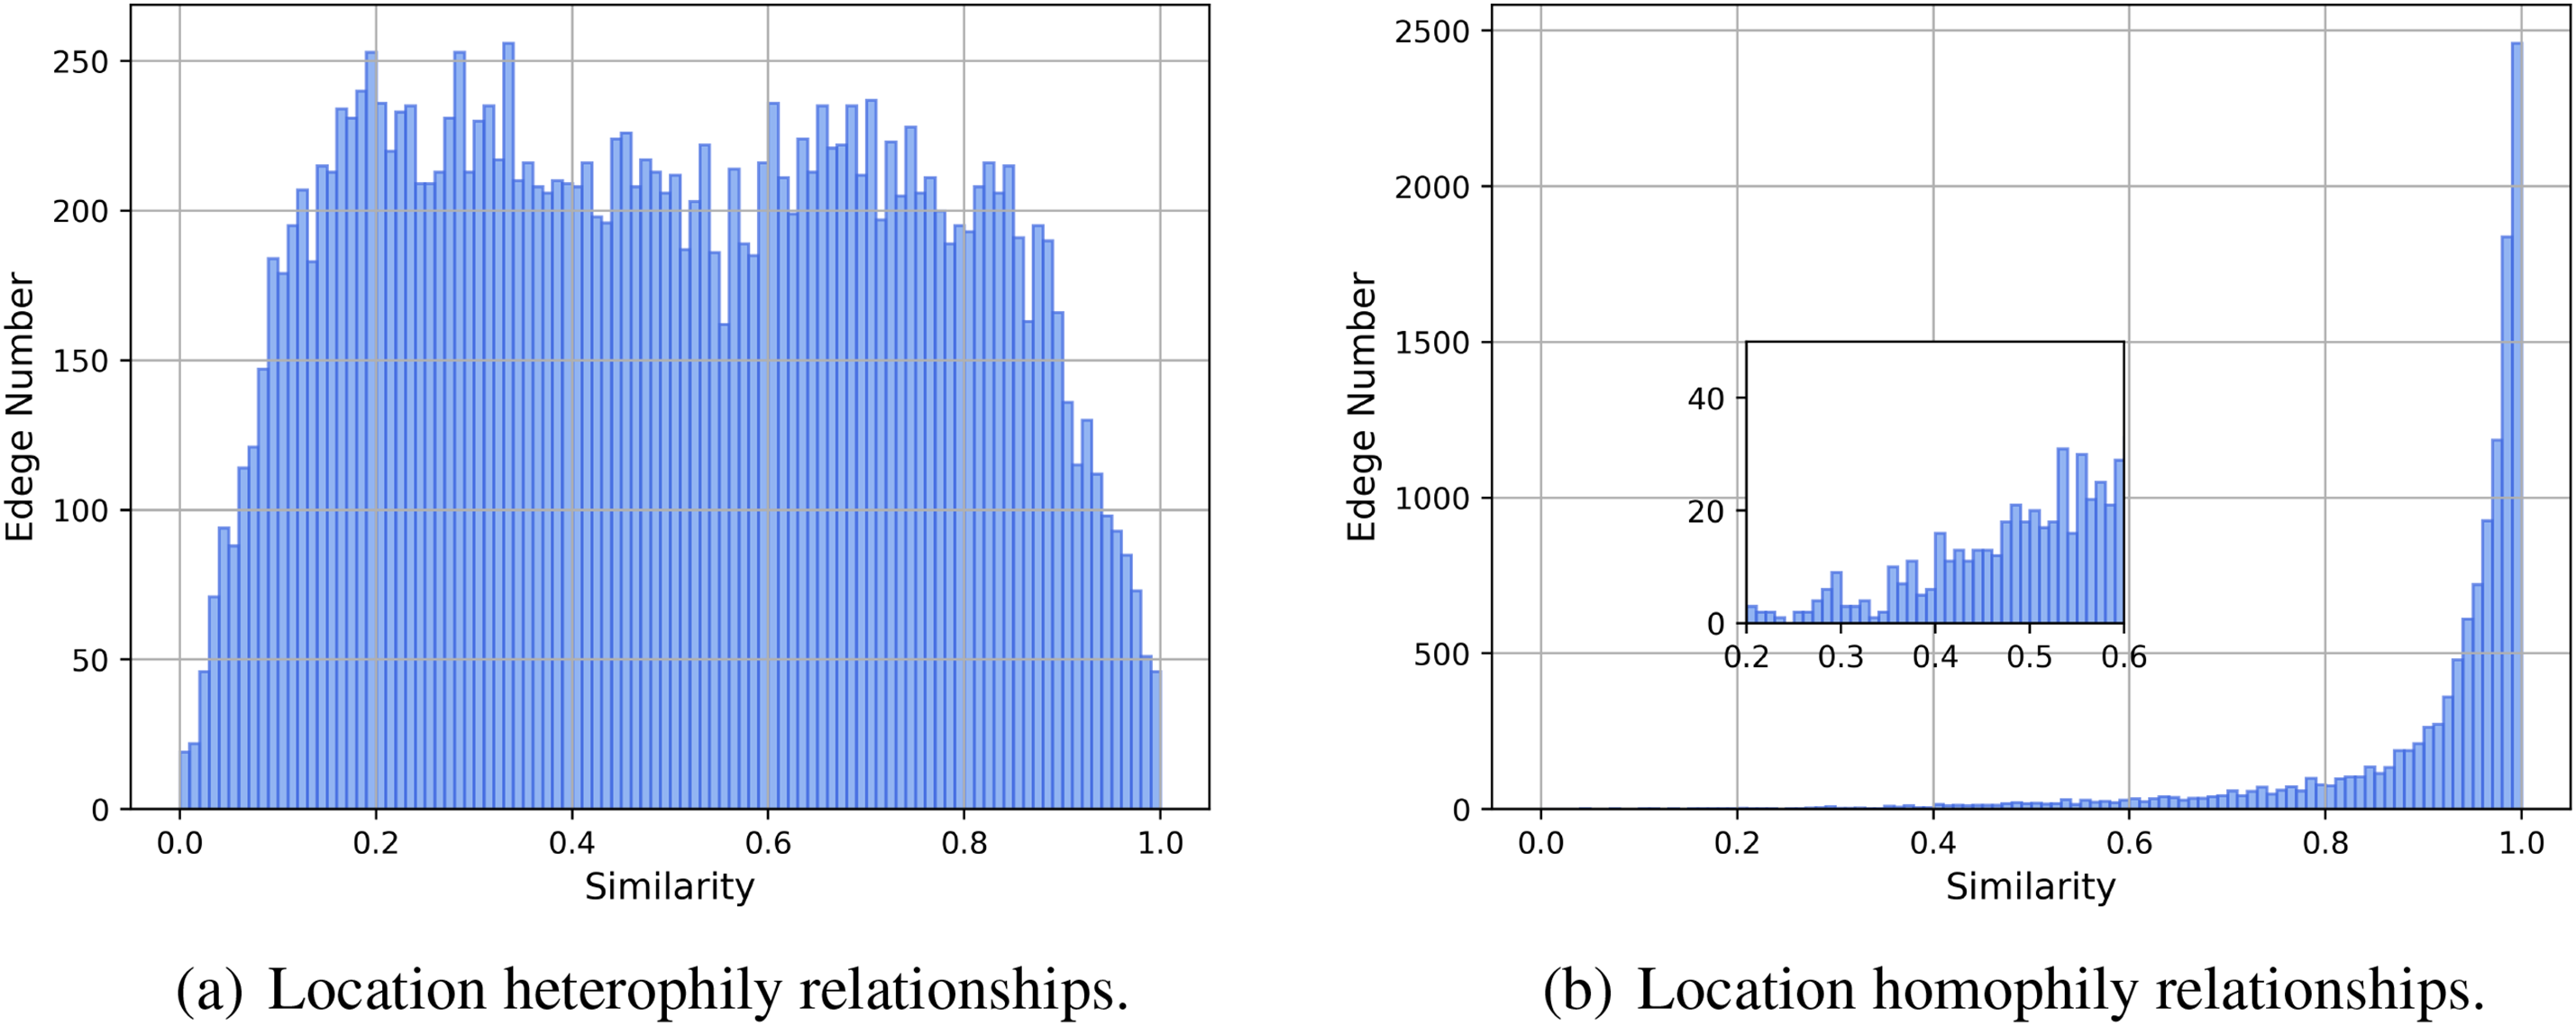
Figure 4: Distribution of NGD similarity for two types of social relationships at the state level
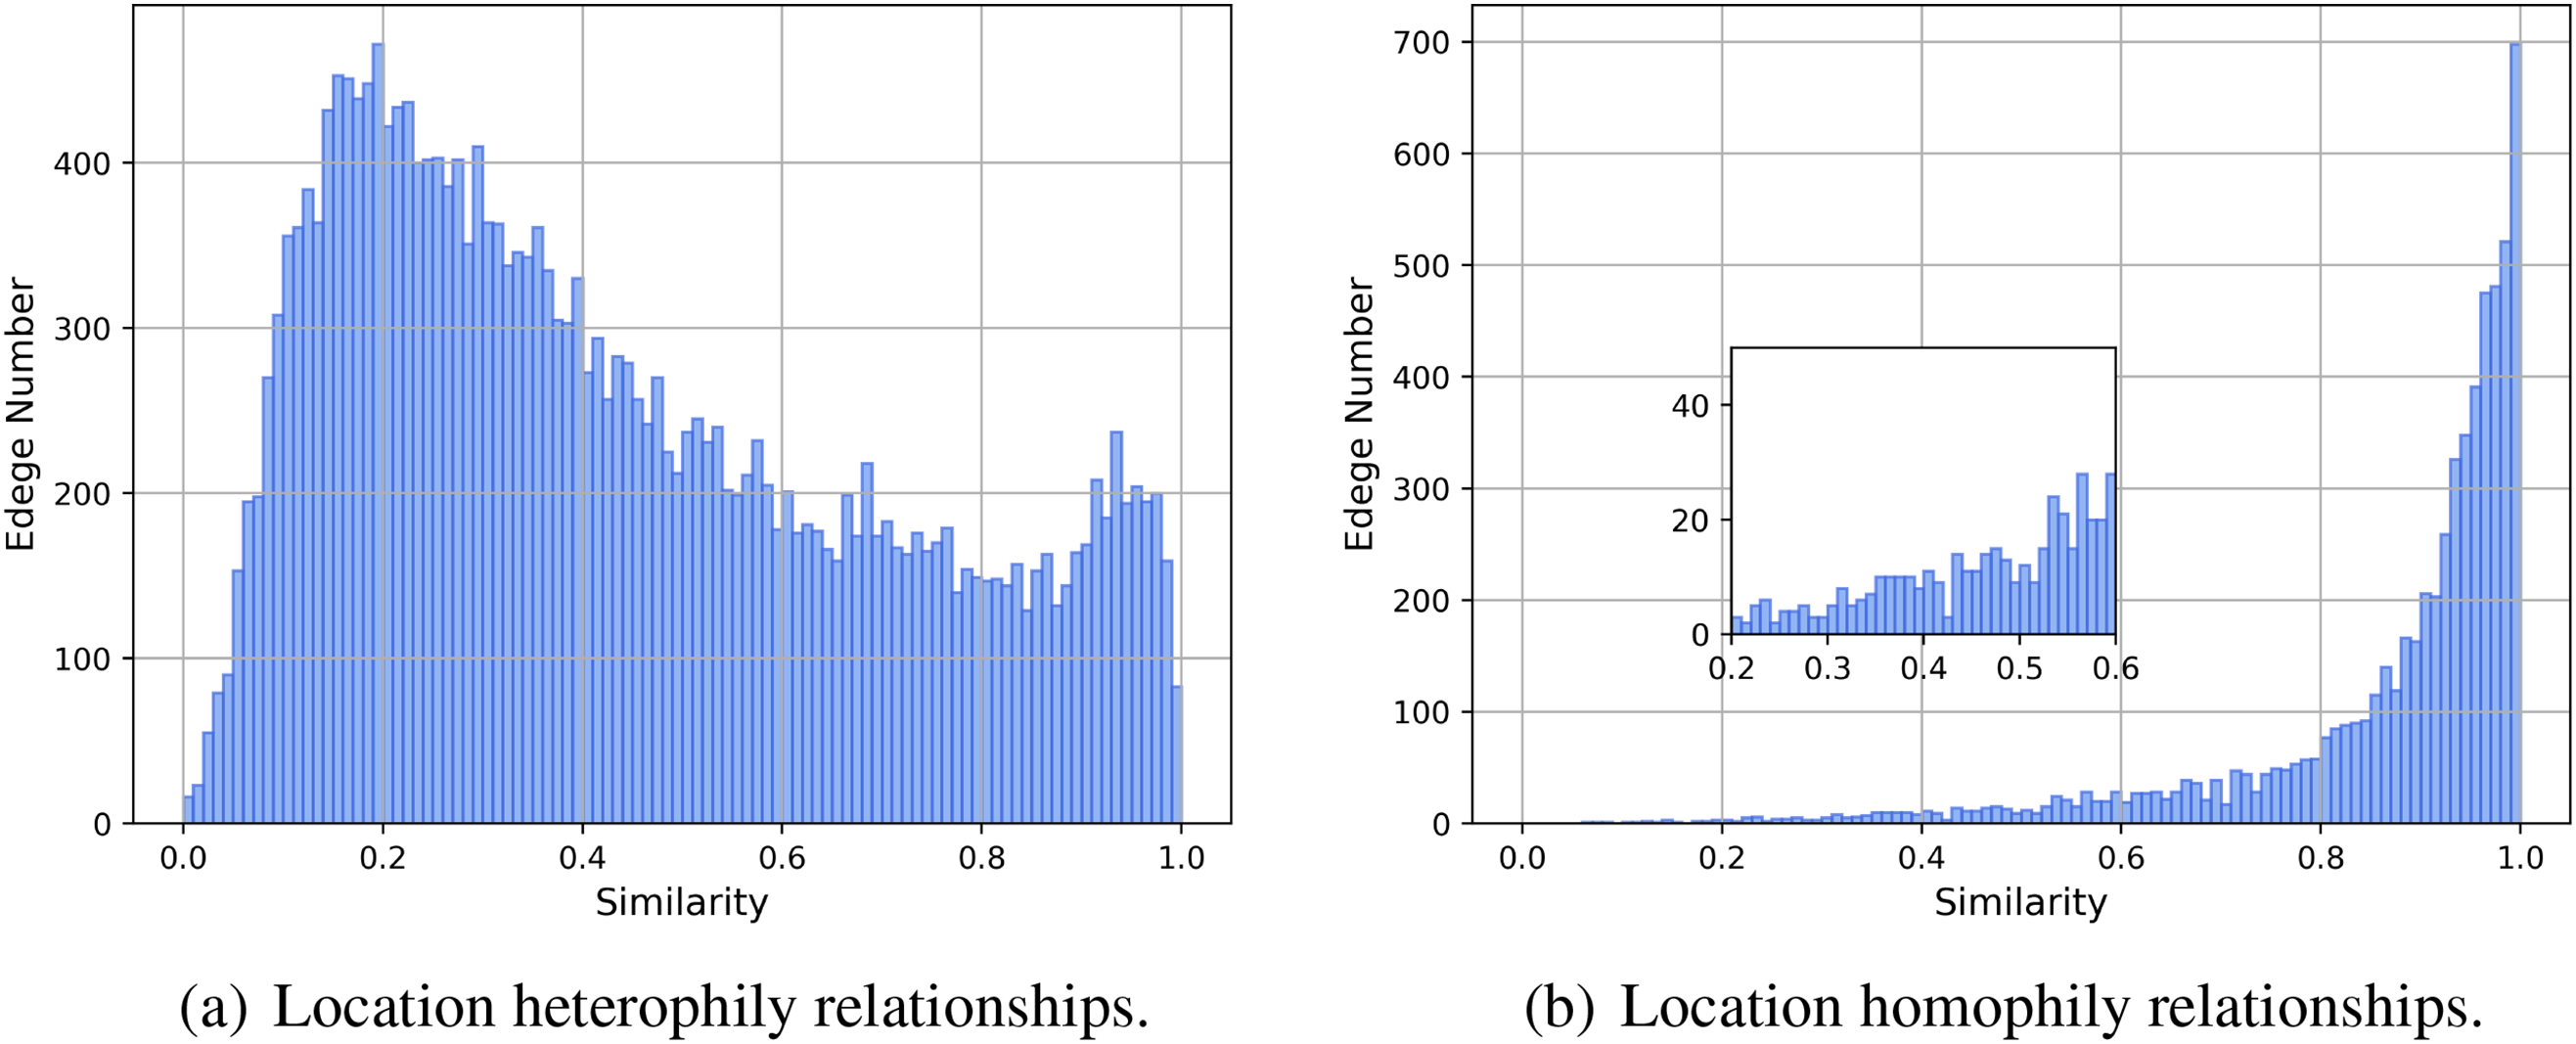
Figure 5: Distribution of NGD similarity for two types of social relationships at the city level
In Fig. 4, the 2-NGD similarity scores for heterophily edges exhibit a relatively evenly distributed concentration between 0.1 and 0.8, followed by a rapid decline in the range of 0.8 to 1.0. Conversely, the 2-NGD similarity scores for homophily edges are highly concentrated in the range above 0.9, displaying a distinctly different distribution from that of heterophily edges. At the city level as Fig. 5, the differences in similarity are more pronounced. The 2-NGD similarity scores for heterophily edges exhibit a high concentration around 0.2, with a significant decrease in the number of heterophily edges as the similarity score increases. In contrast, the number of homophily edges shows a sharp increase after 0.8. Therefore, we can effectively distinguish the homophily of user locations and efficiently filter heterophily edges by utilizing the similarity of neighborhood geographical distributions between two users. NGSI allows us to increase the proportion of homophily social relationships within the social network.
5.3 Geolocation Performance of the Proposed Method
From Table 4, it can be observed that NGSI achieves a geolocation accuracy of 68.98% at the provincial level, which represents an improvement of 4.8% and 7.3% compared to existing methods. Compared to eight existing social relationship-based user positioning methods, NGSI exhibits significant performance enhancements. The proposed approach not only enables the positioning of all users with social relationships but also achieves a higher Acc@161 by 4.84% compared to the state-of-the-art (SOTA). Additionally, it reduces the average distance error by over 100 km and decreases the median error distance by 24.4%.
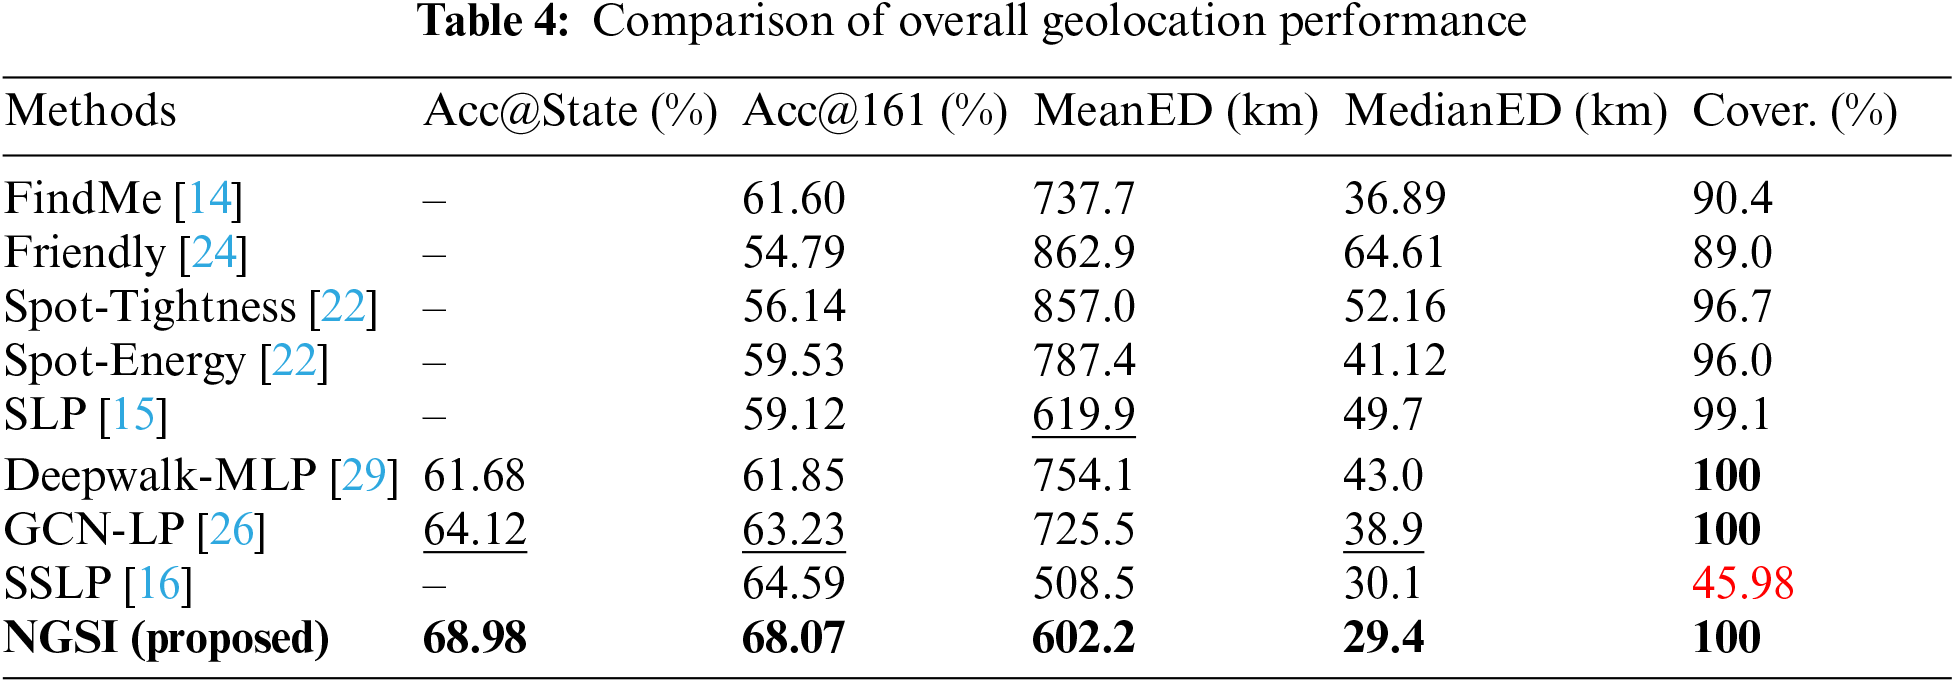
In the first category of relationship-based user geolocation methods, FindMe [14] exhibits the highest geolocation accuracy, but with lower coverage. Spot-Energy [22] demonstrates better overall geolocation performance, while Friendly [24] scores lower across all metrics. Both FindMe and Friendly geolocate users based on their first-order neighbors. When the location information of these first-order neighbors is unknown, the user cannot be geolocated, leading to low coverage. Friendly introduces local social relationship discrimination based on FindMe. But due to the dataset using in experiments containing only one type of undirected social relationship, the lack of social relationship properties such as relationship types and directions results in poor geolocation capability. Based on Spot-Tightness, Spot-Energy introduces the social coefficient of user neighborhoods, enhancing user geolocation performance. However, as Spot-Energy still relies on the distance-friend probability model, constrained by the representational capacity of the basic model, its geolocation performance remains significantly lower compared to NGSI.
Compared to the first category, the second category of methods based on information propagation exhibits significant improvements in inferring user locations. The SLP [15] algorithm achieves an average error distance that is only surpassed by the proposed method in this paper. Its smaller error distance is attributed to the fact that user location inference is obtained through the geometric mean of neighboring user locations, where the geometric mean represents the geometric center closest to each neighbor’s location, resulting in smaller inference distance errors. Although SSLP [16] achieves relatively high accuracy in location inference on this dataset, it can only infer the location of less than 50% of all users. As shown in Fig. 1, our previous analysis reveals that social closeness of users is concentrated within 0.1 and the ability to distinguish between homophilic and heterophilic locations is not strong. This results in the overall poorer performance of SSLP in location inference.
After transforming the user localization problem into a node classification problem (GCN-LP [26], Deepwalk-MLP [29], and the proposed NGSI in our paper), not only can multiple levels of localization be achieved for nodes, but also the localization performance is superior. Here, we primarily compare localization algorithms at the state level with those commonly used within a 161 km range. Deepwalk-MLP only uses node embeddings obtained from deepwalk to infer user locations, while GCN-LP and NGSI utilize the mapping between social structure relationships and location to continuously learn parameters, resulting in significantly better localization performance than Deepwalk-MLP. NGSI not only utilizes information from users with known locations to filter out a large number of heterophilic location relationships, thereby improving the homophily of the social network’s location, but also uses the influence strength of user network structure to weight the aggregation of neighborhood features, resulting in a significant improvement in user geolocation performance.
Compared to the second category of information propagation-based methods, the first category of methods that geolocation based on neighboring users’ locations generally exhibit lower coverage and lower accuracy than the second category. This is because in social networks, the first-order neighbors of users are often unlabeled nodes, making it impossible to infer the location of users in such cases, leading to a lower user coverage. Meanwhile, methods based on information diffusion can more comprehensively consider the information propagation process in the network, effectively utilizing multi-order information and network structure in social networks to achieve better geolocation results.
5.4 Analysis of thet on Geolocation Performance
In this section, we analyze the impact of the threshold value thet on the filtered number of social relationships, the proportion of location heterophilic relationships, the change in global location homophily ratio, and the accuracy of user location inference.
First, we calculate the 2-NGD to measure the geographical distribution similarity between users. We filter the social relationships that are less than the threshold
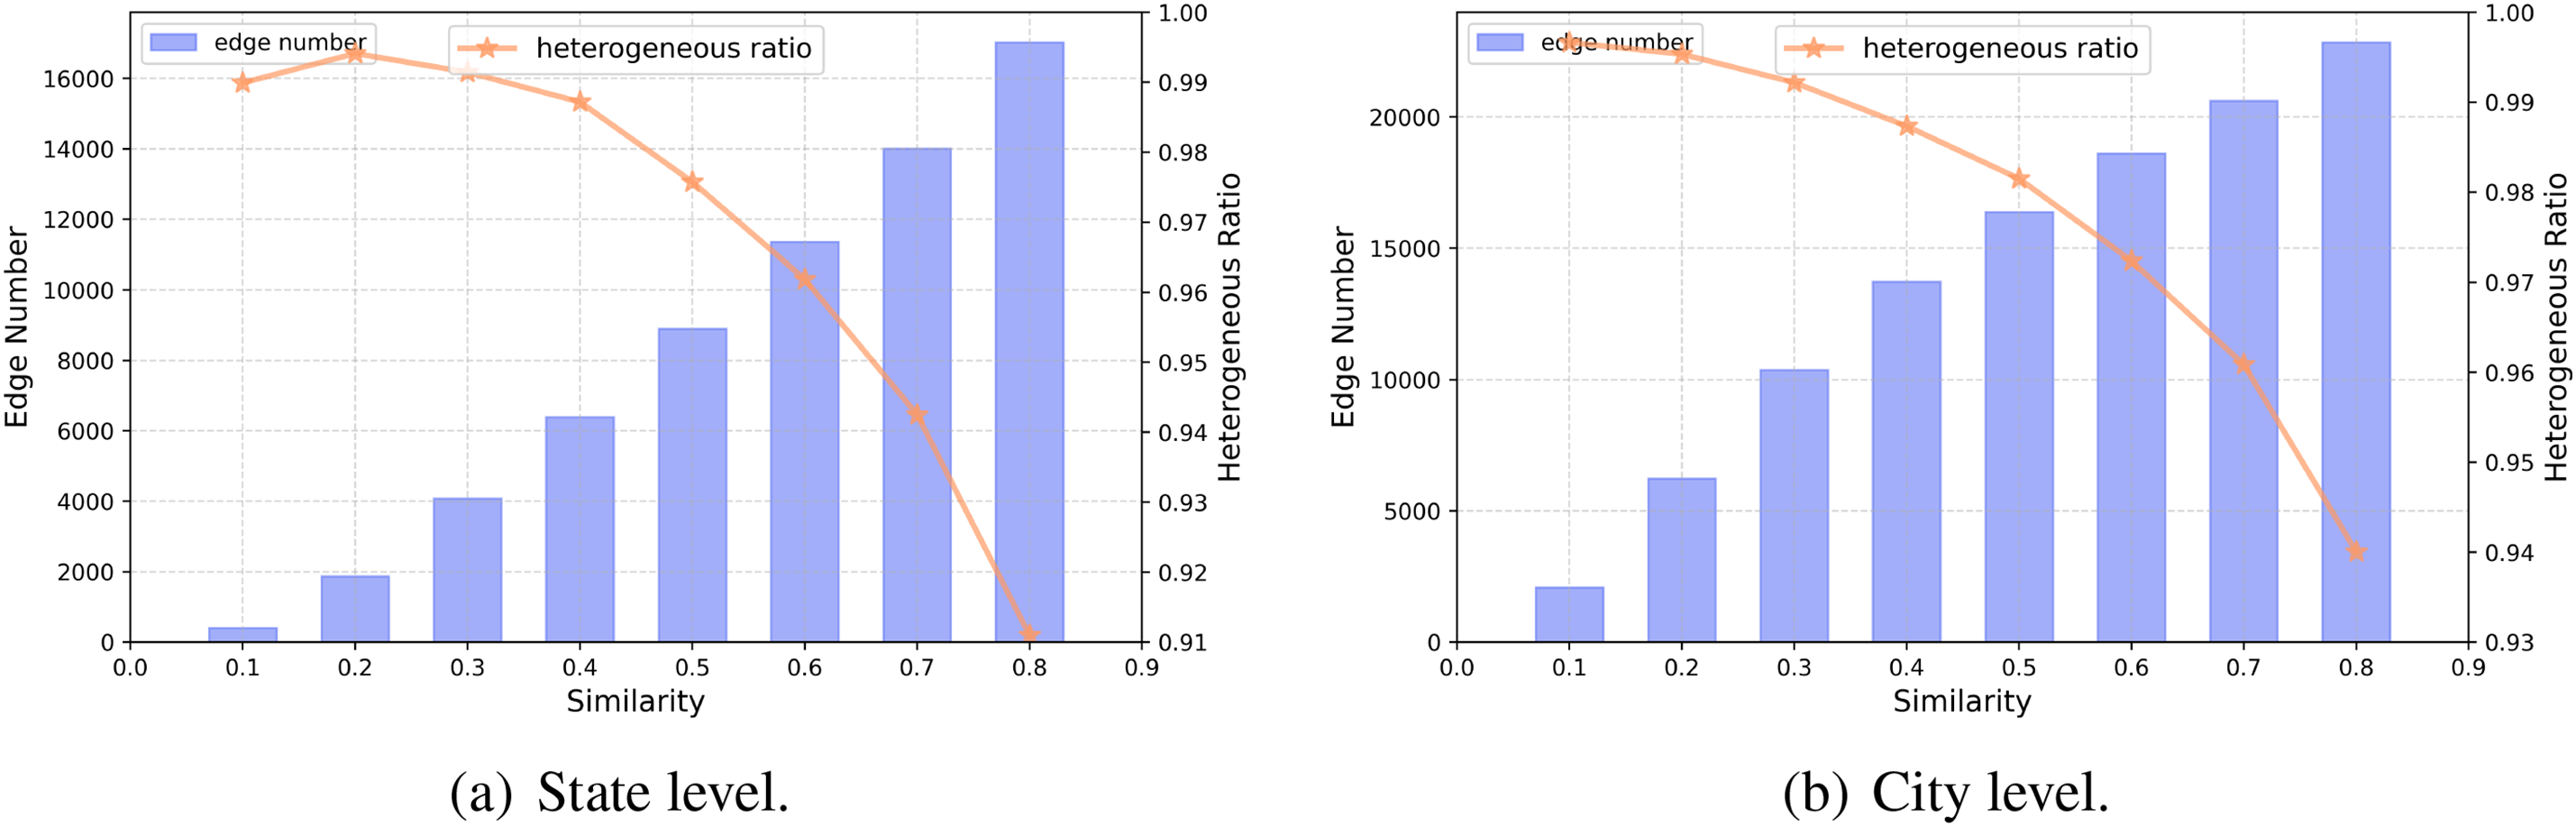
Figure 6: Relationship between threshold
When setting different
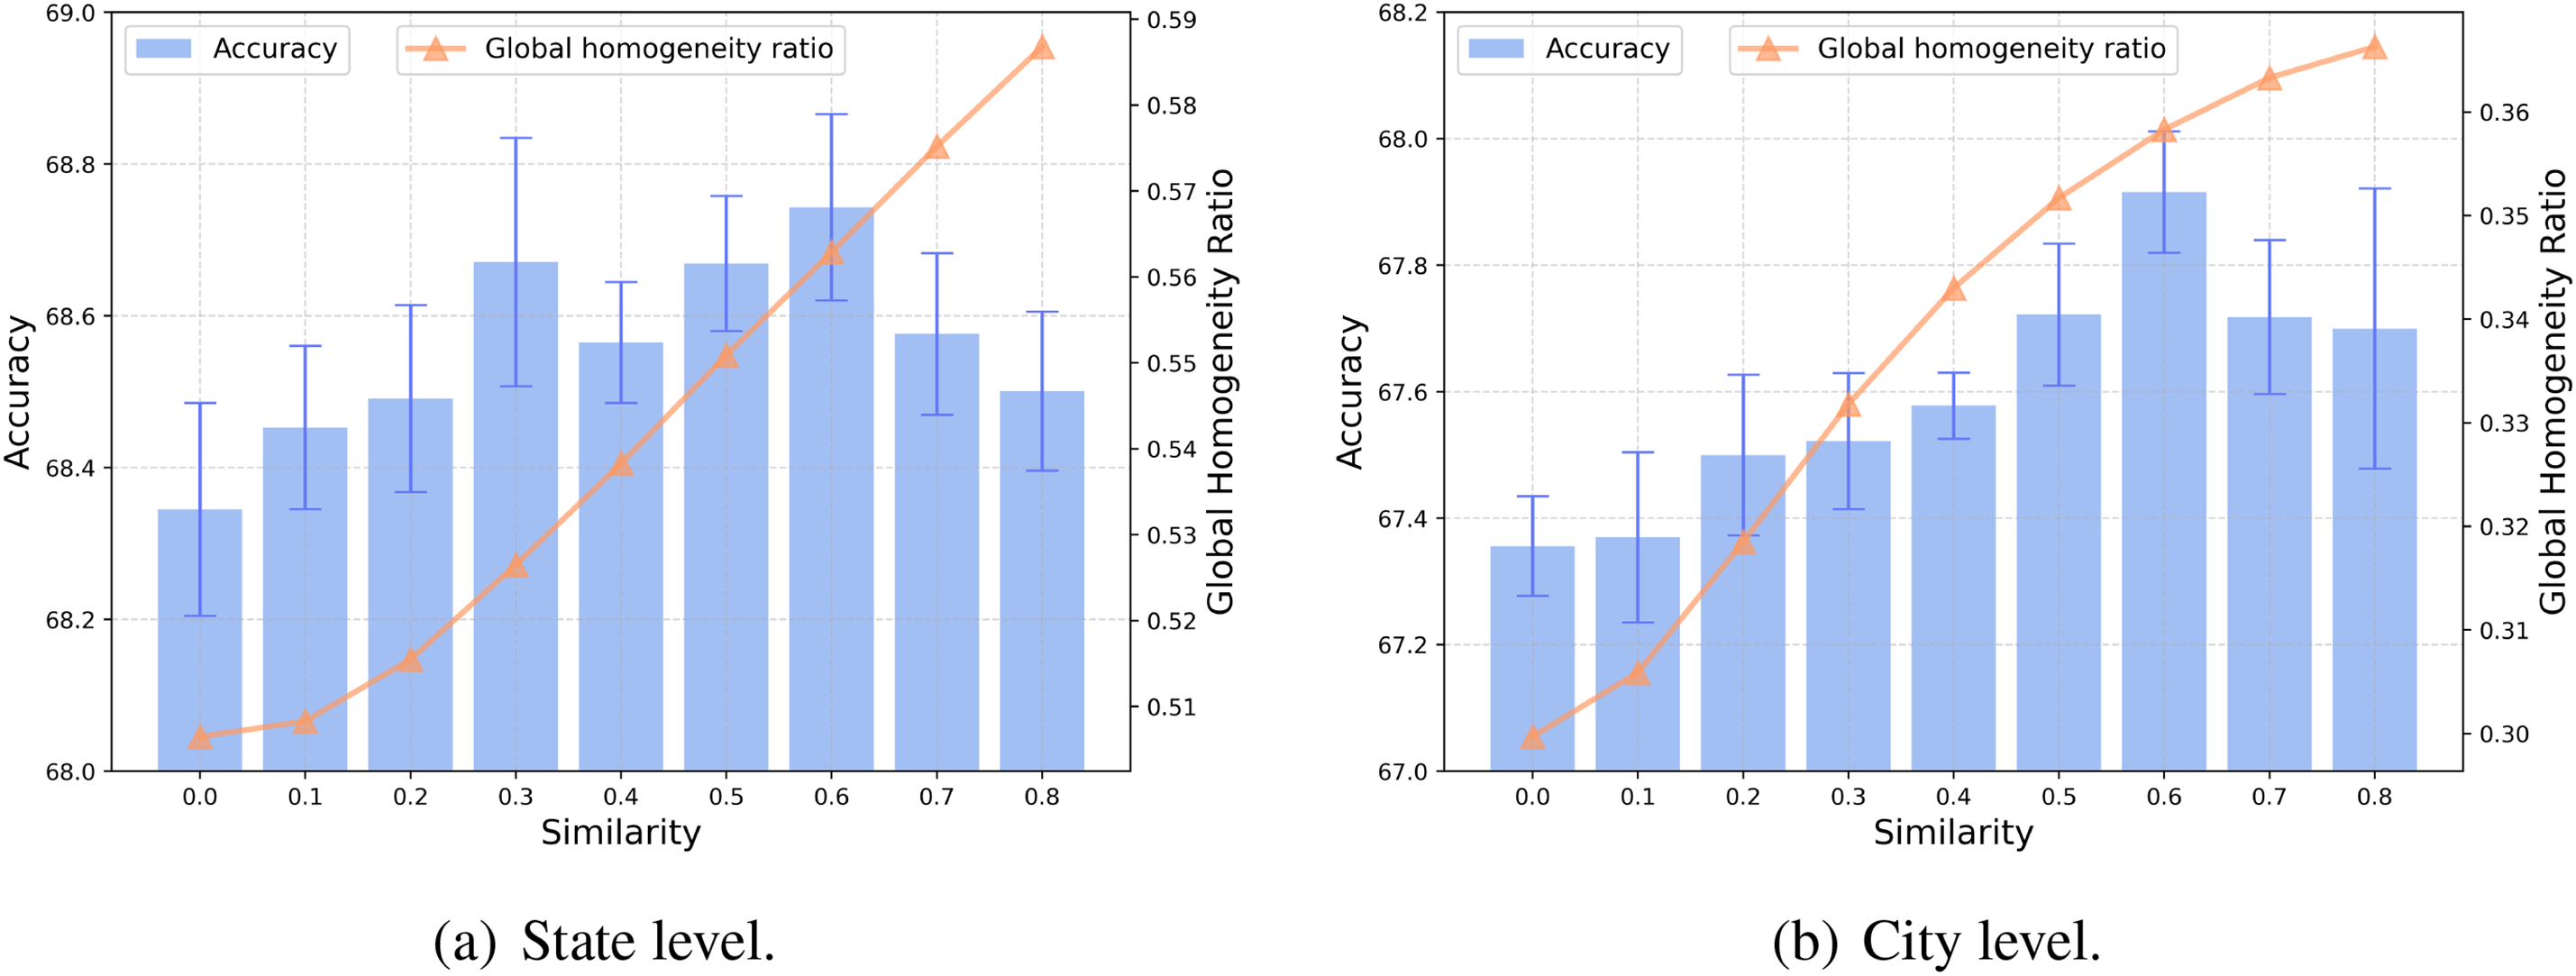
Figure 7: Accuracy and global homophily proportion at different levels. The blue bars represent the geolocation accuracy (Acc@161), while the orange triangle (
In this paper, we propose a social media user positioning method based on uniting neighbor geographical distribution and social structure influence, called NGSI. NGSI first utilizes the similarity of users’ neighborhood geographical distributions to filter out location-heterophily social relationships, thereby enhancing the overall geographical homophily of the social network. Furthermore, it further leverages the structural information of user social networks to calculate the strength of influence between users and selectively aggregates neighboring node features. The experimental results demonstrate that our proposed NGSI not only provides multi-granularity user positioning but also significantly outperforms existing methods for user geolocation based on social relationships. Moreover, we conduct a comprehensive analysis of neighborhood geographical distribution similarity and found significant differences in the distribution between location-homophilic and location-heterophilic social relationships. We observed that over 90% of the filtered social relationships based on 2-NGD are location-heterophilic relationships.
In future work, we aim to further integrate the multiple types of user attributes in social media and explore differentiate algorithms. This will enable more accurate filtering of location-heterophilic social relationships, thereby enhancing user positioning performance.
Acknowledgement: Authors are grateful to the valuable feedback and patient efforts of reviews and editors.
Funding Statement: This work was supported by the National Key R&D Program of China (No. 2022YFB3102904), and the National Natural Science Foundation of China (Nos. 62172435, U23A20305), and Key Research and Development Project of Henan Province (No. 221111321200).
Author Contributions: The authors confirm contribution to the paper as follows: study conception and design: Meng Zhang; data collection: Ningbo Huang; analysis and interpretation of results: Meng Zhang; draft manuscript preparation: Meng Zhang, Xiangyang Luo. All authors reviewed the results and approved the final version of the manuscript.
Availability of Data and Materials: https://snap.stanford.edu/data/.
Conflicts of Interest: The authors declare that they have no conflicts of interest to report regarding the present study.
4https://www.statista.com/statistics/272014/global-social-networks-ranked-by-number-of-users/
References
1. Aristotle. Politics. Available from: https://www.goodreads.com/quotes/183896-man-is-by-nature-a-social-animal-an-individual-who. [Accessed 2023]. [Google Scholar]
2. Ren R, Su L, Meng X, Wang J, Zhao M. A large-scale group decision making model based on trust relationship and social network updating. Comput Model Eng Sci. 2024;138(1):429–58. doi:10.32604/cmes.2023.027310 [Google Scholar] [CrossRef]
3. Shang L, Zhang Y, Youn C, Wang D. SAT-Geo: a social sensing based content-only approach to geolocating abnormal traffic events using syntax-based probabilistic learning. Inf Process Manag. 2022;59(2):102807. doi:10.1016/j.ipm.2021.102807. [Google Scholar] [CrossRef]
4. Anjum U, Zadorozhny V, Krishnamurthy P. Localization of unidentified events with raw microblogging data. Online Soc Netw Media. 2022;29:100209. doi:10.1016/j.osnem.2022.100209. [Google Scholar] [CrossRef]
5. Zhan XX, Zhang K, Ge L, Huang J, Zhang Z, Wei L, et al. Exploring the effect of social media and spatial characteristics during the COVID-19 pandemic in China. IEEE Trans Netw Sci Eng. 2023;10(1):553–64. doi:10.1109/TNSE.2022.3217419. [Google Scholar] [CrossRef]
6. Pellicani A, Pio G, Redavid D, Ceci M. SAIRUS: spatially-aware identification of risky users in social networks. Inf Fusion. 2023;92:435–49. doi:10.1016/j.inffus.2022.11.029. [Google Scholar] [CrossRef]
7. Kumar A, Singh JP. Deep neural networks for location reference identification from bilingual disaster-related tweets. IEEE Trans Comput Soc Syst. 2024;11:880–91. doi:10.1109/TCSS.2022.3213702. [Google Scholar] [CrossRef]
8. Lam NSN, Meyer M, Reams M, Yang S, Lee K, Zou L, et al. Improving social media use for disaster resilience: challenges and strategies. Int J Digit Earth. 2023;16(1):3023–44. doi:10.1080/17538947.2023.2239768. [Google Scholar] [CrossRef]
9. Ma Y, Cui N, Jiang ZZ, Yuan Y, Wang G. Group homophily based facility location selection in geo-social networks. World Wide Web. 2023;26(1):33–53. doi:10.1007/s11280-022-01008-3. [Google Scholar] [CrossRef]
10. Saravanan PS, Ramani S, Reddy VR, Farhaoui Y. A novel approach of privacy protection of mobile users while using location-based services applications. Ad Hoc Netw. 2023;149:103253. doi:10.1016/j.adhoc.2023.103253. [Google Scholar] [CrossRef]
11. Tong W, Tong Y, Xia C, Hua J, Li Q, Zhong S. Understanding location privacy of the point-of-interest aggregate data via practical attacks and defenses. IEEE Trans Dependable Secure Comput. 2023;20(3):2433–49. doi:10.1109/TDSC.2022.3184279. [Google Scholar] [CrossRef]
12. Ren K, Zhang S, Lin H. Where are you settling down: geo-locating twitter users based on tweets and social networks. In: Information retrieval technology. Berlin, Heidelberg: Springer; 2012. vol. 7675. [Google Scholar]
13. Davis Jr. CA, Pappa GL, de Oliveira DRR, de L, Arcanjo F. Inferring the location of twitter messages based on user relationships. Trans GIS. 2011;15(6):735–51. doi:10.1111/tgis.2011.15.issue-6. [Google Scholar] [CrossRef]
14. Backstrom L, Sun E, Marlow C. Find me if you can: improving geographical prediction with social and spatial proximity. In: Proceedings of the 19th International Conference on World Wide Web; 2010 Apr 26–30; Raleigh, North Carolina, USA. p. 4–5. [Google Scholar]
15. Jurgens D. That’s what friends are for: inferring location in online social media platforms based on social relationships. In: Proceedings of the Seventh International Conference on Weblogs and Social Media; 2013 Jul 8–11; Cambridge, Massachusetts, USA. vol. 7, no. 1, p. 273–82. [Google Scholar]
16. Haldar NAH, Reynolds M, Shao Q, Paris C, Li J, Chen Y. Activity location inference of users based on social relationship. World Wide Web. 2021;24(4):1165–83. doi:10.1007/s11280-021-00899-y. [Google Scholar] [CrossRef]
17. McPherson M, Smith-Lovin L, Cook JM. Birds of a feather: homophily in social networks. Annu Rev Sociol. 2001;27(1):415–44. doi:10.1146/soc.2001.27.issue-1. [Google Scholar] [CrossRef]
18. Ju W, Yi S, Wang Y, Xiao Z, Mao Z, Li H, et al. A survey of graph neural networks in real world: imbalance, noise, privacy and OOD challenges. 2024. doi:10.48550/arXiv.2403.04468. [Google Scholar] [CrossRef]
19. Eisenstein J, O’Connor B, Smith NA, Xing EP. A latent variable model for geographic lexical variation. In: Proceedings of the 2010 Conference on Empirical Methods in Natural Language Processing; 2010 Oct 9–11; MIT Stata Center, Massachusetts, USA. p. 1277–87. [Google Scholar]
20. Cho E, Myers SA, Leskovec J. Friendship and mobility: user movement in location-based social networks. In: Proceedings of the 17th ACM SIGKDD International Conference on Knowledge Discovery and Data Mining; 2011 Aug. 21–24; San Diego, CA, USA. [Google Scholar]
21. Roller S, Speriosu M, Rallapalli S, Wing B, Baldridge J. Supervised text-based geolocation using language models on an adaptive grid. In: Proceedings of the 2012 Joint Conference on Empirical Methods in Natural Language Processing and Computational Natural Language Learning; 2012 Jul 12–14; Jeju Island, Korea. p. 1500–10. [Google Scholar]
22. Kong L, Liu Z, Huang Y. SPOT: locating social media users based on social network context. Proc VLDB Endow. 2014;7(13):1681–4. doi:10.14778/2733004.2733060. [Google Scholar] [CrossRef]
23. Page L, Brin S, Motwani R, Winograd T. The pagerank citation ranking: bringing order to the web (Technical Report). Stanford InfoLab; 1998. [Google Scholar]
24. McGee J, Caverlee J, Cheng Z. Location prediction in social media based on tie strength. In: 22nd ACM International Conference on Information and Knowledge Management; 2013 Oct 27–Nov 1; San Francisco, CA, USA. p. 459–68. [Google Scholar]
25. Compton R, Jurgens D, Allen D. Geotagging one hundred million Twitter accounts with total variation minimization. In: 2014 IEEE International Conference on Big Data (Big Data); 2014 Oct 27–30; Washington DC, USA. p. 393–401. [Google Scholar]
26. Rahimi A, Cohn T, Baldwin T. Semi-supervised user geolocation via graph convolutional networks. In: Proceedings of the 56th Annual Meeting of the Association for Computational Linguistics; 2018 Jul 15–20; Melbourne, Australia. p. 2009–19. [Google Scholar]
27. Kipf TN, Welling M. Semi-supervised classification with graph convolutional networks. In: 5th International Conference on Learning Representations; 2017 Apr 24–26; ICLR 2017, Toulon, France. [Google Scholar]
28. Kothari R, Jain V. Learning from labeled and unlabeled data. In: Proceedings of the 2002 International Joint Conference on Neural Networks (Cat. No. 02CH37290); 2002; Honolulu, HI, USA. p. 2803–8. [Google Scholar]
29. Perozzi B, Al-Rfou R, Skiena S. DeepWalk: online learning of social representations. In: The 20th ACM SIGKDD International Conference on Knowledge Discovery and Data Mining; 2014 Aug 24–27; New York, NY. ACM; p. 701–10. [Google Scholar]
30. Mikolov T, Chen K, Corrado G, Dean J. Efficient estimation of word representations in vector space. In: Bengio, Y, LeCun Y. 1st International Conference on Learning Representations; 2013 May 2–4; Scottsdale, Arizona, USA. [Google Scholar]
31. Grover A, Leskovec J. node2vec: Scalable feature learning for networks. In: Proceedings of the 22nd ACM SIGKDD International Conference on Knowledge Discovery and Data Mining; 2016; New York, NY, USA: Association for Computing Machinery. p. 855–64. [Google Scholar]
32. Ju W, Fang Z, Gu Y, Liu Z, Long Q, Qiao Z, et al. A comprehensive survey on deep graph representation learning. Neural Netw. 2024;173:106207. doi:10.1016/j.neunet.2024.106207. [Google Scholar] [PubMed] [CrossRef]
33. Velickovic P, Cucurull G, Casanova A, Romero A, Lio’ P, Bengio Y. Graph attention networks. In: 6th International Conference on Learning Representations; 2018 Apr 30–May 3; Vancouver, BC, Canada. [Google Scholar]
34. Bahdanau D, Cho K, Bengio Y. Neural machine translation by jointly learning to align and translate. In: Bengio, Y, LeCun Y. 3rd International Conference on Learning Representations; 2015 May 7–9; San Diego, CA, USA. [Google Scholar]
35. Zeng H, Zhou H, Srivastava A, Kannan R, Prasanna VK. Graphsaint: graph sampling based inductive learning method. In: 8th International Conference on Learning Representations;2020 Apr 26–30; Addis Ababa, Ethiopia. [Google Scholar]
36. Klicpera J, Bojchevski A, Günnemann S. Predict then propagate: graph neural networks meet personalized PageRank. In: 7th International Conference on Learning Representations; 2019 May 6–9; New Orleans, LA, USA. [Google Scholar]
37. Ester M, Kriegel HP, Sander J, Xu X. A density-based algorithm for discovering clusters in large spatial databases with noise. In: Proceedings of the Second International Conference on Knowledge Discovery and Data Mining (KDD-96); 1996; Portland, Oregon, USA. [Google Scholar]
38. Han B, Cook P, Baldwin T. Geolocation prediction in social media data by finding location indicative words. In: Proceedings of COLING 2012 Dec 8–15; Mumbai, India. p. 1045–62. [Google Scholar]
Cite This Article
 Copyright © 2024 The Author(s). Published by Tech Science Press.
This work is licensed under a Creative Commons Attribution 4.0 International License , which permits unrestricted use, distribution, and reproduction in any medium, provided the original work is properly cited.
 Downloads
 Citation Tools