
 Submit a Paper
 Propose a Special lssue
 Open Access
ARTICLE

Contrast Normalization Strategies in Brain Tumor Imaging: From Preprocessing to Classification
1 Department of Information Systems, College of Computer Science and Information Systems, Najran University, Najran, 61441, Saudi Arabia
2 Department of Electronic Engineering, The University of Larkano, Larkana, Sindh, 75660, Pakistan
3 Computer Science Department, Sukkur IBA University, Sukkur, Sindh, 65200, Pakistan
4 Eletrical Engineering Department, Sukkur IBA University, Sukkur, Sindh, 65200, Pakistan
5 Electrical Engineering Department, College of Engineering, Najran University, Najran, 61441, Saudi Arabia
6 Radiological Sciences Department, College of Applied Medical Sciences, Najran University, Najran, 61441, Saudi Arabia
* Corresponding Author: Toufique A. Soomro. Email:
Computer Modeling in Engineering & Sciences 2024, 140(2), 1539-1562. https://doi.org/10.32604/cmes.2024.051475
Received 06 March 2024; Accepted 15 April 2024; Issue published 20 May 2024
 View Full Text
 Download PDF
Abstract
Cancer-related to the nervous system and brain tumors is a leading cause of mortality in various countries. Magnetic resonance imaging (MRI) and computed tomography (CT) are utilized to capture brain images. MRI plays a crucial role in the diagnosis of brain tumors and the examination of other brain disorders. Typically, manual assessment of MRI images by radiologists or experts is performed to identify brain tumors and abnormalities in the early stages for timely intervention. However, early diagnosis of brain tumors is intricate, necessitating the use of computerized methods. This research introduces an innovative approach for the automated segmentation of brain tumors and a framework for classifying different regions of brain tumors. The proposed methods consist of a pipeline with several stages: preprocessing of brain images with noise removal based on Wiener Filtering, enhancing the brain using Principal Component Analysis (PCA) to obtain well-enhanced images, and then segmenting the region of interest using the Fuzzy C-Means (FCM) clustering technique in the third step. The final step involves classification using the Support Vector Machine (SVM) classifier. The classifier is applied to various types of brain tumors, such as meningioma and pituitary tumors, utilizing the Contrast-Enhanced Magnetic Resonance Imaging (CE-MRI) database. The proposed method demonstrates significantly improved contrast and validates the effectiveness of the classification framework, achieving an average sensitivity of 0.974, specificity of 0.976, accuracy of 0.979, and a Dice Score (DSC) of 0.957. Additionally, this method exhibits a shorter processing time of 0.44 s compared to existing approaches. The performance of this method emphasizes its significance when compared to state-of-the-art methods in terms of sensitivity, specificity, accuracy, and DSC. To enhance the method further in the future, it is feasible to standardize the approach by incorporating a set of classifiers to increase the robustness of the brain classification method.Graphic Abstract
Keywords
In the realm of e-health, professionals strive to improve healthcare efficiency through the integration of digital medical technology. Magnetic Resonance Imaging (MRI) poses complex challenges in this context, particularly when examining the brain [1], it is highly intricate organ that governs the functions of billions of cells [2]. The development of brain tumors, characterized by the uncontrolled growth of abnormal cells within the brain, can severely disrupt normal brain functions [3], causing a significant impact on the patient’s well-being [4]. Computerized techniques offer a promising early brain tumor detection solution to address this issue. These techniques excel in identifying abnormal regions in brain MRI scans, relying on image segmentation and classification methods [5]. The extraction of components such as gray matter, white matter, and cerebrospinal fluid plays a crucial role, and image segmentation techniques, as highlighted by studies [6,7], prove invaluable in achieving precise extraction. Researchers commonly utilize brain MRI images to identify and facilitate the treatment of abnormalities, emphasizing the importance of acquiring high-quality images for a comprehensive understanding of brain structure and associated cell anomalies [2,8].
While various techniques are employed for imaging the brain, magnetic resonance imaging (MRI) is a more robust and effective option than computed tomography (CT). Although brain CT scans may offer superior contrast, they often suffer from noise, limiting the radiologist’s ability to assess medical images thoroughly [9]. Fig. 1 visually compares CT and MRI brain images [10,11]. Notably, CT images of the brain reveal hypodensity in the right frontal lobe. In contrast, T1 and T2 weighted MRI scans also show lesion hypointensity but with reduced noise, providing a superior representation. Brain tumors present diverse classifications based on behavior and therapeutic considerations, and effective management helps minimize the need for biopsies by accurately categorizing them as benign or malignant [12,13].
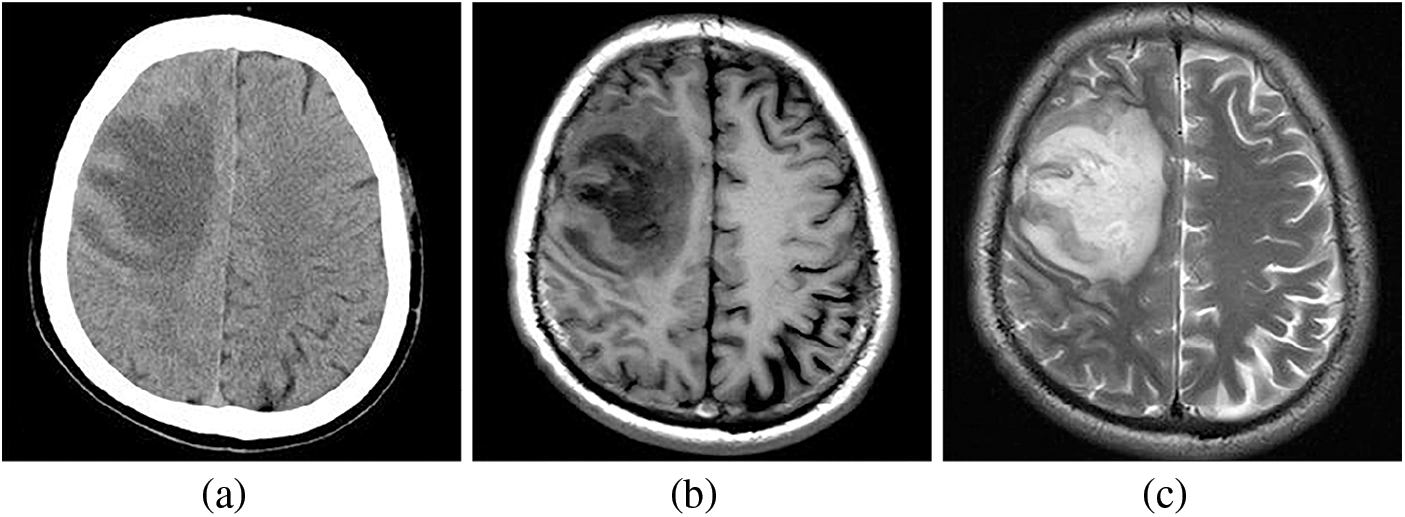
Figure 1: Comparing the CT and MRI images of the brain, (a) displays hypodensity in the right frontal lobe on the brain CT images. Additionally, (b) and (c), representing T1 and T2 weighted MRI images, respectively, reveal hypointensity in the lesion with reduced noise, providing a clearer and more accurate image representation
Various techniques are utilized in the identification of brain tumors within MRI images. Clustering methods, including color-based and histogram techniques, play a pivotal role in refining the precision of tumor detection. Following this, classifiers are deployed to differentiate between normal and abnormal tumor regions, with neural network-based classifiers prominently fulfilling this role [14,15]. Deep learning is pivotal in medical imaging for its capacity to efficiently and accurately analyze complex data. Specifically, in the realm of brain tumor detection, deep learning algorithms are instrumental in automatically identifying and categorizing abnormalities in medical images like MRI scans. By leveraging vast datasets, these algorithms can discern subtle patterns indicative of brain tumors, enabling earlier and more precise diagnoses. Techniques such as convolutional neural networks (CNNs) allow deep learning models to extract relevant features from images, assisting clinicians in making timely treatment decisions and improving patient outcomes. However, challenges persist, including the need for extensively annotated datasets, susceptibility to overfitting, and issues regarding the interpretability of deep learning algorithms. Despite these limitations, ongoing research endeavors are dedicated to overcoming these challenges and further refining the efficacy of deep learning in medical imaging [16]. However, these segmentation and classification approaches possess inherent limitations, encompassing reduced accuracy, noise, contrast variations, intensity irregularities, computational complexity, intricacies in feature selection, and time-consuming processes [17,18]. In response to these challenges, we propose a novel approach that focuses on image denoising and aims to enhance overall detection performance, thereby addressing the aforementioned limitations and advancing the accuracy of tumor detection.
The article’s uniqueness lies in its introduction of a groundbreaking framework designed for the automated segmentation and classification of brain tumors within MRI images. This framework stands out by incorporating specialized algorithms and techniques, subjecting itself to a rigorous evaluation using pertinent datasets, and ultimately showcasing superior performance compared to established approaches. The key contributions of this research are multifaceted. First, it introduces an automated segmentation pipeline with multiple sequential stages, commencing with preprocessing steps that utilize techniques like Principal Component Analysis (PCA) to enhance and consolidate MRI brain images for subsequent segmentation and classification. The Fuzzy C-Mean (FCM) algorithm takes a prominent role within this pipeline, effectively segmenting abnormal regions in brain images and is recognized for its proficiency in delineating structures in medical images.
Additionally, the framework leverages a Support Vector Machine (SVM) classifier for categorizing brain tumor regions, benefiting from SVMs’ acclaimed capacity to handle intricate classification tasks. The evaluation of this framework is comprehensive, utilizing a Contrast-Enhanced Magnetic Resonance Imaging (CE-MRI) database that includes a diverse array of brain tumors, such as meningioma and pituitary tumors. This thorough assessment substantiates its efficacy across various tumor types and facilitates comparisons with alternative classifiers and methods. The results generated by the proposed pipeline exhibit superior contrast and efficiency compared to existing methodologies, achieving remarkable average sensitivity, specificity, accuracy, and Dice Score (DSC), affirming its proficiency in precisely identifying and classifying brain tumor regions. Notably, the proposed method demonstrates a significantly shorter processing time of merely 0.45 s, a crucial consideration for practical implementation in clinical settings where prompt diagnosis is essential.
This research focuses on brain tumor segmentation and subsequent classification based on MRI images. Analyzing these images is challenging due to the inherent processing issues in computerized brain MRI images. The proposed methodology addresses this challenge through four distinct stages. The initial stage involves preprocessing brain MRI images, including noise elimination using Wiener filtering. The second stage focuses on harmonizing the images to ensure consistency in contrast between foreground and background elements, achieved through Principal Component Analysis (PCA) to address non-coherent regions. The third stage is segmenting abnormal or tumor regions, employing the Fuzzy C-Means (FCM) segmentation process. The final stage involves the classification of identified brain tumors, employing the Support Vector Machine (SVM) with all stages utilizing innovative image-processing techniques.
The segmentation and accurate classification of brain tumor regions present a significant challenge, given the myriad methodologies proposed for brain tumor detection within brain MRI images [2]. In recent literature, various methods have been introduced to address this challenge. Ratna et al. presented a computerized approach relying on the Harmony Search Algorithm (HCS) optimization technique to train a multi-class Support Vector Neural Network (SVNN) [19]. This method incorporated the Bayesian fuzzy clustering technique for automatic tumor identification in MRI images. Despite its success on the Brain Tumor Segmentation (BRATS) dataset, the exclusive focus on this dataset limits its generalizability to other datasets [19].
Similarly, Logeswari et al. and Lather et al. proposed techniques utilizing Bayesian fuzzy clustering in conjunction with the HCS optimization algorithm for brain tumor detection in MRI images [20,21]. These HCS optimization algorithms demonstrated superiority in certain contexts [22]. However, their applicability is constrained to a specific set of images from the Brain Tumor Segmentation (BraTS) database, limiting direct transferability to other databases [2].
Yin et al. structured their method around background correction, abnormal region segmentation, and brain tumor classification, incorporating a multilayered perception neural system and whale optimization algorithms rooted in disarray hypothesis and procedural base mapping [23]. While this approach did not significantly enhance accuracy, it added diversity to the existing methodologies.
Alagarsamy et al. introduced Brain Image Segmentation Technique-Interval Type-2 Fuzzy C-Means (BAT-IT2FCM), an enhanced brain image segmentation technique utilizing Bat Algorithm and Interval Type-2 Fuzzy C-Means clustering [24]. Although it improved accuracy, its reliance on threshold factors and extended processing time are noteworthy limitations.
Kumar et al. proposed the Weighted Correlation Feature Selection Based Iterative Bayesian Multivariate Deep Neural Learning (WCFS-IBMDNL) method, employing Weighted Correlation Feature Selection-Based Iterative Bayesian Multivariate Deep Neural Learning for early-stage brain tumor analysis [25]. Despite its potential, using the Iterative Bayesian Multivariate Deep Neural Network (IBMDNN) classifier led to false pixel detection, diminishing overall accuracy.
Ozyurt et al. implemented the Neutrosophy and Convolutional Neural Network (NS-CNN) hybrid approach, combining Neutrosophy with Convolutional Neural Network for tumor region characterization in brain images [26]. While demonstrating enhanced accuracy, the inconsistency in the CNN structure affected overall performance. Selvapandian et al. utilized the non-subsampled contourlet transform (NSCT) for brain image enhancement and tumor extraction, employing Adaptive Neuro-Fuzzy Inference System (ANFIS) for classification [27]. However, its satisfactory results were limited to the BRATS dataset.
Sharma et al. introduced a hybrid approach combining the k-means algorithm with Artificial Neural Networks (ANN) for brain tumor detection, utilizing the Gray-Level Co-Occurrence Matrix (GLCM) for feature extraction [28]. Despite improved performance, occasional false pixel detection poses a challenge, especially in smaller tumors.
Varuna Shree et al. based their brain tumor detection on Discrete Wavelet Transformation (DWT) and Probabilistic Neural Networks (PNN), improving performance and simplifying tumor segmentation complexity [29]. A two-phase multidimensional approach achieved 99.55% accuracy, utilizing Convolutional Neural Networks (CNNs) for preprocessing and feature selection and Error-Correcting Output Codes Support Vector Machines (ECOCSVM) for classification [30]. Another study employed SVM and Otsu thresholding for brain tumor classification, with identified accuracy improvement opportunities [31]. Molina-Torres addressed this by employing a kernel SVM approach with the Gaussian Radial Basis (GRB) kernel, focusing on specificity, precision, and accuracy [32].
Despite substantial efforts in brain tumor detection research, limitations persist, highlighting the need for a novel algorithm leveraging MR images to enhance accuracy and reliability. Particularly, improvements in preprocessing are warranted for enhanced performance. The following section delves into the proposed methodology.
Medical imaging leans towards utilizing brain MRI scans owing to their non-invasive quality, devoid of radiation hazards, ensuring safety. MRI scans excel in providing multi-dimensional analysis, surpassing alternatives like CT scans and X-rays. Although manual segmentation for brain tumor delineation in MRI images is laborious and prone to inaccuracies, this research introduces a unique five-step computerized method for precise classification and segmentation in brain tumor detection using MRI images.
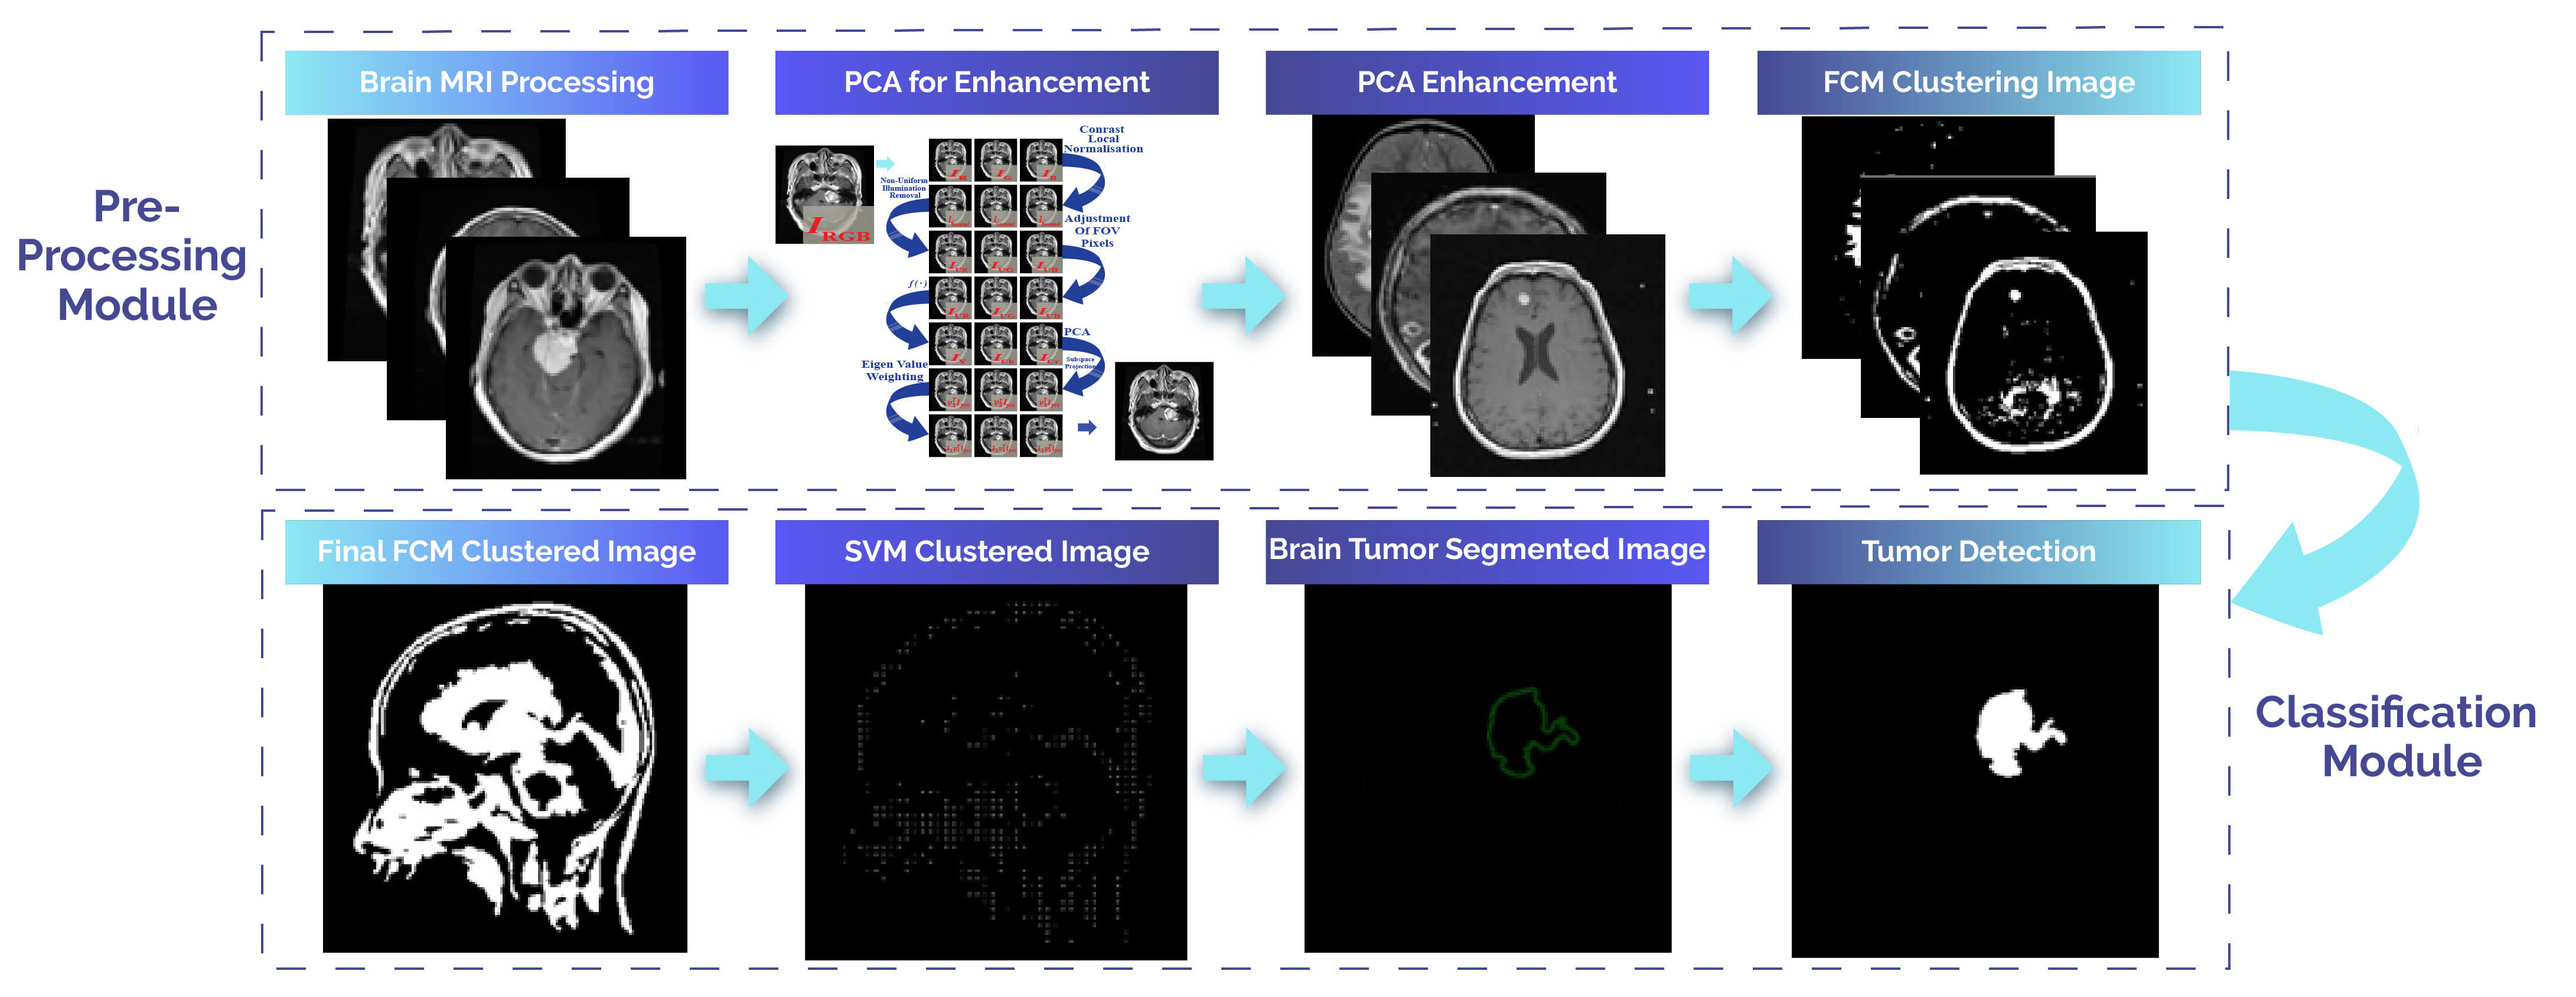
This technique mainly aims to identify tumor regions in brain MRI scans. As depicted in Fig. 2, this proposed computer-based approach is devised to identify abnormal findings in brain MRI images. It relies on consistent contrast and involves classification and segmentation tasks for brain tumor detection. The method unfolds in four steps, with the first two being part of the preprocessing stage. The initial step focuses on processing brain MRI images, and the second step aims to enhance and eliminate noise from the MRI data. The subsequent two steps constitute the post-processing stage. In the third step, brain tumors are binary segmented using the FCM method, while the fourth step employs a support vector machine classifier for brain tumor classification. This integrated algorithm is acknowledged as an automated solution for detecting brain tumors in MRI images.
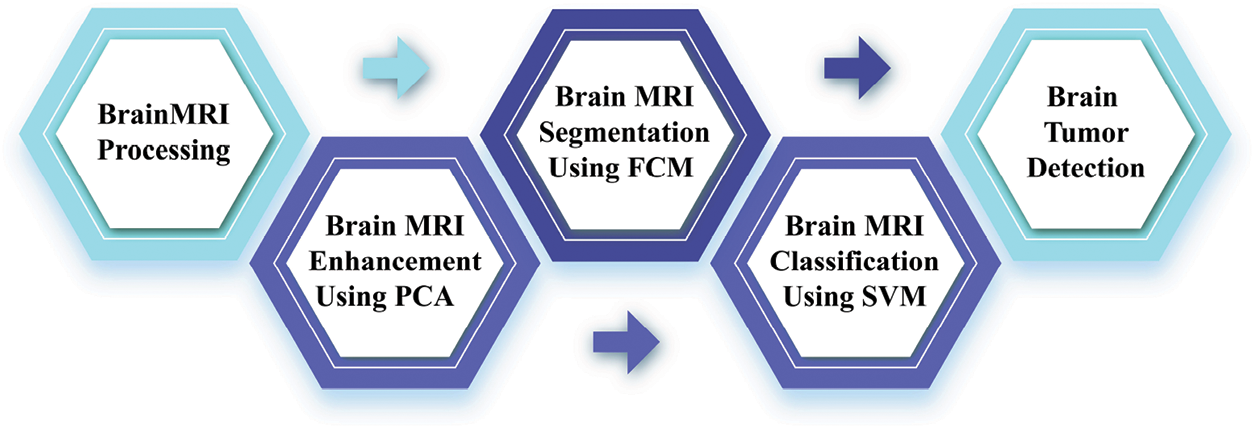
Figure 2: The proposed approach outlines procedures for segmenting and classifying images of brain MRI
3.1 Pre-Processing Step: Noise Removal and Enhancement
The processing of brain MRI images is a pivotal component of the pre-processing phase in our proposed method. In this phase, the emphasis is on enhancing the quality of brain MRI data and reducing noise levels through image processing. The study involved processing MRI scans from three different planes: axial, sagittal, and coronal, these are obtained from the CE-MRI database, as depicted in the accompanying Fig. 3.
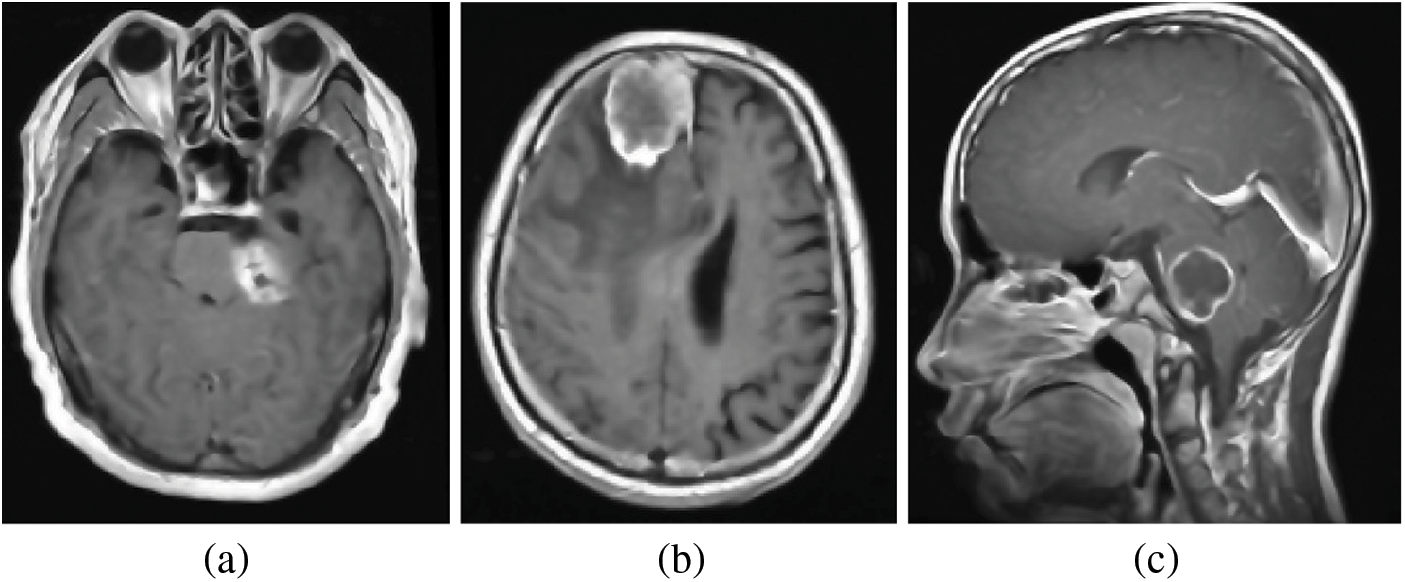
Figure 3: Brain MRI scans from various perspectives: (a) Axial View, (b) Sagittal View, and (c) Coronal Views
Medical imaging, particularly Magnetic Resonance Imaging (MRI), has transformed the landscape of diagnosing and treating neurological disorders. While MRI is extensively employed, the diagnostic accuracy of brain MRI images can be compromised by the presence of noise and artifacts. This study delves into utilizing Principal Component Analysis (PCA) as a powerful enhancement technique to effectively tackle the issues arising from noise and artifacts in brain MRI images. The subsequent sections provide a detailed mathematical exposition of the application of PCA to enhance brain MRI images.
In a database denoted as X, comprising N observations and D features, PCA is employed to identify the principal components by decomposing the covariance matrix:
The principal components contains the eigenvectors
The final well-contrasted gray image
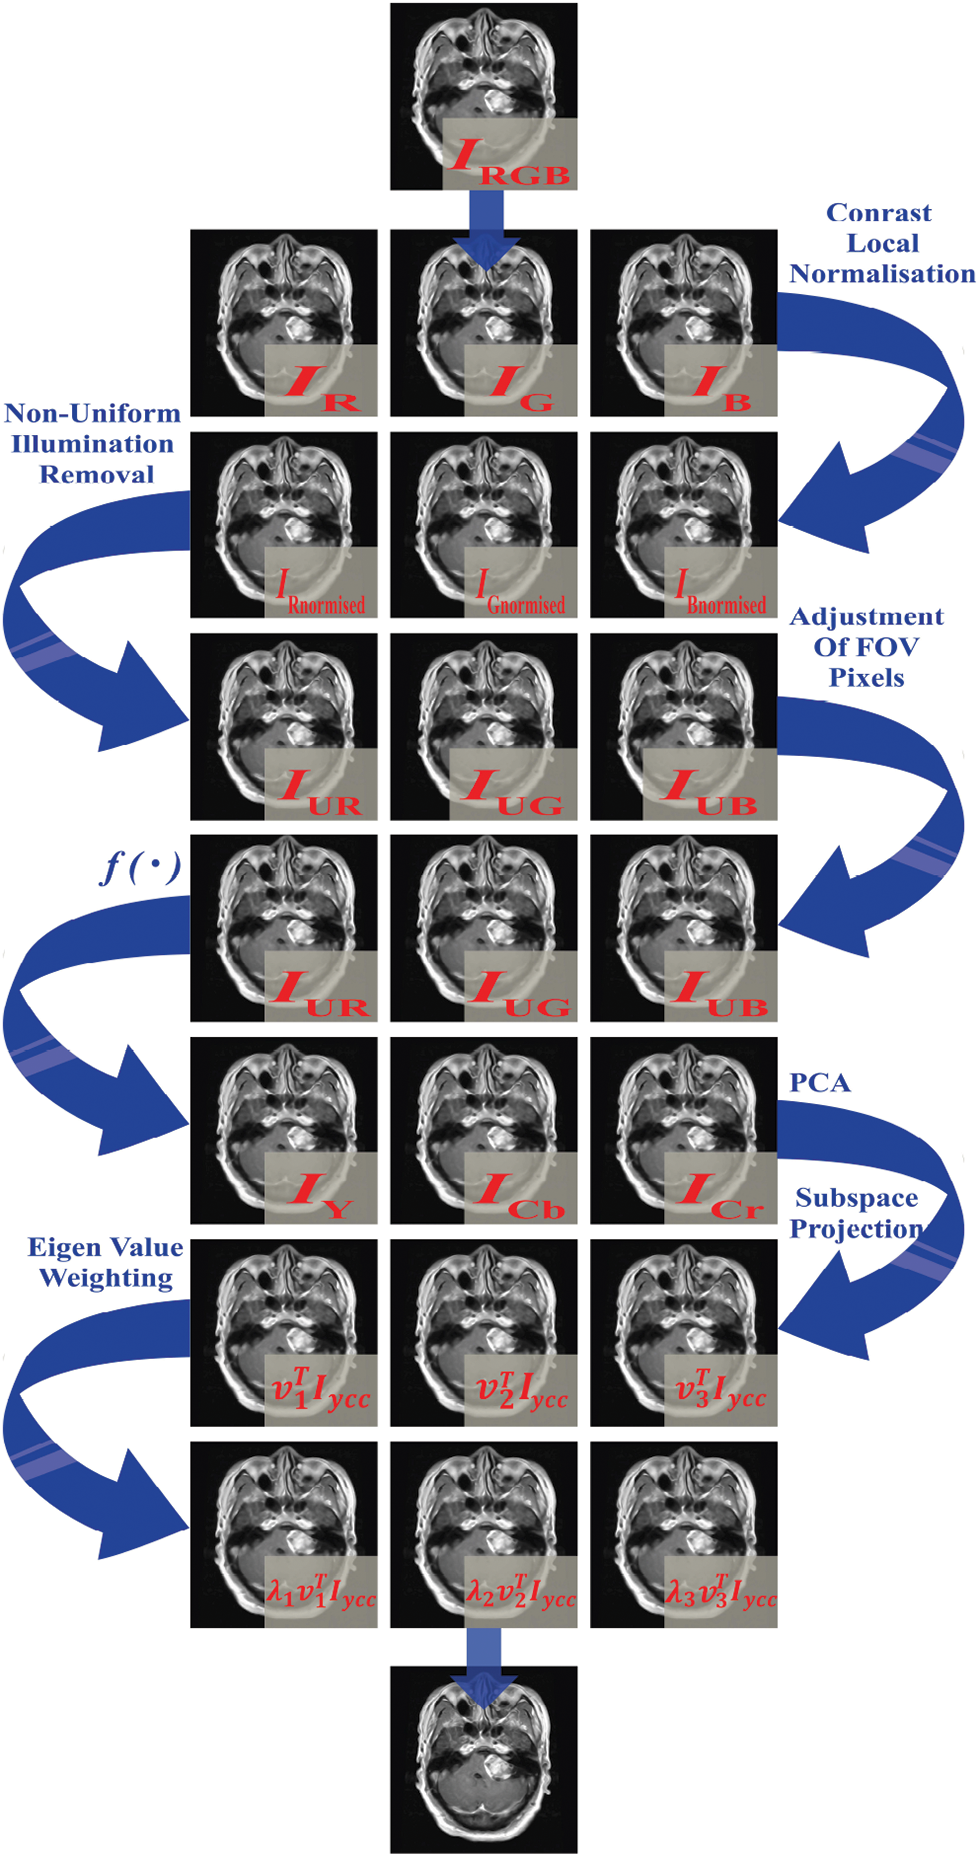
Figure 4: Illustration of PCA process to enhance details in the resulting well-contrasted images of brain MRI planes
Enhanced images through PCA contribute to enhanced diagnostic accuracy by mitigating noise and highlighting pertinent features. Additionally, the expedited processing of brain MRI images is facilitated by dimensionality reduction, where computations are executed on a condensed set of principal components. The application of PCA not only accelerates segmentation and classification processes but also aids in reducing storage needs through data compression, resulting in faster image transmission. This capability proves essential for optimizing the efficiency of healthcare workflows.
3.2 Post-Processing: Segmentation of Brain Tumor Region Based on FCM
The utilization of Fuzzy C-means (FCM) segmentation plays a crucial role in extracting brain tumor regions from MRI images. This method is pivotal in generating an initial binary representation of the brain MRI images, laying the groundwork for subsequent analysis and classification. FCM assigns pixels to multiple classes, each associated with a membership function level ranging from 0 to 1. The objective of FCM is to identify cluster centers that optimally represent the pixel distribution within the image. In mathematical terms, the FCM model can be formulated as follows.
In a collection of brain MRI images, denote the image domain as X. Each pixel
In Eq. (2), the objective function
1. Initialization: Commence with an initial estimation of cluster centers
2. Membership Calculation: Compute the membership values
3. Update Cluster Centers: Recalculate the cluster centers
4. Convergence Check: Assess whether the algorithm has reached convergence. If not, iterate through steps 2 and 3.
5. Upon achieving convergence, conclude the algorithm, providing the cluster centers
6. The algorithm iteratively updates the cluster centers (as shown in Eq. (3)) and membership degrees (as shown in Eq. (4)) until convergence. The update equations are as follows:
In the context of brain MRI images, FCM is employed to identify the actual pixels belonging to the tumor region. This pre-processing step is pivotal in improving the accuracy of subsequent classification methods, such as Support Vector Machine (SVM). By accurately delineating the tumor region through FCM, SVM can then effectively classify it. The FCM model essentially seeks to find the best cluster centers that represent the pixel distribution within the brain MRI images, with the goal of accurately segmenting the tumor regions. Specifically, the SVM classifier operates on features extracted from the segmented regions (FCM Output), particularly from the cluster 2 output image. Both the FCM cluster 1 output and cluster 2 output are depicted in the Fig. 5 as segmented images. The segmented images serve as the SVM classifier’s input, contributing to the accurate detection of the brain tumor region.
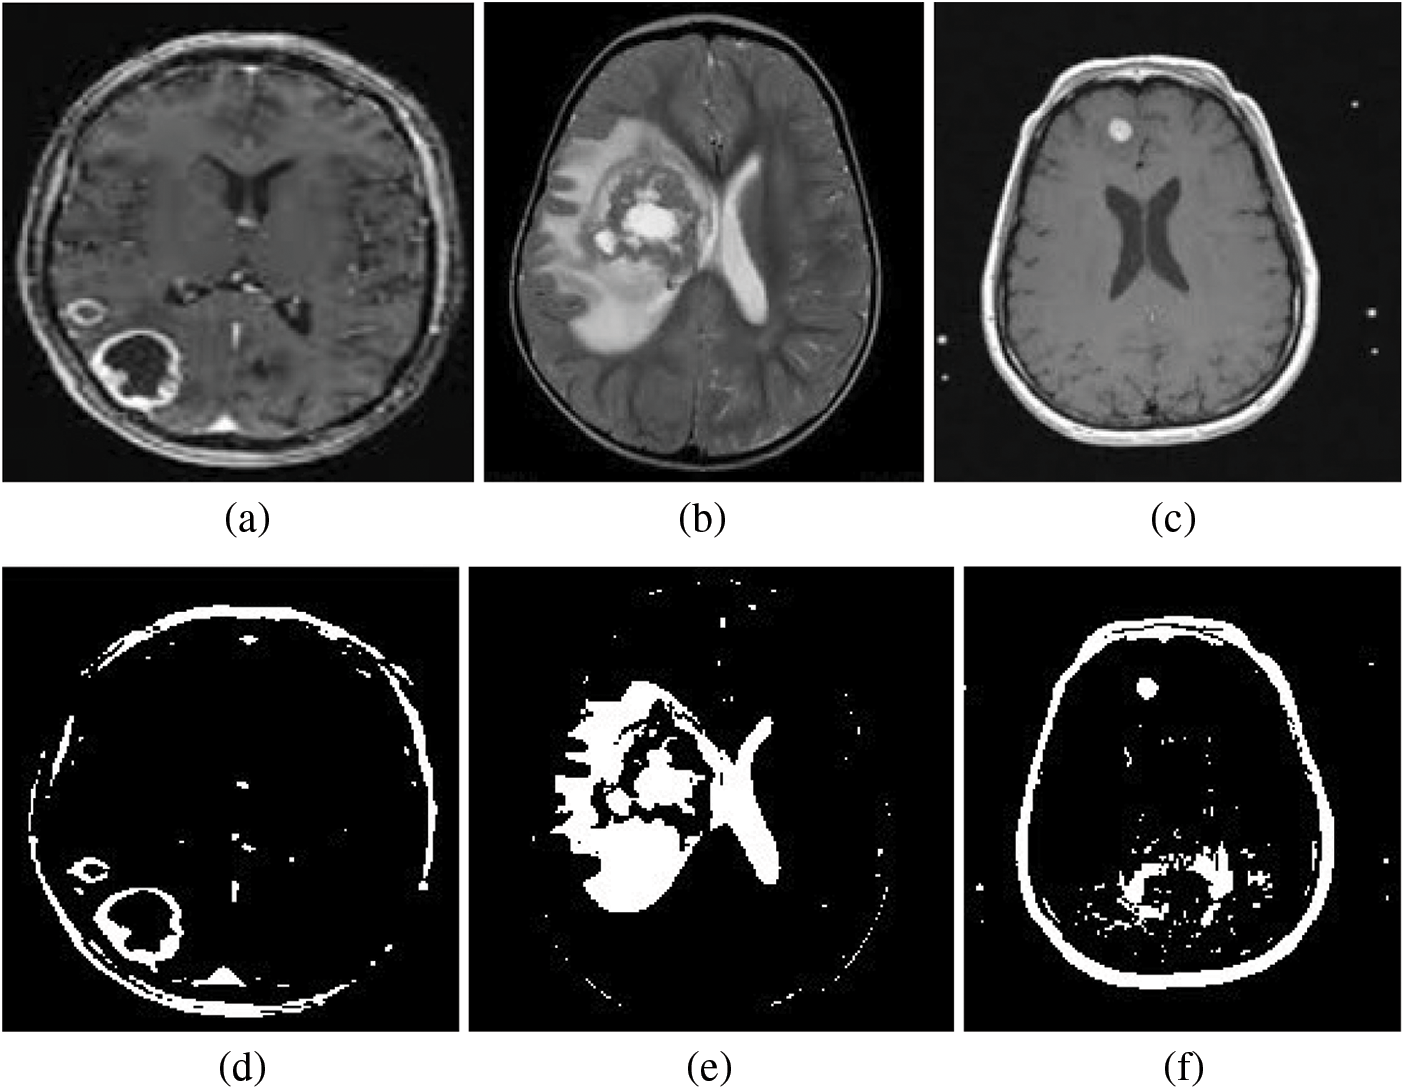
Figure 5: Segmentation results from the Fuzzy C-Means (FCM) algorithm are depicted, with Row 01 contains (a–c) illustrating the cluster 1 output and Row 02 contains (d–f) representing the cluster 2 output. The segmented 2 image, serving as the input to the Support Vector Machine (SVM) classifier, plays a pivotal role in achieving the accurate detection of the brain tumor region
3.3 Brain Tumor Classification
The final stage in our proposed approach involves the application of the Support Vector Machine (SVM) to classify brain tumors. SVM, a supervised learning method rooted in statistical learning theory, is employed for data classification [34]. Initially, data labeling is imperative for constructing the training dataset, denoted as
where:
•
•
The hinge loss exhibits the following traits:
1. If the data point is correctly classified
2. In cases of misclassification where the data point falls on the correct side of the decision margin
3. For misclassification where the data point lies on the incorrect side of the decision margin
In brain MRI images, the hinge loss plays a crucial role in determining an optimal hyperplane for distinguishing between various classes of brain images, such as normal vs. abnormal or tumor regions. Its minimization guides the Support Vector Machine (SVM) in adjusting its hyperplane to balance maximizing the margin between classes and minimizing misclassifications. The hinge loss is a guiding principle during SVM training, imposing penalties for misclassifications and playing a key role in learning an effective decision boundary for binary classification tasks, including brain MRI images. The overall SVM process, depicted in Fig. 6, aims to establish a functional relationship between sample labels and data classification, facilitating precise brain tumor detection. The decision function, a fundamental component of the SVM classification’s feed-forward process, is expressed mathematically as follows:
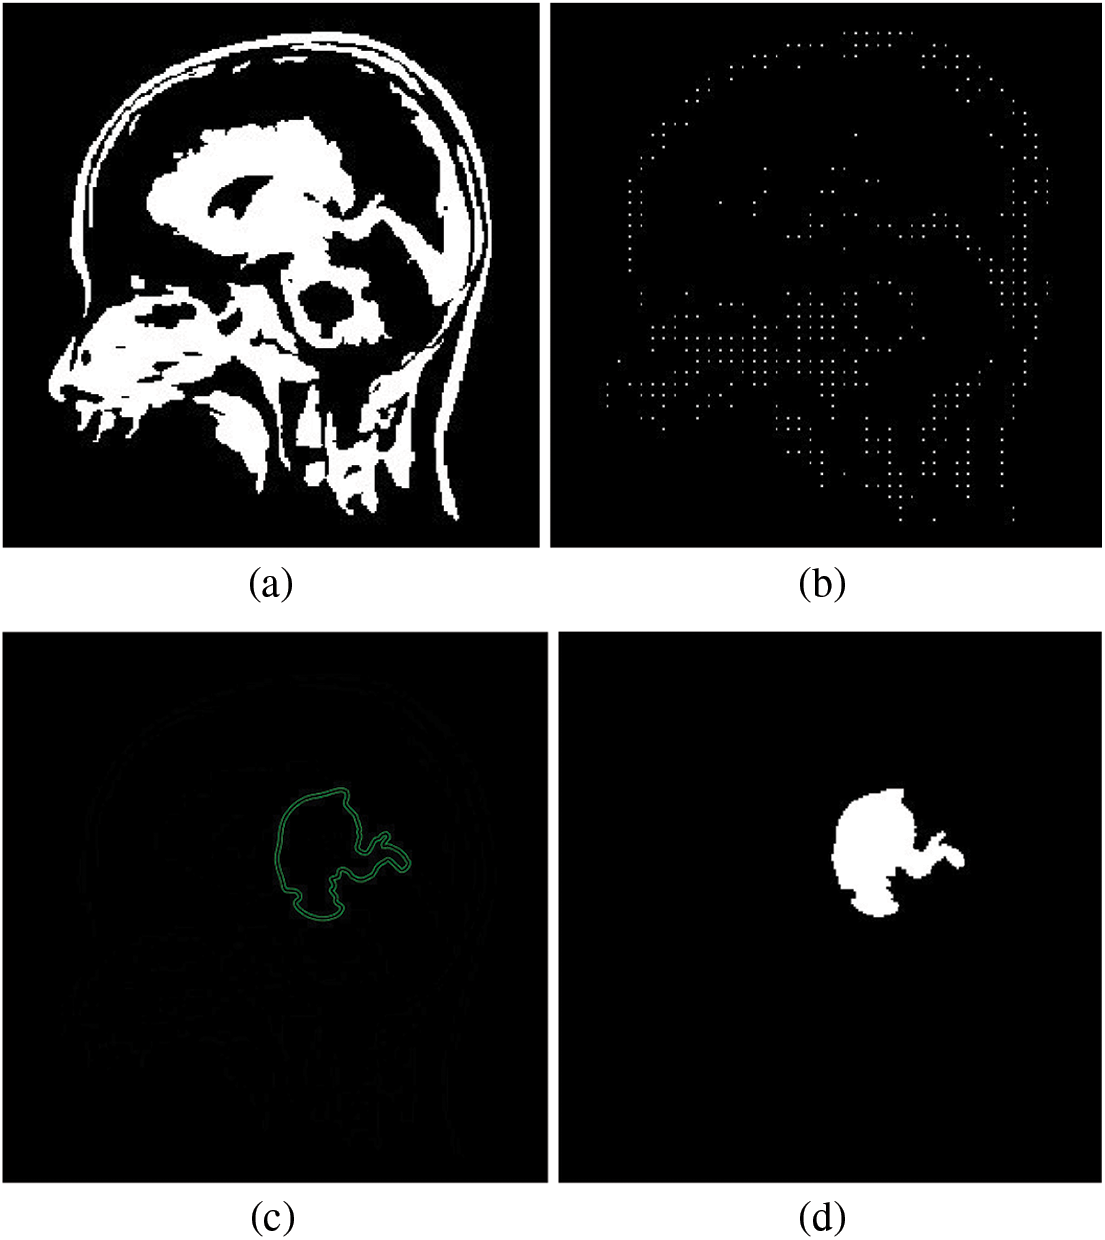
Figure 6: Workflow of the SVM-based classifier for brain tumor detection. (a) Binary representation of a brain image. (b) Skeletonized image. (c) Application of the SVM classifier to the brain image. (d) Identification of brain tumor regions
In Eq. (6),
The feature vector is constructed by consolidating data into an array preparing it for database processing to facilitate object classification. In brain tumor images, the process initiates with the conversion of the image into a binary representation, as illustrated in Fig. 6a. Subsequently, the binary image undergoes skeletonization, as demonstrated in Fig. 6b. This processed image is segmented into zones and areas, ultimately amalgamating to form the image matrix. The resulting feature vector depends on various parameters, including Euler numbers and pixel distributions across the
The proposed algorithm excels in precisely identifying brain tumors while effectively addressing inherent challenges within brain MRI images. The sequential steps of the algorithm.
• Preprocessing with Wiener Filtering: Wiener filtering is a technique used to reduce noise in images by estimating the original image from its noisy version. In this step, brain images are preprocessed to remove noise using Wiener filtering. This process helps to improve the quality of the images and ensures that subsequent analysis steps are not adversely affected by noise artifacts.
• Brain Enhancement with Principal Component Analysis (PCA): In this step, PCA is applied to enhance the brain images obtained after noise removal. By identifying and emphasizing the principal components of variation in the images, PCA helps to highlight relevant features and improve the overall contrast and clarity of the brain structures, and give the well enhanced image by converting the RGB images of brain MRI into single well contrasted image.
• Region Segmentation with Fuzzy C-Means (FCM) Clustering: Fuzzy C-Means (FCM) clustering is a method used for image segmentation, where pixels in the image are grouped into clusters based on similarity in intensity values. Unlike traditional clustering methods, FCM allows pixels to belong to multiple clusters with varying degrees of membership. In this step, FCM is employed to segment the region of interest in the brain images, specifically targeting the areas corresponding to brain tumors. This segmentation process helps to delineate the boundaries of the tumors for further analysis.
• Region Classification Using Support Vector Machine (SVM) Classifier: Support Vector Machine (SVM) is a supervised learning algorithm used for classification tasks. In this final step, the segmented regions obtained from the previous step are classified into different categories using an SVM classifier. The classifier is trained on a dataset containing labeled examples of different regions of brain tumors, allowing it to learn patterns and relationships between features that distinguish between these regions. Once trained, the SVM classifier can accurately classify new regions of brain tumors based on their features, providing valuable information for diagnosis and treatment planning.
This pipeline presents an innovative approach for automated brain tumor segmentation and classification, incorporating techniques such as Wiener filtering for noise removal, PCA for image enhancement, FCM clustering for segmentation, and SVM classification for region classification. By combining these methods into a cohesive framework, the algorithm aims to accurately identify and classify different regions of brain tumors in MRI images, facilitating improved diagnosis and treatment decision-making.
4 Database and Parameters Measurement
The suggested methodology undergoes a thorough assessment, addressing the segmentation and classification of brain tumor regions. The evaluation of segmentation performance involves scrutinizing six crucial parameters: mean, standard deviation, contrast, entropy, kurtosis, and skewness. Simultaneously, the classification of brain tumors is appraised with a focus on sensitivity, specificity, and accuracy.
4.1 Parameter Evaluation: Brain Tumor Segmentation
The segmentation outcomes are evaluated based on six specific parameters: mean, standard deviation, contrast, entropy, kurtosis, and skewness. Further details on the definitions and significance of these parameters can be referenced in [35].
4.2 Parameter Assessment: Brain Tumor Classification
For the classification parameters, evaluations were conducted on training and testing datasets using cross-validation, a widely adopted technique for validating classification model performance. The assessment of the classification model involved the calculation of the following parameters.
Sensitivity (SN), also known as True Positive Rate (TPR) or Recall, is a crucial metric assessing the model’s accuracy in correctly identifying positive instances. In the context of brain MRI images, it evaluates the model’s capability to accurately detect genuine brain MRI pixels. Mathematically, sensitivity is calculated as follows:
Sensitivity plays a vital role in evaluating the performance of a classification model, particularly in medical imaging tasks like brain MRI analysis. It is based on the confusion matrix’s True Positives (TP) and False Negatives (FN) components. TP represents correctly identified actual positive cases, such as diseased brain MRI images, while FN represents instances where the model misses actual positive cases. Higher sensitivity indicates the model’s proficiency in accurately detecting the condition, identifying a larger proportion of true positive cases. In medical imaging applications, such as identifying brain tumors in MRI images, elevated sensitivity enhances diagnostic accuracy and patient care by minimizing the chances of missing potential cases.
Specificity (SP), also known as True Negative Rate (TNR), is a vital metric in assessing classification model performance. In the context of brain MRI image analysis, specificity measures the model’s ability to identify negative instances, including false pixels accurately. The specificity calculation is expressed as:
In medical diagnosis, especially within brain MRI analysis, model performance is centered around True Negatives (TN), where the model accurately identifies non-cases, and False Positives (FP), where the model incorrectly categorizes non-cases as cases. Specificity is crucial in medical imaging, emphasizing the model’s effectiveness in accurately identifying negative instances and minimizing false positives. Higher specificity underscores the model’s proficiency in distinguishing instances without the condition, reducing false alarms, and maintaining diagnostic precision.
Accuracy (AC) is a fundamental metric for comprehensive classification model assessment, extending to applications involving brain MRI images. This metric quantifies the proportion of correctly predicted instances or pixels in the entire dataset. The accuracy formula is succinctly expressed as:
In brain MRI and medical diagnosis, TP represents correctly identified positive cases, TN denotes correctly identified negative cases, FP signifies negative cases incorrectly identified as positive, and FN represents positive cases incorrectly identified as negative. Elevated accuracy indicates the model’s adept and correct classification of a larger proportion of positive and negative pixels.
The Dice Score (DSC) is a metric illustrating the overlap between predicted output and true ground truth values. It normalizes true positive values against the mean of predicted and ground truth values with the mathematical representation:
A biological CE-MRI brain dataset is a compilation of images generated through contrast-enhanced magnetic resonance imaging (CE-MRI) techniques. These techniques enhance the visibility of biological structures by administering contrast agents during diagnostic procedures. Key points about CE-MRI datasets include:
1. CE-MRI datasets include various imaging protocols focusing on contrast-enhanced T1-weighted sequences. These sequences visualize and quantify the contrast agent distribution in tissues over time.
2. Clinical trials and research often utilize CE-MRI datasets stored in public repositories like The Cancer Imaging Archive (TCIA) and the Alzheimer’s Disease Neuroimaging Initiative (ADNI), alongside other imaging modalities.
3. These datasets typically feature 3D volumetric image sequences acquired at different time points, including pre-contrast images, dynamic post-contrast series, and additional sequences for anatomical reference.
4. In brain tumor imaging, CE-MRI is instrumental in evaluating tumors and delineating their boundaries, aiding in diagnosis, treatment planning, and response monitoring.
5. The dataset in question contains 3064 contrast-enhanced T1-weighted images obtained from 233 patients diagnosed with three different types of brain tumors: meningioma (708 slices), glioma (1426 slices), and pituitary tumors (930 slices) [36].
6. This dataset, called the CE-MRI Image Database [36], was compiled from Nanfang Hospital, Guangzhou, China, and General Hospital, Tianjin Medical University, China, from 2005 to 2010. It encompasses 3064 images from 233 patients, comprising 708 meningiomas, 1426 gliomas, and 930 pituitary tumors. These images have a resolution of
A biological CE-MRI brain dataset is characterized by images obtained through contrast-enhanced MRI techniques, providing valuable insights for research and development in brain tumor detection and analysis.
5 Results Analysis and Discussion
5.1 Analysis of Segmentation Module Performance
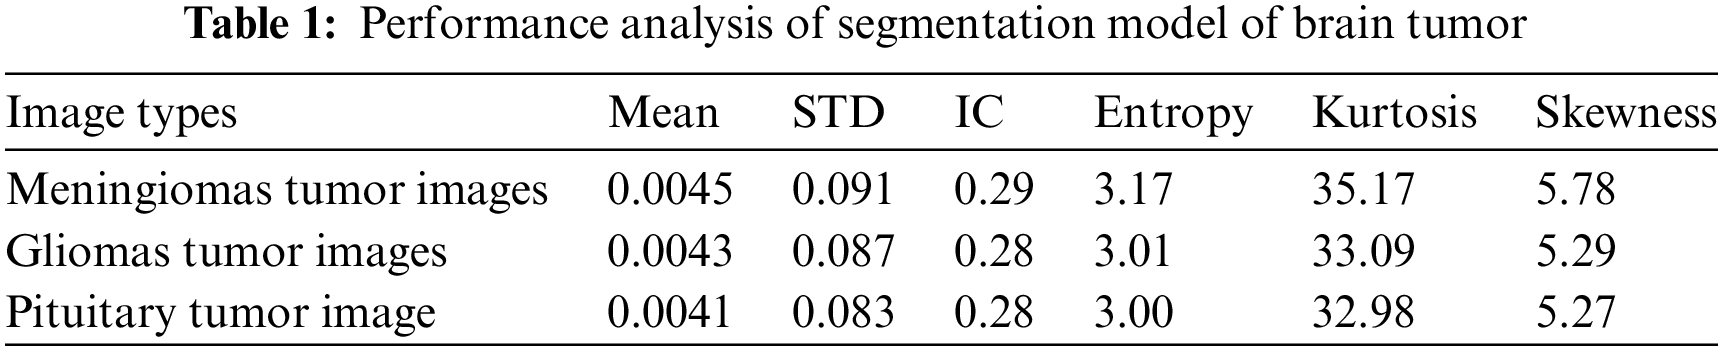
The brain tumor segmentation module’s performance is evaluated using the CE-MRI database, focusing on various parameters detailed in Table 1. These parameters indicate optimal regional contrast and contribute to accurate brain tumor segmentation. The comparative analysis of performance metrics in Table 1 across meningiomas, gliomas, and pituitary tumor images indicates consistent contrast enhancement, with mean image contrast (IC) values ranging from 0.28 to 0.29. Standard deviation (STD) values show minimal variation, reflecting consistent pixel intensity levels within each image type. Entropy values around 3.00 to 3.17 suggest comparable information content and randomness across tumor types. Higher kurtosis values for meningiomas indicate a more peaked pixel intensity distribution than gliomas and pituitary tumors. Skewness values follow a similar trend, with meningiomas exhibiting the highest skewness, suggesting a more pronounced tail on one side of the intensity distribution. Statistical analysis reveals minimal pixel misclassifications, ensuring precise tumor region segmentation.
In Fig. 7, the clear visualization of tumor detection underscores the effectiveness of the brain tumor detection process.
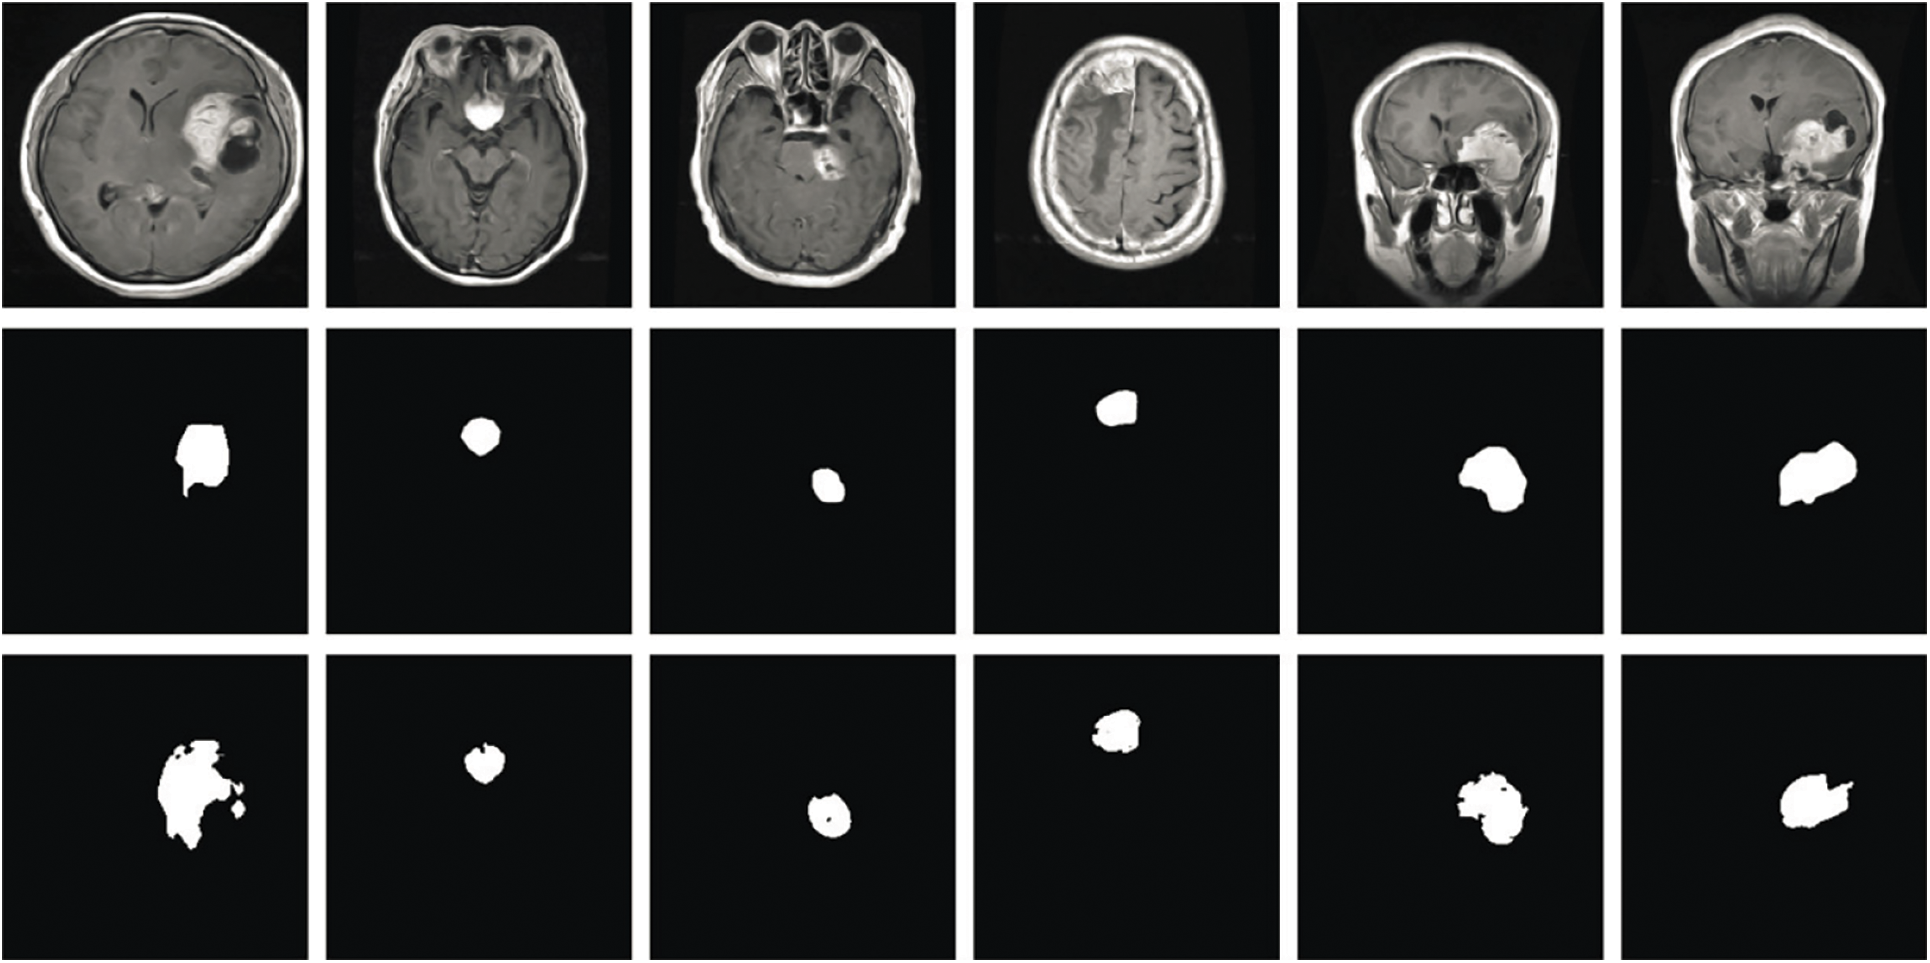
Figure 7: Results of brain tumor segmentation using the proposed method. The initial row displays images from the database, the second row shows the ground truth, and the third row illustrates the algorithm-generated output
5.2 Comparison of Segmentation Module Performance Based on Different Classifier
Table 2 presents a comparative analysis of diverse brain tumor segmentation models, each employing different classifiers and evaluated based on key performance metrics. The considered methods encompass K-Nearest Neighbor (K-NN), Self-Organizing Map (SOM), Genetic Algorithm (GA), Graph Convolutional Neural Network (GCNN), Kernel-Based SVM, and our proposed PCA-FCM-SVM approach.
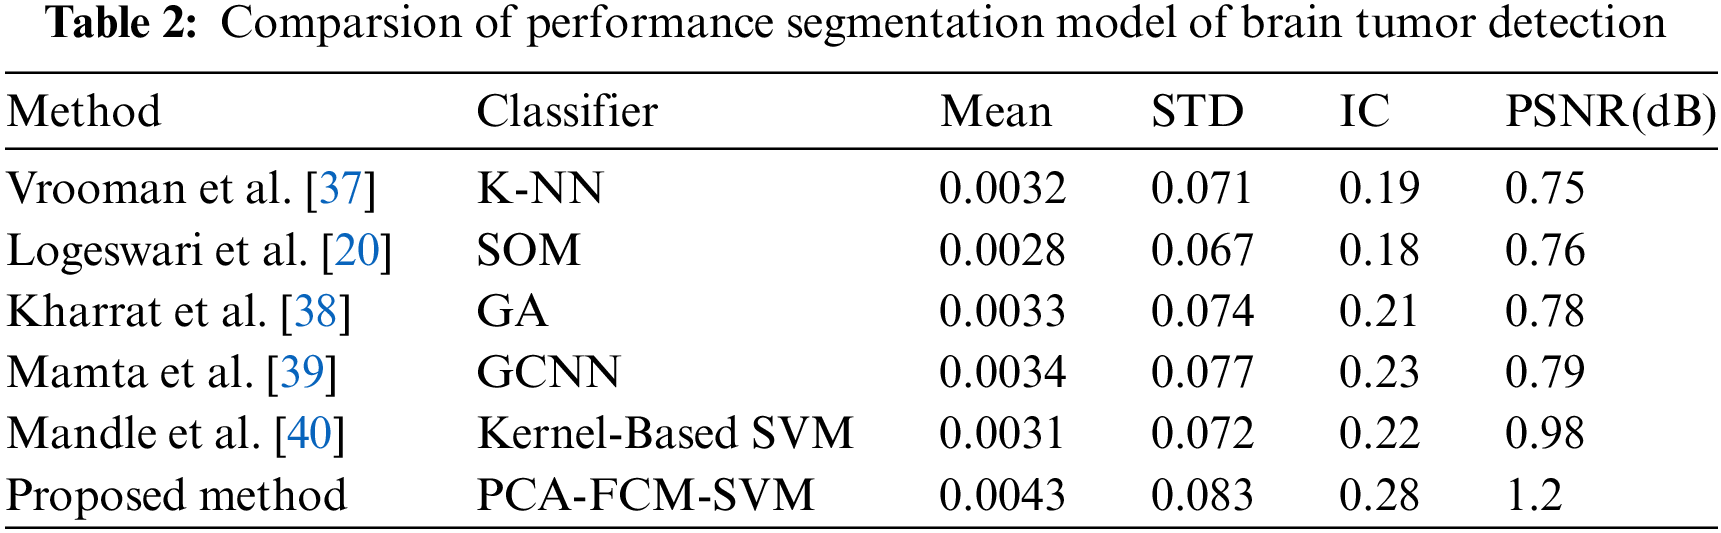
In terms of the mean metric, our proposed PCA-FCM-SVM method (0.0043) exhibits a competitive performance compared to existing models such as KNN (0.0032), SOM (0.0028), GA (0.0033), GCNN (0.0034), and Kernel-Based SVM (0.0031). Regarding standard deviation (STD), our method (0.083) demonstrates a slightly higher value than the comparison models (ranging from 0.067 to 0.077), indicating a slightly wider distribution of pixel values.
In the assessment of image contrast (IC), our proposed method (0.28) outperforms other models, surpassing the contrast levels achieved by KNN (0.19), SOM (0.18), GA (0.21), GCNN (0.23), and Kernel-Based SVM (0.22). Furthermore, in terms of peak signal-to-noise ratio (PSNR) measured in dB, our PCA-FCM-SVM approach (1.2) excels, demonstrating higher values compared to the comparison models, including KNN (0.75), SOM (0.76), GA (0.78), GCNN (0.79), and Kernel-Based SVM (0.98).
This comprehensive comparison highlights the competitive performance of our proposed PCA-FCM-SVM method, particularly in aspects of image contrast and peak signal-to-noise ratio. These results suggest the efficacy of our approach in the segmentation of brain tumors, showcasing its potential utility in this critical medical imaging domain.
5.3 Analysis of Classification Module Performance
The performance analysis in Table 3 offers a detailed examination of the brain tumor classification model’s effectiveness, specifically across different image types such as Meningiomas, Gliomas, and Pituitary tumors. Each image type is assessed based on key metrics, including Sensitivity (
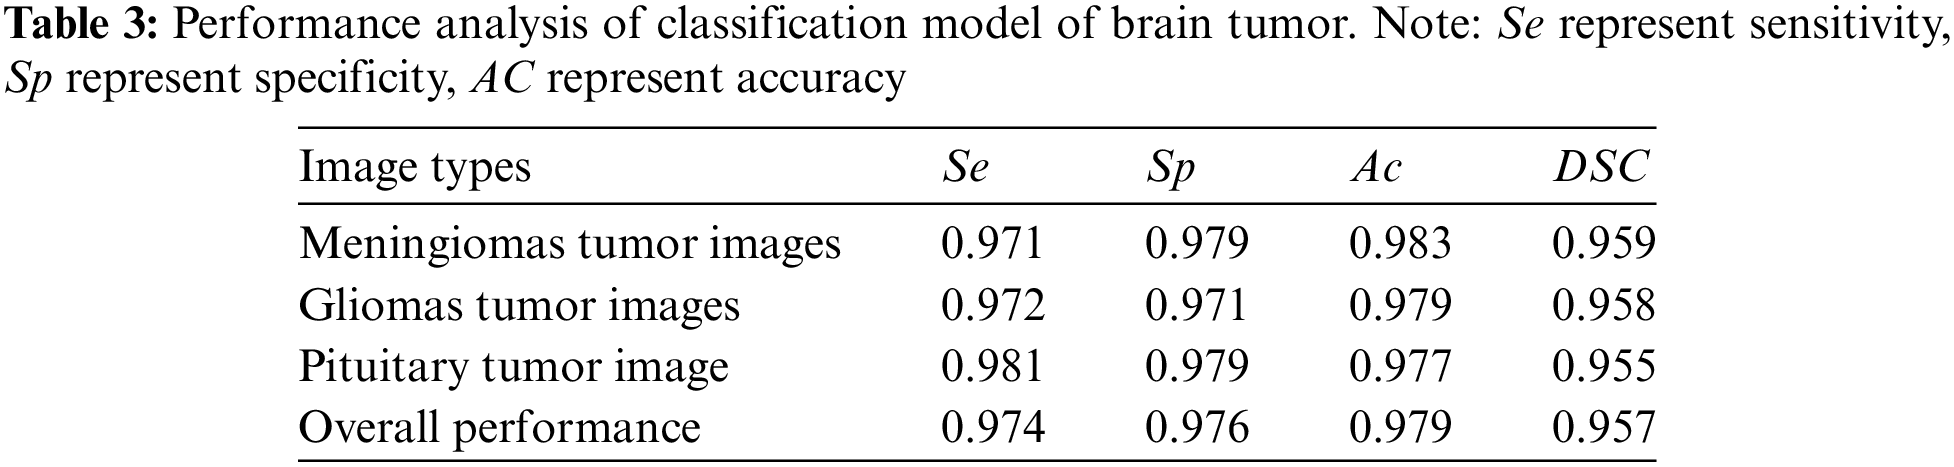
For Meningiomas Tumor Images, the model demonstrates high performance with a Sensitivity of 0.971, Specificity of 0.979, Accuracy of 0.983, and a Dice Score Coefficient of 0.959. Similarly, Gliomas Tumor Images exhibit strong metrics, including a Sensitivity of 0.972, Specificity of 0.971, Accuracy of 0.979, and a Dice Score Coefficient of 0.958. Pituitary Tumor Images also showcase notable results, with a Sensitivity of 0.981, Specificity of 0.979, Accuracy of 0.977, and a Dice Score Coefficient of 0.955.
The overall performance metrics, summarizing the model’s effectiveness across all tumor types, include a Sensitivity of 0.974, Specificity of 0.976, Accuracy of 0.979, and a Dice Score Coefficient of 0.957. These results collectively underscore the robustness of the brain tumor classification model, demonstrating consistently high performance in accurately identifying and classifying various tumor types. The noteworthy Dice Score Coefficient further indicates precise segmentation, highlighting the model’s reliability in medical image analysis. The statistical parameter analysis confirms the model’s capability to classify abnormal tumor regions using the PCA-FCM-SVM classifier accurately.
5.4 Comparison of Classification Module Performance of Different Classifier
The presented Table 4 provides a comprehensive comparative analysis of various brain tumor detection methods, including the proposed method, based on performance metrics such as sensitivity, specificity, accuracy, Dice Score (DSC), and processing time. Notably, the proposed method exhibits outstanding performance, achieving a sensitivity of 0.974, specificity of 0.976, accuracy of 0.979, and a DSC of 0.957. These metrics indicate a commendable balance between correctly identifying true positive and true negative cases, which is essential for accurate tumor detection and segmentation. Furthermore, the proposed method distinguishes itself with an efficient processing time of 0.44 s, underscoring its suitability for real-time or near-real-time applications. The proposed method consistently outperforms sensitivity and specificity compared to other methods, including traditional techniques like K-NN and more advanced approaches such as SVM, Back Propagation Neural Network (BP-NN),Deep Long Short-Term Memory (LSTM), CNNs, and GANs. This suggests its efficacy in automating brain tumor detection through MRI analysis, offering a promising contribution to the field. However, it is essential to note that the absence of time information for some methods and the lack of performance metrics for others limit a comprehensive evaluation. Nonetheless, the proposed method emerges as a robust and efficient solution, showcasing its potential significance in advancing automated brain tumor diagnosis.
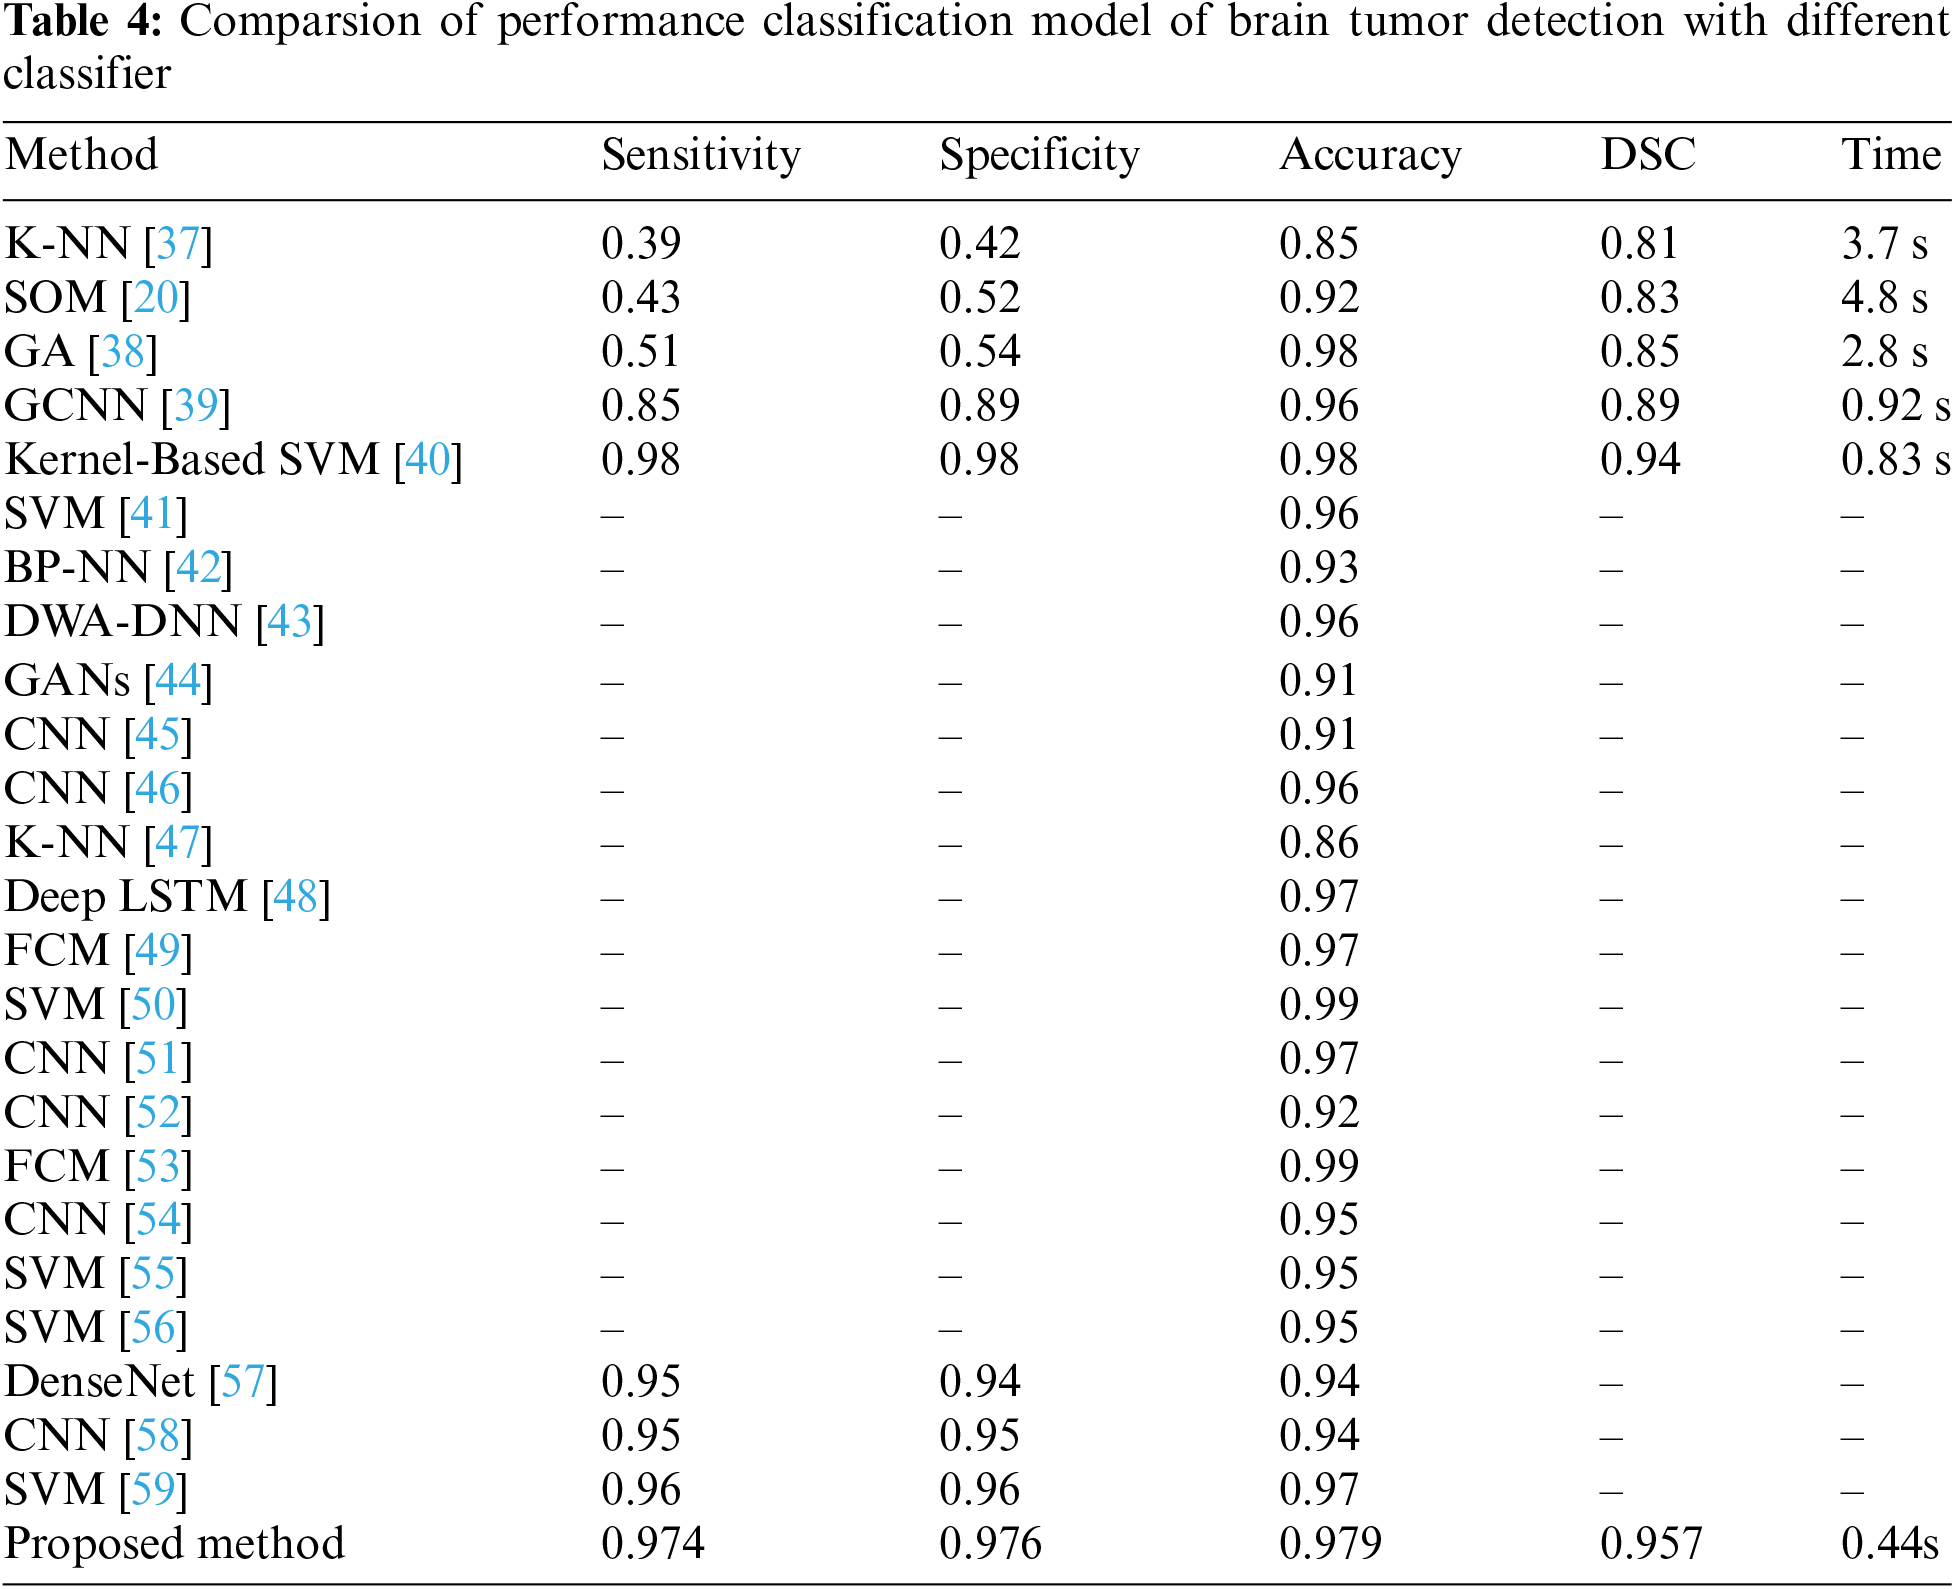
Our findings indicate that the proposed approach outperforms a majority of existing methods, demonstrating superior levels of sensitivity, specificity, accuracy, and Dice Score. Furthermore, it highlights an expedited processing time when compared to certain models, emphasizing its capability for precise classification of tumor regions in brain imaging.
5.5 Comparative Analysis with Existing Work
To evaluate the efficacy of our proposed approach, we conducted a performance assessment by comparing it with recent techniques developed from 2019 onwards, as outlined in Table 5.
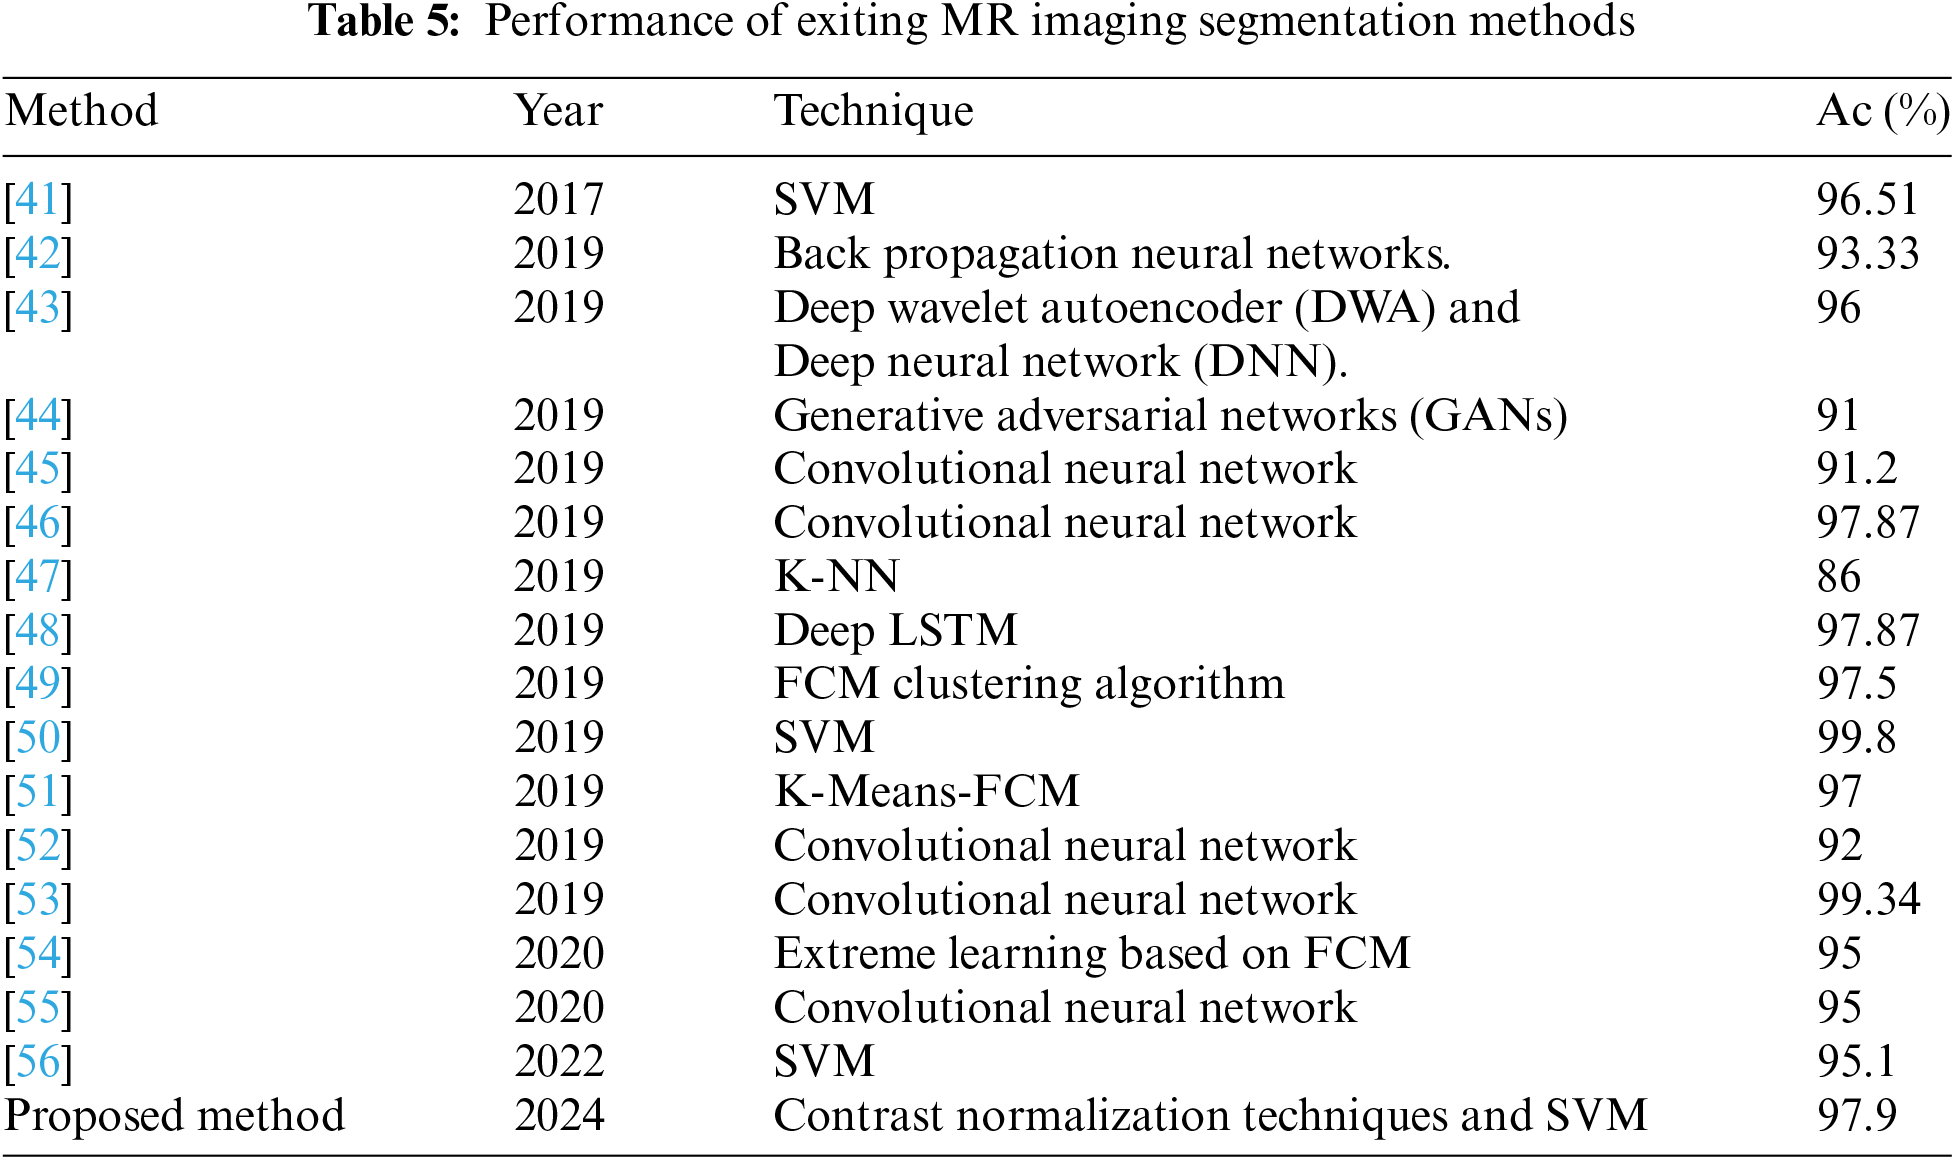
The provided Table 5 offers a comprehensive overview of various methodologies employed in the segmentation of MR imaging data, highlighting their respective years of publication and corresponding accuracies. Among the techniques showcased, classical machine learning algorithms like Support Vector Machine (SVM) and K-Nearest Neighbors (K-NN) stand alongside cutting-edge deep learning architectures such as Convolutional Neural Networks (CNNs) and Generative Adversarial Networks (GANs).
Beginning with earlier works, Bahadur et al. [41] achieved an impressive 96.51% accuracy using SVM, showcasing the efficacy of traditional approaches. Subsequent advancements led to the exploration of neural network-based methods, with Shakeel et al. [42] utilizing Backpropagation Neural Networks and achieving an accuracy of 93.33%. This trend continued with Mallick et al. [43], who combined Deep Wavelet Autoencoder (DWA) and Deep Neural Network (DNN) techniques to achieve an accuracy of 96%.
The advent of deep learning witnessed a surge in accuracy, as evidenced by Han et al. [44] utilizing GANs and achieving 91% accuracy, and Li et al. [45] employing CNNs with an accuracy of 91.2%. Notably, Hossain et al. [46] attained a significant accuracy boost of 97.87% using CNNs, highlighting the superiority of deep learning in handling complex imaging data.
Additionally, the exploration of clustering algorithms, such as Fuzzy C-Means (FCM) by Alam et al. [49], showcased competitive accuracies, reaching 97.5%. The utilization of recurrent neural networks (RNNs), exemplified by Amin et al. [48] employing Deep Long Short-Term Memory (LSTM) networks, further expanded the methodological landscape, achieving an accuracy of 97.87%. Ranjbarzadeh et al. [60] proposed CNN based method but it gave sensitivity around 98% that shows good accurate detection of brain tumor.
Moreover, the table reflects the continual refinement of existing techniques, such as Janardhanaprabhu et al. [50] achieving the highest accuracy of 99.8% using SVM, underscoring the robustness of classical machine learning methods when appropriately applied. Furthermore, the integration of novel methodologies, as given by the proposed method in 2024 incorporating Contrast Normalization Techniques with SVM, yielded competitive accuracies of 97.9%, indicating promising avenues for future research. The techniques used range from traditional machine learning algorithms like SVM and k-NN to deep learning approaches such as CNNs and GANs. The comparison reveals the evolution of segmentation techniques, with diverse approaches such as neural networks, clustering algorithms, and SVM showing varying degrees of success. Notably, the proposed method demonstrates a promising advancement in MR imaging segmentation, surpassing many existing methods in terms of accuracy and showcasing the potential of Contrast Normalization Techniques coupled with SVM for enhanced performance.
5.6 Discussion on Performance of Proposed Method
The proposed pipeline exhibits noteworthy advancements in the classification of meningioma vs. pituitary tumors when compared to existing methods. The achieved performance breakdown across various parameters provides a detailed insight into the method’s efficacy:
• The average sensitivity of 0.981 signifies a remarkable success rate in accurately identifying pituitary tumors, showcasing the method’s proficiency in sensitivity-driven tasks.
• With an accuracy value of 0.997, the method demonstrates high precision in correctly identifying meningioma tumors without misclassifying pituitary tumors, emphasizing its accuracy in overall classification.
• The DSC of 0.957 reveals substantial agreement between the proposed method’s classifications and the actual tumor locations, underscoring its accuracy in delineating tumor boundaries.
• Noteworthy is the proposed method’s shorter execution time of 0.44 s compared to existing works, indicating enhanced efficiency and computational speed.
Moreover, the proposed method’s outperformance in sensitivity, specificity, accuracy, and DSC positions it as a promising innovation in medical imaging. These improvements hold significant potential for more precise and efficient diagnoses, with the prospect of expediting treatment decisions for patients with meningioma and pituitary tumors. The shorter execution time also contributes to the practical applicability of the proposed method, making it a valuable addition to the landscape of medical image classification.
6 Conclusion and Future Directions
This study introduces a comprehensive pipeline for the automated segmentation and classification of brain tumors, covering pre-processing, enhancement, segmentation, and classification stages. The proposed methodology demonstrates a significant improvement in performance across various metrics, including average sensitivity, specificity, accuracy, and Dice Similarity Coefficient (DSC), indicating robust capabilities in accurately identifying and distinguishing different tumor types. Particularly noteworthy is the method’s achievement of high accuracy while concurrently reducing execution time, a substantial contribution to the field of medical image analysis.
Future work offers numerous opportunities for further enhancement and expansion. The standardization of the pipeline through ensemble techniques and innovations in machine learning can bolster its robustness. The incorporation of deep learning methods, such as convolutional neural networks (CNNs), holds potential for achieving increased accuracy. To enhance generalizability, the inclusion of a larger and more diverse dataset, along with multimodal image analysis, is essential. Exploring validation studies, real-time applications, and integration with clinical decision support systems represents promising avenues for ongoing research, fostering advancements in automated brain tumor analysis.
These refinements in the proposed methodology contribute to an improved diagnostic process, facilitating more accurate and efficient brain tumor diagnosis. The potential impact on patients is substantial, enabling timely and well-informed treatment decisions. The significance of this research lies in its capacity to contribute to the development of state-of-the-art medical imaging tools, with tangible implications for patient care and outcomes.
Acknowledgement: Not applicable.
Funding Statement: This work was supported by the Deanship of Scientific Research, Najran University, Kingdom of Saudi Arabia, for funding this work under the Distinguished Research Funding Program Grant Code Number (NU/DRP/SERC/12/16).
Author Contributions: Study conception and design: Abdullah A. Asiri, Toufique A. Soomro and Muhammad Irfan; data collection: Toufique A. Soomro, Faisal Bin Ubaid and Samar M. Alqhtani; analysis and interpretation of results: Abdullah A. Asiri1, Toufique A. Soomro, Faisal Bin Ubaid, Ahmed Ali, Muhammad Irfan and Samar M. Alqhtani; draft manuscript preparation: Abdullah A. Asiri1, Toufique A. Soomro. All authors reviewed the results and approved the final version of the manuscript.
Availability of Data and Materials: The data can be accessed on this link https://www.kaggle.com/datasets/navoneel/brain-mri-images-for-brain-tumor-detection.
Conflicts of Interest: The authors declare that they have no conflicts of interest to report regarding the present study.
References
1. Ullah MS, Khan MA, Almujally NA, Alhaisoni M, Akram T, Shabaz M. BrainNet: a fusion assisted novel optimal framework of residual blocks and stacked autoencoders for multimodal brain tumor classification. Sci Rep. 2024;14:5895. doi:10.1038/s41598-024-56657-3. [Google Scholar] [PubMed] [CrossRef]
2. Soomro TA, Zheng L, Afifi AJ, Ali A, Soomro S, Yin M. Image segmentation for MR brain tumor detection using machine learning: a review. IEEE Rev Biomed Eng. 2023;16:70–90. doi:10.1109/RBME.2022.3185292. [Google Scholar] [PubMed] [CrossRef]
3. Yao Z, Zhang Z, Xu LQ. Convolutional neural network for retinal blood vessel segmentation. In: 2016 9th International Symposium on Computational Intelligence and Design (ISCID), 2016; Hangzhou, China. p. 406–9. [Google Scholar]
4. Armstrong TS, Cohen MZ, Weinberg J, Gilbert MR. Imaging techniques in neuro-oncology. Seminars Oncol Nur. 2004;20:231–9. doi:10.1016/S0749-2081(04)00087-7. [Google Scholar] [CrossRef]
5. Sami UM, Attique KM, Anum M, Olfa M, Oumaima S, Nazik A. Brain tumor classification from MRI scans: a framework of hybrid deep learning model with Bayesian optimization and quantum theory-based marine predator algorithm. Front Oncol. 2024;14:1–21. [Google Scholar]
6. Kim HW, Assch LV, Jennings RB, Wince WB, Jensen CJ, Rehwald WG, et al. Relationship of t2-weighted MRI myocardial hyperintensity and the ischemic area-at-risknovelty and significance. Circ Res. 2015;117(3):254–65. doi:10.1161/CIRCRESAHA.117.305771. [Google Scholar] [PubMed] [CrossRef]
7. Deng W, Shi Q, Luo K, Yang Y, Ning N. A Brain tumor segmentation based on improved convolutional neural network in combination with non-quantifiable local texture featurea. J Med Syst. 2019;43(6):1–9. [Google Scholar]
8. Anari S, Sarshar NT, Mahjoori N, Dorosti S, Rezaie A. Review of deep learning approaches for thyroid cancer diagnosis. Math Prob Eng. 2022;2022:1–8. doi:10.1155/2022/5052435. [Google Scholar] [CrossRef]
9. Rauf F, Khan MA, Bashir AK, Jabeen K, Hamza A, Alzahrani AI, et al. Automated deep bottleneck residual 82-layered architecture with Bayesian optimization for the classification of brain and common maternal fetal ultrasound planes. Front Med. 2023;10:1330218. doi:10.3389/fmed.2023.1330218. [Google Scholar] [PubMed] [CrossRef]
10. Lundervold A, Lundervold A. An overview of deep learning in medical imaging focusing on MRI. J Med Phys. 2019;29(2):102–27. [Google Scholar]
11. Jiang Y, Hou J, Xiao X, Deng H. A brain tumor segmentation new method based on statistical thresholding and multiscale CNN. In: ICIC 2018: Intelligent computing methodologies; 2018; p. 235–45. [Google Scholar]
12. Ranjbarzadeh R, Zarbakhsh P, Caputo A, Tirkolaee EB, Bendechache M. Brain tumor segmentation based on optimized convolutional neural network and improved chimp optimization algorithm. Comput Biol Med. 2024;168:107723. doi:10.1016/j.compbiomed.2023.107723. [Google Scholar] [PubMed] [CrossRef]
13. Bagherian Kasgari A, Ranjbarzadeh R, Caputo A, Baseri Saadi S, Bendechache M. Brain tumor segmentation based on zernike moments, enhanced ant lion optimization, and convolutional neural network in MRI images. In: Razmjooy N, Ghadimi N, Rajinikanth V, eds. Metaheuristics and optimization in computer and electrical engineering. Cham: Springer; 2023. p. 345–66 [Google Scholar]
14. Hssayeni H. Computed tomography images for intracranial hemorrhage detection and segmentation. PhysioNet. Mar. 2020;5(1):1–14. [Google Scholar]
15. Zhao X, Wu Y, Song G, Li Z, Zhang Y, Fan Y. A deep learning model integrating FCNNs and CRFs for brain tumor segmentation. Med Image Anal. 2018;43:98–111. doi:10.1016/j.media.2017.10.002. [Google Scholar] [PubMed] [CrossRef]
16. Khan MA, Khan A, Alhaisoni M, Alqahtani A, Alsubai S, Alharbi M, et al. Multimodal brain tumor detection and classification using deep saliency map and improved dragonfly optimization algorithm. Int J Imaging Syst Technol. 2023;33(2):572–87. doi:10.1002/ima.22831. [Google Scholar] [CrossRef]
17. Badran EF, Mahmoud EG, Hamdy N. An algorithm for detecting brain tumors in MRI images. In: The 2010 International Conference on Computer Engineering & Systems, 2010; Cairo, Egypt. p. 368–73. [Google Scholar]
18. Syed shameem K, Babu R, Sai Deepthi U, Sudha Madhuri A, Sai Prasad P. Comparative analysis of brain tumor detection using deep learning methods. Int J Scientif Technol. 2019;8(12):252–4. [Google Scholar]
19. Raju AR, Suresh P, Rao RR. Bayesian HCS-based multi-SVNN: A classification approach for brain tumor segmentation and classification using Bayesian fuzzy clustering. Biocybernet Biomed Eng. 2018;38(3):646–60. doi:10.1016/j.bbe.2018.05.001. [Google Scholar] [CrossRef]
20. Logeswari T, Karnan M. An improved implementation of brain tumor detection using segmentation based on hierarchical self organizing map. Int J Comput Theory Eng. 2010;2(4):591–5. [Google Scholar]
21. Lather M, Singh P. Investigating brain tumor segmentation and detection techniques. Procedia Comput Sci. 2020;167:121–30. doi:10.1016/j.procs.2020.03.189. [Google Scholar] [CrossRef]
22. Chaithanyadas KV, Gnana King GR. Brain tumour classification: a comprehensive systematic review on various constraints. Comput Methods Biomech Biomed Eng: Imaging Visual. 2022;11(3):517–29. [Google Scholar]
23. Yin B, Wang C, Abza F. New brain tumor classification method based on an improved version of whale optimization algorithm. Biomed Signal Process Control. 2020;56:101728. doi:10.1016/j.bspc.2019.101728. [Google Scholar] [CrossRef]
24. Alagarsamy S, Kamatchi K, Govindaraj V, Zhang YD, Thiyagarajan A. Multi-channeled MR brain image segmentation: a new automated approach combining BAT and clustering technique for better identification of heterogeneous tumors. Biocybernet Biomed Eng. 2019;39(4):1005–35. doi:10.1016/j.bbe.2019.05.007. [Google Scholar] [CrossRef]
25. Kumar A, Ramachandran M, Gandomi AH, Patan R, Lukasik S, Soundarapandian RK. A deep neural network based classifier for brain tumor diagnosis. Appl Soft Comput. 2019;82:105528. doi:10.1016/j.asoc.2019.105528. [Google Scholar] [CrossRef]
26. Ozyurt F, Sert E, Avci E, Dogantekin E. Brain tumor detection based on Convolutional Neural Network with neutrosophic expert maximum fuzzy sure entropy. Measurement. 2019;147:1–6. [Google Scholar]
27. Selvapandian A, Manivannan K. Fusion based Glioma brain tumor detection and segmentation using ANFIS classification. Comput Methods Programs Biomed. 2018;166:33–8. doi:10.1016/j.cmpb.2018.09.006. [Google Scholar] [PubMed] [CrossRef]
28. Sharma M, Purohit GN, Mukherjee S. Information retrieves from brain MRI images for tumor detection using hybrid technique k-means and artificial neural network (KMANN). Lecture Notes Data Eng Commun Technol. 2018;4:145–57. doi:10.1007/978-981-10-4600-1. [Google Scholar] [CrossRef]
29. Varuna Shree N, Kumar TNR. Identification and classification of brain tumor MRI images with feature extraction using DWT and probabilistic neural network. Brain Inf. 2018;5:23–30. doi:10.1007/s40708-017-0075-5. [Google Scholar] [PubMed] [CrossRef]
30. Abd-Ellah MK, Awad AI, Khalaf AAM, Hamed HFA. Two-phase multi-model automatic brain tumour diagnosis system from magnetic resonance images using convolutional neural networks. EURASIP J Image Video Process. 2018;2018(1):1–10. [Google Scholar]
31. Rani R, Kamboj A. Brain tumor classification for MR imaging using support vector machine. In: Panigrahi C, Pujari A, Misra S, Pati B, Li KC, eds. Progress in advanced computing and intelligent engineering. Singapore: Springer; 2019. p. 165–76 [Google Scholar]
32. Torres-Molina R, Bustamante-Orellana C, Riofrio-Valdivieso A, Quinga-Socasi F, Guachi R, Guachi-Guachi L. Brain tumor classification using principal component analysis and kernel support vector machine. In: Intelligent Data Engineering and Automated Learning–IDEAL 2019. Manchester, UK: Springer; 2019. p. 89–96. [Google Scholar]
33. Studio encoding parameters of digital television for standard 4:3 and wide screen 16:9 aspect ratios; 1995. Available from: https://www.itu.int/rec/R-REC-BT.601. [Accessed 2024]. [Google Scholar]
34. Vankdothu R, Hameed MA. Brain tumor segmentation of MR images using SVM and fuzzy classifier in machine learning. Measur: Sens. 2022;24:100440. [Google Scholar]
35. Almalki YE, Jandan NA, Soomro TA, Ali A, Kumar P, Irfan M, et al. Enhancement of medical images through an iterative mccann retinex algorithm: a case of detecting brain tumor and retinal vessel segmentation. Appl Sci. 2022;12(16):8243. doi:10.3390/app12168243. [Google Scholar] [CrossRef]
36. Cheng J. Brain tumor dataset; 2017. figshare. Dataset. Available from: https://figshare.com/articles/dataset/brain_tumor_dataset/1512427. [Accessed 2024]. [Google Scholar]
37. Vrooman HA, Cocosco CA, van der Lijn F, Stokking R, M AI, Vernooij MW, et al. Multi-spectral brain tissue segmentation using automatically trained k-Nearest-Neighbor classification. Neuroimage. 2007;37(1):71–81. doi:10.1016/j.neuroimage.2007.05.018. [Google Scholar] [PubMed] [CrossRef]
38. Kharrat A, Gasmi K, Messaoud MAB, Benamrane N, Abid M. A hybrid approach for automatic classification of brain MRI using genetic algorithm and support vector machine. Leonardo J Sci. 2010;1(17):71–82. [Google Scholar]
39. Mittal M, Goyal LM, Kaur S, Kaur I, Verma A, Jude Hemanth D. Deep learning based enhanced tumor segmentation approach for MR brain images. Appl Soft Comput. 2019;78:346–54. doi:10.1016/j.asoc.2019.02.036. [Google Scholar] [CrossRef]
40. Mandle AK, Sahu SP, Gupta G. Brain tumor segmentation and classification in MRI using clustering and kernel-based SVM. Biomed Pharmacol J. 2022;15(2):699–715. doi:10.13005/bpj. [Google Scholar] [CrossRef]
41. Bahadure NB, Ray AK, Thethi HP. Image analysis for MRI based brain tumor detection and feature extraction using biologically inspired BWT and SVM. Int J Biomed Imaging. 2017;2017:1–12. [Google Scholar]
42. Shakeel PM, Tobely TEE, Al-Feel H, Manogaran G, Baskar S. Neural network based brain tumor detection using wireless infrared imaging sensor. IEEE Access. 2019;7:5577–88. doi:10.1109/ACCESS.2018.2883957. [Google Scholar] [CrossRef]
43. Mallick PK, Ryu SH, Satapathy SK, Mishra S, Nguyen GN, Tiwari P. Brain mri image classification for cancer detection using deep wavelet autoencoder-based deep neural network. IEEE Access. 2019;7:46278–87. doi:10.1109/Access.6287639. [Google Scholar] [CrossRef]
44. Han C, Rundo L, Araki R, Nagano Y, Furukawa Y, Mauri G, et al. Combining noise-to-image and image-to-image gans: brain mr image augmentation for tumor detection. IEEE Access. 2019;7:156966–77. doi:10.1109/Access.6287639. [Google Scholar] [CrossRef]
45. Li M, Kuang L, Xu S, Sha Z. Brain tumor detection based on multimodal information fusion and convolutional neural network. IEEE Access. 2019;7:180134–46. doi:10.1109/Access.6287639. [Google Scholar] [CrossRef]
46. Hossain T, Shishir FS, Ashraf M, Al Nasim MA, Shah FM. Brain tumor detection using convolutional neural network. In: 2019 1st International Conference on Advances in Science, Engineering and Robotics Technology (ICASERT2019; Dhaka, Bangladesh, IEEE. p. 1–6. [Google Scholar]
47. Qasem SN, Nazar A, Attia Qamar S. A learning based brain tumor detection system. Comput Mat Continua. 2019;59(3):713–27. doi:10.32604/cmc.2019.05617. [Google Scholar] [CrossRef]
48. Amin J, Sharif M, Raza M, Saba T, Sial R, Shad SA. Brain tumor detection: a long short-term memory (LSTM)-based learning model. Neural Comput Appl. 2020;32(20):15965–73. doi:10.1007/s00521-019-04650-7. [Google Scholar] [CrossRef]
49. Alam MS, Rahman MM, Hossain MA, Islam MK, Ahmed KM, Ahmed KT, et al. Automatic human brain tumor detection in mri image using template-based k means and improved fuzzy c means clustering algorithm. Big Data Cogn Comput. 2019;3(2):27. doi:10.3390/bdcc3020027. [Google Scholar] [CrossRef]
50. Janardhanaprabhu S, Malathi V. Brain tumor detection using depth-first search tree segmentation. J Med Syst. 2019;43(8):1–12. [Google Scholar]
51. Rajan P, Sundar C. Brain tumor detection and segmentation by intensity adjustment. J Med Syst. 2019;43(8):1–13. [Google Scholar]
52. Thaha MM, Kumar KPM, Murugan B, Dhanasekeran S, Vijayakarthick P, Selvi AS. Brain tumor segmentation using convolutional neural networks in mri images. J Med Syst. 2019;43(9):1–10. [Google Scholar]
53. Noreen N, Palaniappan S, Qayyum A, Ahmad I, Imran M, Shoaib M. A deep learning model based on concatenation approach for the diagnosis of brain tumor. IEEE Access. 2020;8:55135–44. doi:10.1109/Access.6287639. [Google Scholar] [CrossRef]
54. Sharif M, Amin J, Raza M, Anjum MA, Afzal H, Shad SA. Brain tumor detection based on extreme learning. Neural Comput Appl. 2020;32:1–13. [Google Scholar]
55. Saxena P, Maheshwari A, Maheshwari S. Predictive modeling of brain tumor: a deep learning approach. In: Innovations in computational intelligence and computer vision. Singapore: Springer; 2021. p. 275–85. [Google Scholar]
56. Senan EM, Jadhav ME, Rassem TH, Aljaloud AS, Mohammed BA, Al-Mekhlafi ZG. Early diagnosis of brain tumour MRI images using hybrid techniques between deep and machine learning. Hindawi Comput Math Methods Med. 2022;2022:1–17. [Google Scholar]
57. Yahyaoui H, Ghazouani F, Farah IR. Deep learning guided by an ontology for medical images classification using a multimodal fusion. In: 2021 International Congress of Advanced Technology and Engineering (ICOTEN); 2021; Taiz, Yemen. p. 1–6. [Google Scholar]
58. Khan AR, Khan S, Harouni M, Abbasi R, Iqbal S. Brain tumor segmentation using K-means clustering and deep learning with synthetic data augmentation for classification. Microsc Res Tech. 2021;84:1389–99. doi:10.1002/jemt.v84.7. [Google Scholar] [CrossRef]
59. Latif G, Brahim GB, Iskandar DNFA, Bashar A, Alghazo J. Glioma Tumors classification using deep-neural-network-based features with SVM classifier. Diagnostics. 2022;12:1018. doi:10.3390/diagnostics12041018. [Google Scholar] [PubMed] [CrossRef]
60. Ranjbarzadeh R, Bagherian Kasgari A, Jafarzadeh Ghoushchi S, et al. Brain tumor segmentation based on deep learning and an attention mechanism using MRI multi-modalities brain images. Sci Rep. 2021;11:10930. doi:10.1038/s41598-021-90428-8. [Google Scholar] [PubMed] [CrossRef]
Cite This Article
 Copyright © 2024 The Author(s). Published by Tech Science Press.
This work is licensed under a Creative Commons Attribution 4.0 International License , which permits unrestricted use, distribution, and reproduction in any medium, provided the original work is properly cited.
 Downloads
 Citation Tools