
 Submit a Paper
 Propose a Special lssue
 Open Access
ARTICLE

Sleep Posture Classification Using RGB and Thermal Cameras Based on Deep Learning Model
1 Department of ICT Convergence, Soonchunhyang University, Asan, 31538, Korea
2 ICT Convergence Research Center, Soonchunhyang University, Asan, 31538, Korea
3 Emotional and Intelligent Child Care Convergence Research Center, Soonchunhyang University, Asan, 31538, Korea
* Corresponding Author: Yunyoung Nam. Email:
(This article belongs to the Special Issue: Artificial Intelligence Emerging Trends and Sustainable Applications in Image Processing and Computer Vision)
Computer Modeling in Engineering & Sciences 2024, 140(2), 1729-1755. https://doi.org/10.32604/cmes.2024.049618
Received 12 January 2024; Accepted 14 March 2024; Issue published 20 May 2024
 View Full Text
 Download PDF
Abstract
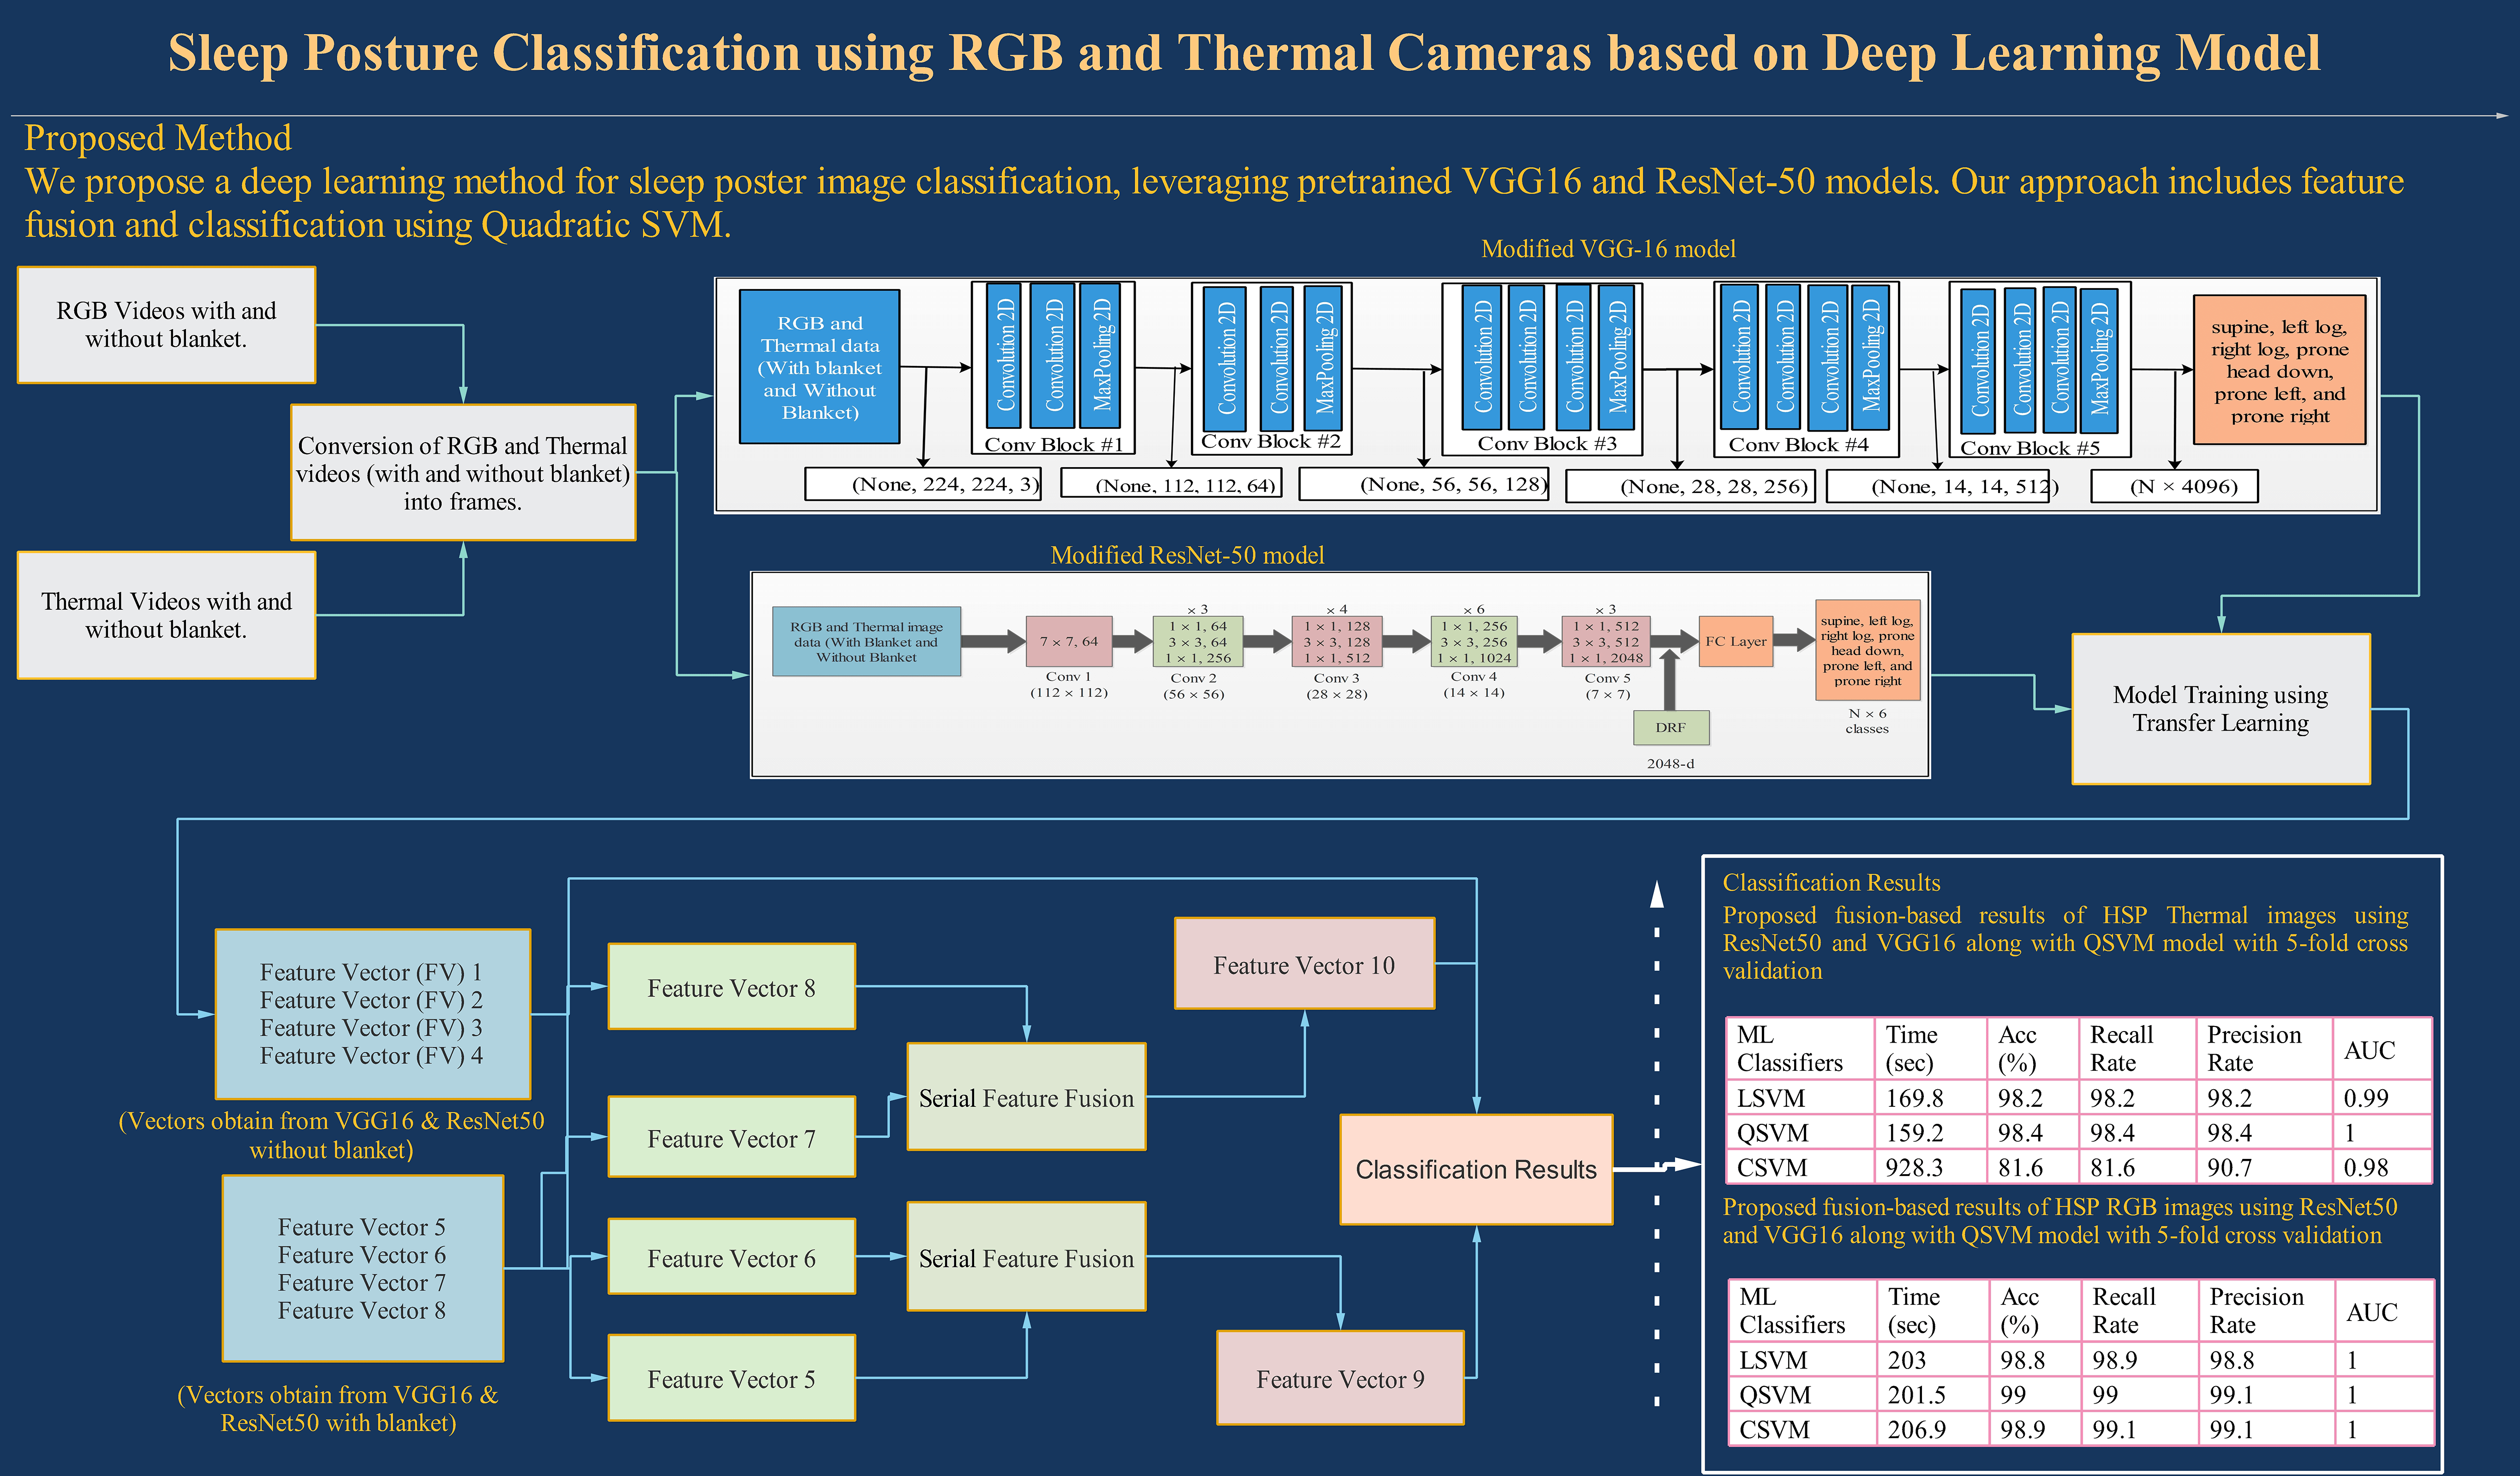
Sleep posture surveillance is crucial for patient comfort, yet current systems face difficulties in providing comprehensive studies due to the obstruction caused by blankets. Precise posture assessment remains challenging because of the complex nature of the human body and variations in sleep patterns. Consequently, this study introduces an innovative method utilizing RGB and thermal cameras for comprehensive posture classification, thereby enhancing the analysis of body position and comfort. This method begins by capturing a dataset of sleep postures in the form of videos using RGB and thermal cameras, which depict six commonly adopted postures: supine, left log, right log, prone head, prone left, and prone right. The study involves 10 participants under two conditions: with and without blankets. Initially, the database is normalized into a video frame. The subsequent step entails training a fine-tuned, pretrained Visual Geometry Group (VGG16) and ResNet50 model. In the third phase, the extracted features are utilized for classification. The fourth step of the proposed approach employs a serial fusion technique based on the normal distribution to merge the vectors derived from both the RGB and thermal datasets. Finally, the fused vectors are passed to machine learning classifiers for final classification. The dataset, which includes human sleep postures used in this study’s experiments, achieved a 96.7% accuracy rate using the Quadratic Support Vector Machine (QSVM) without the blanket. Moreover, the Linear SVM, when utilized with a blanket, attained an accuracy of 96%. When normal distribution serial fusion was applied to the blanket features, it resulted in a remarkable average accuracy of 99%.Graphic Abstract
Keywords
Optimal sleep is essential for maintaining both physical health and overall well-being [1]. Extensive research has established significant correlations between sleep disorders and chronic conditions, such as diabetes, obesity, and hypertension [2–4]. Poor sleep quality or disruptions can exacerbate mental health concerns, such as depression and anxiety [5]. Prevalence studies indicate that approximately 47 individuals per 1000 in the population are affected by sleep disorders, with some estimates suggesting an even higher prevalence [6]. In China, over 25% of adolescents are reported to experience sleep disturbances [7]. The American Academy of Sleep Medicine (AASM) and Rechtschaffen and Kales Standards are used for sleep staging in this field throughout the world [8]. Insomnia, the most widespread sleep disorder, has been investigated through various methods, including photoplethysmography, ballistocardiography, polysomnography (PSG), and actigraphy [9,10]. PSG is expensive and inconvenient, requiring multiple sensors to be attached to participants, potentially impacting their sleep quality [11]. While diverse methods are available for sleep research, they can be categorized into two areas. One involves monitoring physiological variables, such as electrocardiogram and electroencephalogram (EEG) during sleep, employed to classify sleep stages and evaluate the quality of sleep [12–15]. The other observes external body behavior during sleep, including posture and movement detection [16,17]. Monitoring sleep position and movement can determine the quantity and quality of a sleep pattern. Research indicates that the amount of sleep and body movements are directly related [18]. Major movements, where the entire body changes position, suggest lighter sleep and that the body may be preparing to wake up. Sleep apnea, snoring, restless leg syndrome, rapid eye movement, and periodic limb movement sleep behavior disorder are disorders connected to body movement and position changes. PSG, which measures EEG, electromyography, electrooculography, breathing-related variables, and movement signals, is the gold standard for evaluating sleep. Despite PSG’s usefulness, it is difficult, time-consuming, and expensive. Furthermore, patients must sleep in a laboratory setting, which may compromise sleep quality. The requirements and characteristics of PSG make it unsuitable for long-term monitoring. Actigraphy, an alternative diagnosis method, requires wearing a device. However, some actigraphy users, especially children, may experience anxiety or panic [19]. In addition, this approach necessitates attaching multiple sensors to participants, potentially influencing the sleep quality being studied.
In more recent times, nonintrusive technologies have gained prominence in the realm of sleeping posture recognition. Video-based techniques, sensor fusion, and instrumented mattresses are three groups of non-contact techniques for posture recognition. These technologies encompass a range of modalities, including depth, infrared, and visible light cameras [20,21], radar, and radio sensors [1,22,23]. Lee et al. [24] identified different sleep postures using Kinect v2 skeleton tracking, which measures the x, y, and z coordinates of 25 joints. However, some non-contact sleep monitoring approaches require patients to avoid any bed coverings (blankets or sheets), which may be inconvenient [25,26]. Instrumented pillows and mattresses [27,28], as well as pressure sensors [29–31], are utilized individually to study sleep positions [27,28]. Other approaches use fusion sensors, combining a depth camera and an instrumented pressure mattress, to evaluate data and detect sleeping positions automatically. Despite these advancements, there remains a paucity of efforts aimed at accurately recognizing and categorizing sleeping postures [32], as these methods can be both time-consuming to analyze the massive data produced by sensors and prone to inaccuracies [33,34]. To analyze this gap, several machine-learning (ML) based strategies have been developed, including approaches involving learning, k-nearest neighbors (KNN), support vector machines (SVM), and convolutional neural networks (CNN). These techniques strive to enhance posture classification accuracy across both optical and pressure-sensing modalities [21].
Problems of conventional approaches may be overcome by quantitative non-contact sleep monitoring techniques, which may also be used to identify sleep disorders, improve sleep, and enhance the quality of life. Traditionally, sleep posture assessment relies on methods such as videotaping with manual labeling, which has demonstrated limitations in accuracy [1,35]. Recent strides have been made through the application of deep learning, machine learning, SVM, KNN, and CNN techniques to elevate the accuracy of sleep posture classification across both optical and pressure sensing paradigms [36–40]. Despite advancements, a significant challenge hinders widespread implementation due to a lack of robustness [39].
The key challenge in accurate noncontact monitoring, which has yet to be overcome, involves tracking movements and postures through blankets, according to a state-of-the-art assessment of sleep surveillance technology. In order to address this issue, this study aims to develop a sleep position classifier utilizing deep learning models and serial-based feature fusion, employing both RGB and thermal cameras and testing with and without blankets.
The objective of this study is to overcome the limitations of current methods by introducing a novel deep learning approach and a serially normal distribution-based fusion framework for precise human sleep posture image classification. In this research, both RGB and thermal cameras are used to classify human sleep postures, with a particular focus on scenarios involving the use of a blanket. The rationale behind this dual-camera approach is the recognized limitations of using RGB cameras where blankets are present, which result in lower classification accuracy. To address this issue, thermal cameras, which operate based on heat map information, have been introduced to enable more precise and accurate posture classification than traditional RGB camera methods. The proposed framework includes the following steps:
• Converting the video dataset into individual frames.
• Modifying two pre-trained deep learning models, Visual Geometry Group (VGG16) and ResNet50, by introducing an additional layer. This new layer establishes connections among the previous layers using fully connected (FC) layers.
• Employing the features extracted from the modified models for classification.
• Proposing a sequential normal distribution-based fusion approach to combine the feature vectors obtained from the VGG16 and ResNet50 models, aiming to achieve improved accuracy.
The rest of this article is structured as follows: Section 2 describes the significant work related to the study. Section 3 outlines the methodology utilized in the research, including the tools, methods, and resources employed. Section 4, comprises of the finding acquired from the study. Section 5 comprises of detailed discussion. Section 5 provides the conclusion of the research.
Sleep is a necessary activity for maintaining life’s physiological processes and activities. Sleep disorders, such as Rapid Eye Movement (REM), restless leg syndrome, sleep apnea, and sleep behavior disorder, impact many. Clinical diagnosis, the gold standard, involves polysomnography in a sleep unit with electrodes attached to the head and body. Sara et al. [19] proposed a non-contact method for assessing sleep disorders related to body posture and movements, using an Infrared (IR) camera to monitor body position without additional sensors. Twelve participants with various body shapes and Body Mass Indexes (BMIs) ranging from 27.8 to 21.3 kg/m2 used 10368 frames for training, comprising 10% of the initial dataset, which was used to evaluate the model’s performance. Meanwhile, IR data was processed using CNNs for classification. Results demonstrated an accuracy of 0.76 to 0.91 for participants across twelve sleep poses, with and without blankets. This method holds promise for detecting sleep postures and potentially characterizing sleep disorder behaviors.
Andy et al. [41] introduced a novel deep-learning model method to enhance accuracy in under-blanket sleep posture classification by using an attention strategy and anatomical landmark features to overcome the challenges caused by blankets. Integrated visible light and depth cameras were employed, and three deep learning models, Efficient Channel Attention (ECA) (ECA-Net50, EfficientNet B4, ResNet34), were trained using the depth camera images. A comparison was made between models without and with anatomical landmark inputs generated from pose estimation using visible images. In this regard, 120 participants performed seven sleep postures under various blanket conditions (thick, thin, medium, and no blanket). The data was partitioned for training and testing in an 8:2 ratio, and data augmentation was specifically applied to the blankets. ECA-Net50 demonstrated the best classification results, with anatomical landmarks boosting its F1 score from 87.4% to 92.2%.
Andy et al. [9] proposed an unobtrusive sleep posture classification system adaptable to blanket use to address the challenge posed by blankets. The dataset was collected through an infrared depth camera, and the CNN method was applied for the classification. Participants (66 in total, 26 women and 40 men) performed seven postures, including supine, prone with head left/right, log left/right, and fetal left/right, under four blanket conditions: thick, medium, thin, and none. Data augmentation involved affine transformation and data fusion, expanding the dataset. Two fully connected network layers trained coarse (four-posture) and fine (seven-posture) classifiers. The coarse classification combined log and fetal postures into side-lying and prone (head left/right) into one class. Results showed an 8.2% F1 score drop when shifting to fine classification. A thick blanket lowered the overall F1 scores by 3.5% and 8.9% for coarse and fine classifiers, respectively. The lowest performance was in classifying log (right) posture under a thick blanket (F1 score: 72.0%). In conclusion, the study established a system for categorizing prevalent sleeping postures under blankets, achieving an 88.9% F1 score.
Sara et al. [11] presented a non-contact sleep monitoring system using machine learning to analyze body posture and movement. Through infrared camera data and transfer learning, it accurately quantified sleep poses, including under blankets, during realistic overnight sleep. The authors proposed different performance variations of CNN architectures (VGG16, VGG19, AlexNet, ResNet101, GoogLeNet, ResNet50, & ResNet152) in the transfer learning task of sleep pose estimation. The ResNet152 pre-trained network outperformed the other models, surpassing both standard de novo CNN and clinical methods. This non-contact approach offers superior sleep pose estimation compared to traditional clinical techniques.
Yan et al. [42] proposed an image-based, noninvasive technique to accurately identify ten distinct sleep postures. Furthermore, various studies indicate that an incorrect sleep position can lead to physical discomfort. The methodology encompassed the analysis of leg and arm positions, enabling the classification of ten intricate sleep postures, including fetal left yearner, left log left, fetal right yearner, right log right, soldier down, faller down, soldier up, and faller up. Depth images served as input data, which underwent preprocessing, followed by classification using a deep multistream convolutional neural network. The approach was tailored to natural sleeping scenarios, accounting for situations where individuals are covered by blankets or quilts. A cohort of 22 participants engaged in recording depth images depicting the ten sleep postures, facilitating an evaluation of the network’s efficacy in classifying these postures.
Depth-camera-based systems have garnered preference in sleep monitoring due to their noncontact nature, low maintenance requirements, privacy considerations, and effective operation in low-light conditions [40]. A study conducted by Grimm et al. [43] achieved notable success in classifying the three most common sleeping postures (left-sided lying, supine, and right-sided lying) through the application of a CNN, yielding an impressive overall accuracy of 97.5%. Identifying patient posture in medical applications, like post-surgery monitoring or sleep supervision, is crucial. Claudia et al. [44] proposed a method using simple conditioning techniques and optimal texture descriptors for the SVM to classify patient postures from pressure sensor images, enhancing accuracy from 86.9% to 92.9%.
However, it is worth noting that these systems often neglect to address the practical challenge posed by blanket interference, which serves as a significant difficulty for noncontact sleep observation [45]. This study aims to develop a sleep posture classifier using deep learning models and an RGB and thermal camera in both blanketed and non-blanketed scenarios. Within this context, it implements fine-grained classification of six postures for enhanced robustness, along with coarse classification of the standard postures (supine, left log, right log, prone head, prone left, and prone right) for comparative analysis with existing studies.
A group of ten healthy adult males was recruited from Soonchunhyang University in Asan, South Korea, with an average age of 24 years, an average height of 177 cm, and an average weight of 60.6 kg. These participants did not have a reported history of severe sleep deprivation, sleep disorders, musculoskeletal pain, or deformities. The data on sleeping postures were gathered while the participants lay on a standard bed measuring 196 cm in length, 90 cm in width, and 55 cm in height. For data collection, both a thermal camera and an RGB camera were utilized. The thermal camera had a resolution of 624 × 832 pixels and operated at a frame rate of 6 frames per second (fps), while the RGB camera had a resolution of 464 × 848 pixels and operated at a frame rate of 30 fps. The acquisition duration for each video session with every participant was approximately one hour, and the dataset was systematically collected under controlled sleep conditions. The dataset was initially collected in the form of videos and subsequently transformed into individual frames based on the cameras’ frame rates. The data collection was performed under two conditions: one without a blanket and the other with a blanket.
Throughout the experiment, participants were instructed to assume six distinct sleep (recumbent) postures in the following order: (1) supine, (2) prone left, (3) prone right, (4) prone head, (5) left log, and (6) right log. Adequate time was allotted for participants to comfortably settle into their chosen posture before data collection commenced. During data collection for each posture, participants were required to maintain their designated position. Subsequently, participants were covered with both thick blankets and no blanket, except for their heads. Data collection was continuous throughout the experiment, and postures were labeled using color-coded paper positioned adjacent to the bed. A sample of the dataset is shown in Fig. 1.
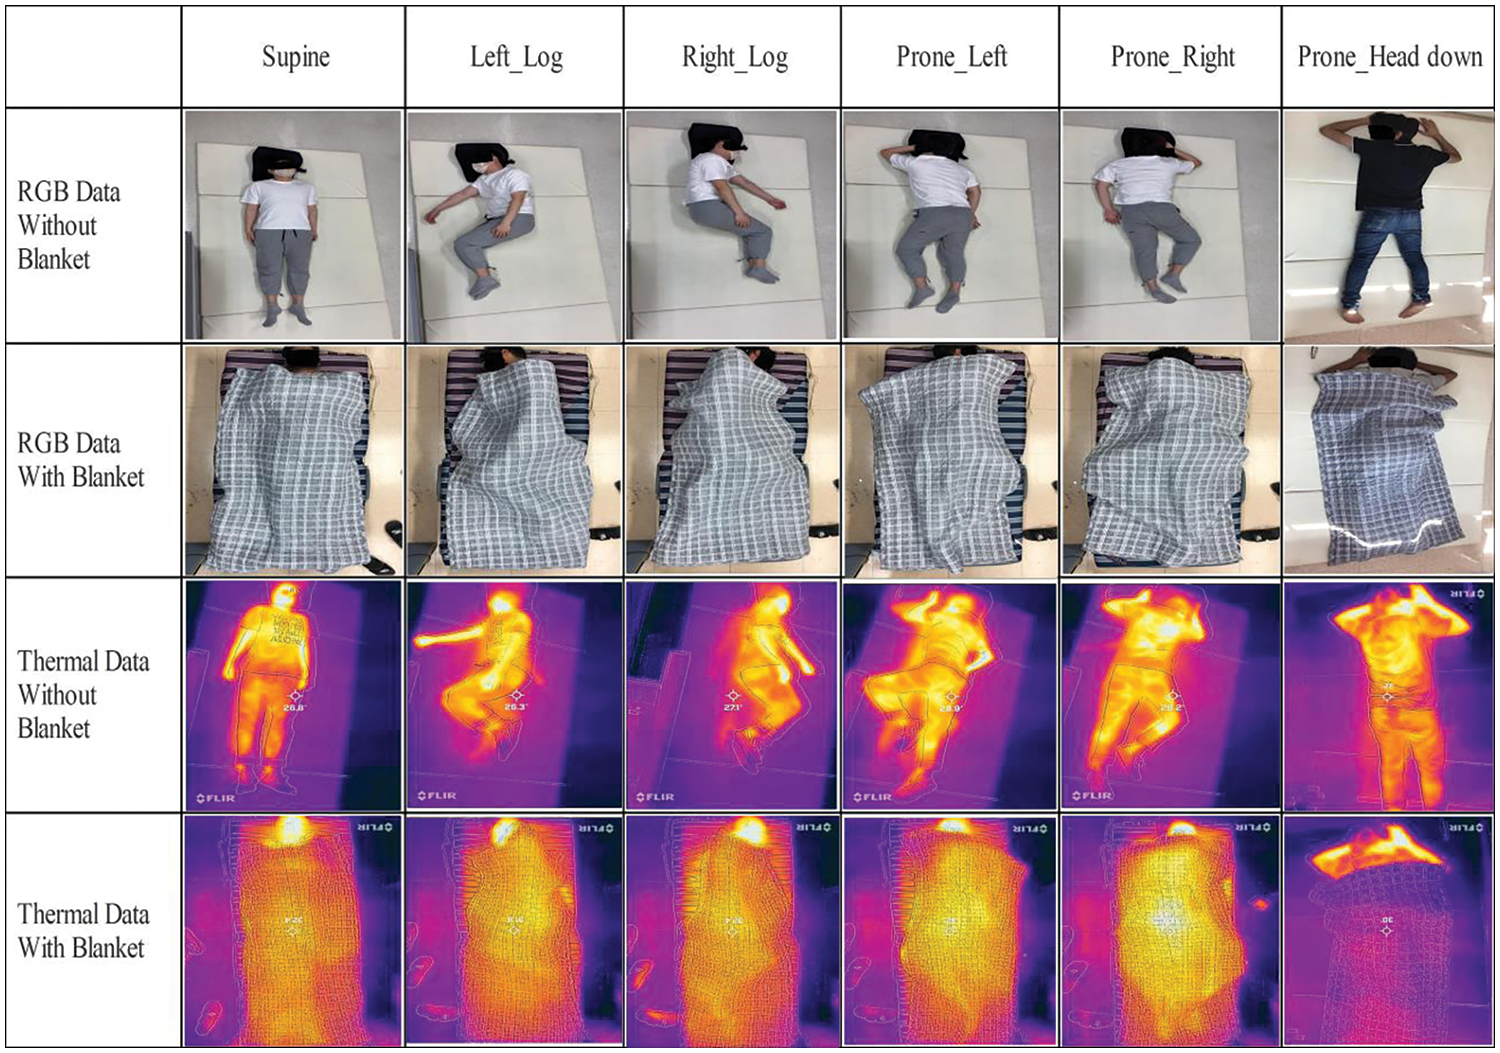
Figure 1: Sample frames of the proposed dataset
In this section, a new deep-learning method for human sleep posture image classification is proposed, as illustrated in Fig. 2. The methodology includes several distinct stages: initial preprocessing of the data, extraction of features utilizing pre-trained models, feature fusion (serially normal distribution-based fusion), and, finally, classification. This approach employs advanced techniques in deep transfer learning to enhance the performance of two existing pre-trained models, namely VGG16 and ResNet50 [46]. The choice of using VGG16 and ResNet50 in this research is based on their well-established effectiveness and suitability for the research goals. VGG16 serves as a strong baseline with a simple yet effective architecture, while ResNet50’s residual learning addresses challenges in training deep networks. Both models have been extensively validated on large-scale datasets, ensuring robust performance and comparability with existing literature. Following the extraction of features from these modified models, utilizing both RGB and thermal data, the feature vectors derived from the RGB data via both modified models are subjected to a sequential fusion process based on the normal distribution. This fusion process involves the sequential amalgamation of the resultant feature vector from the RGB data with the feature vector derived from the thermal dataset using both models. The resultant fused feature vectors are classified using the Cubic SVM.
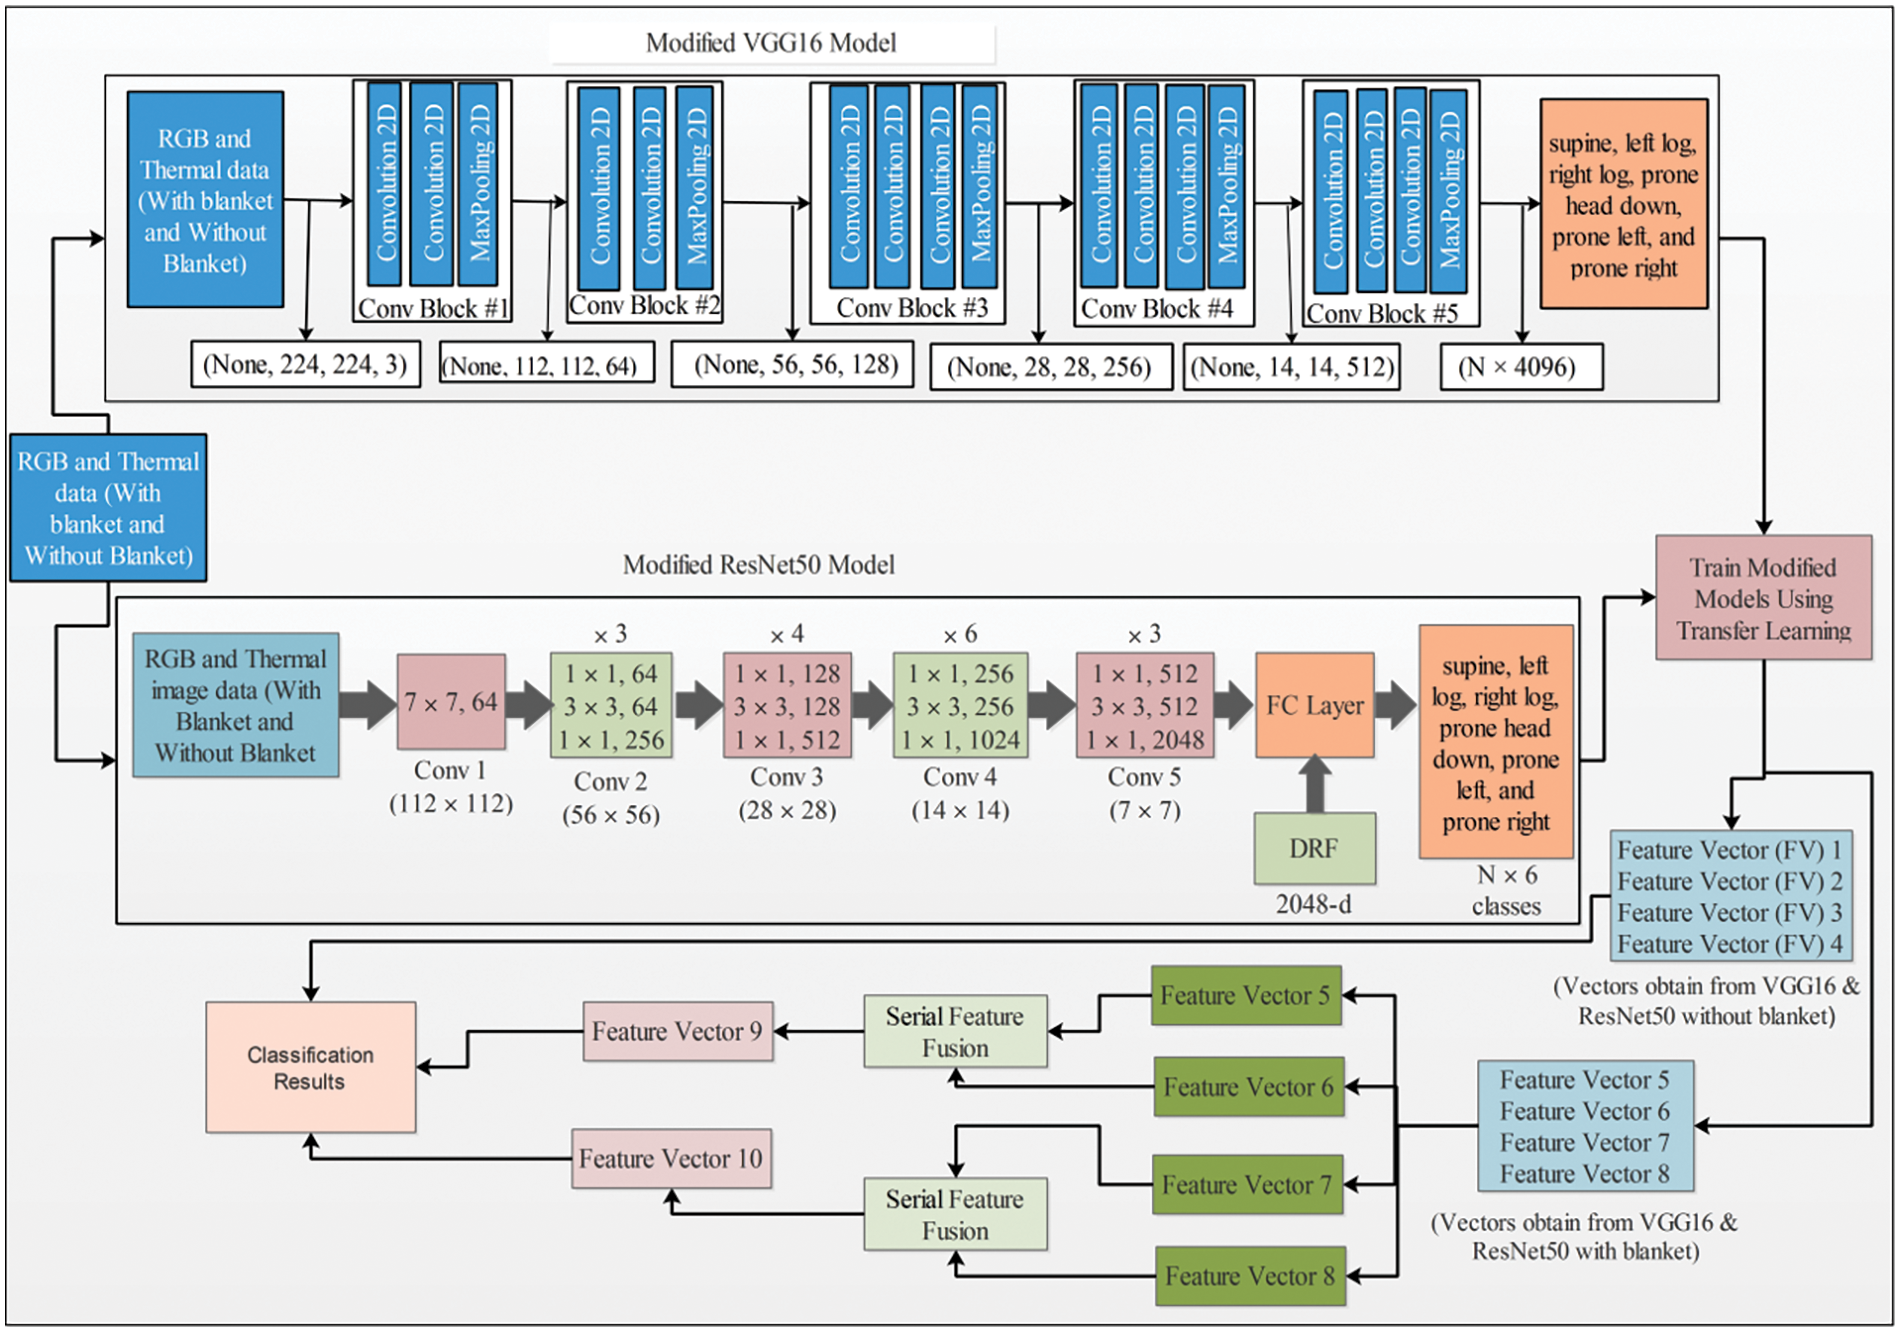
Figure 2: Proposed diagram for human sleep posture classification. ResNet50 inherent Dimension Reduction Factor (DRF) contributes to managing feature vector dimensions during extraction. Feature Vector (FV) 1 and FV 2, which were extracted from VGG16 and ResNet50 using RGB data, and FV 3 and FV 4 obtained from VGG16 and ResNet50 using thermal data, were passed to the ML classifier for classification. FV 5, FV 6, and FV 7, FV 8 were extracted from VGG16 and ResNet50 using thermal and RGB data of the blanket and were fused together to obtain FV 9 and FV 10. These features were used as an input for the final classification
3.3 Convolutional Neural Network
An effective form of artificial neural network (ANN) is the convolutional neural network (CNN), which performs better when handling large datasets [47]. Therefore, CNNs encode image features much more effectively than ANNs do for accurate pattern recognition tasks. The architecture of a CNN comprises multiple layers, including the input layer, convolutional layer, pooling layer, batch normalization layer, fully connected layer, and a culminating softmax classification layer [48,49].
The main function of the convolutional layer is to learn how to represent the input based on its features [50]. By utilizing various convolution kernels, different feature maps can be generated in the convolutional layer. Each relevant neuron in the current feature layer is perfectly coupled to each neuron in the previous layer. This is referred to as a neuron’s receptive field, according to the preceding neuron. It is important to note that each feature map is produced by sharing the kernel with all specific regions of the input data. The value of the feature at the
where
Generally, the sigmoid activation functions include tanh and the rectified linear unit (ReLU). To attain shift invariance, the resolution of the feature maps can be downscaled using pooling layers. These layers are positioned between consecutive convolutional layers. Each pooling layer is directly connected to the corresponding feature map of the preceding convolutional layer. The
where
After pooling and convolutional layers, one or more fully connected (FC) layers can be introduced to facilitate high-level reasoning. These layers establish connections between all neurons in the current layer and their corresponding counterparts in the previous layer, a technique utilized for generating global semantic information [52]. The final layer, known as the softmax layer, serves as the output layer and is employed for classification purposes. In some cases, the Support Vector Machine (SVM) is also utilized for classification, often in conjunction with CNN features [53]. In this regard,
This study possesses M-preferred input-output relationships, denoted as
Global optimization is achievable through CNN training, where the most suitable set of parameters can be determined by minimizing the loss function. A commonly employed technique for optimizing CNN networks is Stochastic Gradient Descent (SGD). To sum up, CNNs rely on key elements like convolutional layers, sigmoid activation, and pooling for effective image analysis. These components help the network learn features like edges and shapes. The shared kernel simplifies learning, activation functions add complexity, and pooling reduces data size. Fully connected layers enable high-level reasoning, and training using methods like SGD minimizes errors. The loss function measures the gap between predicted and actual outcomes, guiding the network’s improvement. In essence, these components and techniques make CNNs powerful tools for accurate pattern recognition in large datasets.
3.4 Feature Extraction Fine-Tuned VGG16 Model
The notable feature of the VGG16 model is its focus on simplicity [54], characterized by the use of uniform
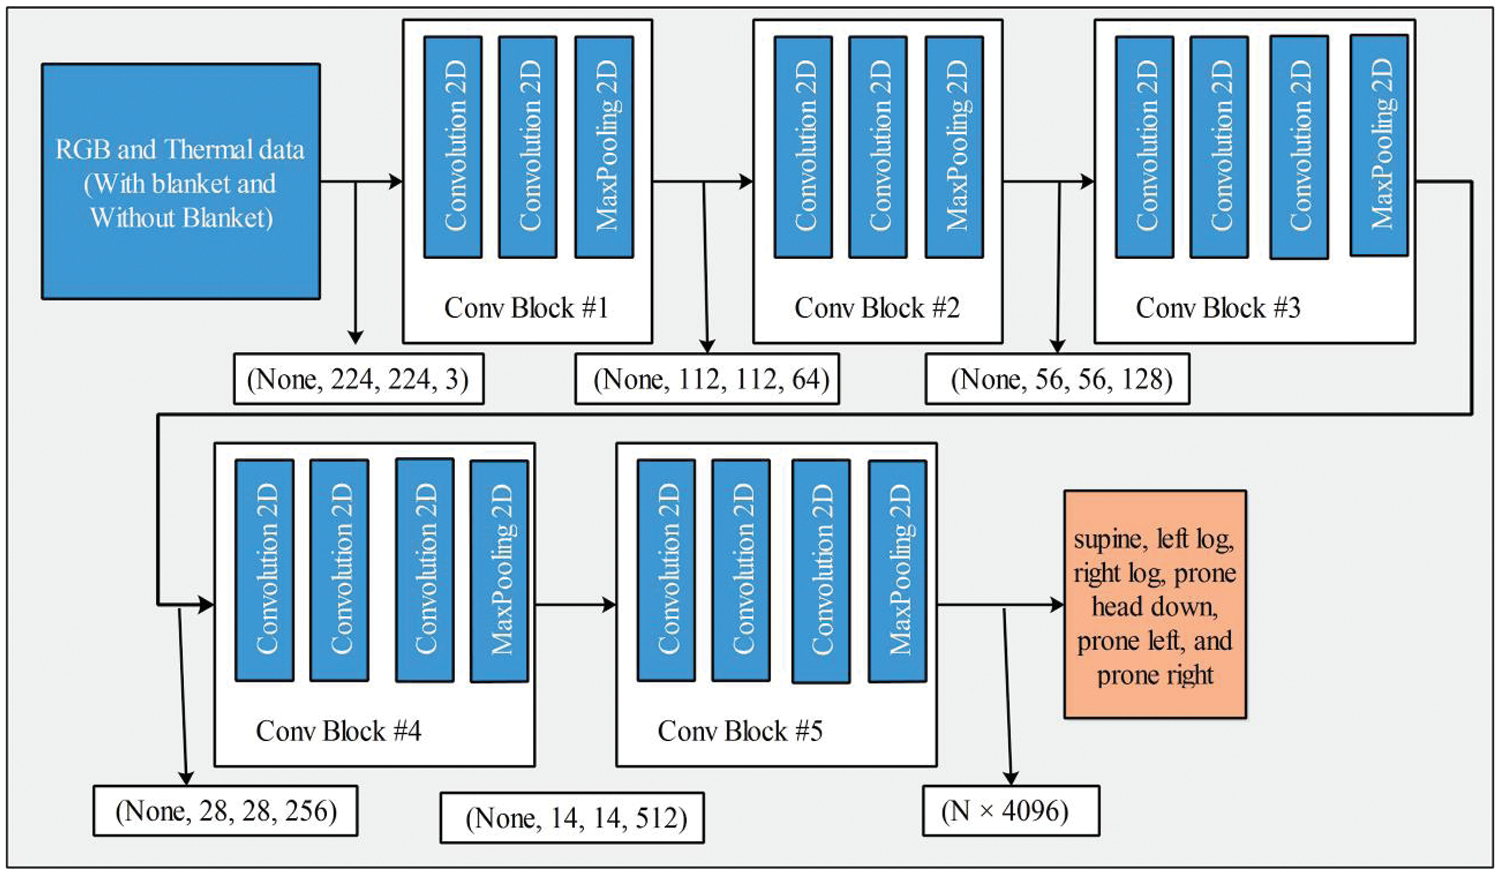
Figure 3: Fined tuned architecture of VGG16 model
3.5 Feature Extraction Fine-Tuned ResNet50 Model
The ResNet architecture has gathered appreciation for its exceptional performance in facilitating a more direct information flow within the network, effectively addressing the issue of disappearing gradients during backpropagation. By combining shortcut connections, which define residual networks, the architecture offers the advantage of bypassing layers that might not significantly contribute to the training process. The ResNet50 architecture is comprised of a
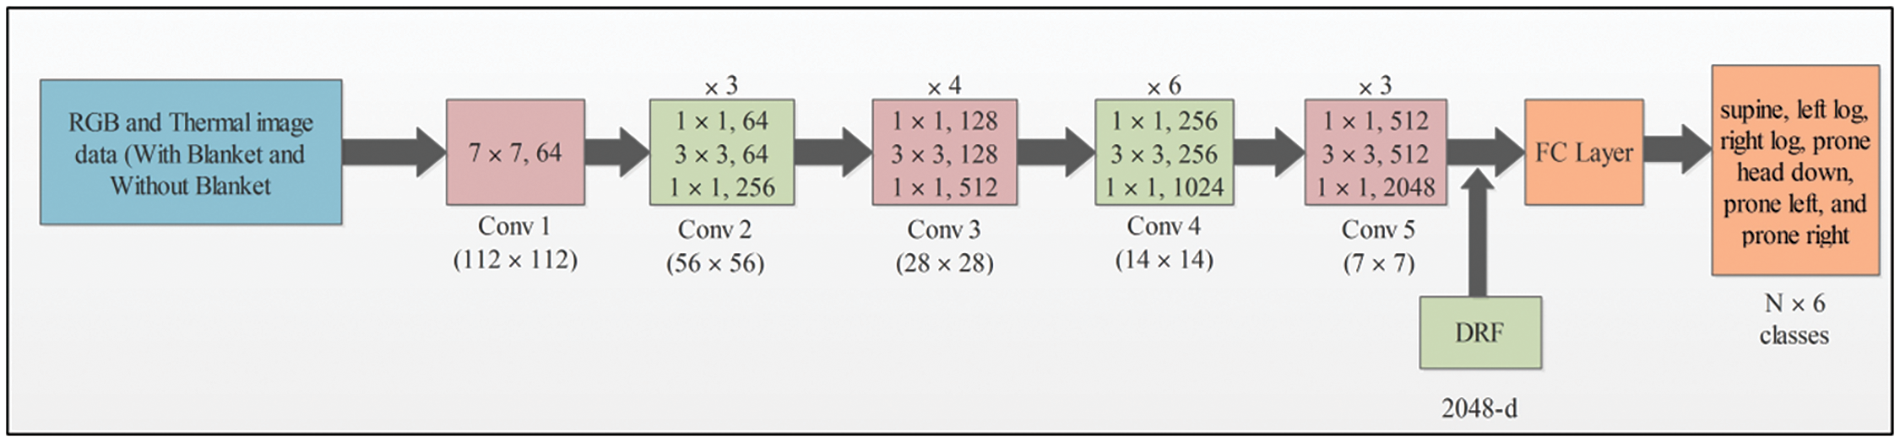
Figure 4: Fined tuned architecture of VGG16 model
3.6 Novelty: Proposed Feature Fusion
Feature fusion is a critical process aimed at enhancing object accuracy by amalgamating distinct characteristics of the same entity. This article introduces a novel approach for feature fusion based on a precision-focused serial method with a normal distribution. The proposed method comprises three key steps: (i) fusion of extracted features from the RGB and thermal datasets using the VGG16 model, (ii) fusion of features obtained from both datasets using the ResNet50 model, and (iii) utilization of the resulting vectors from both the VGG16 and ResNet50 models as inputs for machine learning classifiers.
where
where
The final fused vector is defined based on the value of
where
This section provides a detailed experimental process for the proposed framework. The results are presented using visual graphs and well-defined performance measures to provide a comprehensive and clear evaluation of the methodology herein. In this study, the HSP image dataset was divided into training and testing sets with an 80:20 ratio. The training process was configured with specific parameters, including 100 iterations, 100 epochs, a minibatch size of 34, and a learning rate set at 0.0001. SGD served as the optimization algorithm. A 5-fold cross-validation was executed, assessing multiple classifiers across a range of performance metrics, including precision, rate, recall, and accuracy. All simulations were conducted using MATLAB 2022a. The study was carried out on a Core i7 processor and 8 GB of RAM.
4.1 Numerical Results without Blanket Using Thermal and RGB Data
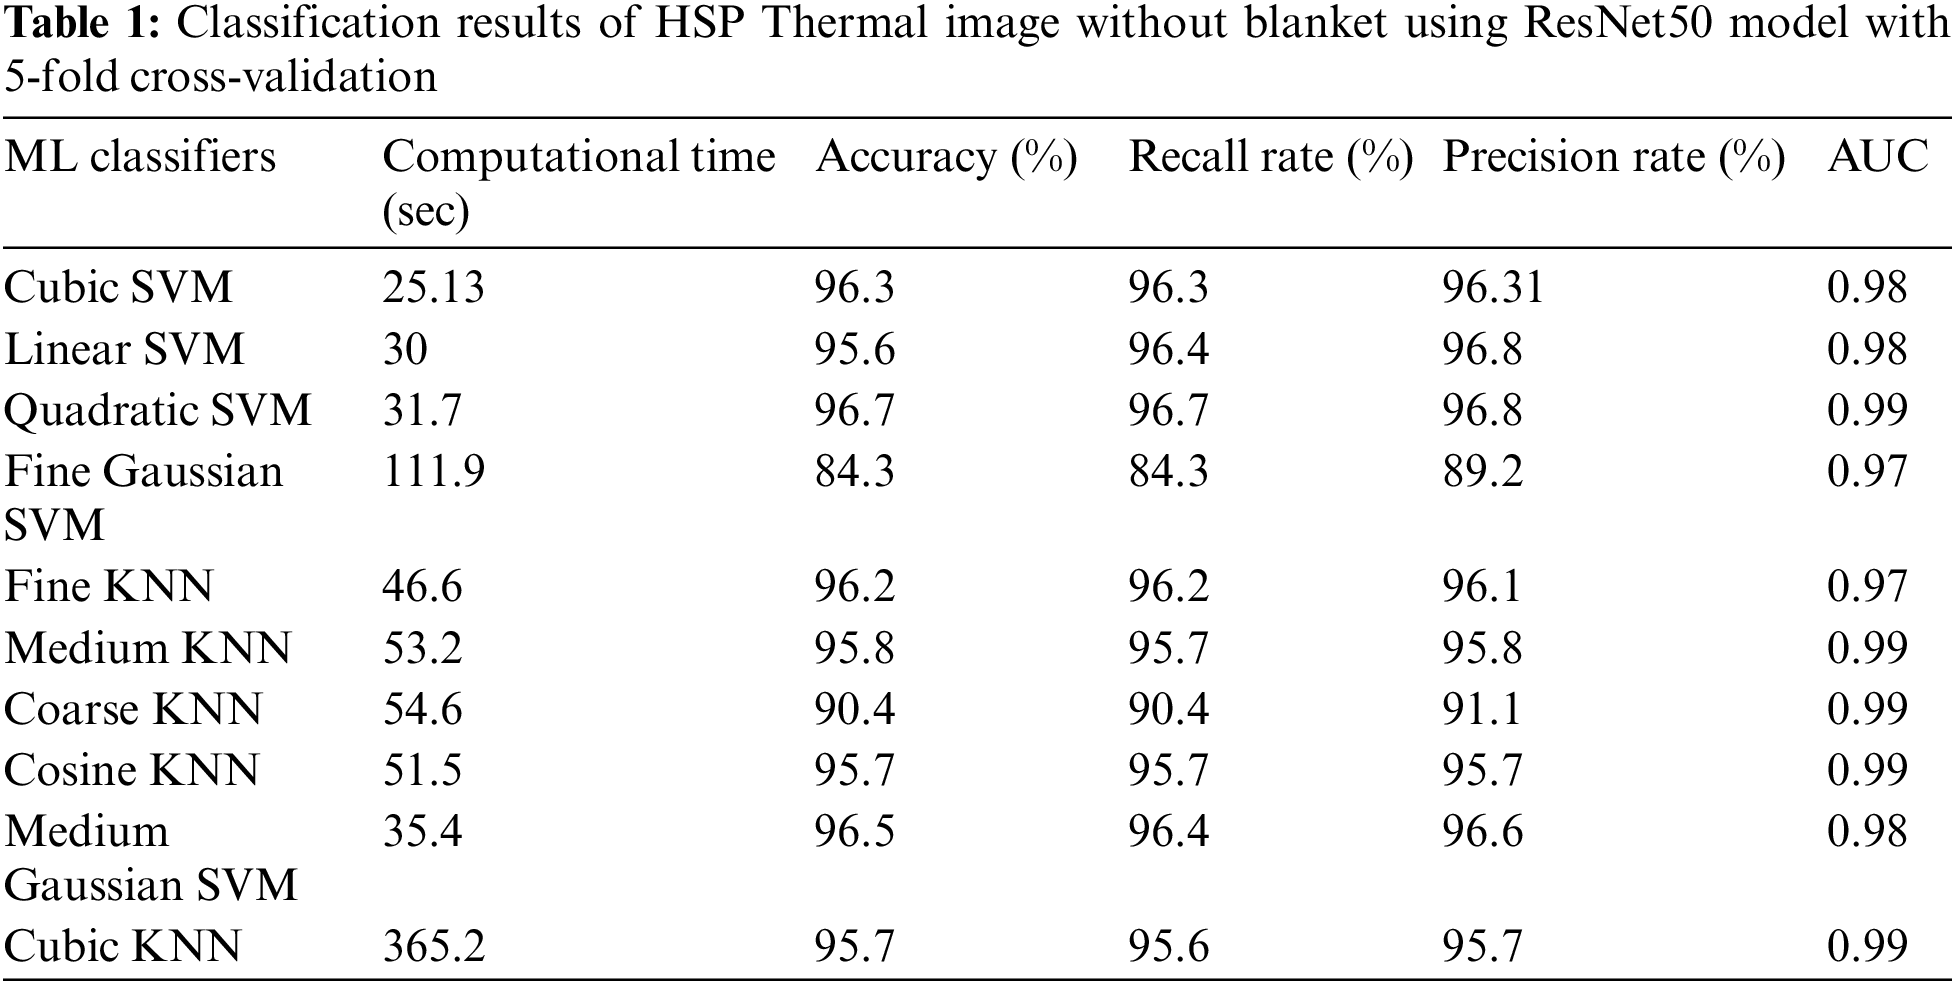
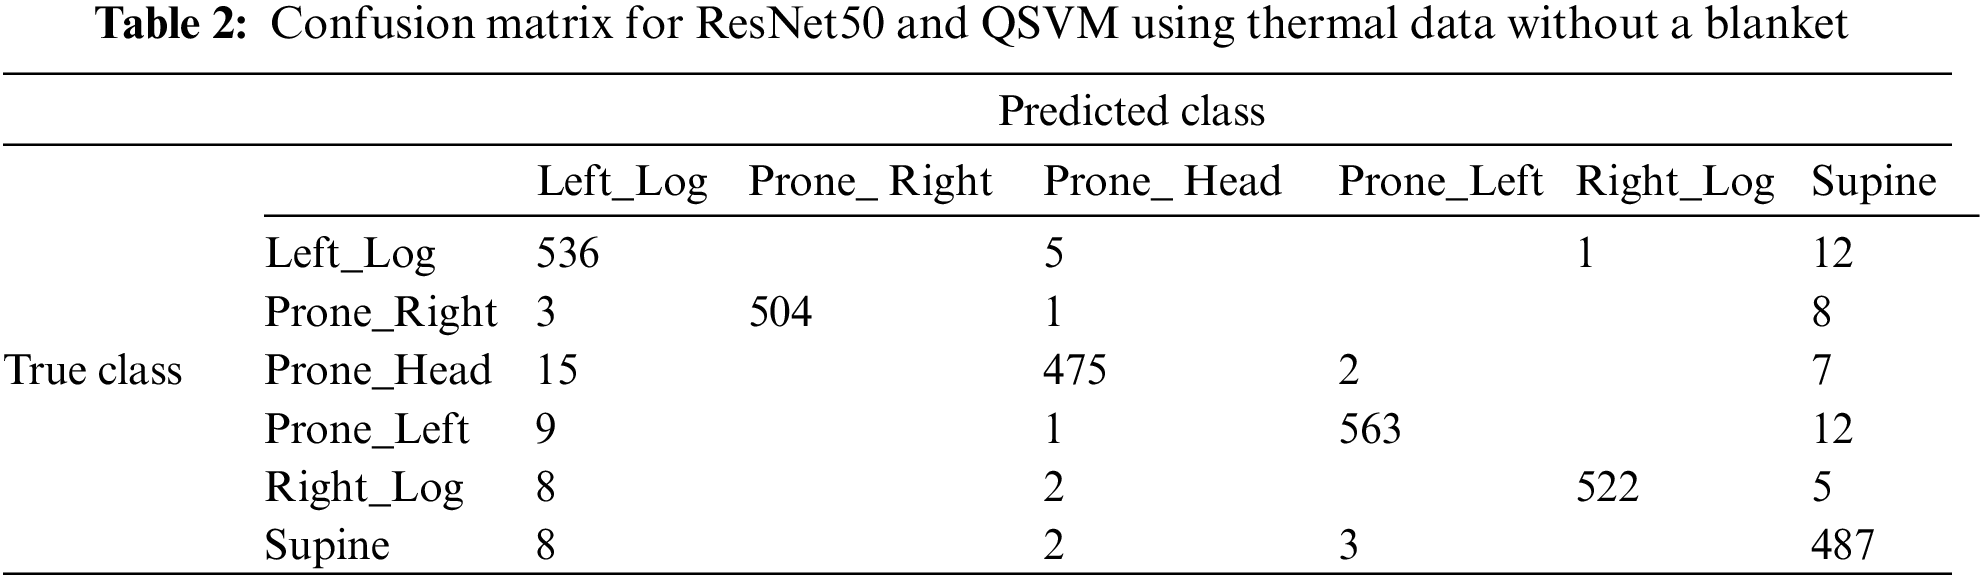
In this subsection, the classification results of HSP have been discussed, employing two distinct deep-learning models: ResNet50 and VGG16. Two diverse datasets were employed in the experiments, one consisting of thermal images and the other of RGB (HSP) images, both without any blankets. Various ML classifiers were applied, including Linear SVM (LSVM), Quadratic SVM (QSVM), Cubic SVM (CSVM), Fine Gaussian SVM (FGSVM), Fine KNN (FKNN), Medium KNN (MKNN), Coarse KNN (CKNN), Cosine KNN, Medium Gaussian SVM (MGSVM), and Cubic KNN. The results for the ResNet50 model with RGB data are presented in Table 1. The highest accuracy of 96.7% was achieved by the QSVM classifier when using the ResNet50 model. This model yielded computational time, recall rate, precision rate, and AUC values of 31.7 s, 96.7%, 96.8%, and 0.99, respectively. The second-highest accuracy of 96.5% was obtained with the MGSVM classifier, resulting in computational time, recall rate, precision rate, and AUC values of 35.4 s, 96.4%, 96.6%, and 0.99. The difference in accuracy between the top two models was only 0.2%. The third-best accuracy, standing at 96.3%, was achieved by the QSVM classifier, along with computational time, recall rate, precision rate, and AUC values of 25.13 s, 96.3%, 96.31%, and 0.98, respectively. Based on the confusion matrix for ResNet50 and QSVM, Table 2 shows that the developed model performs better in the supine class than in the other classes, like the prone_head class.
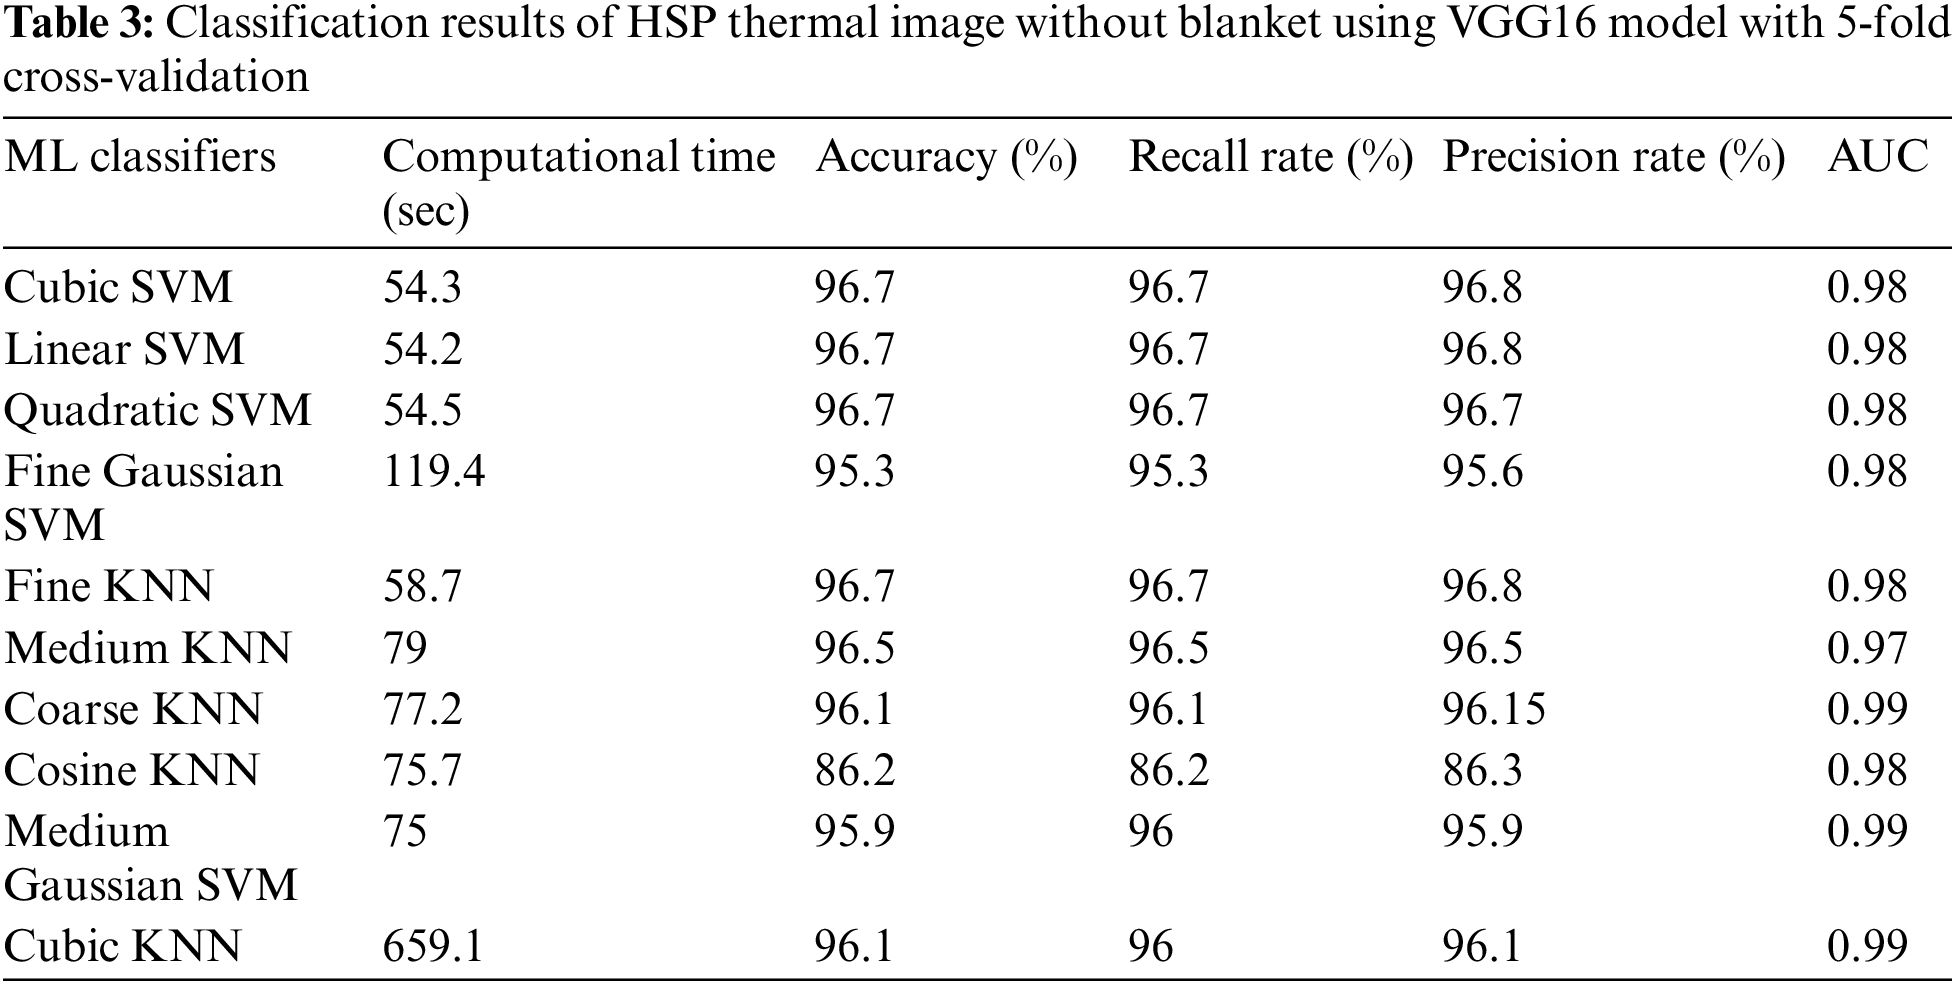
The classification results of the VGG16 model for the HSP dataset using thermal images and without blankets are shown in Table 3. The tested features from VGG16 were passed to ten ML classifiers. The highest accuracy of 96.7% was achieved by the CSVM classifier when using the VGG16 model. This model yielded computational time, recall rate, precision rate, and AUC values of 54.3 s, 96.7%, 96.8%, and 0.98, respectively. The second-highest accuracy of 96.5% was obtained with the FKNN classifier, resulting in computational time, recall rate, precision rate, and AUC values of 79 s, 96.5%, 96.5%, and 0.97. The difference in accuracy between the top two models was 0.2%. The third-best accuracy, standing at 96.1%, was achieved by the CKNN classifier, along with computational time, recall rate, precision rate, and AUC values of 659 s, 96%, 96.1%, and 0.99, respectively. Based on the confusion matrix for VGG16 and CSVM, Table 4 shows that the developed model performs better in the supine class than in the other classes.

The classification results of the VGG16 model for the HSP dataset using RGB images and without blankets are shown in Table 5. The extracted test features from VGG16 were passed to ten ML classifiers. The highest accuracy of 96.5% was achieved by the CSVM classifier when using the VGG16 model. This model yielded computational time, recall rate, precision rate, and AUC values of 88.2 s, 96.3%, 96.4%, and 0.99, respectively. The second-highest accuracy of 94.6% was obtained from the Cosine KNN classifier, resulting in computational time, recall rate, precision rate, and AUC values of 74.2 s, 94.6%, 94.4%, and 0.98. The difference in accuracy between the top two models was 1.9%. The third-best accuracy, standing at 94.3%, was achieved by the MGSVM classifier, along with computational time, recall rate, precision rate, and AUC values of 92 s, 94.3%, 94.4%, and 0.99, respectively. Based on the confusion matrix for VGG16 and QSVM, Table 6 shows that the developed model performs better in the left_log and prone_left classes than in the other classes.
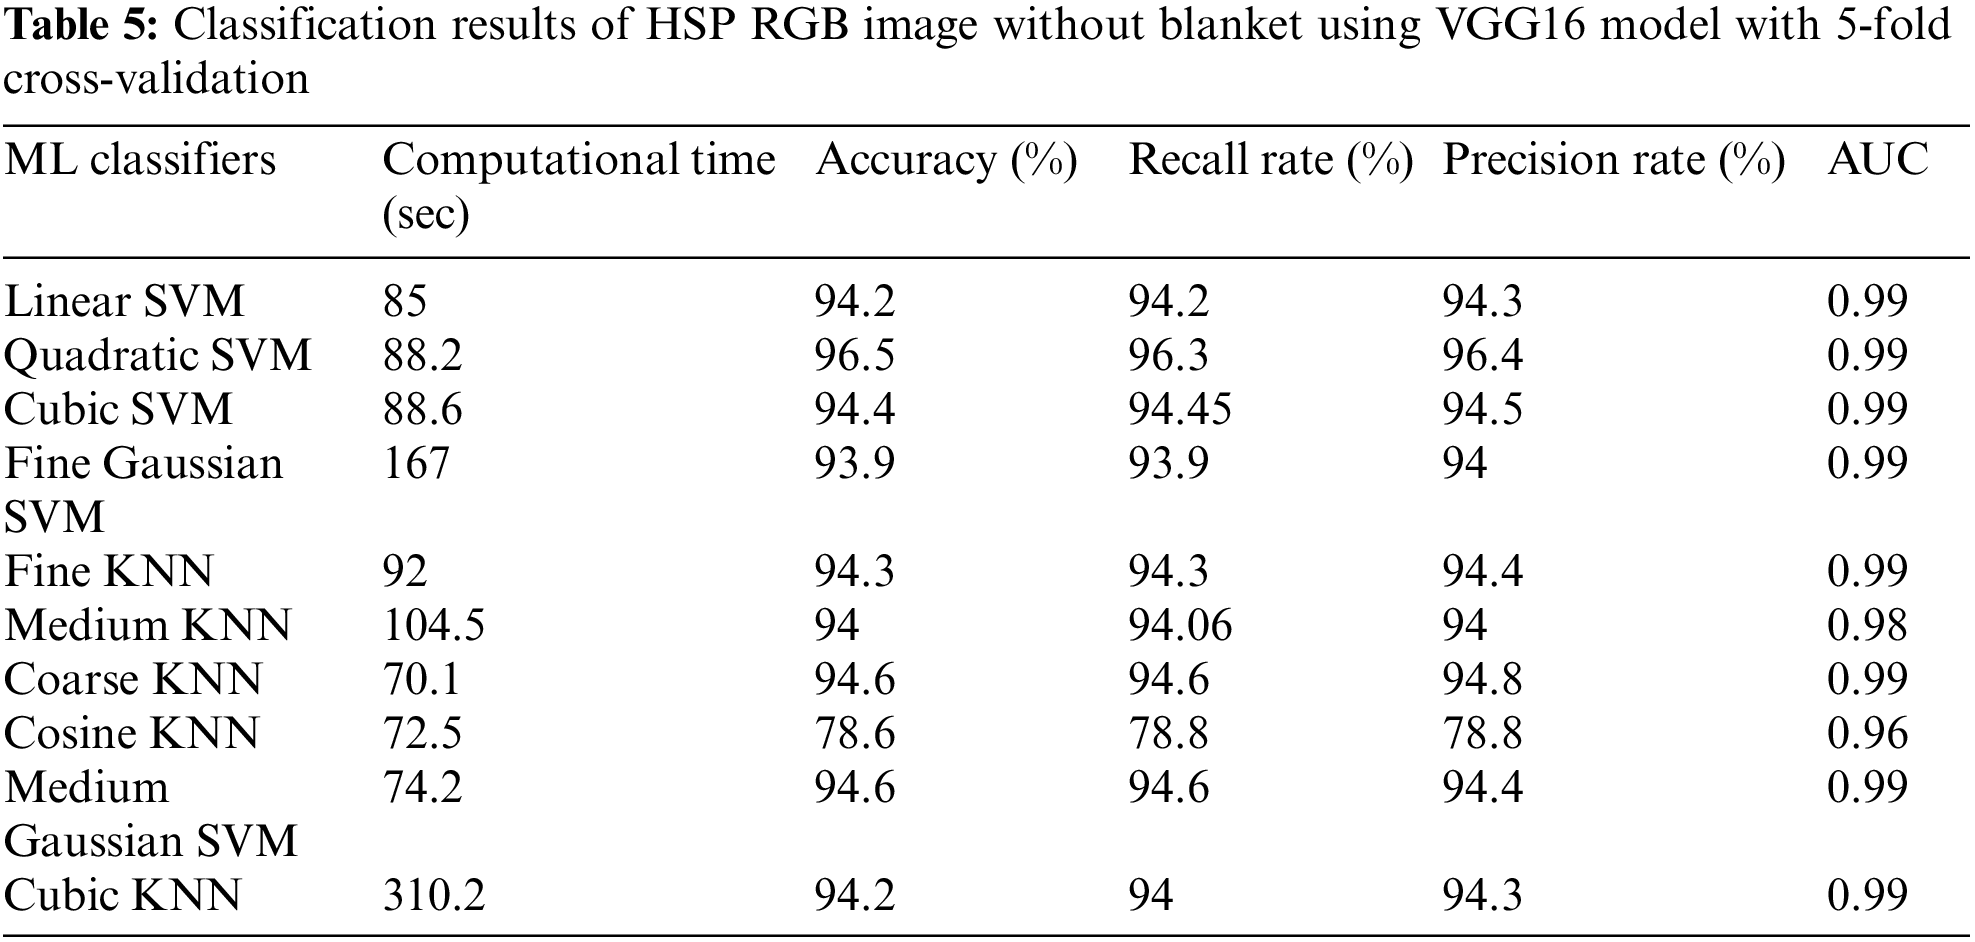
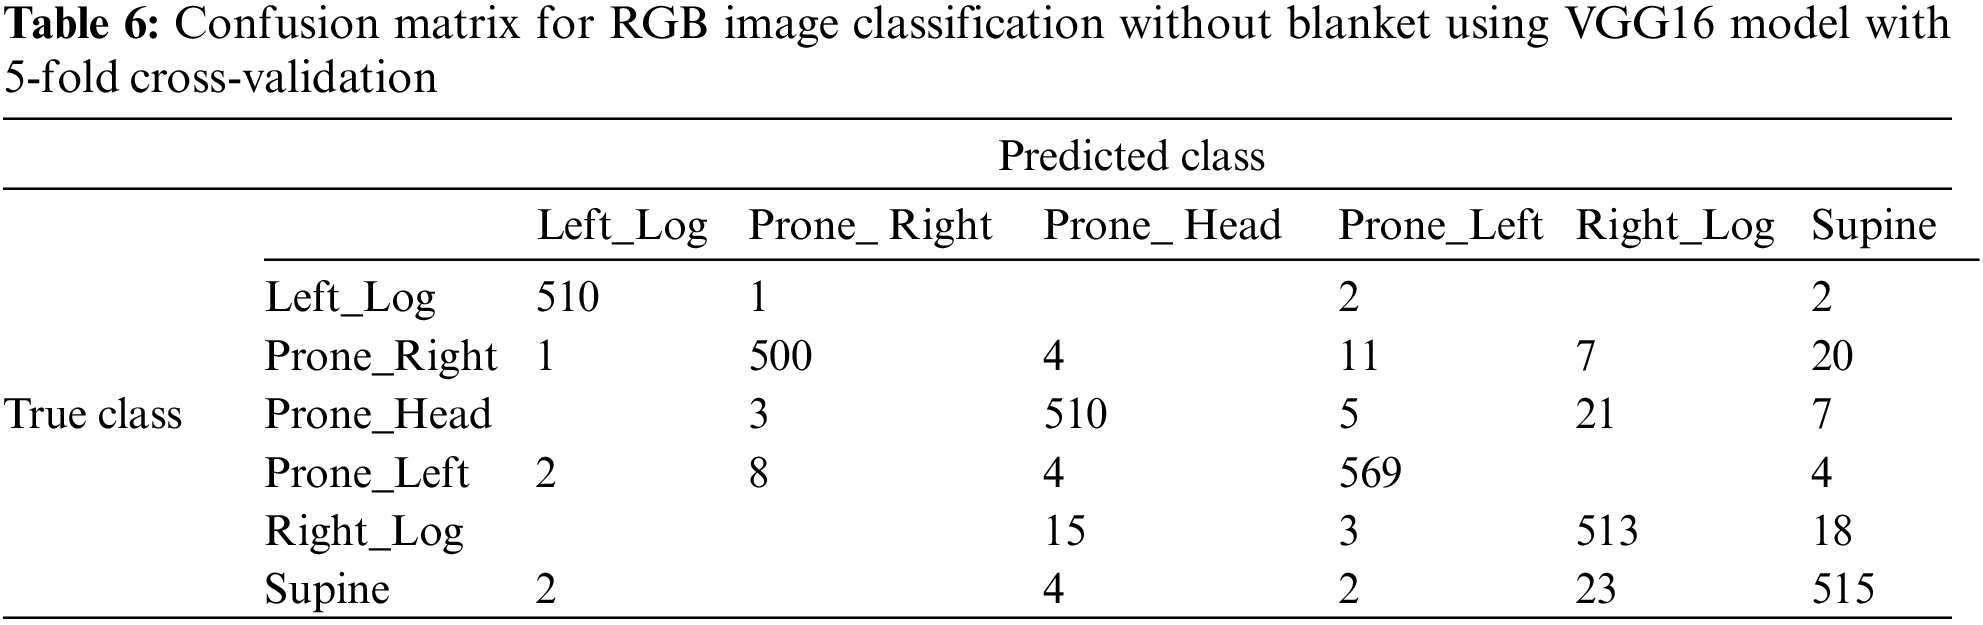
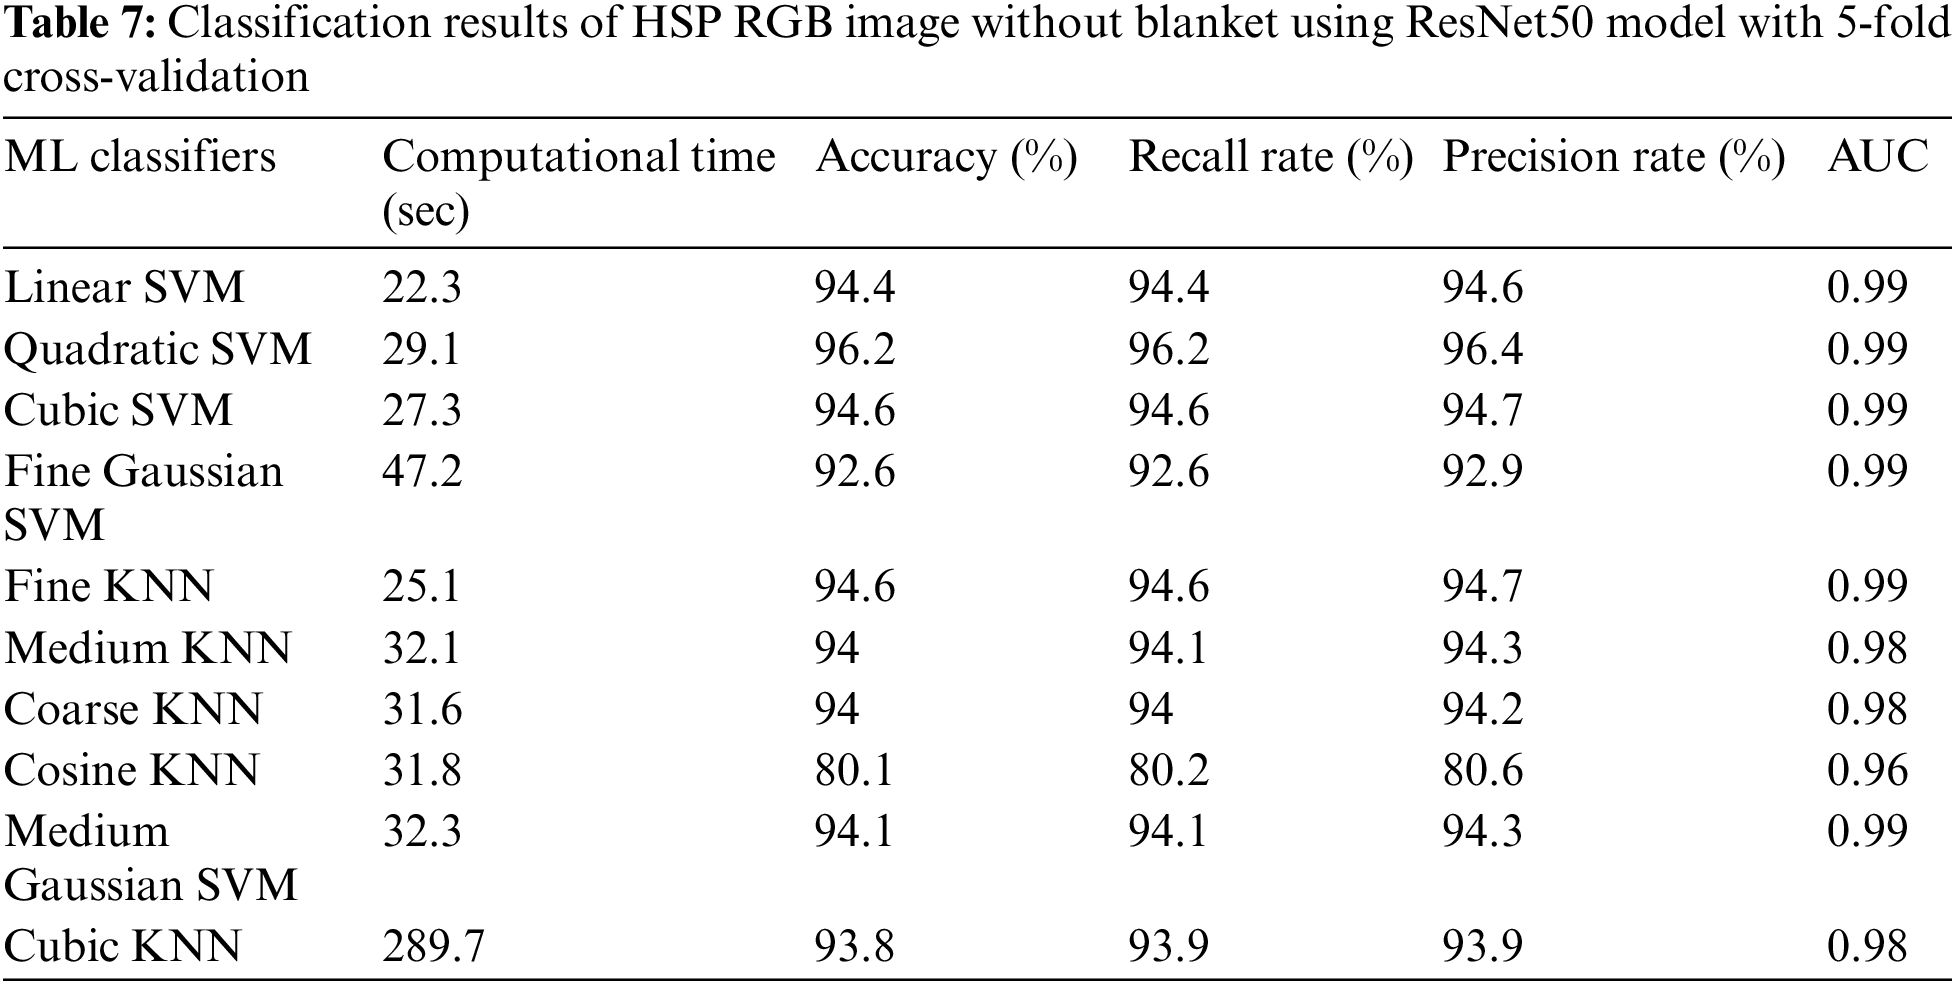
Table 7 presents the classification results of the ResNet50 model for the HSP dataset using RGB images without blankets. The extracted test features from ResNet50 were passed to ten different ML classifiers. The highest accuracy, 96.2%, was achieved by the QSVM classifier when employing the ResNet50 model. This model yielded computational time, recall rate, precision rate, and AUC values of 29.1 s, 96.2%, 96.6%, and 0.99, respectively. The second-highest accuracy, 94.6%, was obtained from the Cosine KNN classifier, resulting in computational time, recall rate, precision rate, and AUC values of 27.3 s, 94.6%, 94.7%, and 0.99. The accuracy difference between the top two models was 1.6%. The third-highest accuracy, 94.1%, was achieved by the Cosine KNN classifier, along with computational time, recall rate, precision rate, and AUC values of 32.3 s, 94.1%, 94.3%, and 0.99, respectively. Based on the confusion matrix for ResNet50 and QSVM, Table 8 shows that the model performs better in the left_log class and worse in the prone_right class.

4.2 Numerical Results with Blanket Using Thermal and RGB Data
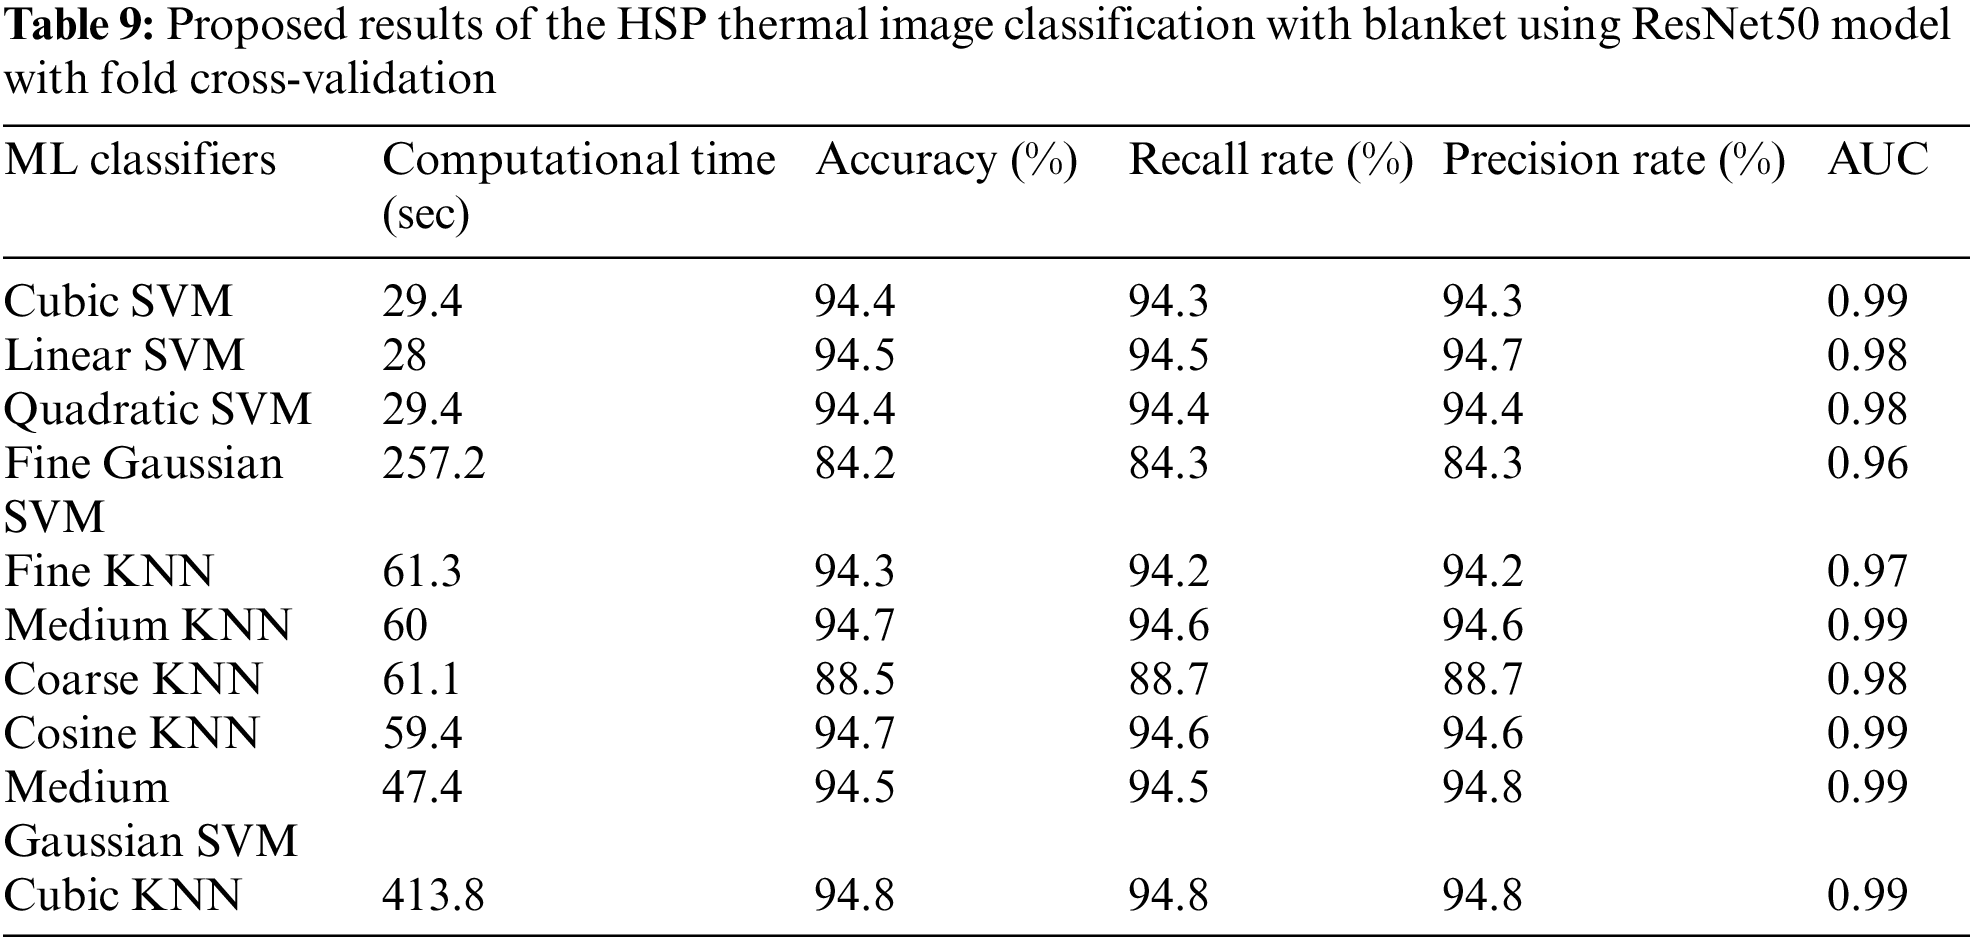
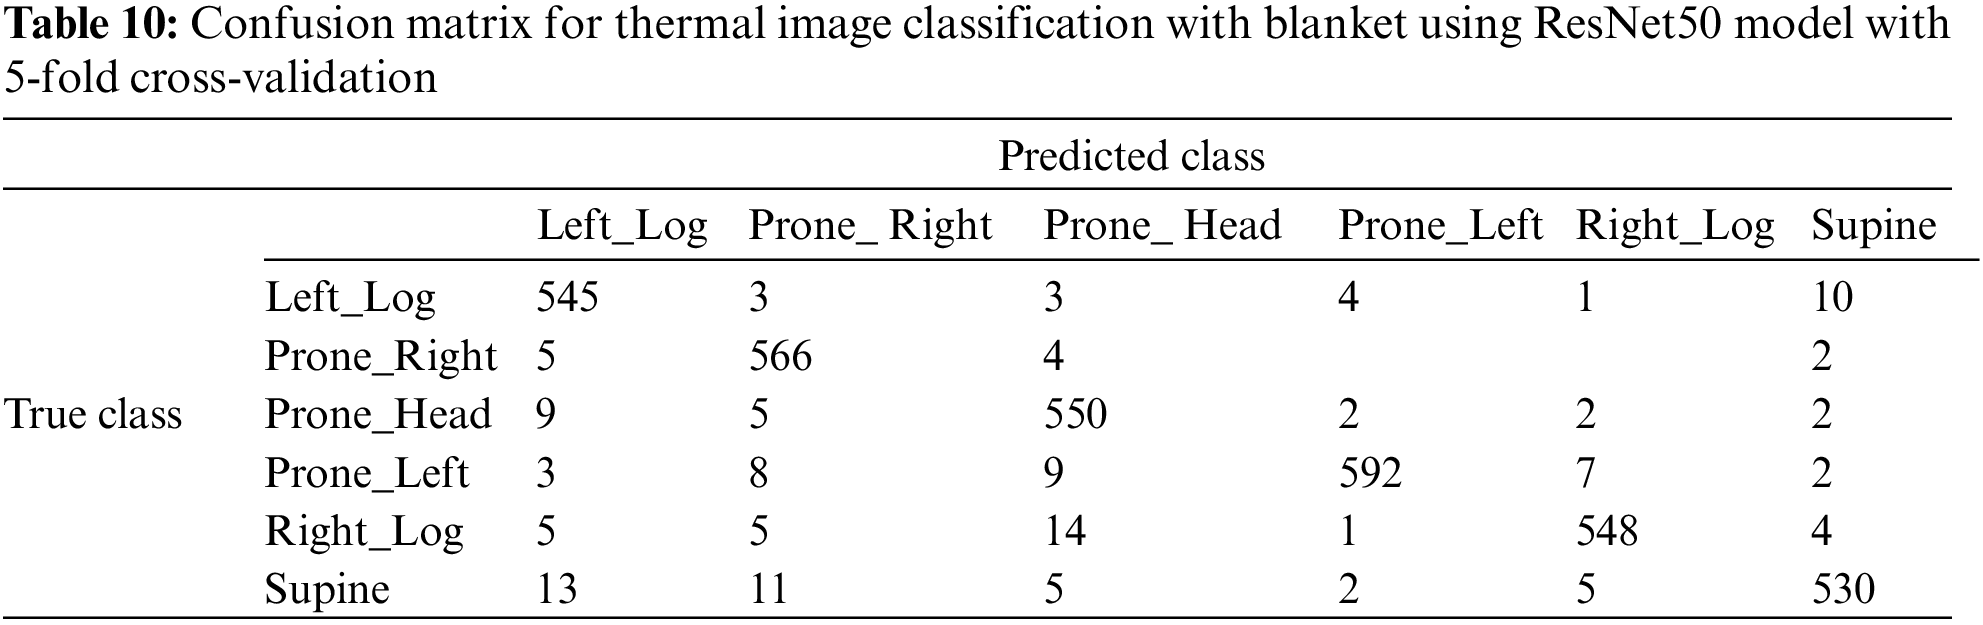
This section presents the results of analyzing HSP images using both thermal and RGB data with blankets included in the dataset. The results were computed from two modified deep-learning models, ResNet50 and VGG16. The results for the proposed ResNet50 model, utilizing thermal data from blankets, are presented in Table 9. The highest accuracy, 94.8%, was achieved by the Cubic KNN classifier when the ResNet50 model was used. This model shows performance metrics, including computational time, recall rate, precision rate, and AUC values of 413.8 s, 94.8%, 94.8%, and 0.99. The results of the Cubic KNN are superior to those of the other classifiers, but the computational time is significantly higher compared to the others. The Cosine KNN classifier achieved the second-highest accuracy, 94.7%, with corresponding performance values of 59.4 s, 94.6%, 94.6%, and 0.99. Notably, the accuracy gap between these two top-performing models was only 0.1%. Furthermore, the LSVM classifier achieved the third-highest accuracy, 94.5%, with corresponding performance values of 28 s, 94.5%, 94.7%, and 0.98. Based on the confusion matrix for ResNet50 and CKNN, Table 10 shows that the developed model herein performs better in the prone_right and prone_head classes than in the other classes.
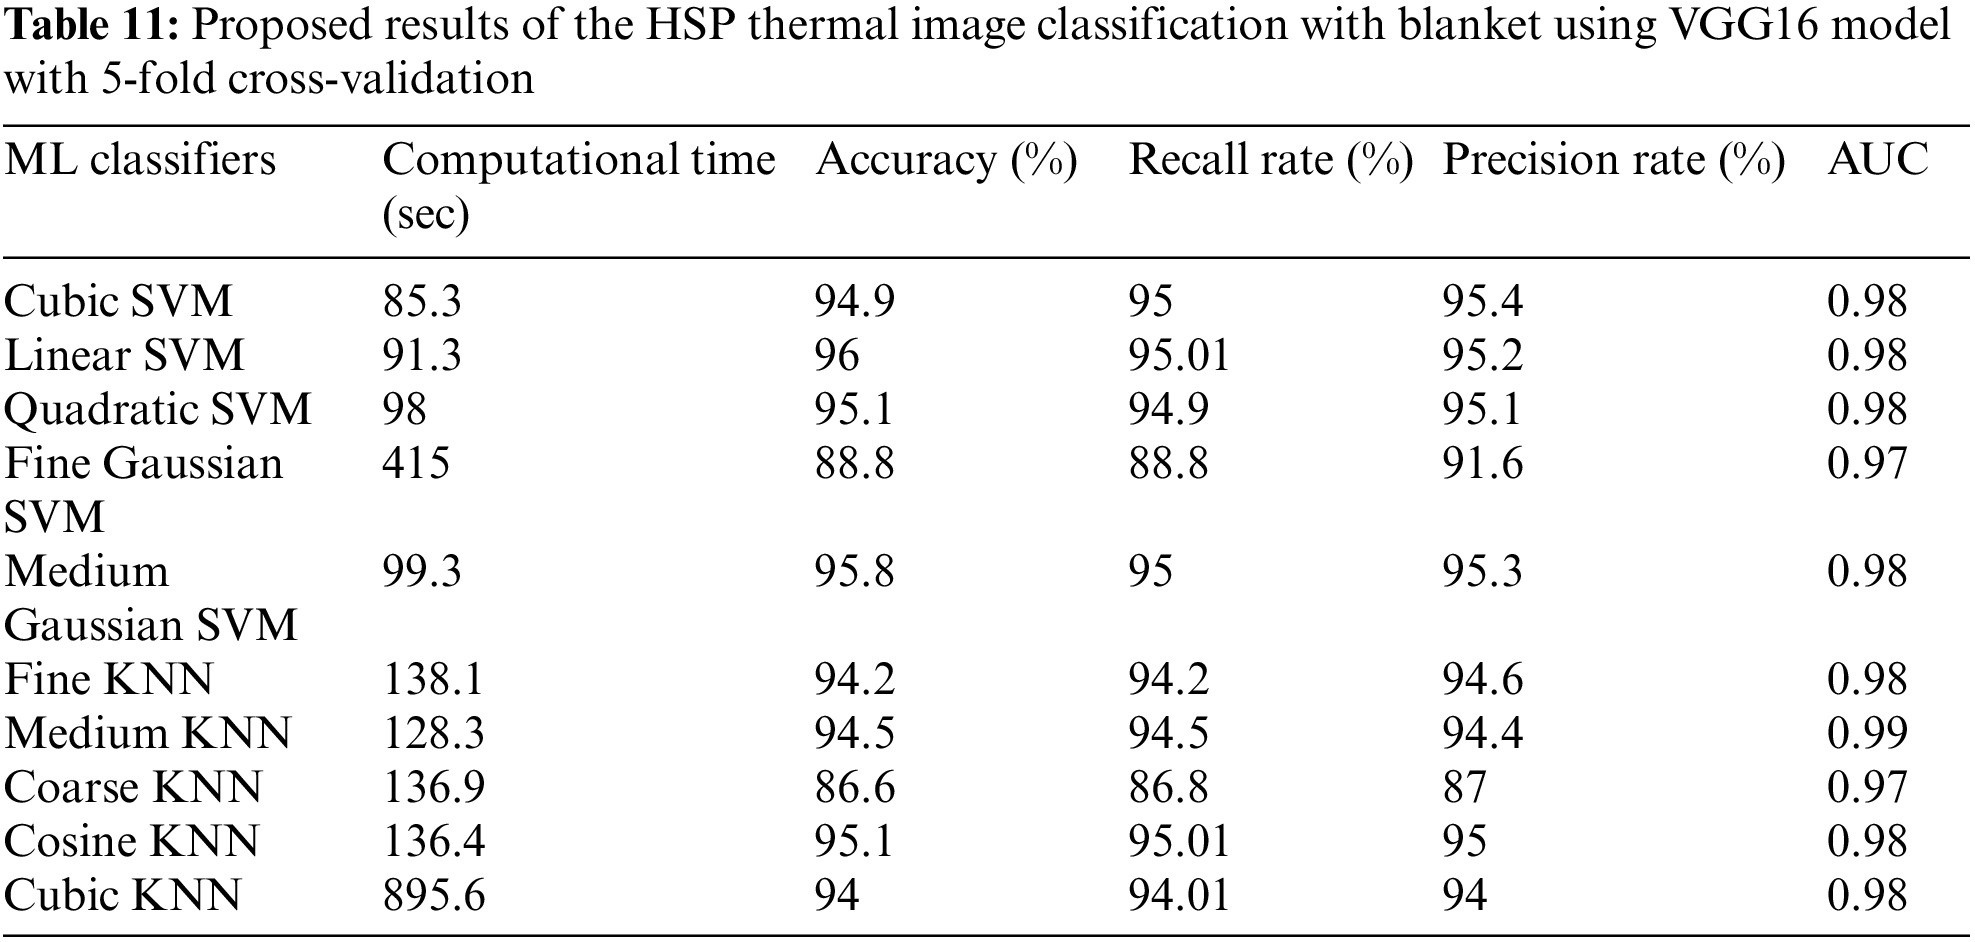
The classification results of the VGG16 model for the HSP dataset using thermal images with blankets are shown in Table 11. The extracted test features from VGG16 were passed to ten ML classifiers. The highest accuracy, 96%, was achieved by the LSVM classifier when using the VGG16 model. This model shows performance metrics, including computational time, recall rate, precision rate, and AUC values of 91.3 s, 95.01%, 95.2%, and 0.98, respectively. The second-highest accuracy, 95.8%, was obtained by the MGSVM classifier, resulting in computational time, recall rate, precision rate, and AUC values of 99.3 s, 95%, 95.3%, and 0.98. The accuracy and computational time difference between the top two models was 0.2% and 8 s, respectively. The third-best accuracy, 95.1%, was achieved by the QSVM classifier, along with computational time, recall rate, precision rates, and AUC values of 98 s, 94.9%, 95.1%, and 0.98, respectively. Based on the confusion matrix for VGG16 and LSVM, Table 12 shows that the developed model herein performs better in the prone_right class than in the other classes.

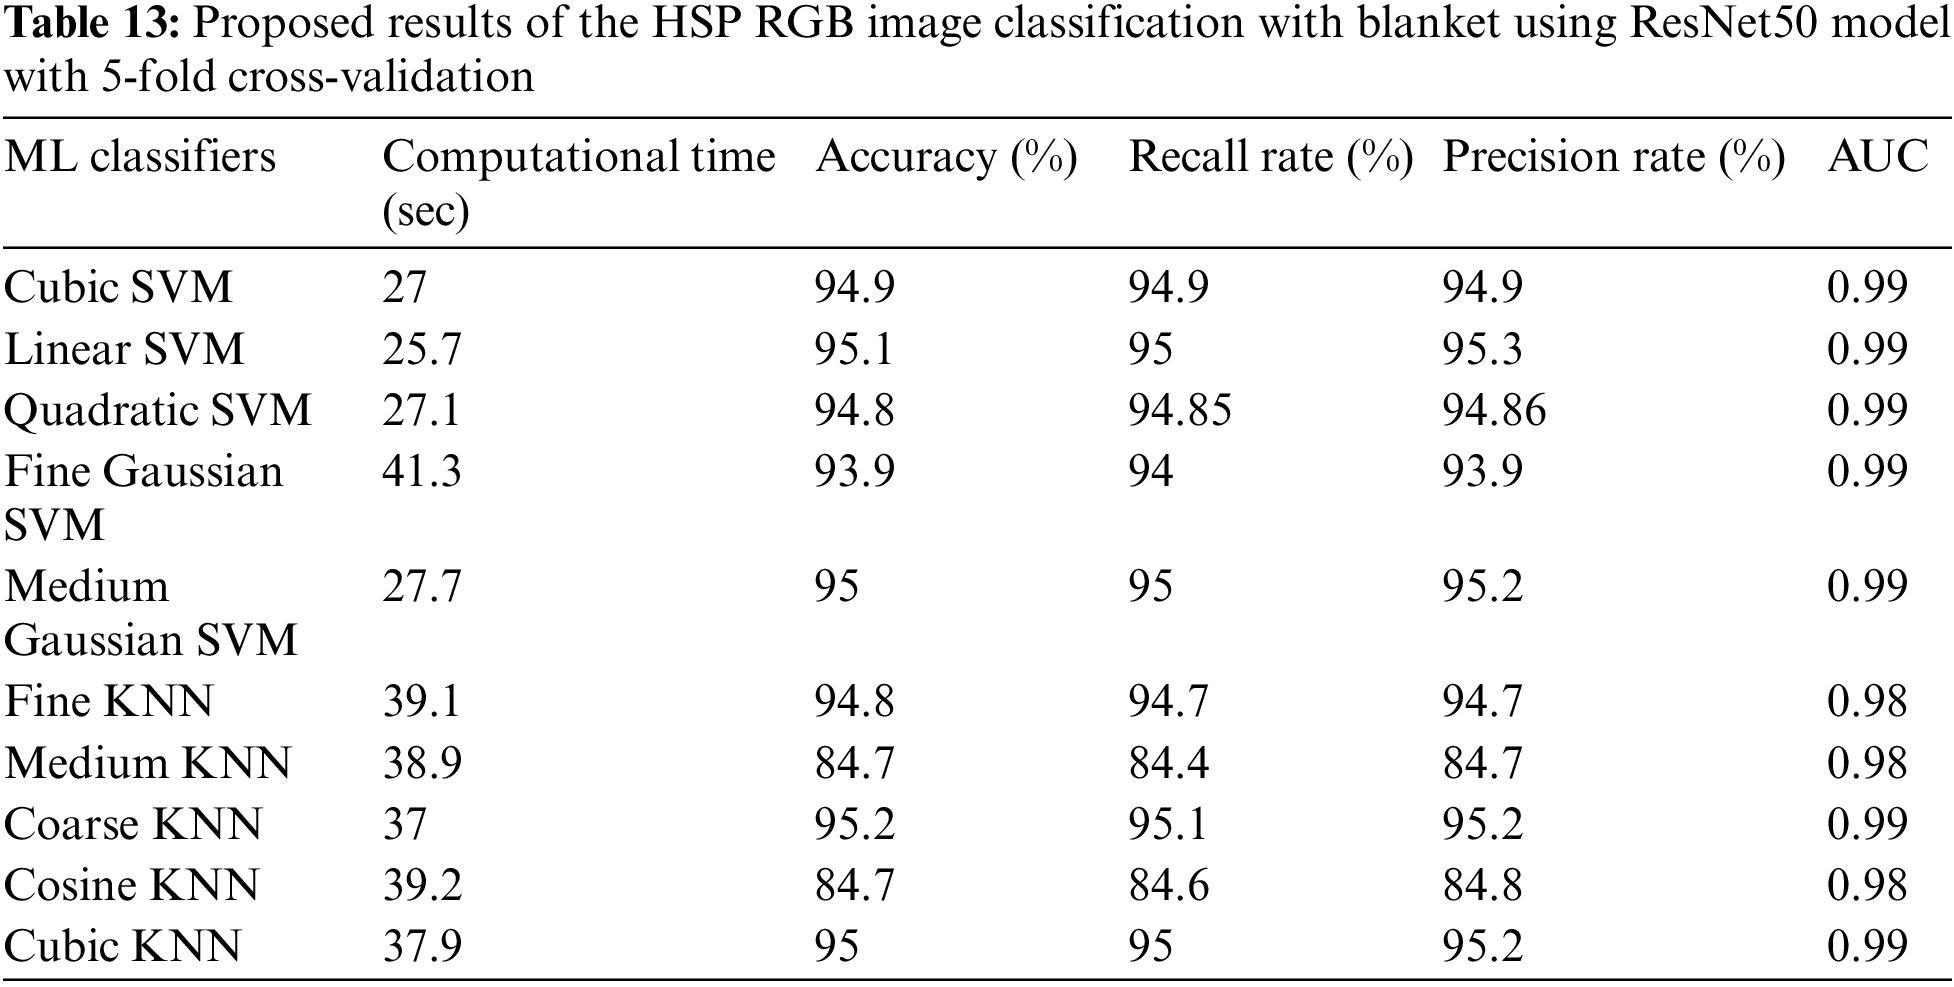
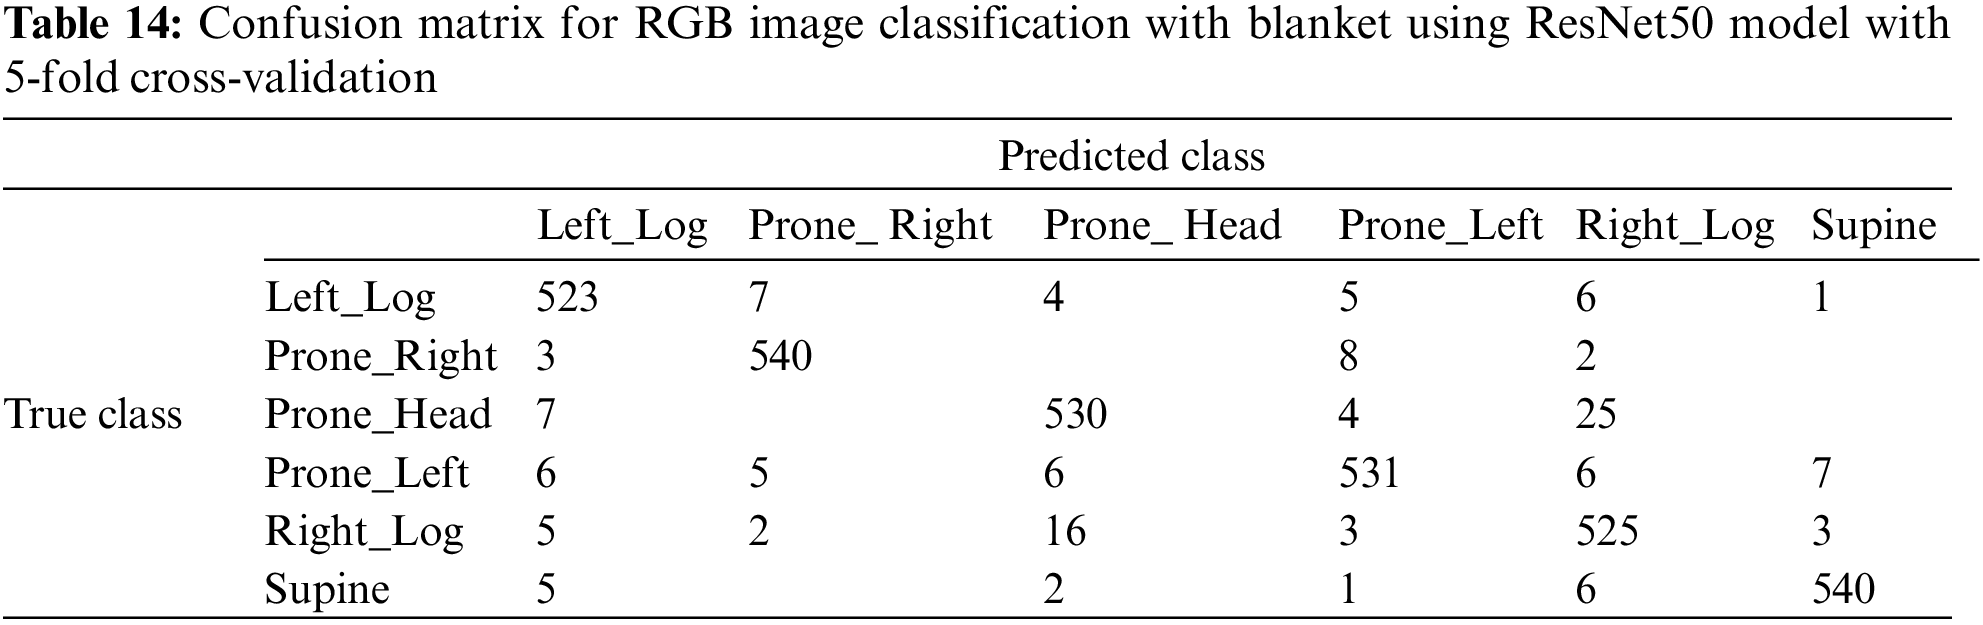
The classification results of the ResNet50 model for the HSP dataset, using RGB images and blankets, are shown in Table 13. The extracted test features from ResNet50 were passed to ten ML classifiers. The highest accuracy, 95.2%, was achieved by the Coarse KNN classifier while using the ResNet50 model. This model demonstrates performance metrics, including computational time, recall rate, precision rate, and AUC value, of 37 s, 95.1, 95.2, and 0.99, respectively. The second highest accuracy, 95.1%, was obtained by the LSVM classifier, resulting in computational time, recall rate, precision rate, and AUC values of 25.7 s, 95, 95.3, and 0.98. The difference in accuracy and computational time between the top two models was 0.1% and 11.3 s. The third-best accuracy, noted as 94.9%, was achieved by the CSVM classifier, along with computational time, recall rate, precision rate, and AUC values of 27 s, 94.9, 94.9, and 0.99, respectively. Based on the confusion matrix for ResNet50 and Coarse KNN, Table 14 shows that the developed model herein performs better in the prone_right and supine classes than in the other classes.
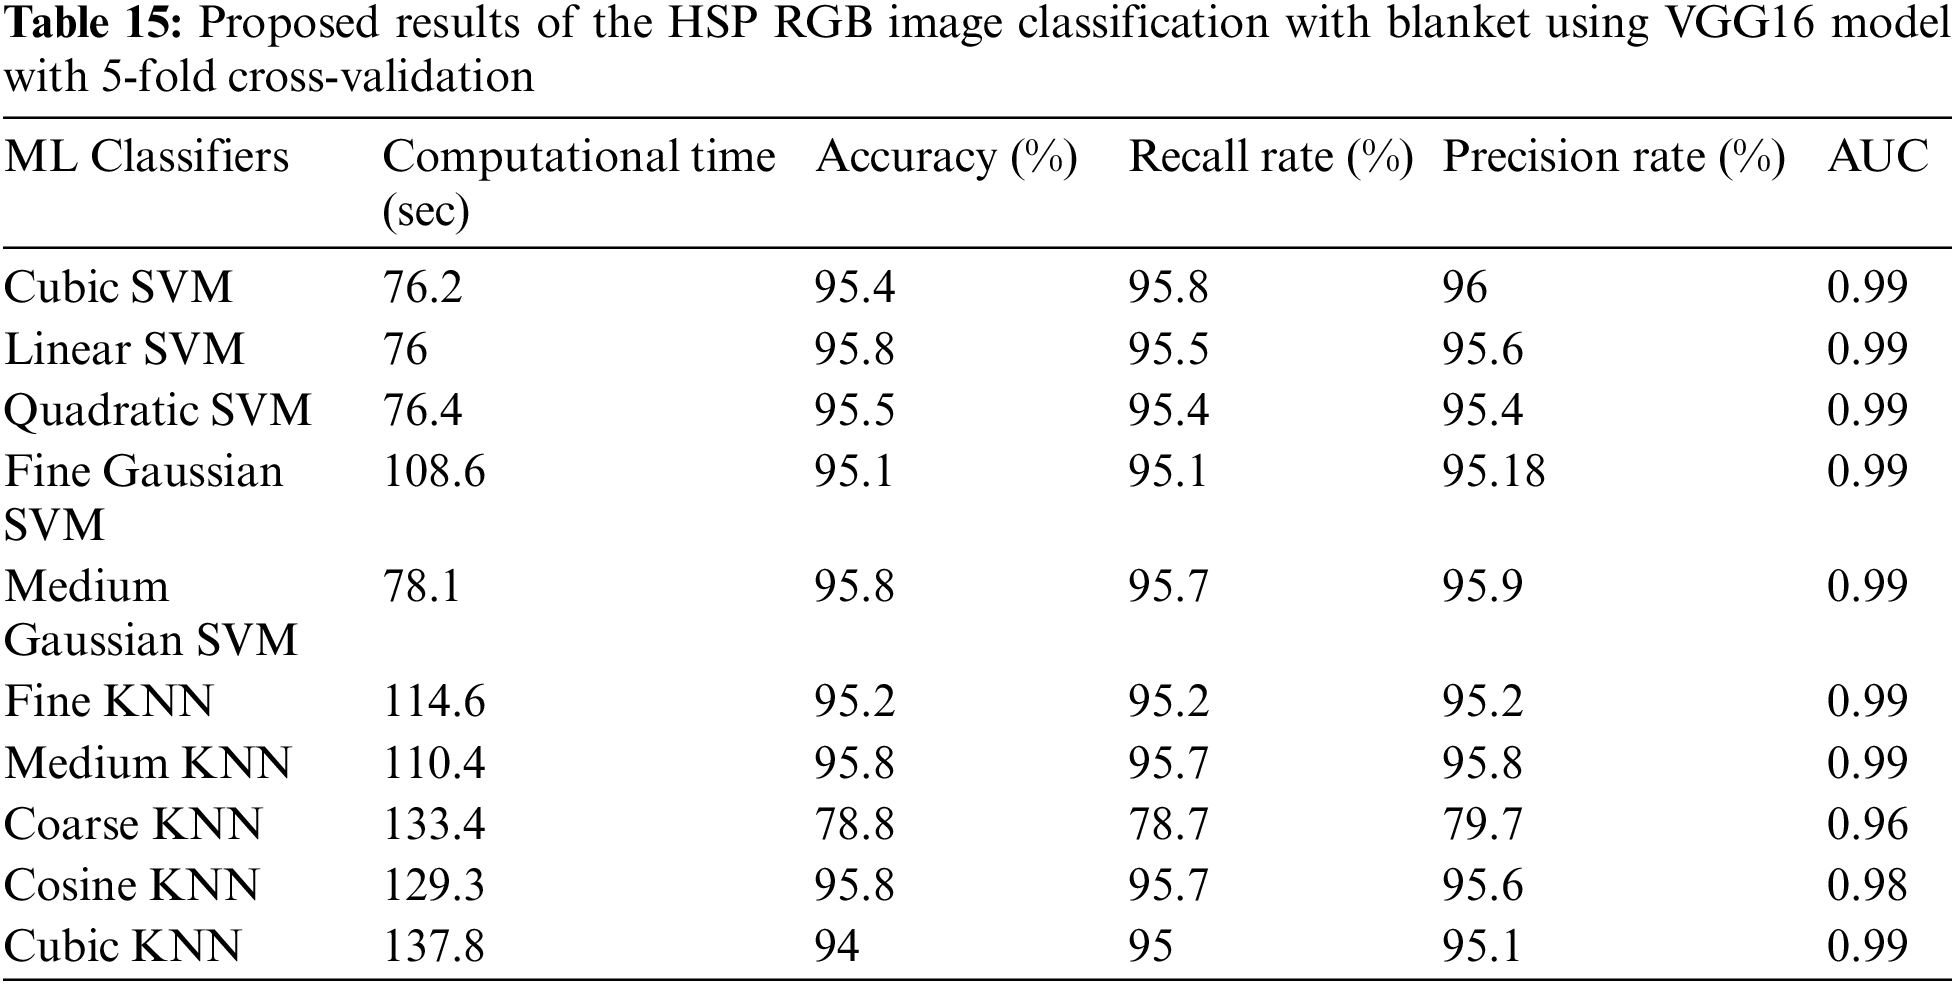
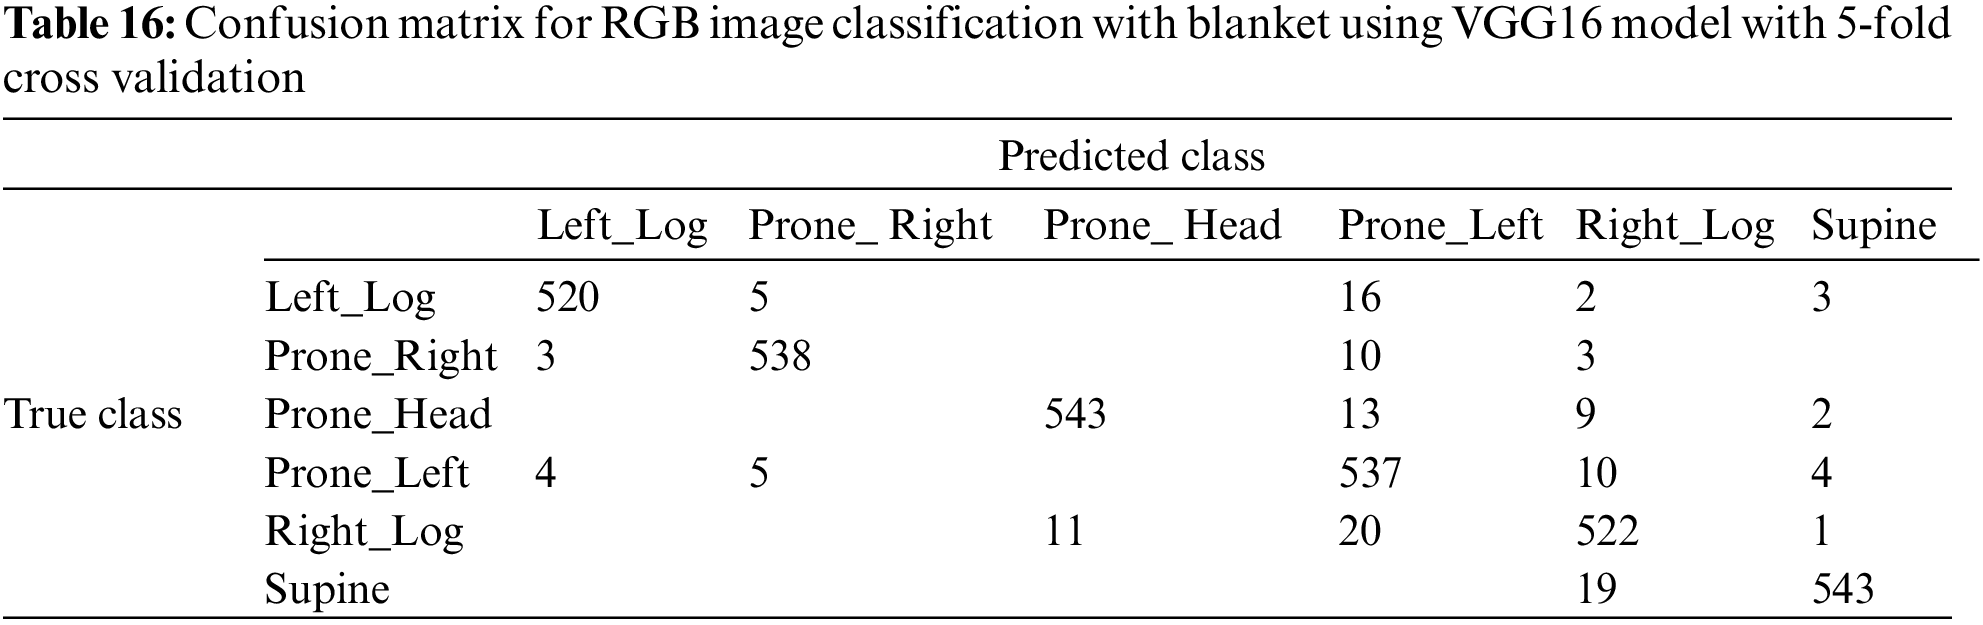
The classification results of the VGG16 model for the HSP dataset, using RGB images and blankets, are shown in Table 15. The extracted test features from VGG16 were passed to ten ML classifiers. The highest accuracy, 95.8%, was achieved by the LSVM classifier when using the VGG16 model. This model demonstrates performance metrics, including computational time, recall rate, precision rate, and AUC value, of 76 s, 95.5, 95.6, and 0.99, respectively. The second highest accuracy, 95.5%, was obtained by the QSVM classifier, resulting in computational time, recall rate, precision rate, and AUC values of 76.4 s, 95.4, 95.4, and 0.99. The difference in accuracy and computational time between the top two models was 0.3% and 0.4 s. The third-best accuracy, noted as 95.2%, was achieved by the FKNN classifier, along with computational time, recall rate, precision rate, and AUC values of 114.6 s, 95.2, 95.2, and 0.99, respectively. Based on the confusion matrix for VGG16 and LSVM, Table 16 shows that the developed model herein performs better in the supine class than in the other classes.
4.3 Fusion Numerical Results on Blanket Using Thermal and RGB Data
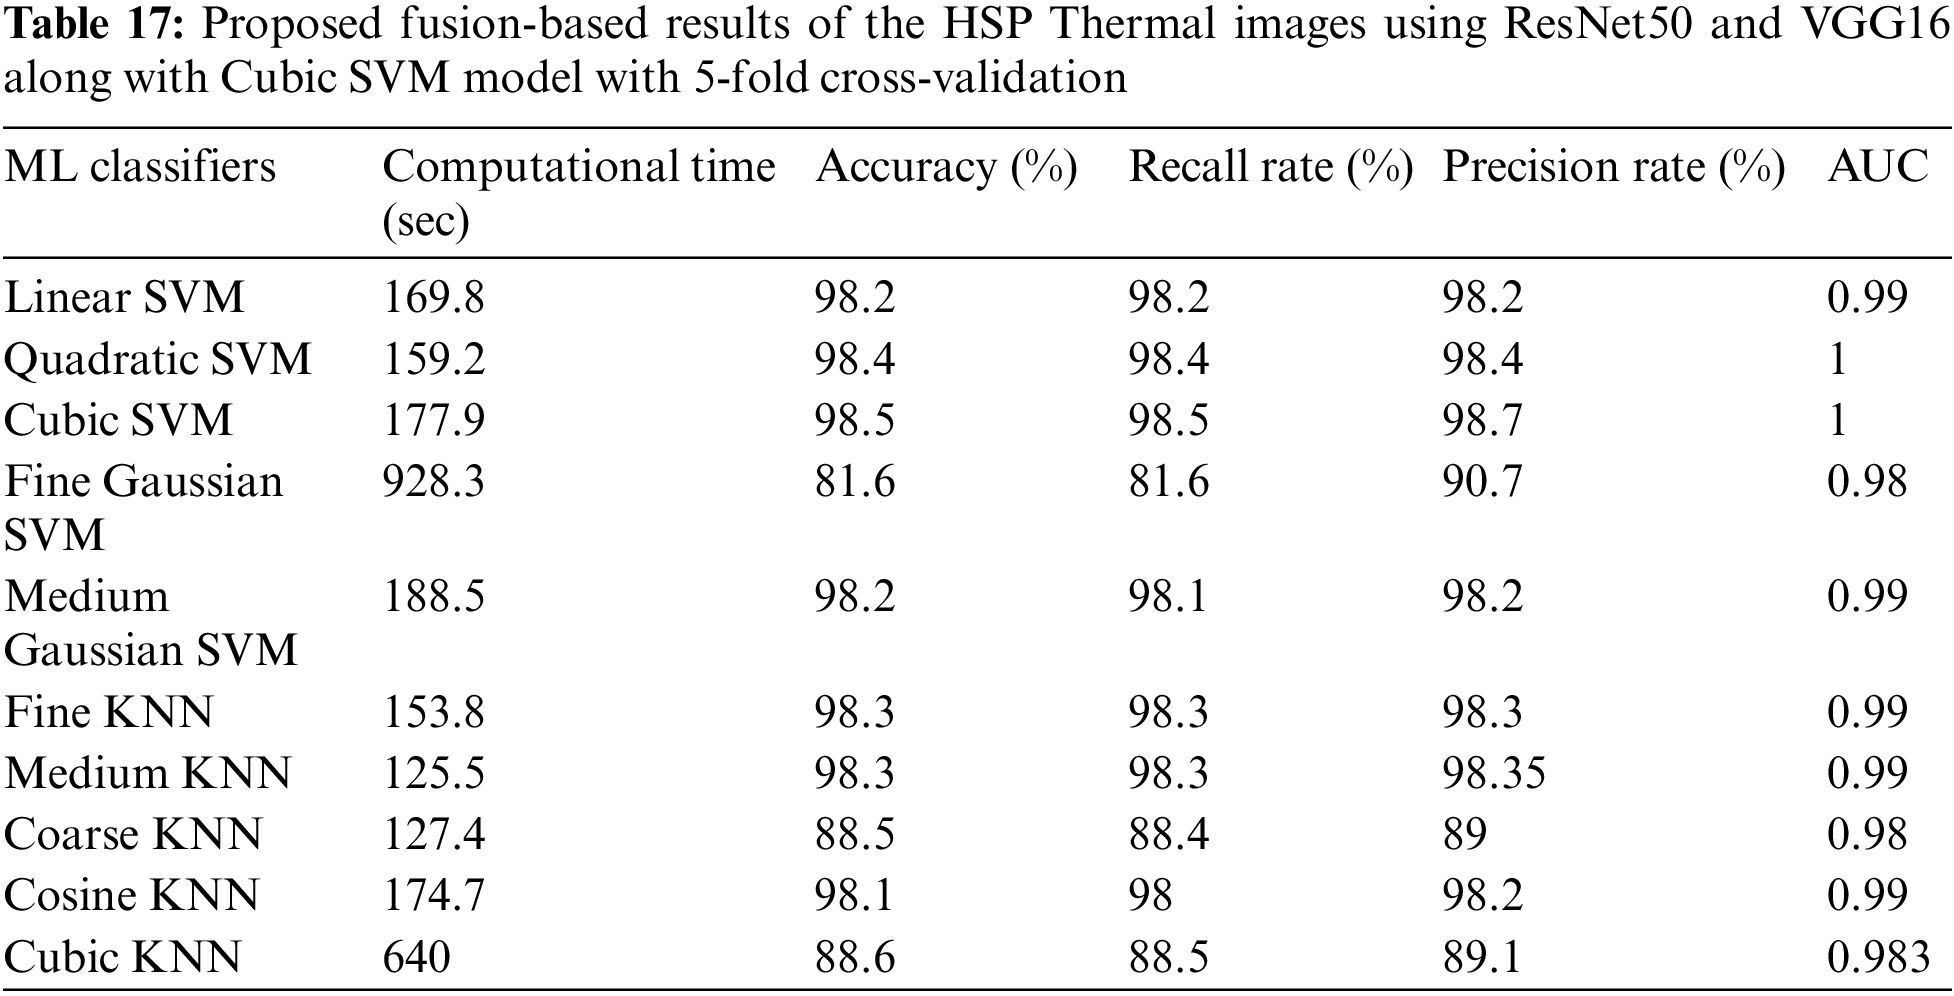
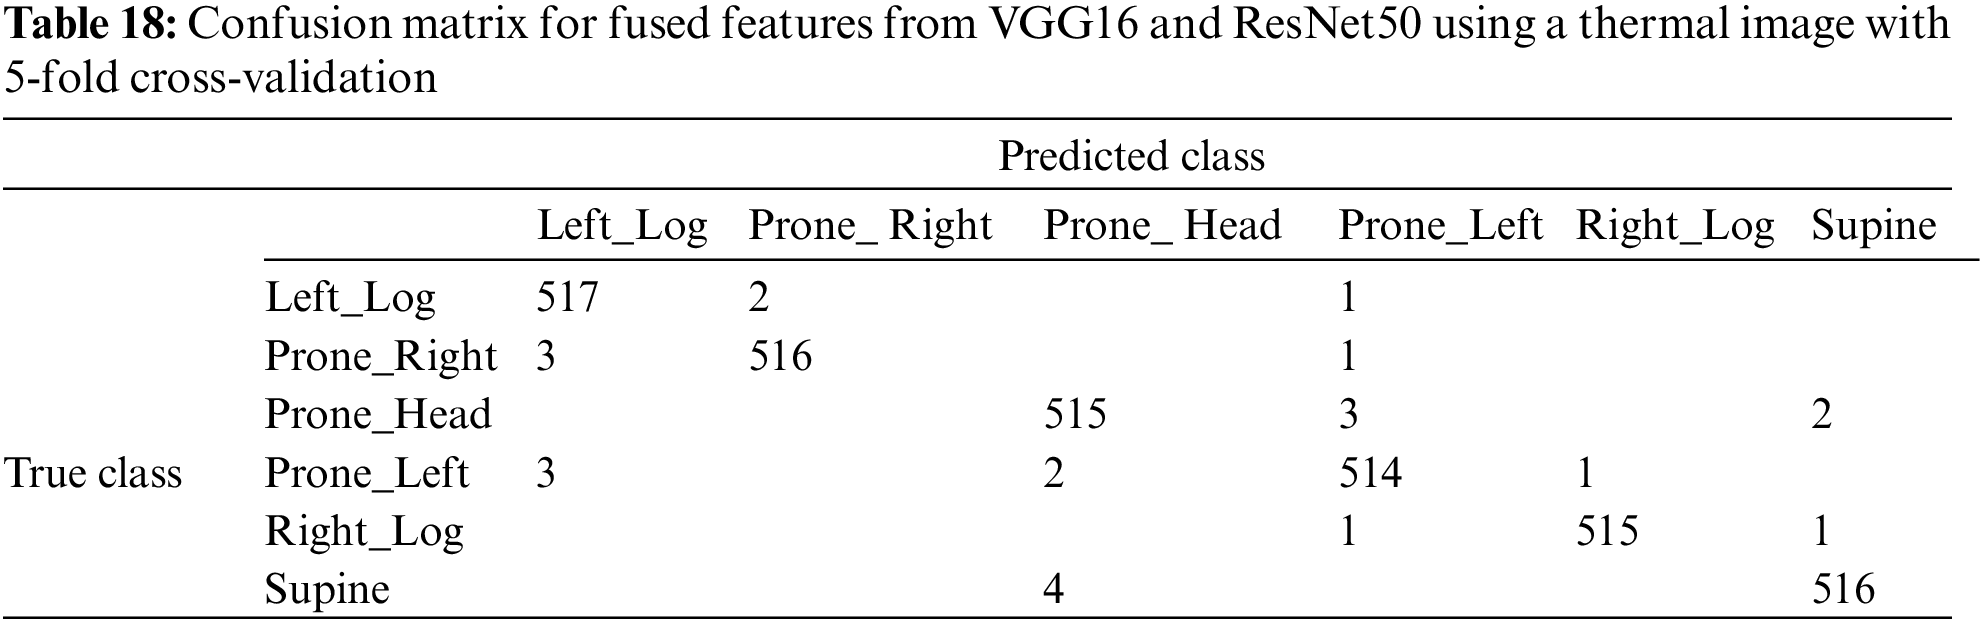
This section presents the results of analyzing HSP images using both thermal data and blankets. The features were extracted from two modified deep learning models, ResNet50 and VGG16, using thermal data with a blanket fused together. The fused features were passed to the proposed ML classifiers. The results for the proposed fused model, utilizing thermal data and blankets, are presented in Table 17. The highest accuracy, 98.5%, was achieved by the Cubic SVM classifier. This model demonstrates performance metrics, including computational time, recall rate, precision rate, and AUC values, of 177.9 s, 98.5, 98.7, and 1. The QSVM classifier achieved the second-highest accuracy of 98.4%, with corresponding performance values of 159.2 s, 98.4, 98.4, and 1. Remarkably, the gap in accuracy between these two top-performing models was only 0.1%. Furthermore, the Medium KNN classifier achieved the third-best accuracy of 98.3%, with corresponding performance values of 125.5 s, 98.3, 98.35, and 0.99. The confusion matrix for fused ResNet50 and VGG16, along with the Cubic SVM model, is shown in Table 18.
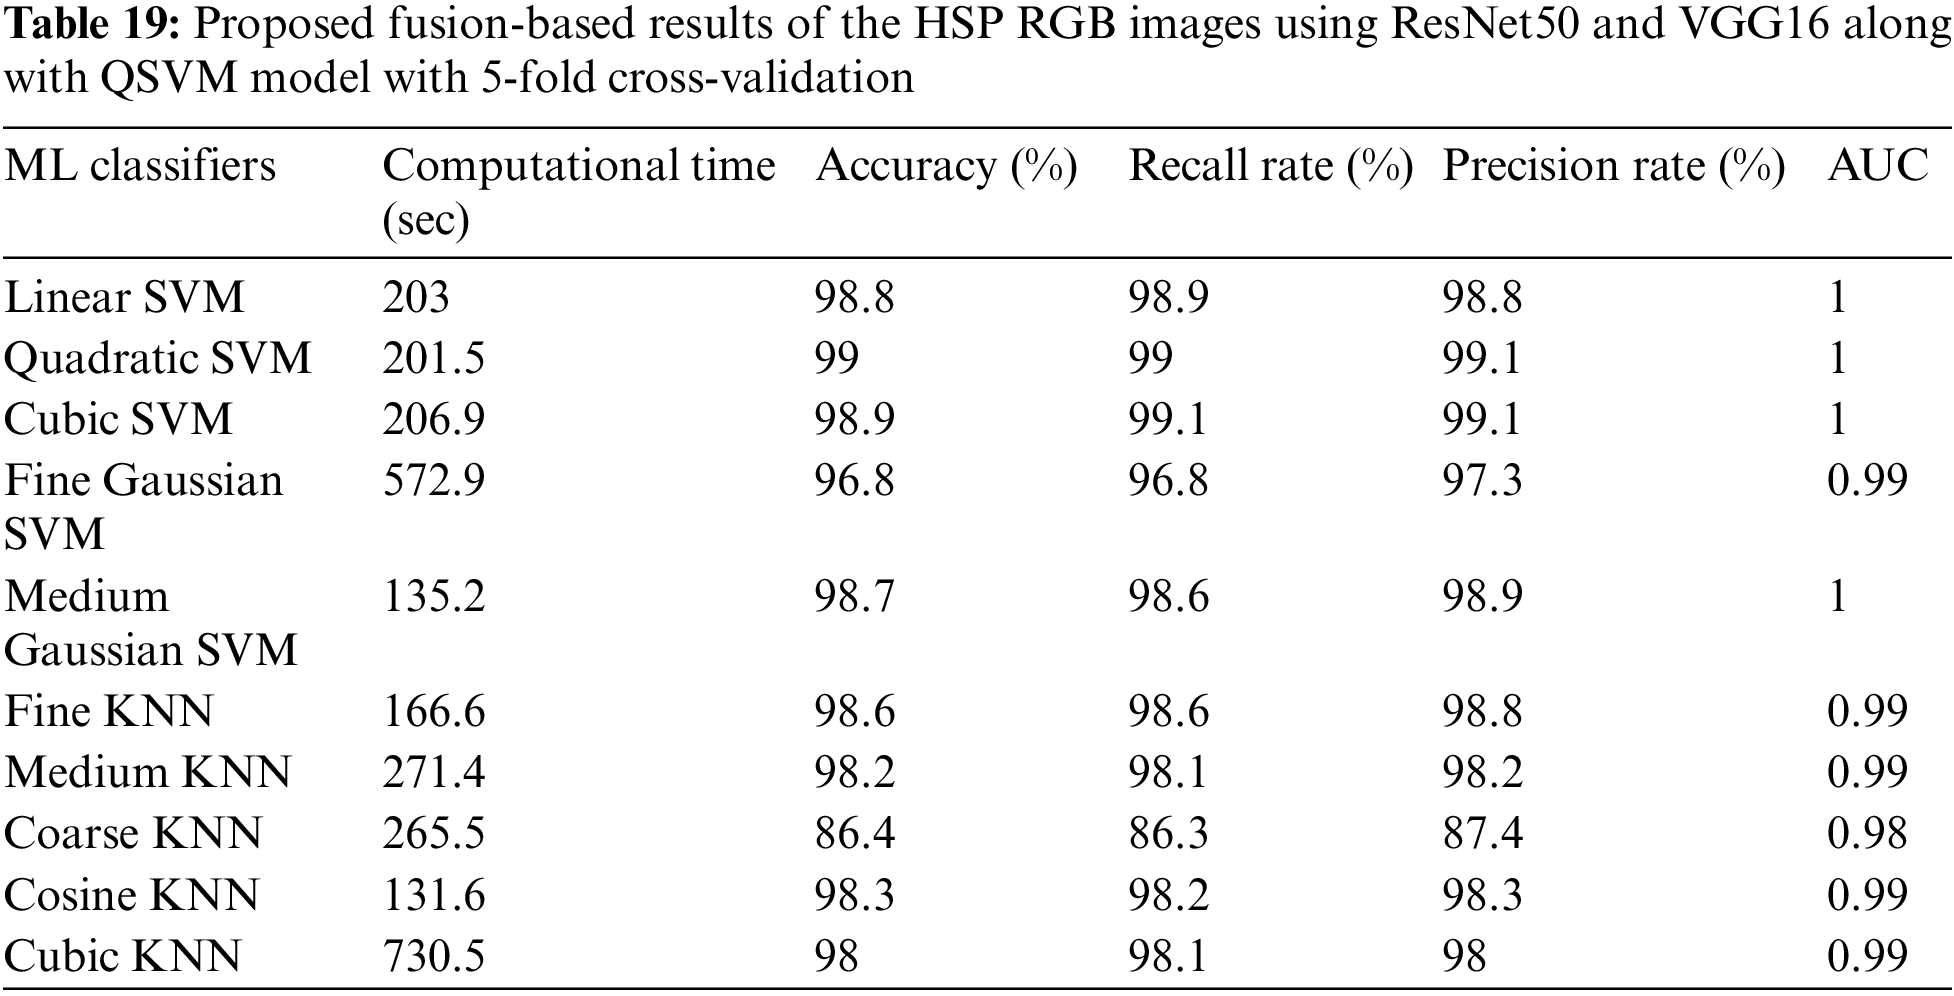
The results for the proposed fused model, utilizing RGB data and blankets, are presented in Table 19. The highest accuracy, 99%, was achieved by the QSVM classifier. This model demonstrates performance metrics, including computational time, recall rate, precision rate, and AUC value, of 201.5 s, 99, 99.1, and 1. The Cubic SVM classifier achieved the second highest accuracy of 98.9%, with corresponding performance values of 206.9 s, 99, 99.1, and 1. Remarkably, the gap in accuracy between these two top-performing models was only 0.1%. Furthermore, the Medium GSVM classifier achieved the third-best accuracy of 98.7%, with corresponding performance values of 135.2 s, 98.6, 97.3, and 0.99. The confusion matrix for fused ResNet50 and VGG16, along with the Cubic SVM model, is shown in Table 20.

This study introduces several innovative elements that significantly enhance the practicality and releuvance of sleep posture classification. The primary innovation lies in the incorporation of blankets as a pivotal factor in sleep posture determination. This novel inclusion recognizes the real-world scenario in which individuals often use blankets during sleep, which can have a substantial impact on their posture and overall comfort. Furthermore, the study advanced the granularity of posture classification by expanding beyond the standard four postures to a more detailed categorization involving six postures, including head and leg positions. This refinement provides a more comprehensive insight into sleep postures, which can have implications for understanding sleep patterns and comfort optimization [45]. To improve the model’s generalizability, data fusion techniques were employed to simulate diverse blanket conditions using the original dataset. This approach acknowledges the practical constraint of investigating all available blankets and extends the applicability of this research. Additionally, it prioritizes privacy and confidentiality by limiting feature fusion to RGB and thermal images involving blankets, ensuring the secure and ethical application of this study’s findings in real-world scenarios.
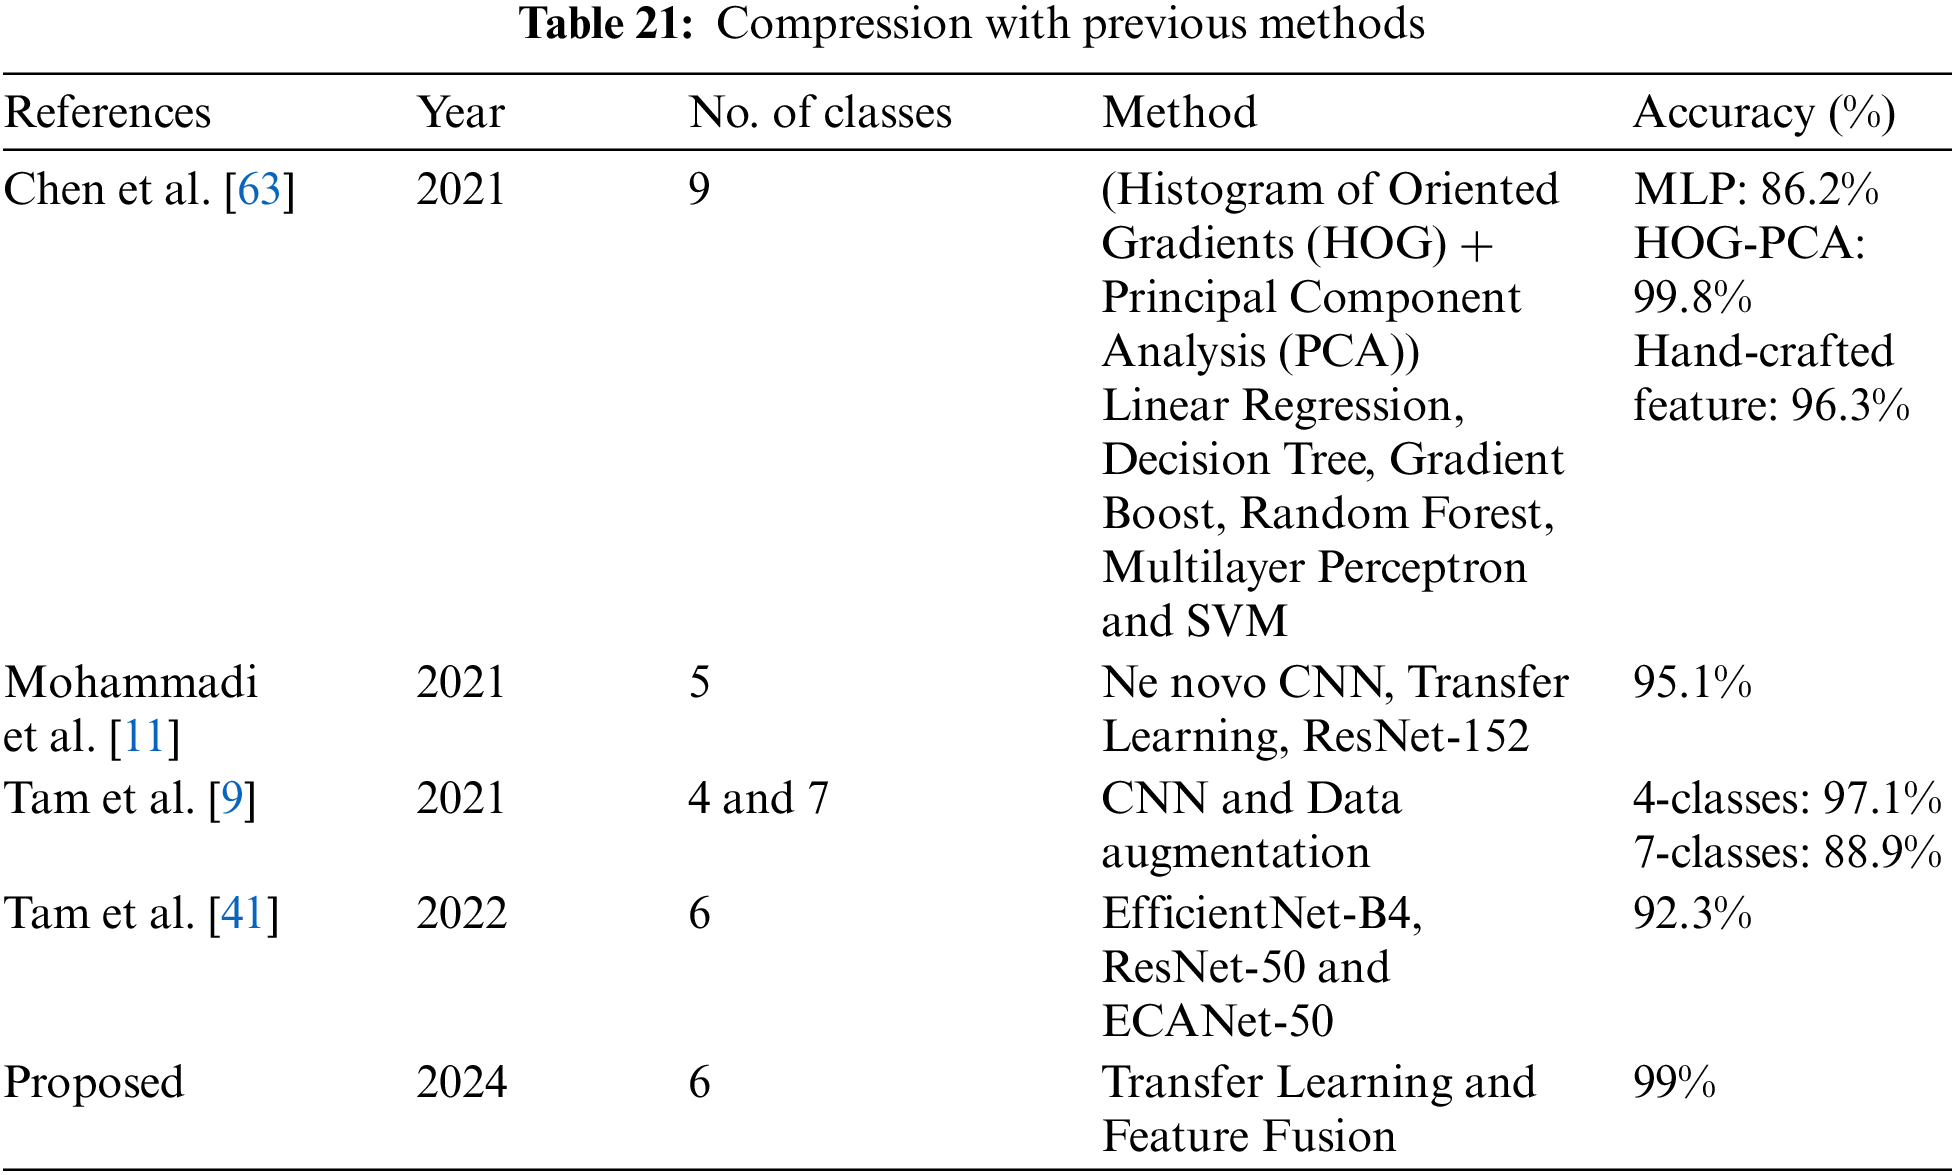
Various posture classification systems have utilized depth cameras, each with its unique approach. Ren et al. [58] achieved 92.5% accuracy in classifying six postures (excluding prone) using SVM with Scale-Invariant Feature Transform (SIFT) features. The developed deep learning model for six postures in this study performed better, achieving a higher accuracy rate of 97.7% and 95% while using thermal and RGB data without blankets. Mohammad et al. [19] also considered different blanket conditions in sleep posture classification using a non-contact method. They utilized a Microsoft Kinect infrared depth camera to classify 12 different sleeping postures, both with and without a soft blanket. Their system achieved accuracies of 76% and 91% for scenarios with and without blankets, respectively. In contrast, the six-posture coarse classification system in this study outperformed the approach with an overall accuracy of 99%, even when considering potential interference from blankets. The comparison with existing methodologies is shown in Table 21. Grimm et al. [43] introduced an alleviation map technique for depth camera images and employed a CNN to classify three postures: supine, left side-lying, and right side-lying. Their system achieved an impressive accuracy of 94%. However, it is important to note that the developed classifier, while achieving higher overall accuracy, is considered without and with blanket conditions, with a particular focus on addressing the challenges posed by blankets. Additionally, this study revealed a remarkable finding: classification accuracy was higher when a blanket was present as compared to previous studies.
Apart from the use of depth cameras, the effectiveness of pressure mats and wearables, including embedded accelerometers, has been assessed for sleep posture classification. Ostadabbas et al. [59] employed a Gaussian mixture model to analyze data from a pressure mat and classify three sleep postures (supine, left, and right side-lying), achieving slightly better performance at 98.4% accuracy despite having a less detailed classification. Furthermore, Fallmann et al. [60] utilized generalized matrix learning vector quantization to classify six sleeping postures based on accelerometry data from the chest and both legs, achieving an accuracy of 98.3%. It appears that contact-based sleep posture classification systems may outperform non-contact systems. While this research introduced a non-contact system that incorporates both RGB and thermal cameras, offering ease of operation and enabling long-term monitoring, it is worth noting that these systems can be intrusive. Additionally, wearables may not be ideal for long-term monitoring of the elderly, as they may forget to wear or use the device consistently.
Furthermore, it is important to recognize that sleep-related musculoskeletal disorders and associated pain can emerge as substantial consequences of sleep complaints and deprivation. Simply identifying sleep posture alone may not inherently indicate whether the posture is problematic or conducive to these issues. However, it is crucial to understand that this risk factor is modifiable and can be addressed through the use of appropriate mattresses and pillows or engagement in targeted physical exercise [33,61,62]. Future directions involve the development of a machine learning-based approach for assessing spinal alignment and limb placement alongside the classification of sleeping postures. This approach holds significant promise in identifying and addressing related problems, such as neck and back pain, which can have a profound impact on overall sleep quality and health [45].
This study underscores the effectiveness of a developed fine-grained six-posture system, even when considering the potential impact of blankets, achieving a satisfactory overall classification accuracy of 99%. These findings lay a solid foundation for the practical implementation of sleep surveillance systems in care homes and hospitals. However, the study acknowledges certain limitations. For instance, the dataset did not encompass age groups older than 30 or younger than 18, potentially limiting the model’s generalizability. Additionally, the gender ratio among participants was unbalanced. In order to address these limitations, future research should focus on gathering a larger and more diverse dataset to enhance the model’s ability to generalize, especially for positions with finer granularity. Moreover, future efforts can include conducting field tests to validate the system’s performance in real-world settings and diversifying the dataset by including participants with various health conditions and different blanket conditions. Furthermore, researchers can work toward enhancing the system’s capabilities to not only classify postures but also identify body morphotypes, body segment positions, and joint angles, further advancing its utility in sleep monitoring and healthcare applications.
Acknowledgement: The authors would like to express their deep appreciation to all participants for their invaluable contribution to this study through data collection. Their cooperation is greatly valued, enhancing the depth and quality of this research.
Funding Statement: This research was supported by a grant from the Korea Health Technology R&D Project through the Korea Health Industry Development Institute (KHIDI), funded by the Ministry of Health & Welfare, Republic of Korea (Grant Number: H12C1831), Korea Institute for Advancement of Technology (KIAT) Grant funded by the Korea Government (MOTIE) (P0012724, HRD Program for Industrial Innovation), the National Research Foundation of Korea (NRF) Grant funded by the Korea Government (MSIT) (No. RS-2023-00218176), and the Soonchunhyang University Research Fund.
Author Contributions: Awais Khan contributed to developing the proposed model and preparing the manuscript; Jung-Yeon Kim, Chomyong Kim and Ahsan Aziz contributed to revising the manuscript; Yunyoung Nam conducted supervision and reviewed the manuscript; Awais Khan and Chomyong Kim contributed equally to this work. All authors have read and agreed to the published version of the manuscript.
Availability of Data and Materials: The study’s data are available upon request from the corresponding author.
Conflicts of Interest: The authors declare that they have no conflicts of interest to report regarding the present study.
References
1. Lin F, Zhuang Y, Song C, Wang A, Li Y, Gu C, et al. SleepSense: a noncontact and cost-effective sleep monitoring system. IEEE Trans Biomed Circuits Syst. 2016;11(1):189–202. doi:https://doi.org/10.1109/TBCAS.2016.2541680. [Google Scholar] [PubMed] [CrossRef]
2. Khalil M, Power N, Graham E, Deschênes SS, Schmitz N. The association between sleep and diabetes outcomes–A systematic review. Diabetes Res Clin Pract. 2020;161:108035. doi:https://doi.org/10.1016/j.diabres.2020.108035. [Google Scholar] [PubMed] [CrossRef]
3. Vorona RD, Winn MP, Babineau TW, Eng BP, Feldman HR, Ware JC. Overweight and obese patients in a primary care population report less sleep than patients with a normal body mass index. Arch Internal Med. 2005;165(1):25–30. doi:https://doi.org/10.1001/archinte.165.1.25. [Google Scholar] [PubMed] [CrossRef]
4. Spiegel K, Knutson K, Leproult R, Tasali E, Van Cauter E. Sleep loss: a novel risk factor for insulin resistance and Type 2 diabetes. J Appl Physiol. 2005;99:2008–19. doi:https://doi.org/10.1152/japplphysiol.00660.2005. [Google Scholar] [PubMed] [CrossRef]
5. Short MA, Booth SA, Omar O, Ostlundh L, Arora T. The relationship between sleep duration and mood in adolescents: a systematic review and meta-analysis. Sleep Med Rev. 2020;52:101311. doi:https://doi.org/10.1016/j.smrv.2020.101311. [Google Scholar] [PubMed] [CrossRef]
6. Hombali A, Seow E, Yuan Q, Chang SHS, Satghare P, Kumar S, et al. Prevalence and correlates of sleep disorder symptoms in psychiatric disorders. Psychiat Res. 2019;279:116–22. doi:https://doi.org/10.1016/j.psychres.2018.07.009. [Google Scholar] [PubMed] [CrossRef]
7. Liang M, Guo L, Huo J, Zhou G. Prevalence of sleep disturbances in Chinese adolescents: a systematic review and meta-analysis. PLoS One. 2021;16(3):e0247333. doi:https://doi.org/10.1371/journal.pone.0247333. [Google Scholar] [PubMed] [CrossRef]
8. Novelli L, Ferri R, Bruni O. Sleep classification according to AASM and Rechtschaffen and Kales: effects on sleep scoring parameters of children and adolescents. J Sleep Res. 2010;19(1p2):238–47. doi:https://doi.org/10.1111/j.1365-2869.2009.00785.x. [Google Scholar] [PubMed] [CrossRef]
9. Tam AYC, So BPH, Chan TTC, Cheung AKY, Wong DWC, Cheung JCW. A blanket accommodative sleep posture classification system using an infrared depth camera: a deep learning approach with synthetic augmentation of blanket conditions. Sensors, 2021;21(16):5553. doi:https://doi.org/10.3390/s21165553. [Google Scholar] [PubMed] [CrossRef]
10. Dursun M, Özşen S, Yücelbaş C, Yücelbaş Ş, Tezel G, Küççüktürk S, et al. A new approach to eliminating EOG artifacts from the sleep EEG signals for the automatic sleep stage classification. Neural Comput Appl. 2017;28:3095–112. doi:https://doi.org/10.1007/s00521-016-2578-z. [Google Scholar] [CrossRef]
11. Mohammadi SM, Enshaeifar S, Hilton A, Dijk DJ, Wells K, Engineering R. Transfer learning for clinical sleep pose detection using a single 2D IR camera. IEEE Trans Neural Syst Rehabil Eng. 2020;29:290–9. doi:https://doi.org/10.1109/TNSRE.2020.3048121. [Google Scholar] [PubMed] [CrossRef]
12. Mohammadi SM, Kouchaki S, Ghavami M, Sanei S. Improving time-frequency domain sleep EEG classification via singular spectrum analysis. J Neurosci Methods J Neurosci Methods. 2016;273:96–106. doi:https://doi.org/10.1016/j.jneumeth.2016.08.008. [Google Scholar] [PubMed] [CrossRef]
13. Kouchaki S, Sanei S, Arbon EL, Dijk D. Tensor based singular spectrum analysis for automatic scoring of sleep EEG. IEEE Trans Neural Syst Rehabil Eng J Neurosci Methods. 2014;23(1):1–9. doi:https://doi.org/10.1109/TNSRE.2014.2329557. [Google Scholar] [PubMed] [CrossRef]
14. Mohammadi SM, Enshaeifar S, Ghavami M, Sanei S. Classification of awake, REM, and NREM from EEG via singular spectrum analysis. In: 2015 37th Annual International Conference of the IEEE Engineering in Medcine and Biology Society (EMBC), 2015; Milan, Italy, IEEE. [Google Scholar]
15. Yücelbaş Ş, Yücelbaş C, Tezel G, Özşen S, Yosunkaya Ş. Automatic sleep staging based on SVD, VMD, HHT and morphological features of single-lead ECG signal. Expert Syst Appl. 2018;102:193–206. doi:https://doi.org/10.1016/j.eswa.2018.02.034. [Google Scholar] [CrossRef]
16. Kuo CH, Yang FC, Tsai MY, Lee MY. Artificial neural networks based sleep motion recognition using night vision cameras. Biomed Eng Appl Basis Commun. 2004;16(2):79–86. doi:https://doi.org/10.4015/S101623720400013X. [Google Scholar] [CrossRef]
17. Blagrove M, Owens D, MacDONALD I, Sytnik N, Tucker P, Folkard S. Time of day effects in, and the relationship between, sleep quality and movement. J Sleep Res. 1998;7(4):233–9. doi:https://doi.org/10.1046/j.1365-2869.1998.00119.x. [Google Scholar] [PubMed] [CrossRef]
18. Van Hilten J, Middelkoop H, Braat E, Van der Velde E, Kerkhof G, Ligthart G, et al. Nocturnal activity and immobility across aging (50–98 years) in healthy persons. J Am Geriatr Soc. 1993;41(8):837–41. doi:https://doi.org/10.1111/j.1532-5415.1993.tb06180.x. [Google Scholar] [PubMed] [CrossRef]
19. Mohammadi SM, Alnowami M, Khan S, Dijk DJ, Hilton A, Wells K. Sleep posture classification using a convolutional neural network. In: 2018 40th Annual International Conference of the IEEE Engineering in Medicine and Biology Society (EMBC), 2018; Honolulu, HI, USA, IEEE. [Google Scholar]
20. Yu M, Rhuma A, Naqvi SM, Wang L, Chambers J. A posture recognition-based fall detection system for monitoring an elderly person in a smart home environment. IEEE Trans Inf Technol Biomed. 2012;16(6):1274–86. doi:https://doi.org/10.1109/TITB.2012.2214786. [Google Scholar] [PubMed] [CrossRef]
21. Masek M, Lam CP, Tranthim-Fryer C, Jansen B, Baptist K. Sleep monitor: a tool for monitoring and categorical scoring of lying position using 3D camera data. SoftwareX. 2018;7:341–6. doi:https://doi.org/10.1016/j.softx.2018.10.001. [Google Scholar] [CrossRef]
22. Liu J, Chen X, Chen S, Liu X, Wang Y, Chen L. TagSheet: sleeping posture recognition with an unobtrusive passive tag matrix. In: IEEE INFOCOM 2019-IEEE Conference on Computer Communications, 2019; Paris, France, IEEE. [Google Scholar]
23. Zhang F, Wu C, Wang B, Wu M, Bugos D, Zhang H, et al. SMARS: Sleep monitoring via ambient radio signals. IEEE Trans Mob Comput. 2019;20(1):217–31. doi:https://doi.org/10.1109/TMC.2019.2939791. [Google Scholar] [CrossRef]
24. Yu MC, Wu H, Liou JL, Lee MS, Hung YP. Multiparameter sleep monitoring using a depth camera. In: Biomedical Engineering Systems and Technologies: 5th International Joint Conference, 2012 Feb 1–4; Vilamoura, Portugal, Springer Berlin Heidelberg. p. 311–25. [Google Scholar]
25. Liu X, Payandeh S. Toward study of features associated with natural sleep posture using a depth sensor. In: 2016 IEEE Canadian Conference on Electrical and Computer Engineering, 2016; Vancouver, BC, Canada, IEEE. [Google Scholar]
26. Metsis V, Kosmopoulos D, Athitsos V, Makedon F. Noninvasive analysis of sleep patterns via multimodal sensor input. Pers Ubiquitous Comput. 2014;18:19–26. doi:https://doi.org/10.1007/s00779-012-0623-1. [Google Scholar] [CrossRef]
27. Hoque E, Dickerson RF, Stankovic JA. Monitoring body positions and movements during sleep using wisps. Wireless Health. 2010;44–53. doi:https://doi.org/10.1145/1921081.1921088. [Google Scholar] [CrossRef]
28. Harada T, Sakata A, Mori T, Sato T. Sensor pillow system: monitoring respiration and body movement in sleep. In: Proceedings 2000 IEEE/RSJ International Conference on Intelligent Robots and Systems (IROS 2000), 2000; Takamatsu, Japan, IEEE. [Google Scholar]
29. Liu JJ, Xu W, Huang MC, Alshurafa N, Sarrafzadeh M, Raut N, et al. A dense pressure sensitive bedsheet design for unobtrusive sleep posture monitoring. In: 2013 IEEE International Conference on Pervasive Computing and Communications (PerCom), 2013; San Diego, CA, USA, IEEE. [Google Scholar]
30. Pino EJ, de la Paz AD, Aqueveque P, Chávez JA, Morán AA. Contact pressure monitoring device for sleep studies. In: 2013 35th Annual International Conference of the IEEE Engineering in Medicine and Biology Society, 2013; Osaka, Japan, IEEE. [Google Scholar]
31. Lin L, Xie Y, Wang S, Wu W, Niu S, Wen X, et al. Triboelectric active sensor array for self-powered static and dynamic pressure detection and tactile imaging. ACS Nano. 2013;7(9):8266–74. doi:https://doi.org/10.1021/nn4037514. [Google Scholar] [PubMed] [CrossRef]
32. Tang K, Kumar A, Nadeem M, Maaz I. CNN-based smart sleep posture recognition system. IoT. 2021;2(1):119–39. doi:https://doi.org/10.3390/iot2010007. [Google Scholar] [CrossRef]
33. Cary D, Briffa K, McKenna L. Identifying relationships between sleep posture and non-specific spinal symptoms in adults: a scoping review. BMJ Open. 2019;9(6):e027633. doi:https://doi.org/10.1136/bmjopen-2018-027633. [Google Scholar] [PubMed] [CrossRef]
34. Kubota T, Ohshima N, Kunisawa N, Murayama R, Okano S, Mori-Okamoto J, et al. Characteristic features of the nocturnal sleeping posture of healthy men. Sleep Biol Rhythms. 2003;1(2):183–5. doi:https://doi.org/10.1046/j.1446-9235.2003.00040.x. [Google Scholar] [CrossRef]
35. Pien GW, Schwab R. Sleep disorders during pregnancy. Sleep. 2004;27(7):1405–17. [Google Scholar] [PubMed]
36. Zhao A, Dong J, Zhou H. Self-supervised learning from multi-sensor data for sleep recognition. IEEE Access. 2020;8:93907–21. doi:https://doi.org/10.1109/ACCESS.2020.2994593. [Google Scholar] [CrossRef]
37. Byeon YH, Lee JY, Kim DH, Kwak KC. Posture recognition using ensemble deep models under various home environments. Appl Sci. 2020;10(4):1287. [Google Scholar]
38. Viriyavit W, Sornlertlamvanich V. Bed position classification by a neural network and bayesian network using noninvasive sensors for fall prevention. J Sens. 2020;2020:1–14. doi:https://doi.org/10.1155/2020/5689860. [Google Scholar] [CrossRef]
39. Wang ZW, Wang SK, Wan BT, Song W. A novel multi-label classification algorithm based on K-nearest neighbor and random walk. Int J Distrib Sens Netw. 2020;16(3):1550147720911892. doi:https://doi.org/10.1177/1550147720911892. [Google Scholar] [CrossRef]
40. Cheung JCW, Tam EWC, Mak AHY, Chan TTC, Lai WPY, Zheng YP. Night-time monitoring system (eNightLog) for elderly wandering behavior. Sensors. 2021;21(3):704. doi:https://doi.org/10.3390/s21030704. [Google Scholar] [PubMed] [CrossRef]
41. Tam AYC, Zha LW, So BPH, Lai DKH, Mao YJ, Lim HJ, et al. Depth-camera-based under-blanket sleep posture classification using anatomical landmark-guided deep learning model. Int J Environ Res Public Health. 2022;19(20):13491. doi:https://doi.org/10.3390/ijerph192013491. [Google Scholar] [PubMed] [CrossRef]
42. Li YY, Lei YJ, Chen LCL, Hung YP. Sleep posture classification with multistream CNN using vertical distance map. In: 2018 International Workshop on Advanced Image Technology (IWAIT), 2018; Chiang Mai, Thailand, IEEE. [Google Scholar]
43. Grimm T, Martinez M, Benz A, Stiefelhagen R. Sleep position classification from a depth camera using bed aligned maps. In: 2016 23rd International Conference on Pattern Recognition (ICPR), 2016; Cancun, Mexico, IEEE. [Google Scholar]
44. Rivera-Romero CA, Munoz-Minjares JU, Lastre-Dominguez C, Lopez-Ramirez M. Optimal image characterization for in-bed posture classification by using SVM algorithm. Big Data Cogn Comput. 2024;8(2):13. doi:https://doi.org/10.3390/bdcc8020013. [Google Scholar] [CrossRef]
45. Fallmann S, Chen L. Computational sleep behavior analysis: a survey. IEEE Access. 2019;7:142421–40. doi:https://doi.org/10.1109/ACCESS.2019.2944801. [Google Scholar] [CrossRef]
46. Theckedath D, Sedamkar R. Detecting affect states using VGG16, ResNet50 and SE-ResNet50 networks. SN Comput Sci. 2020;1:1–7. doi:https://doi.org/10.1007/s42979-020-0114-9. [Google Scholar] [CrossRef]
47. Arunnehru J, Thalapathiraj S, Dhanasekar R, Vijayaraja L, Kannadasan R, Khan A, et al. Machine vision-based human action recognition using spatio-temporal motion features (STMF) with difference intensity distance group pattern (DIDGP). Electronics. 2022;11(15):2363. doi:https://doi.org/10.3390/electronics11152363. [Google Scholar] [CrossRef]
48. Khan MA, Khan A, Alhaisoni M, Alqahtani A, Armghan A, Althubiti SA, et al. GaitDONet: Gait recognition using deep features optimization and neural network. Comput Mater Contin. 2023;75(3):5087–103. doi:https://doi.org/10.32604/cmc.2023.033856. [Google Scholar] [CrossRef]
49. Khan MA, Khan A, Alhaisoni M, Alqahtani A, Alsubai S, Alharbi M, et al. Multimodal brain tumor detection and classification using deep saliency map and improved dragonfly optimization algorithm. Int J Imaging Syst Technol. 2023;33(2):572–87. doi:https://doi.org/10.1002/ima.22831. [Google Scholar] [CrossRef]
50. Selvi E, Adimoolam M, Karthi G, Thinakaran K, Balamurugan NM, Kannadasan R, et al. Suspicious actions detection system using enhanced CNN and surveillance video. Electronics. 2022;11(24):4210. doi:https://doi.org/10.3390/electronics11244210. [Google Scholar] [CrossRef]
51. Wang T, Wu DJ, Coates A, Ng AY. End-to-end text recognition with convolutional neural networks. In: Proceedings of the 21st International Conference on Pattern Recognition (ICPR2012), 2012; Tsukuba, Japan, IEEE. [Google Scholar]
52. Russakovsky O, Deng J, Su H, Krause J, Satheesh S, Ma S, et al. ImageNet large scale visual recognition challenge. Int J Comput Vis. 2015;115:211–52. [Google Scholar]
53. Tang Y. Deep learning using linear support vector machines. arXiv preprint arXiv:1306.0239. 2013. [Google Scholar]
54. Syed HH, Khan MA, Tariq U, Armghan A, Alenezi F, Khan JA, et al. A rapid artificial intelligence-based computer-aided diagnosis system for COVID-19 classification from CT images. Behav Neurol. 2021;2021:13. doi:https://doi.org/10.1155/2021/2560388. [Google Scholar] [PubMed] [CrossRef]
55. Feng D, Chen X, Zhou Z, Liu H, Wang Y, Bai L, et al. A preliminary study of predicting effectiveness of anti-VEGF injection using OCT images based on deep learning. In: 2020 42nd Annual International Conference of the IEEE Engineering in Medicine & Biology Society (EMBC), 2020; Montreal, QC, Canada, IEEE. [Google Scholar]
56. Khan A, Pin K, Aziz A, Han JW, Nam Y. Optical coherence tomography image classification using hybrid deep learning and ant colony optimization. Sensors. 2023;23(15):6706. doi:https://doi.org/10.3390/s23156706. [Google Scholar] [PubMed] [CrossRef]
57. Khan A, Khan MA, Javed MY, Alhaisoni M, Tariq U, Kadry S, et al. Human gait recognition using deep learning and improved ant colony optimization. Comput Mater Contin. 2022;70(2):2113–30. doi:https://doi.org/10.32604/cmc.2022.018270. [Google Scholar] [CrossRef]
58. Ren A, Dong B, Lv X, Zhu T, Hu F, Yang X. A non-contact sleep posture sensing strategy considering three dimensional human body models. In: 2016 2nd IEEE International Conference on Computer and Communications (ICCC), 2016; Chengdu, China, IEEE. [Google Scholar]
59. Ostadabbas S, Pouyan MB, Nourani M, Kehtarnavaz N. In-bed posture classification and limb identification. In: 2014 IEEE Biomedical Circuits and Systems Conference (BioCAS) Proceedings, 2014; Lausanne, Switzerland: IEEE. [Google Scholar]
60. Fallmann S, van Veen R, Chen L, Walker D, Chen F, Pan C. Wearable accelerometer based extended sleep position recognition. In: 2017 IEEE 19th International Conference on e-Health Networking, Applications and Services (Healthcom), 2017; Dalian, China, IEEE. [Google Scholar]
61. Ren S, Wong DWC, Yang H, Zhou Y, Lin J, Zhang M. Effect of pillow height on the biomechanics of the head-neck complex: investigation of the cranio-cervical pressure and cervical spine alignment. PeerJ. 2016;4:e2397. doi:https://doi.org/10.7717/peerj.2397. [Google Scholar] [PubMed] [CrossRef]
62. Wong DWC, Wang Y, Lin J, Tan Q, Chen TLW, Zhang M. Sleeping mattress determinants and evaluation: a biomechanical review and critique. PeerJ. 2019;7:e6364. doi:https://doi.org/10.7717/peerj.6364. [Google Scholar] [PubMed] [CrossRef]
63. Chen Z, Wang Y. Remote recognition of in-bed postures using a thermopile array sensor with machine learning. IEEE Sens J. 2021;21(9):10428–36. doi:https://doi.org/10.1109/JSEN.2021.3059681. [Google Scholar] [CrossRef]
Cite This Article
 Copyright © 2024 The Author(s). Published by Tech Science Press.
This work is licensed under a Creative Commons Attribution 4.0 International License , which permits unrestricted use, distribution, and reproduction in any medium, provided the original work is properly cited.
 Downloads
 Citation Tools