
 Submit a Paper
 Propose a Special lssue
 Open Access
ARTICLE

A Distributionally Robust Optimization Scheduling Model for Regional Integrated Energy Systems Considering Hot Dry Rock Co-Generation
1 College of Electrical and New Energy, China Three Gorges University, Yichang, 443002, China
2 Department of Industrial Engineering, College of Engineering, King Saud University, Riyadh, 11421, Saudi Arabia
3 Institute of Forestry and Engineering, Estonian University of Life Sciences, Tartu, 51006, Estonia
4 Department of Mechanical Engineering, École de Technologie Supérieure, Montréal, QC H3C 1K3, Canada
5 Electrical Engineering Department, Faculty of Engineering, Minia University, Minia, 61519, Egypt
* Corresponding Author: Mohamed A. Mohamed. Email:
Computer Modeling in Engineering & Sciences 2024, 140(2), 1387-1404. https://doi.org/10.32604/cmes.2024.048672
Received 14 December 2023; Accepted 11 March 2024; Issue published 20 May 2024
 View Full Text
 Download PDF
Abstract
Hot dry rock (HDR) is rich in reserve, widely distributed, green, low-carbon, and has broad development potential and prospects. In this paper, a distributionally robust optimization (DRO) scheduling model for a regionally integrated energy system (RIES) considering HDR co-generation is proposed. First, the HDR-enhanced geothermal system (HDR-EGS) is introduced into the RIES. HDR-EGS realizes the thermoelectric decoupling of combined heat and power (CHP) through coordinated operation with the regional power grid and the regional heat grid, which enhances the system wind power (WP) feed-in space. Secondly, peak-hour loads are shifted using price demand response guidance in the context of time-of-day pricing. Finally, the optimization objective is established to minimize the total cost in the RIES scheduling cycle and construct a DRO scheduling model for RIES with HDR-EGS. By simulating a real small-scale RIES, the results show that HDR-EGS can effectively promote WP consumption and reduce the operating cost of the system.Keywords
Actively building a new energy-based power system is the first task to achieve the “double carbon” goal [1]. Hot dry rock (HDR) has broad development potential and prospects, due to its abundant reserves, wide distribution, green and low-carbon, and is expected to become a new direction for energy structure transformation [2,3].
High-quality HDR technology has many advantages, including that HDR resources are not affected by the external environment and climate and have abundant reserves, with the advantages of high annual utilization hours, clean and stable [4]. Thermal power generation in China represents a proportion of the country’s total power generation [5], which has led to an increase in the proportion of installed new energy capacity [6]. Also, conflicts between heat supply and power generation in thermal power plants have become more prominent, and the relationship between the interests of power auxiliary services has become more complex. The HDR-enhanced geothermal system (HDR-EGS) with HDR as the root can reasonably solve the problem of heat and power contradiction. It is conducive to promoting the market-oriented reform of auxiliary services. Furthermore, it has become a research hotspot in the field of renewable energy. In addition, HDR-EGS has a similar function to combined heat and power (CHP) and also has combined heat and power capability. Therefore, the application prospects in EGS are very promising [7,8]. For this reason, some scholars have conducted related studies on HDR-EGS. In [9], a specific study on the geothermal power generation performance of the Kalina Cycle and Organic Rankine Cycle was carried out. In [10], the power generation model was further optimized and an enhanced geothermal power generation system was constructed using carbon dioxide as the work material, thus reducing the carbon emissions in the system. In [11,12], the power generation system was designed according to an actual HDR scenario, and the development cost was also measured. In [13], a micro-energy network planning model for combined wind power (WP) and HDR thermoelectric power supply was constructed.
Regional integrated energy systems (RIES) can effectively improve energy utilization efficiency and indirectly promote renewable energy consumption through joint scheduling, coordination and optimization of multiple energy sources. In [14], a power-to-gas (P2G) device was introduced in a RIES to consume surplus WP and reduce wind abandonment. In [15], a joint economic scheduling model with P2G and low-temperature waste heat generators was established. The simulation analysis verified the effectiveness of the scheduling model in promoting WP consumption and improving system operation efficiency. Reference [16] promoted WP consumption and reduced the operating cost of RIES through the integrated demand response (DR) of the ground source heat pump (GSHP) and electric heat. However, the probability of extreme WP output scenarios is ignored, which brings severe challenges to the consumption of RIES WP. In [17], aiming at the problem of uncertainty in the system, a day-ahead-real-time two-stage coordinated robust optimal scheduling model is constructed. Robust optimization considers the worst-case scenario to solve the optimal result, and the probability of the worst-case scenario occurring in practice is extremely small, which leads to overly conservative results of robust optimization. To solve the above problem, some scholars have proposed to optimize the uncertainty problem by using a distributionally robust optimization (DRO) method. In [18], a RIES DRO-constrained day-ahead optimal scheduling model was developed for the WP output uncertainty problem. The negative effect of extreme WP output on system WP consumption is eliminated. Reference [19] introduced electric vehicles and GSHP in RIES to promote the consumption of WP. Reference [20] proposed an assessment method of WP consumption capacity and verified the effectiveness of the assessment method through simulation. Reference [21] proposed a generalized energy storage system storage and discharge optimal scheduling, which improves the consumption capacity of renewable energy. In [22,23], the effectiveness of flexible resources in facilitating the consumption of new energy is investigated. The results showed that if the utilization of flexible resources is maximized in the RIES, there will be a significant improvement in the new energy consumption as well as maintaining the economical and stable operation of the system. In [24], a flexible adjustment of the CHP thermoelectric ratio by adding a supplementary combustion device was proposed to reduce the operating cost of the system, and the WP consumption capacity was also improved. However, the existing research on HDR power generation mainly focuses on power generation system modeling, power generation performance analysis, and cost estimation. There is still a gap in the research on HDR-EGS access to RIES and collaborative optimal scheduling to promote renewable energy consumption indirectly.
Considering the shortages mentioned above, this paper proposes a DRO scheduling model for RIES considering HDR co-generation. HDR-EGS is connected to RIES for scheduling, and DRO is used to optimize the WP uncertainty problem.
The rest of the paper is organized as follows: Section 2 presents the detailed model including all components of HDR-EGS. Section 3 presents the RIES-optimized scheduling model including HDR-EGS. Section 4 presents the DRO and solution methods. Section 5 presents the simulation results of the case study. Section 6 concludes the paper.
2 HDR-EGS Combined Heat and Power Model
The HDR-EGS architecture is shown in Fig. 1, with the direction of the red arrow in the figure showing the flow of geothermal energy. The architecture consists of a geothermal power generation device, a high-temperature heating device with a heat storage system, a medium-temperature heating device, a splitter, a mixer, a recirculating pump, a producing well, and a reinjection well.
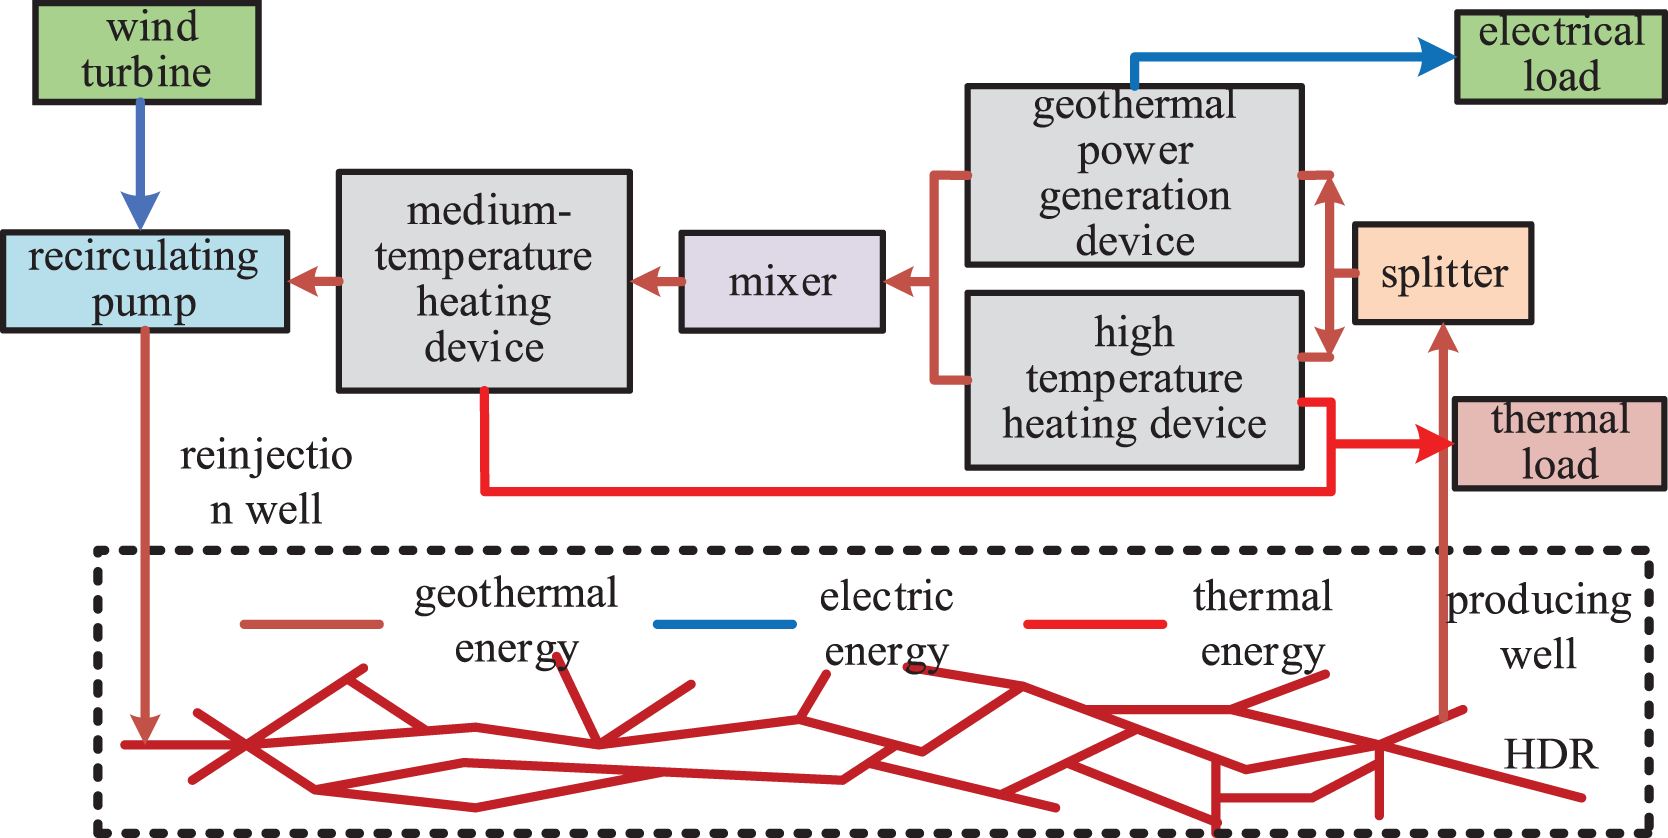
Figure 1: HDR-EGS architecture
As shown in Fig. 1, after extracting the geothermal mass from the production wells, it is flexibly distributed between the power generation device and the high-temperature heating device using a splitter. The splitter model relationship is as follows:
where
The waste heat temperature after the high-temperature heating device and the waste heat temperature after the geothermal power generation device are mixed through the mixer to provide the heat temperature for the medium-temperature heating device. The mixer energy model relationship is expressed as follows:
where
2.2 Geothermal Power Plant Model
With constant values of temperature, pressure and mass flow rate of the geothermal mass in the HDR heat extraction cycle; the system output can be adjusted to track the maximum power generation efficiency condition by adjusting the mass flow rate in the low-temperature power generation cycle. Assuming that the rated operating point of the geothermal power plant is always at the operating condition of maximum power generation efficiency; then,
where
The high-temperature heating plant is composed of two parts: the heat storage system and the high-temperature heat exchanger. If the high-grade heat energy provided by the high-temperature heat exchanger is recorded by
where
where
The heat storage and exothermic process of the high-temperature heat storage system are realized through heat transfer between heat-conducting oil and a high-temperature heat network, which consists of a heat exchange system, electric heating device, and high-temperature heat storage tank. The model of a high-temperature heat storage system is described as follows:
where
Since the model of the medium-temperature heating device is similar to that of the high-temperature heating device, it will not be repeated.
3 RIES Optimization Model with HDR-EGS
In China, Qinghai Province is relatively cold in winter and rich in geothermal and wind energy. There are favorable conditions for the development of HDR, GSHP, and CHP. In this paper, an area in Qinghai province is taken as an example for winter heating, and its structure diagram is shown in Fig. 2. It mainly contains HDR-EGS, CHP, wind turbine (WT), photovoltaic (PV), battery, and GSHP. The CH4 is converted into electricity by CHP and supplied to the district grid, and the district grid can interact with the main grid. The thermal load is provided by HDR-EGS, CHP, and GSHP through the district heat network. The electrical load is provided by HDR-EGS, CHP, WT, PV, battery, and main grid through the regional grid.
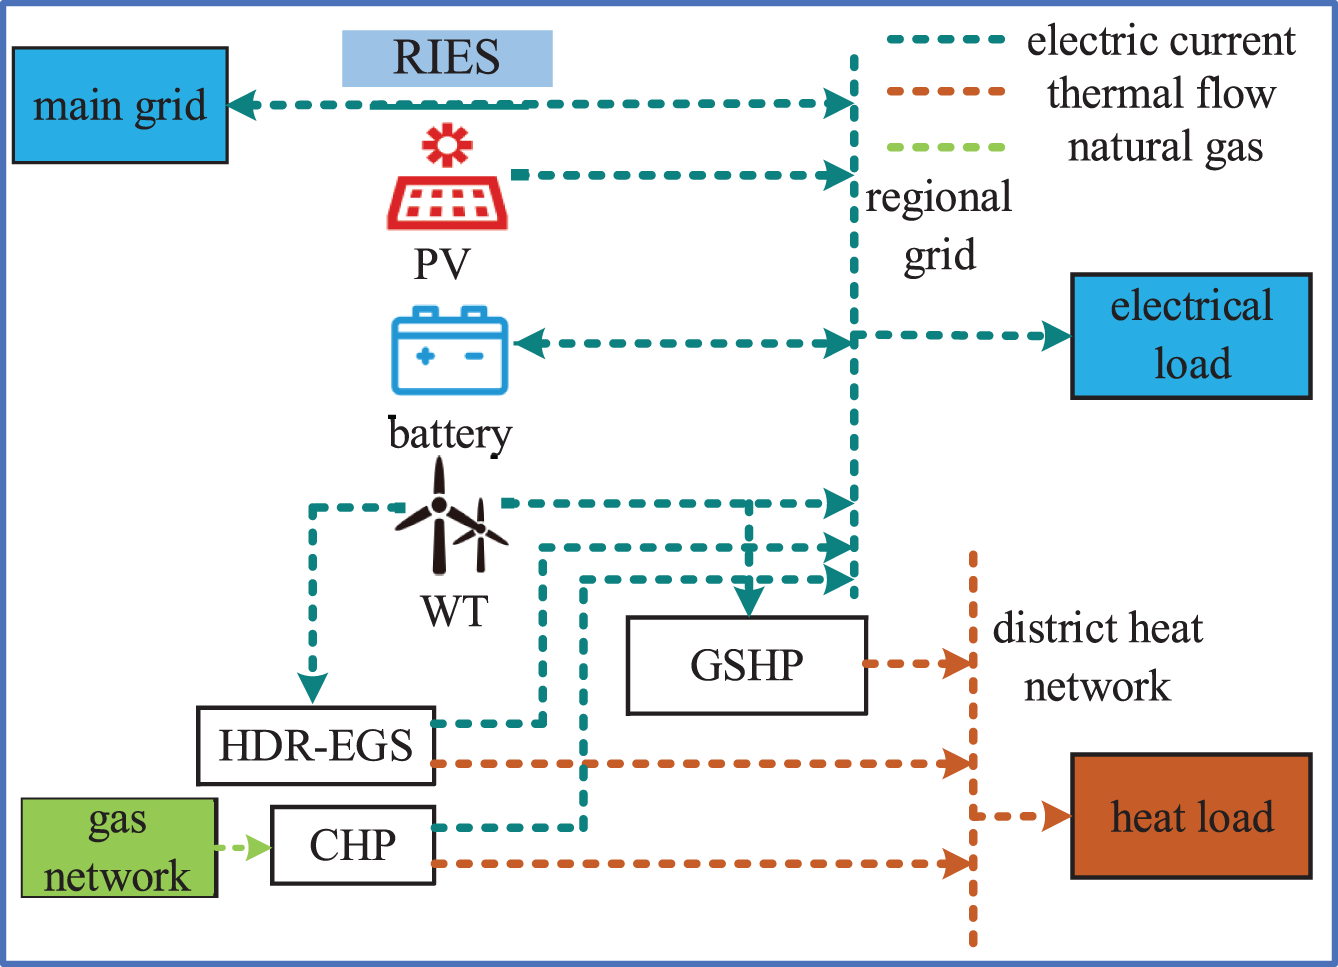
Figure 2: Structure diagram of the regionally integrated energy system
In this paper, the optimization objective is to minimize the total cost of RIES in a scheduling cycle. The total cost mainly includes the cost of power purchase and sale, fuel, maintenance, environmental, and wind abandonment penalty cost. The objective function can be expressed as follows:
where
where
Price-based demand response (PBDR) is mainly used for the resources whose residential electricity load is not schedulable. The mathematical model of the elasticity of the user’s electrical load demand can be expressed as follows [16]:
where
After the DR, the change of electrical load is expressed as follows:
The current load at any time is:
where
CHP, WT, PV, grid power purchase and sale, energy storage, HDR-EGS electrical output, and customer DR after the electrical load, GSHP, and back injection pump consumption electrical load together constitute the power balance constraint. CHP, HDR-EGS high and medium temperature heating system, GSHP heat output, and customer thermal load together constitute a thermal energy balance constraint. The CHP, the gas purchased from the grid, and the gas load after customer DR together constitute the gas power balance constraint. The power balance of electricity, heat, and gas is shown in the following equation:
where
Taking the prediction error of WP as a random variable and assuming that all WP prediction errors obey normal distribution, the distribution robust chance constraint of its prediction error can be expressed as follows [25]:
where
RIES is an integrated system consisting of several devices working together, and the device output is limited by the upper and lower limits of the device’s output as well as by climbing constraints as follows:
where
The power purchased and sold is constrained by the maximum values
The gas network purchase of gas power is also bounded by maximum values
The constraints of the energy storage device are as follows:
where
4.1 RIES Distribution Robust Scheduling Model Solving
The distributionally robust chance-constrained optimization form of the RIES scheduling model is shown in Eq. (23), which indicates that even in the worst-case scenario, the constraint still has a probability of occurring of not less than 1 −
where
If KL divergence measures the distance between the distribution function
where
As the distribution function of an uncertain variable in Eq. (23) is unknown, it is difficult to deal with it directly. However, reference [25] shows that Eq. (23) can be converted into a chance-constrained programming problem model with the following known distributions:
where
This expression indicates that constraint conditions have a probability of occurrence of not less than 1 −
where
4.2 Piecewise Linearization Method
In the above HDR-EGS co-generation model, the product
First, the minimum value of
where
where
So far, the DRO model of RIES can be solved in MATLAB directly by using a CPLEX solver.
5.1 Scheduling Results and Analysis
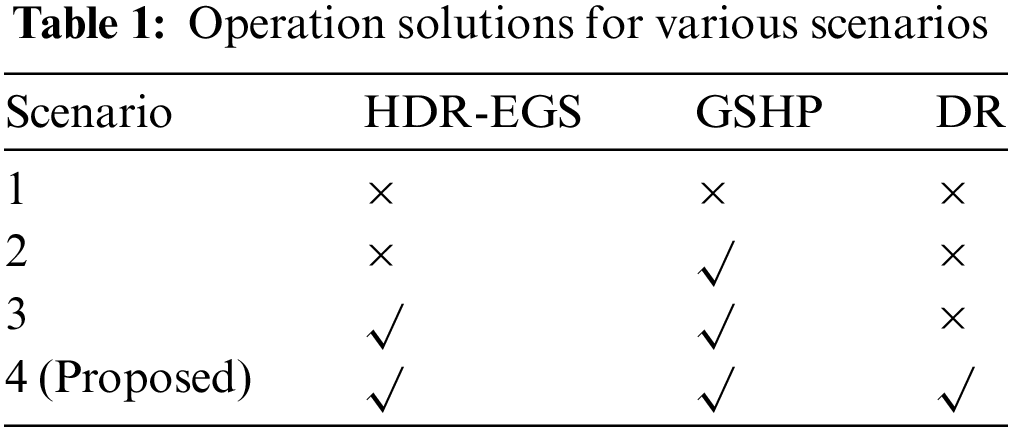
To verify the effectiveness of HDR-EGS and the integrated DR of electricity and gas in improving the RIES’s WP absorption capacity and reducing the RIES’s operating cost; the results of RIES scheduling are compared and analyzed in four different situations, among which case 4 is the optimal scheduling method proposed in this paper. The settings for each situation are shown in Table 1. The example parameters are described in [13,16].
The scheduling results of scenario 1 are shown in Fig. 3, from which CHP, WP, PV, battery, and the purchased and sold power between the main network share the electrical load in the RIES, and CHP bears the thermal load in the RIES. In this case, the CHP is restricted by the “fixing power by heat” operation mode, and the change of thermal load will always drive the power output, and the CHP cannot participate in the power supply adjustment independently, resulting in serious wind abandonment of the system and high scheduling cost. During the hours of 01:00–05:00 and 23:00–24:00, the power purchased and sold reaches the upper limit, and the remaining WP is forced to be abandoned.
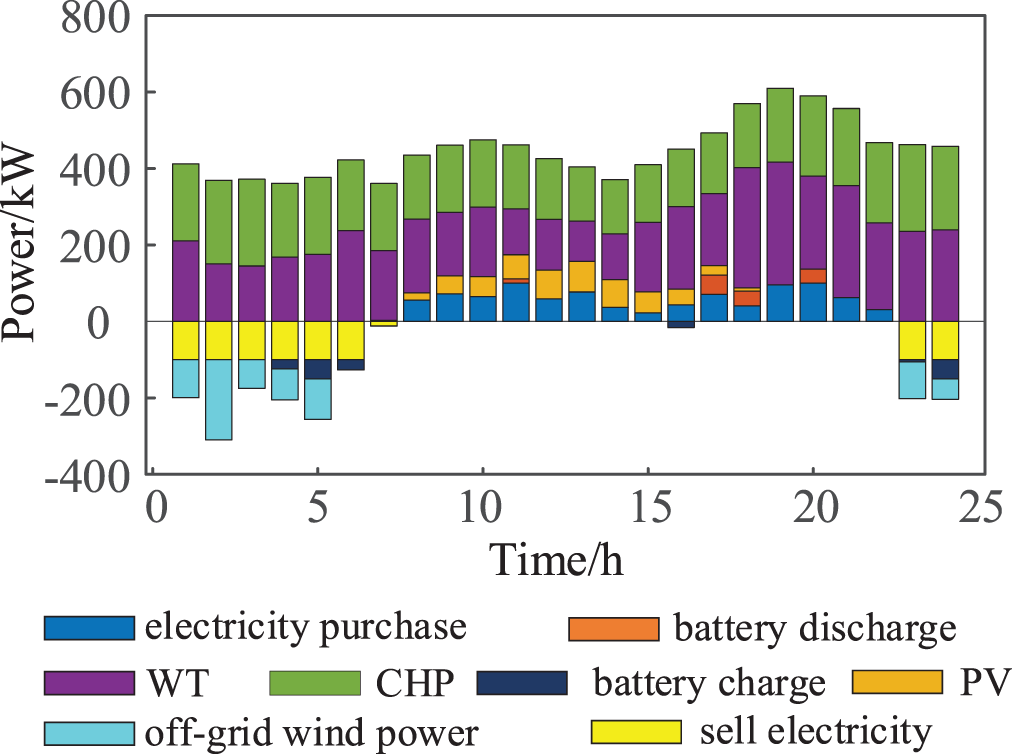
Figure 3: Scheduling results for scenario 1
The scheduling results of scenario 2 are shown in Fig. 4. During the hours of 01:00–06:00 and 23:00 to 24:00, the heating cost of the GSHP is relatively low, and it is preferentially invoked together with the CHP for heating. Compared with scenario 1, scenario 2 after adding the GSHP consumes WP, but at this time, the power is purchased and sold and the power of the GSHP reaches the upper limit. A small amount of WP is still being abandoned. In 07:00–16:00, and 17:00–22:00, the device power generation cost of CHP is lower than the cost of the RIES purchase/sale price. Affected by the operation mode of “fixing electricity by heat”, the thermal load is preferentially provided by CHP, and the GSHP is shut down.
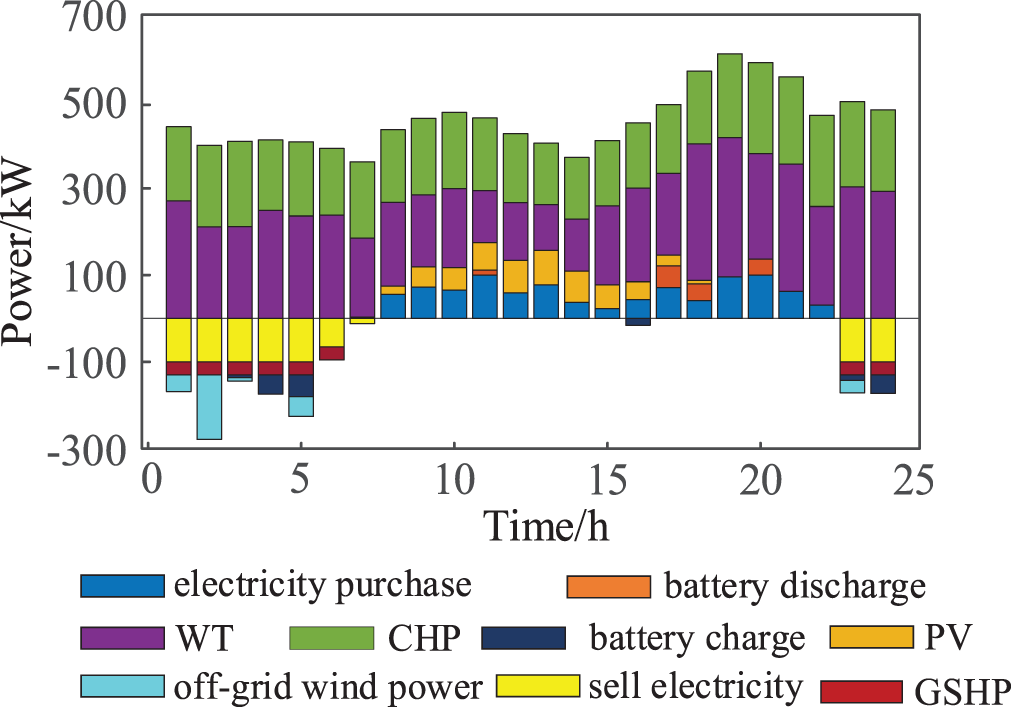
Figure 4: Scheduling results in scenario 2
The scheduling results of scenario 3 are shown in Fig. 5. As shown in Fig. 5, HDR-EGS needs to consume part of the electric load to ensure the complete operation of the entire enhanced geothermal system and build a WP-dry hot rock enhanced geothermal system to achieve the purpose of WP consumption. The GSHP is shut down during the whole operation, which is because HDR-EGS has high power generation and heating efficiency, and the system preferentially calls HDR-EGS for scheduling. The comparison of scenario 2 and scenario 3 scheduling results shows that HDR-EGS plays a more obvious role than GSHP in heating effect and WP consumption.
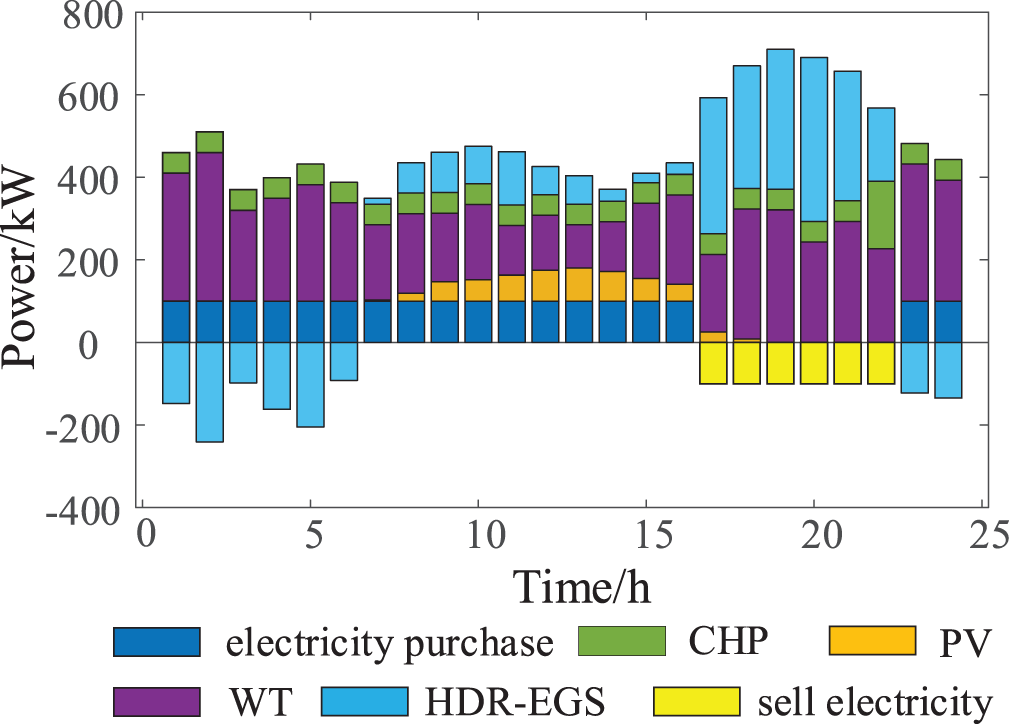
Figure 5: Scheduling results of scenario 3
Fig. 6 shows the load variation curve after considering the power-gas DR, and the scheduling results of scenario 4 are shown in Fig. 7. As shown in Fig. 7, the system carries out power-gas load transfer under the guidance of time-sharing pricing. Although scenario 3 has realized the full absorption of WP, theoretically it is conducive to improving the system’s WP absorption capacity as the power-gas power increases during the off-peak period after the DR. At the same time, with the reduction of power-gas power during peak hours, the system cost is reduced, thus improving the economy of system operation. Compared with case 3, case 4 has more advantages in terms of economy. Fig. 8 shows the time of use (TOU) electricity price and gas price.
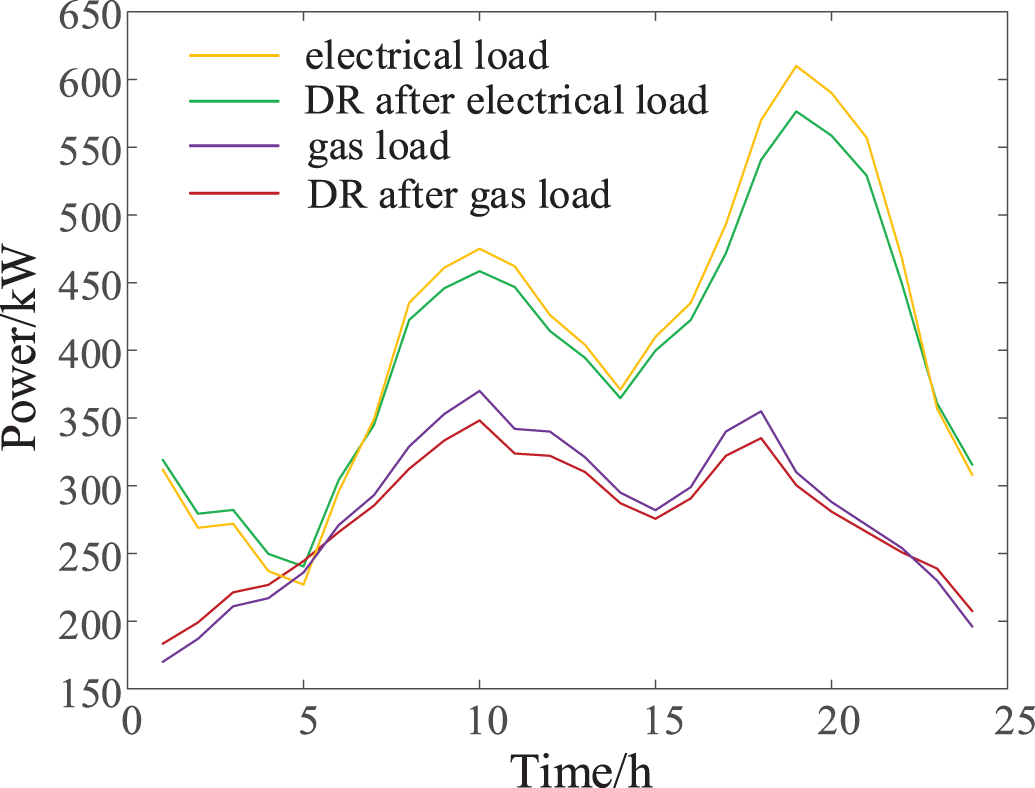
Figure 6: Load change curve
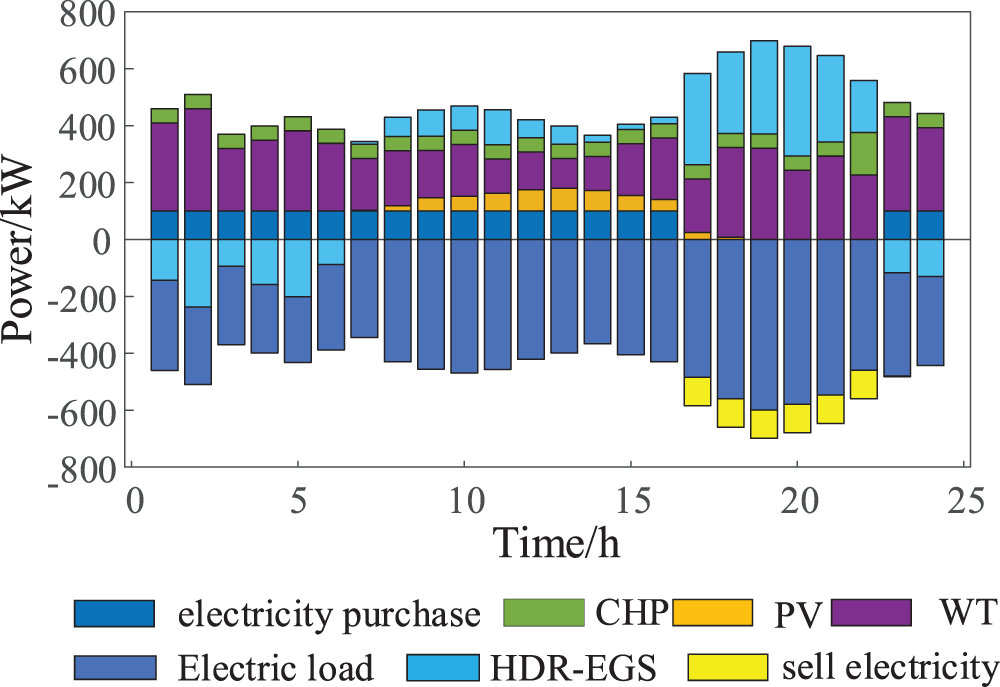
Figure 7: Scheduling results for scenario 4
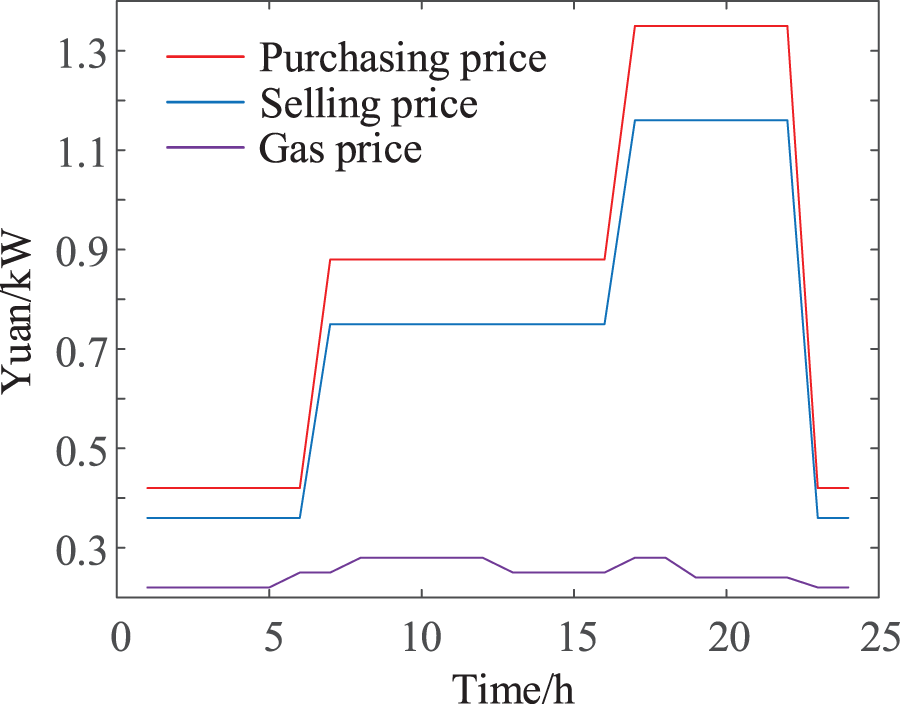
Figure 8: TOU electricity price and gas price
The operation data of each unit of the system is shown in Table 2. The parameters of the energy storage battery are shown in Table 3. The operation parameters of HDR-EGS are shown in Table 4.
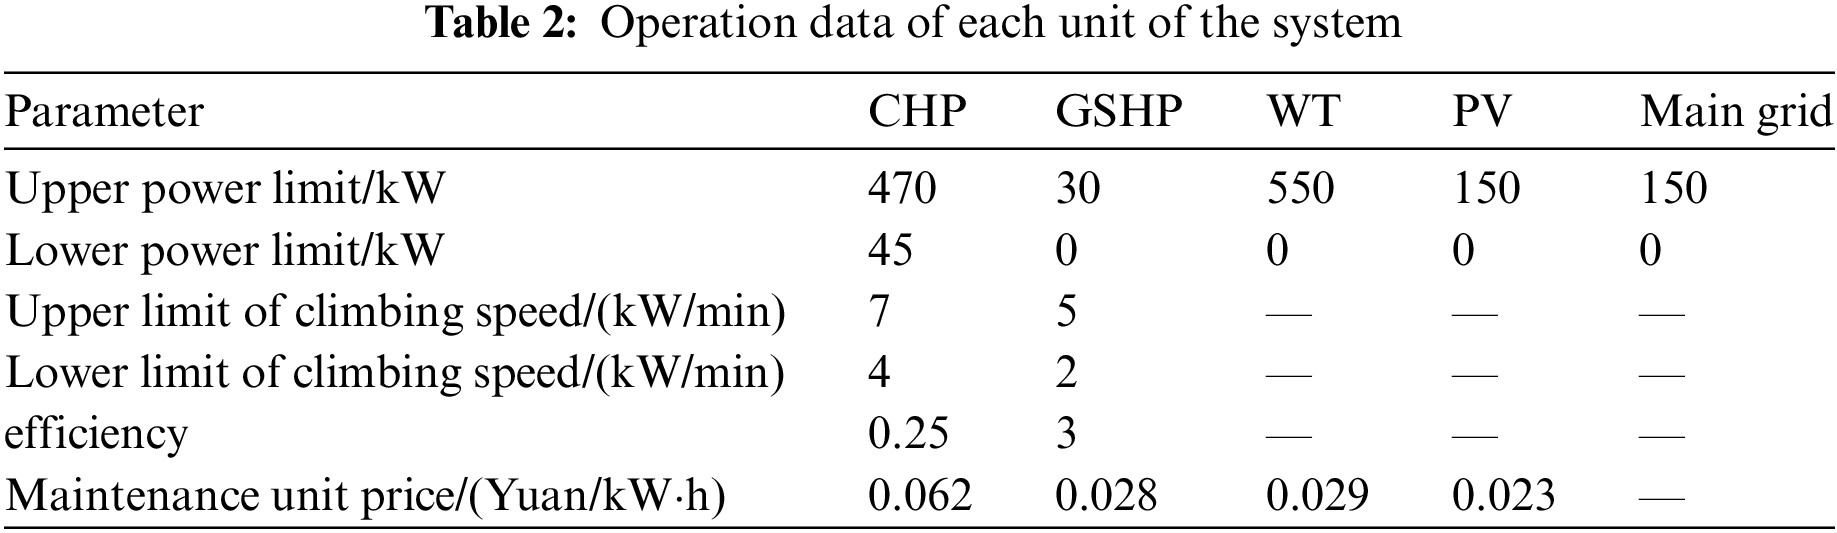
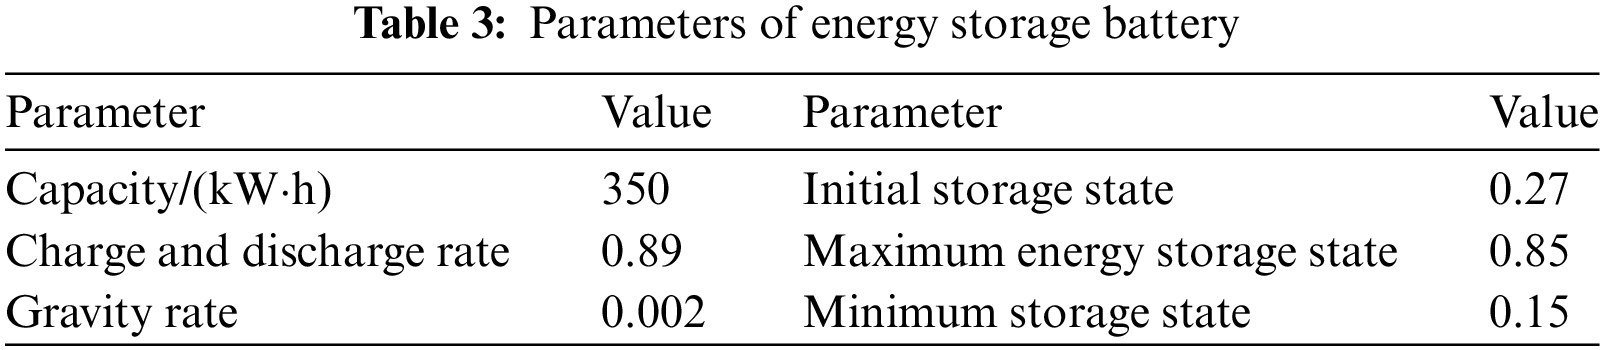
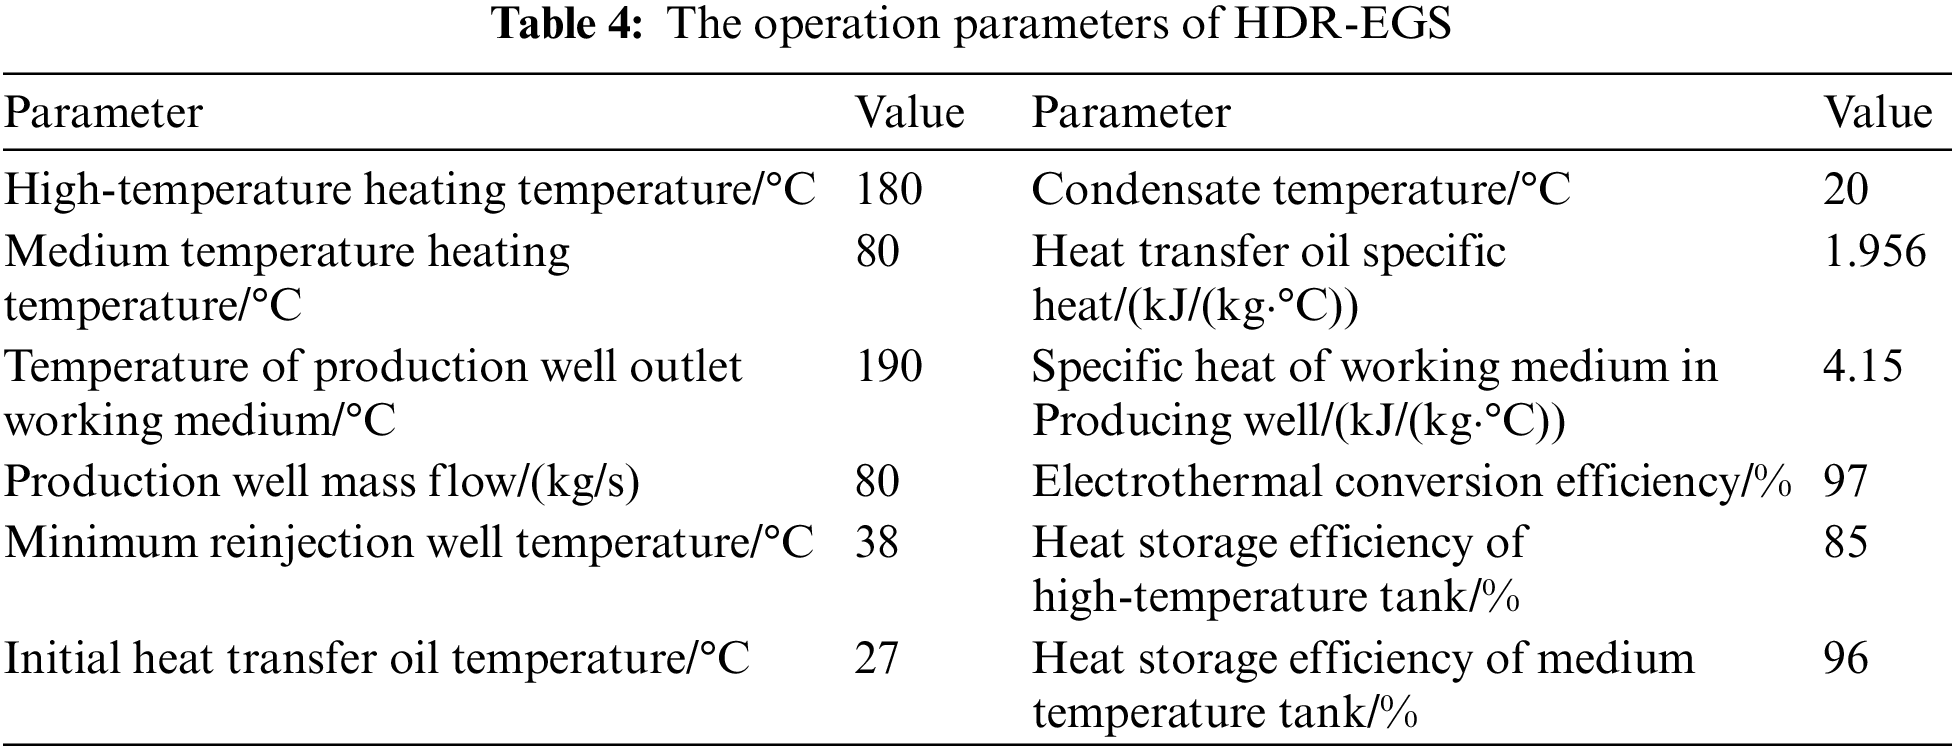
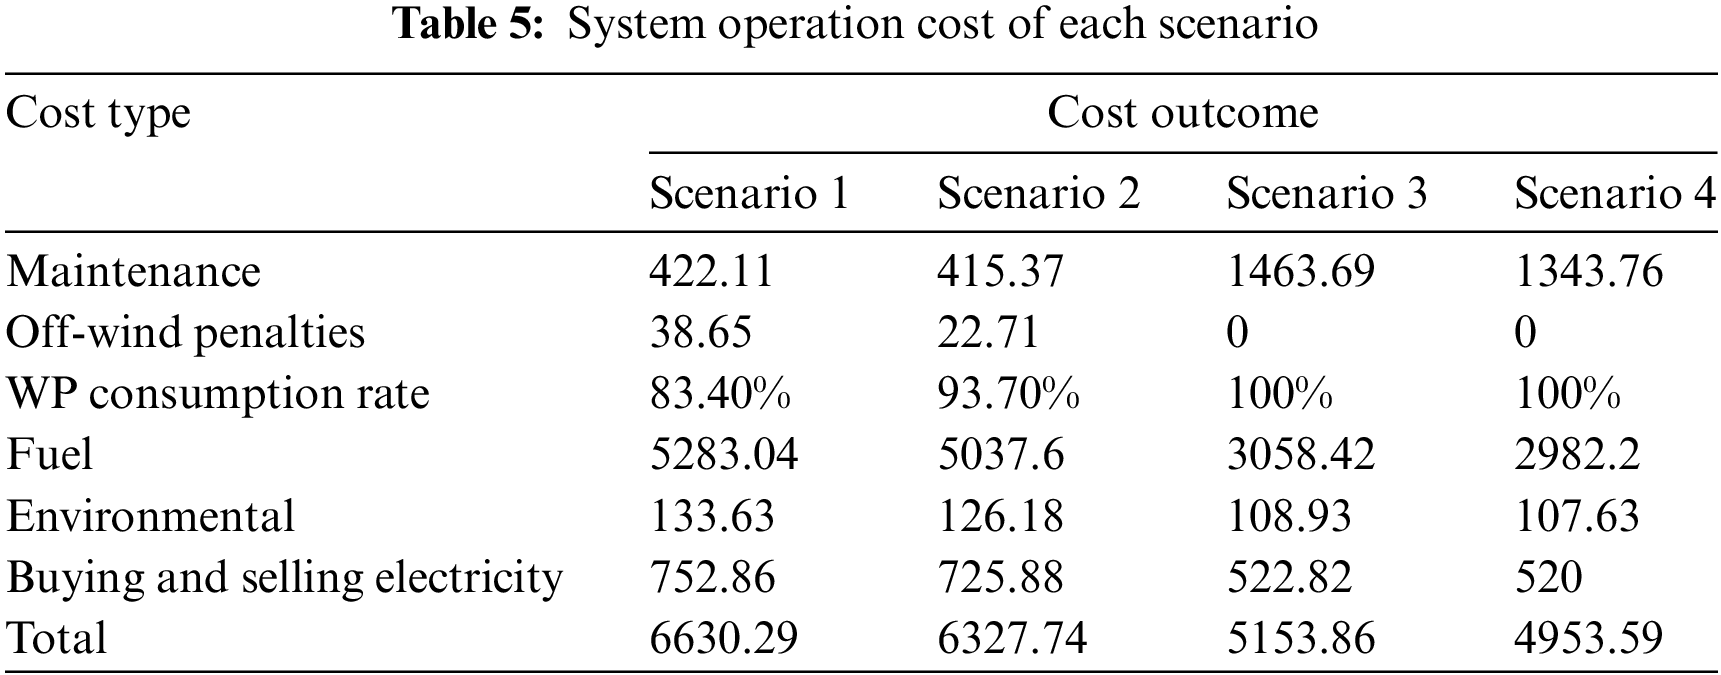
Table 5 shows the operating costs of RIES under different operating conditions in winter. According to Table 5, the scheduling result of scenario 4 is reasonable. Compared with scenarios 1, 2 and 3, the total dispatching cost is reduced by 1676.7, 1374.15 and 200.27 yuan, respectively, which has good economic benefits. The penalty cost and environmental cost of wind curtailment are 100% and 19.46% lower than scenario 1, respectively. The results show that the model has an obvious effect of energy saving and emission reduction while improving the WP absorption capacity of the system.
5.2 B Comparative Analysis of Wind Power Consumption
The WP consumption results of the four scenarios are shown in Fig. 9. Compared with scenario 1 and scenario 2, the WP consumption capacity of RIES is improved after the addition of GSHP at 01:00–06:00 and 22:00–24:00 when WP is in high frequency. The GSHP can convert the electrical load generated by the WT into thermal load. At this time, the thermal load in the RIES is shared by the CHP and the GSHP, which reduces the CHP heating power in the RIES. Limited by the operation mode of “fixing power by heat”, the CHP power supply is correspondingly reduced, thus increasing the WP consumption in the RIES. Compared with scenario 2 and scenario 3, RIES realized full absorption of WP after adding HDR-EGS. During HDR-EGS operation, the reinjection pump consumes a portion of the electrical load to ensure the complete operation of the entire enhanced geothermal system, providing both electrical and thermal load to the RIES. Through the introduction of HDR-EGS at the source side to construct a WP-dry hot rock enhanced geothermal system to optimize the heat source and power supply structure, the thermal load in the RIES is shared by CHP, GSHP, and HDR-EGS, which reduces the CHP heating and power supply power, improves the WP grid space in the RIES, and realizes the full absorption of WP. Scenario 4 considers the power-gas DR. With the increase of power-gas power in the low period after the DR, it is theoretically conducive to the consumption of WP. However, scenario 3 has achieved full consumption, so the graph trend of scenario 4 is consistent with that of scenario 3.
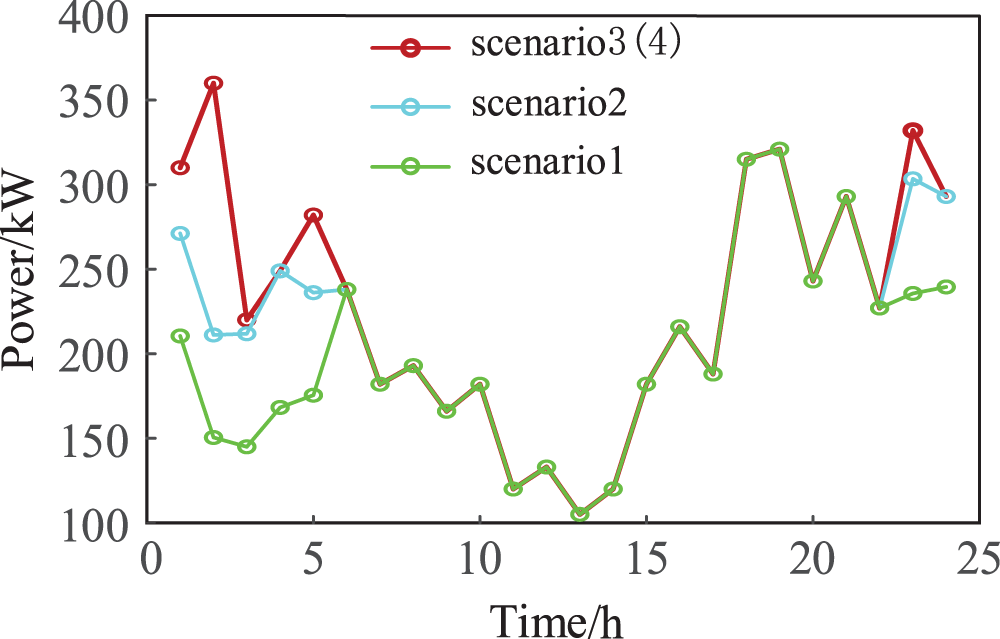
Figure 9: WP consumption comparison chart
5.3 Comparison of Different Stochastic Optimal Scheduling Models
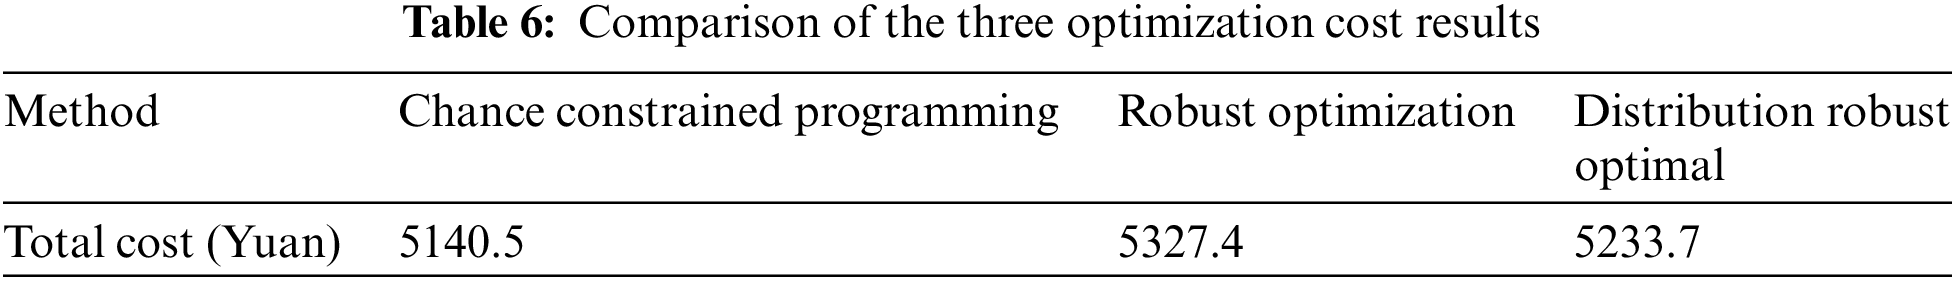
This paper discusses the influence of three stochastic optimization models on the scheduling results: the DRO model, the chance-constrained programming model, and the robust optimization model. In the optimization of DRO,
The cost results of the three models are shown in Table 6. As can be seen from Table 6, the more conservative the method, the higher the operating cost. The optimization model proposed in this paper is more robust than the chance-constrained optimization model. Although the robustness is poor compared with the robust optimization model, the optimization results have a better economy. The results show that the optimization model achieves a good balance between robustness and economy.
5.4 Influence Analysis of Parameter Setting in Distribution Robust Optimal
The decision maker’s risk preference in the distribution robust optimal depends mainly on two parameters: the confidence level
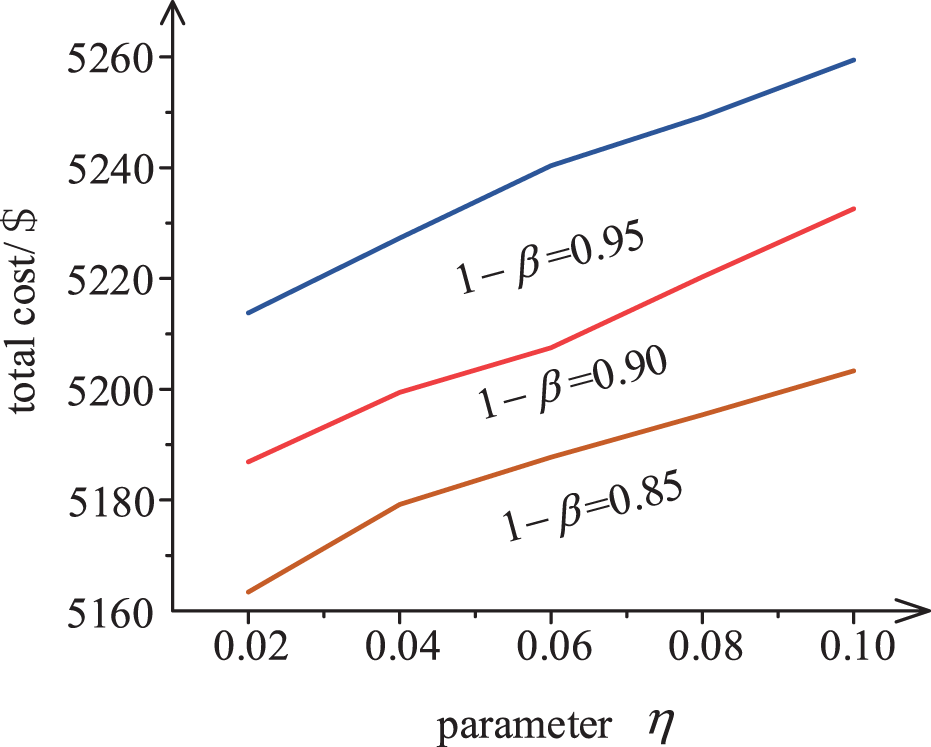
Figure 10: Scheduling results under different parameters
As can be seen from Fig. 10, when the confidence level
This paper presents a DRO scheduling model for a RIES considering HDR co-generation. The simulation was performed on a real RIES in Qinghai province, and the following conclusions were drawn:
(1) In terms of new energy utilization, the proposed scheduling method can solve the wind abandonment problem caused by CHP’s heat-determined power operation mode, and improve the system’s WP consumption capacity.
(2) From the economic point of view, the proposed scheduling method reduces the total cost by 27.52%, which effectively reduces the total cost of system operation during the scheduling cycle. From the environmental point of view, the environmental cost decreases by 19.46%, indicating that the proposed scheduling method has a more obvious effect on energy saving and emission reduction.
(3) The proposed DRO scheduling model has better robustness than the chance-constrained planning model. It is more economical than the robust optimization model. It can better balance the robustness and economy of scheduling results.
Acknowledgement: The authors present their appreciation to King Saud University for funding this research.
Funding Statement: The authors present their appreciation to King Saud University for funding this research through the Researchers Supporting Program Number (RSPD2024R704), King Saud University, Riyadh, Saudi Arabia.
Author Contributions: The authors confirm contribution to the paper as follows: study conception and design: H Q, M M; data collection: H Q, M S, A A, A I, M M; analysis and interpretation of results: H Q, M S, A A, A I, M M; draft manuscript preparation: H Q, M S, A A, A I, M M. All authors reviewed the results and approved the final version of the manuscript.
Availability of Data and Materials: The data supporting reported results are available in the manuscript.
Conflicts of Interest: The authors declare that they have no conflicts of interest to report regarding the present study.
References
1. Sugito Y, Vazquez-Corral J, Canham T, Bertalmío M. Image quality evaluation in professional HDR/WCG production questions the need for HDR metrics. IEEE Trans Image Process. 2022;31:5163–77. doi:10.1109/TIP.2022.3190706. [Google Scholar] [PubMed] [CrossRef]
2. Dong J, Wang H, Yang J, Gao L, Wang K, Zhou X. Low carbon economic dispatch of integrated energy system considering power supply reliability and integrated demand response. Comp Model Eng Sci. 2022;132(1):319–40. doi:10.32604/cmes.2022.020394. [Google Scholar] [CrossRef]
3. Zhou B, Xu D, Li C. Optimal scheduling of biogas-solar–wind renewable portfolio for multicarrier energy supplies. IEEE Trans Power Syst. 2018;33(6):6229–39. [Google Scholar]
4. Aliyu MD, Archer RA. A thermo-hydro-mechanical model of a hot dry rock geothermal reservoir. Renew Energy. 2021;176:475–93. [Google Scholar]
5. Niu Y, Wu J, Liu W, Guo W, Lau RW. HDR-GAN: HDR image reconstruction from multi-exposed LDR images with large motions. IEEE Trans Image Process. 2021;30:3885–96. [Google Scholar] [PubMed]
6. Huang W, Cen J, Chen J. Heat extraction from hot dry rock by super-long gravity heat pipe: a field test. Energy. 2022;247:123492. [Google Scholar]
7. Wu X, Huang Z, Dai X, Song H, Zhang S. Thermo-coupled FSI analysis of LN2 jet impinging on the hot dry rock. Appl Therm Eng. 2020;165:114621. [Google Scholar]
8. Prananto LA, Zaini IN, Mahendranata BI. Use of the Kalina cycle as a bottoming cycle in a geothermal power plant: a case study of the Wayang Windu geothermal power plant. Appl Therm Eng. 2018;132:686–96. [Google Scholar]
9. Yue C, Han D, Pu W, He W. Comparative analysis of a bottoming transcritical ORC and a Kalina Cycle for engine exhaust heat recovery. Energy Conv Manag. 2015;89:764–74. [Google Scholar]
10. Zhang F, Xu R, Jiang P. Energy flow analysis of carbon dioxide capture and geothermal power generation. Nat Gas Ind. 2022;42(4):130–8. [Google Scholar]
11. Yan XX, Liu YG, Wang GL. Optimal injection rate of water in the guide basin hot dry rock mining project. Energy Explor Exploit. 2019;37(2):721–35. [Google Scholar]
12. Zhang YJ, Li ZW, Guo LL. Electricity generation from enhanced geothermal systems by oilfield produced water circulating through reservoir stimulated by staged fracturing technology for horizontal wells: a case study in Xujiaweizi Area in Daqing Oilfield, China. Energy. 2014;78:788–805. [Google Scholar]
13. Bagherian MA, Mehranzamir K. A comprehensive review on renewable energy integration for combined heat and power production. Energy Conv Manag. 2020;224:113454. [Google Scholar]
14. Lin S, Song W, Feng Z, Zhao Y, Zhang Y. Energy management strategy and capacity optimization for CCHP system integrated with electric-thermal hybrid energy storage system. Int J Energy Res. 2020;44(2):1125–39. [Google Scholar]
15. Wei Z, Huang Y, Gao H, Shui Y. Joint economic scheduling of power-to-gas and thermoelectric decoupling CHP in regional energy internet. Power Syst Technol. 2018;42(11):3512–20. [Google Scholar]
16. Chen H, Gao L, Zhang Y, Zhao C. Optimal scheduling strategy of a regional integrated energy system considering renewable energy uncertainty and heat network transmission characteristics. Energy Rep. 2022;8:7691–7703. [Google Scholar]
17. Liu D, Shang C, Cheng H. A two-stage robust optimization for coordinated planning of generation and energy storage systems. In: IEEE Conference on Energy Internet and Energy System Integration (EI22017; Beijing, China; p. 1–5. [Google Scholar]
18. Tian G, Sun ZQ. Chance constrained distributionally robust optimal HVAC scheduling for commercial building demand response. In: IEEE Power & Energy Society Innovative Smart Grid Technologies Conference (ISGT2022; New Orleans, LA, USA; p. 1–5. [Google Scholar]
19. Yang CI, Jiang T, Zhong W. Economic scheduling approach of RIES for electric vehicle and heat pump to promote wind power accommodation. Electr Power Autom Equip. 2021;41(2):1–7. [Google Scholar]
20. Tan H, Ren Z, Yan W. A wind power accommodation capability assessment method for multi-energy microgrids. IEEE Trans Sustain Energy. 2021;12(4):2482–92. [Google Scholar]
21. Zhang Z, Song M, Liu H, Wang C, Li L, Liu W. Review of typical energy storage resources from the perspective of generalized energy storage system. In: IEEE 5th International Electrical and Energy Conference (CIEEC2022; Nanjing, China; p. 4733. [Google Scholar]
22. Abada A, St-Hilaire M, Shi W. Auction-based scheduling of excess energy consumption to enhance grid upward flexibility. IEEE Access. 2022;10:5944–56. [Google Scholar]
23. Yang L, Cai Y, Qiao Y, Yan N, Ma S. Research on optimal allocation method of energy storage considering supply and demand flexibility and new energy consumption. In: IEEE 4th Conference on Energy Internet and Energy System Integration (EI22020; Wuhan, China; p. 4368–73. [Google Scholar]
24. Wang H, Gu C, Zhang X, Li F. Optimal CHP planning in integrated energy systems considering network charges. IEEE Syst J. 2020;14:2684–93. [Google Scholar]
25. Mohamed MA, Jin T, Su W. An effective stochastic framework for smart coordinated operation of wind park and energy storage unit. Appl Energy. 2020;272:115228. [Google Scholar]
26. Tan H, Yan W, Ren Z, Wang Q, Mohamed MA. Distributionally robust operation for integrated rural energy systems with broiler houses. Energy. 2022;254:124398. [Google Scholar]
27. Tan H, Li Z, Wang Q, Mohamed MA. A novel forecast scenario-based robust energy management method for integrated rural energy systems with greenhouses. Appl Energy. 2023;330:120343. [Google Scholar]
28. Tan H, Yan W, Ren Z, Wang Q, Mohamed MA. A robust dispatch model for integrated electricity and heat networks considering price-based integrated demand response. Energy. 2022;239:121875. [Google Scholar]
Cite This Article
 Copyright © 2024 The Author(s). Published by Tech Science Press.
This work is licensed under a Creative Commons Attribution 4.0 International License , which permits unrestricted use, distribution, and reproduction in any medium, provided the original work is properly cited.
 Downloads
 Citation Tools