
 Submit a Paper
 Propose a Special lssue
 Open Access
ARTICLE

An Improved Deep Learning Framework for Automated Optic Disc Localization and Glaucoma Detection
1 Department of Information Technology, College of Computer and Information Sciences, Princess Nourah bint Abdulrahman University, P.O. Box 84428, Riyadh, 11671, Saudi Arabia
2 Department of Computer Sciences, College of Computer and Information Sciences, Princess Nourah bint Abdulrahman University, P.O. Box 84428, Riyadh, 11671, Saudi Arabia
3 Department of Information System, College of Computer and Information Sciences, Princess Nourah bint Abdulrahman University, P.O. Box 84428, Riyadh, 11671, Saudi Arabia
* Corresponding Author: Hela Elmannai. Email:
Computer Modeling in Engineering & Sciences 2024, 140(2), 1429-1457. https://doi.org/10.32604/cmes.2024.048557
Received 06 December 2023; Accepted 27 March 2024; Issue published 20 May 2024
 View Full Text
 Download PDF
Abstract
Glaucoma disease causes irreversible damage to the optical nerve and it has the potential to cause permanent loss of vision. Glaucoma ranks as the second most prevalent cause of permanent blindness. Traditional glaucoma diagnosis requires a highly experienced specialist, costly equipment, and a lengthy wait time. For automatic glaucoma detection, state-of-the-art glaucoma detection methods include a segmentation-based method to calculate the cup-to-disc ratio. Other methods include multi-label segmentation networks and learning-based methods and rely on hand-crafted features. Localizing the optic disc (OD) is one of the key features in retinal images for detecting retinal diseases, especially for glaucoma disease detection. The approach presented in this study is based on deep classifiers for OD segmentation and glaucoma detection. First, the optic disc detection process is based on object detection using a Mask Region-Based Convolutional Neural Network (Mask-RCNN). The OD detection task was validated using the Dice score, intersection over union, and accuracy metrics. The OD region is then fed into the second stage for glaucoma detection. Therefore, considering only the OD area for glaucoma detection will reduce the number of classification artifacts by limiting the assessment to the optic disc area. For this task, VGG-16 (Visual Geometry Group), Resnet-18 (Residual Network), and Inception-v3 were pre-trained and fine-tuned. We also used the Support Vector Machine Classifier. The feature-based method uses region content features obtained by Histogram of Oriented Gradients (HOG) and Gabor Filters. The final decision is based on weighted fusion. A comparison of the obtained results from all classification approaches is provided. Classification metrics including accuracy and ROC curve are compared for each classification method. The novelty of this research project is the integration of automatic OD detection and glaucoma diagnosis in a global method. Moreover, the fusion-based decision system uses the glaucoma detection result obtained using several convolutional deep neural networks and the support vector machine classifier. These classification methods contribute to producing robust classification results. This method was evaluated using well-known retinal images available for research work and a combined dataset including retinal images with and without pathology. The performance of the models was tested on two public datasets and a combined dataset and was compared to similar research. The research findings show the potential of this methodology in the early detection of glaucoma, which will reduce diagnosis time and increase detection efficiency. The glaucoma assessment achieves about 98% accuracy in the classification rate, which is close to and even higher than that of state-of-the-art methods. The designed detection model may be used in telemedicine, healthcare, and computer-aided diagnosis systems.Keywords
Ocular diseases include diabetic retinopathy, Glaucoma, and myopia. Detecting and monitoring these diseases requires an accurate computer-aided diagnosis tool to avoid manual methods and to save time [1]. These diseases can be detected through the observation of the optic nerve head, the optic nerve fibers and intraocular pressure. Computer-aided systems are useful for performing an objective and fast diagnosis. Related applications existing applications include optic disc and cup segmentation and eye disease detection [2,3].
The optic disc is an area of interest used to analyze and detect the presence of anomalies for constructing an automatic diagnosis system. There are two regions in the OD: the edge region and the bright region. The later central one is known as the optic cup.
OD and retina appearance may vary significantly, even in healthy eyes. Various levels of reflected illumination from the fundus are caused by the concave shape of the retina. Moreover, the melanin concentration varies in the epithelium layer of the retina.
Pathological changes occurring at the optic disc (OD) can significantly alter its appearance, including neovascularization resulting from diabetic retinopathy (DR) or modifications in the physiological cup. Other anomalies can impact the OD form. ODs may also appear less distinct and blurry if the retinal image is unevenly illuminated or poorly focused. A macular-centered photograph usually shows more brightness on the temporal side than on the nasal side.
Developing an efficient digital technology for ophthalmic disease detection requires OD localization and segmentation. Especially at the early glaucoma stage, the OD shape change is within the first stage of pathology development before vision loss. The optic nerve shape change is caused by the intraocular pressure, which causes irreversible damage to the nerve fiber. The damage is assessed according to several morphological parameters such as the cup-to-disc ratio, the rim-to-disc ratio and the neuroretinal rim widths: inferior, superior, nasal, and temporal [4–6].
The leading cause of irreversible blindness in the world today is Glaucoma and is also predicted to affect millions of people. The disease starts without symptoms and causes peripheral vision loss gradually. An early detection of this disease is inherent to preventing irreversible progress [7]. Available fundus images allow one to examine the interior eye and are less expensive than optical coherence tomography [8]. An enlarged cup-to-disc ratio indicates Glaucoma since the cup zone enlarges relative to the optic cup. Determining this ratio can be time-consuming and inaccurate when performed manually. Moreover, it requires expertise and quantitative measurements including the following measurements and ratios: Dimensions of the OD, the height of the retinal nerve fiber layer, and the ratio of the cup to the disc [9]. In a glaucomatous eye, the optic cup is enlarged, which increases the cup-to-disc ratio to more than 0.5.
Computer-Aided Diagnostic (CAD) systems have improved the detection rate and reduced the screening time. Principally, the screening method is based on segmentation or learning capability to recognize the glaucoma case.
Segmentation-based approaches require a segmentation phase to determine the clinical parameter cup-to-disc ratio. The segmentation efficiency is easily affected by pathological regions and low-contrast quality.
Learning-based techniques achieved high accuracy (90%–98%). However, the usage of handcrafted features or the scarcity of fundus images can limit the screening method’s generalization ability.
Machine learning-based diagnosis systems achieved remarkable accuracy. However, manual feature extraction/election may increase the cost of screening computing. Deep learning techniques, commonly utilized for image classification, have leveraged an automatic feature extraction but require large learning datasets.
In this paper, we proposed a novel deep learning-based model for glaucoma detection. Two major steps are presented: a deep localization of OD and a glaucoma assessment based on different deep and machine learning architectures. Cascading OD detection and glaucoma detection are used to avoid the traditional methods based on the calculation of clinical parameters and to overcome the limitation of the cup-to-disc ratio calculation. The usage of different datasets and transfers will enhance detection accuracy and overcome data scarcity and diversity. Below are the key findings of this study:
• Performing OD localization based on object detection deep neural networks.
• We will perform glaucoma assessment based on the OD region. The eye classification into normal or glaucomatous will be based on several convolutional deep neural networks and the support vector machine classifier. These classification methods contribute to producing robust classification results. We apply data augmentation and transfer learning to enhance the detection performance. Based on our current understanding, existing deep learning-based research on glaucoma assessment used the whole fundus image, which is unnecessary as Glaucoma can be assessed based on the OD. Moreover, excluding the remaining fundus area will reduce the assessment error and the processing time.
• Two datasets are used for the experiments. In addition, these datasets are combined to create a third combined performance appraisal dataset. This approach was suggested as a new technique in medical data processing. As acquiring medical data is costly, merging datasets will provide robustness and remedy the problem of data scarcity.
• We considered both the accuracy and the area under the curve to assess the performance of the glaucoma detection framework, whereas existing works considered only the area under the curve for performance assessment.
• A performance evaluation for the three deep models and the support vector machine (SVM) classifier is provided in the three datasets.
• In classification tasks and as a baseline or feature extractor, pretrained models are widely used. For deep model selection, based on area under the curve (AUC) and accuracy, previous research concluded that the Inception-ResNet-V2 and Inception models have consistently exhibited superior performance and emerged as the most promising models.
The background and related works for glaucoma assessment are discussed in Section 2. Section 3 details the proposed methodology for OD localization and glaucoma assessment. A comprehensive description of the datasets, the dataset’s generation via the combination of original datasets, the object detection deep learning model, the clustering algorithm and the convolutional neural network (CNN) architectures are provided within this section. An outline of the joint deep architecture, data augmentation, transfer learning and fine-tuning is also provided within this section.
Section 4 reports the performance assessment for the OD localization step and the glaucoma detection step. Several measurements are presented for classification validation and results comparison. Section 4 also reports the simulation results and a comparison with existing works in the field of OD localization and glaucoma detection. Section 5 provides the research conclusions, main outcomes, and limitations, as well as future work for practitioners based on CAD implementation.
Several effective methods exist for the segmentation of the optic disc and the optic cup. Optic disc segmentation approaches can be divided into groups: characterization-based, model-based and learning-based methods. Characterization-based methods use features including intensity, brightness, appearance, and shape of the OD. Model-based methods use a template image to find the best match [10].
The algorithm proposed in [11] started by locating the region of interest using the three channels (RGB), and then used the circular Hough transform to measure the Shannon information content per channel in the previously localized region. The first step includes the application of a Gaussian filter to eliminate blood vessels and hemorrhages based on the approximate size of the optic disc in pixels. The multispectral analysis using Otsu multi-level thresholds aims at eliminating the region of excessive illumination. The second step, a morphological operation called closing, is applied to remove the blood vessels, and a vote system in the accumulator array is used to estimate the center of the optic disc. The main limitation of this work is the assumption of the circular shape of the optic disc, by assuming that it is in the center of the image. Zahoor et al. [9] developed a similar approach dedicated to the early detection of Glaucoma. They built a hybrid approach based on polar transform-based adaptive threshold and circular Hough transform.
Retinopathy can cause large variations in optic disc shape, color, and size. An analysis of local feature spectrums was proposed by the authors in [12]. Each candidate, in the training stage, is reconstructed utilizing a collection of local features. The dictionary construction uses a sparse dictionary selection approach, and the classification uses k-nearest neighbor (kNN) and the support vector machine (SVM).
A template-matching approach is proposed in [13]. Optical disc detection relies on adaptive template size design and blood vessel patterns on the optic disc surface. Prior to optic disc segmentation, the algorithm includes a blood vessel removal process using alternating sequential filtering (ASF) and bright region removal using morphological reconstruction. The proposed level set model for the segmentation of the boundary combines the region’s information and the local edge gradient’s information. The problem with the template matching methodology is that the optic disc size depends on the image resolution and the camera’s field of view (FOV). Wankhede et al. [14] presented an OD size estimation algorithm, used to adapt the template size according to the camera FOV and the image resolution.
Main research works assume that the optic disc area provides rich information and that the entropy in this area has a significant value. The author in [15] suggested an algorithm that recursively constructs patches of varied sizes. Overlapping and non-overlapping sliding windows are used to locate the optic disc.
The paper in [16] described an OD localization method based on an improved algorithm of Harris corner detection. The algorithm detects the corner points based on the corner response function (CRF) value of each pixel. A sliding window is applied, and the window with the largest number of corner points is considered to be the position of the optic disc.
The main target of the work elaborated by Cheng et al. [17] is producing new retinal images suitable for further exploitation by other applications. A structure-preserving guided retinal image filtering process is proposed to restore images based on the attenuation and scattering model. This improved the contrast of retinal images in terms of histogram flatness, histogram spread and variability of local luminosity.
The authors in [18] proposed transforming the usual 2D searching space into a 1D searching space, which speeds up the localization process. The approach consists of encoding the x and y coordinates, and obtaining two projections of the image features of the OD.
The authors in [19] used supervised superpixel classification using simple linear iterative clustering (SLIC) and K-mean clustering. The statistical pixel-level (SPL) is used to differentiate the features for the OD, optic cup, blood vessel, and background regions. The support vector machine (SVM) classifier helps to determine the boundaries of both the optic disc and optic cup. The cup-to-disc ratio (CDR) measurement is used to determine the presence of Glaucoma. A preprocessing phase includes the implementation of anisotropic and illumination correction. A review of some clustering methods, such as superpixel classification, fuzzy C means clustering and adaptively regularized kernel-based fuzzy C means clustering, can be found in [20].
The authors in [21] focused on the detection of Glaucoma by using a region-based pixel-density for optic disc localization. This phase includes multiple steps: the color channel selection extracts the green channel from the RGB fundus images. Through morphological openings using line structuring elements, small pathological distractions such as lesions, cotton wool spots, and exudates can be removed.
Adaptive histogram equalization is applied to small regions of the image using contrast-limited adaptive histogram equalization (CLAHE). To achieve the OD localization, the center point of the region of interest is calculated, pixel density is calculated, and multilevel localization is performed. Segmentation of optic discs was achieved using an improved circular Hough transform, Hough peak value selection, and red channel superpixel segmentation.
The authors in [22] assumed an elliptical shape of the OD instead of a circular one. It is considered as the bright part with the highest elliptical symmetry. Moreover, the proposed approach exploited the high vessel density in the OD region.
The authors in [23] focused on imaging artifacts, diffuse bright areas that often occur in large datasets and result from eyelash bats or lenses lubricants or reflections. The authors used a sliding window in the x-axis and y-axis based on vessel tree orientation and the brightness information to localize the OD center. Early diabetic retinopathy detection is investigated in [24], where the authors paid particular attention to micro aneurysms and hemorrhages and focused on mathematical morphology operators. An iterative morphological process, including several operations, such as opening and closing, is applied to the preprocessing phase and blood vessel detection.
Advanced parametric, multidimensional, uncertain gradient-free, and gradient-based learning algorithms have been actively developed in recent years [25]. Parametric learning algorithms, including deep neural networks, convolutional neural networks, recurrent neural networks, and transformer networks, have offered new feature learning for image and sequential data. Multidimensional machine learning algorithms were effective for handling high-dimensional data. Gaussian Processes can capture uncertainty and provide a posterior distribution. Different optimization algorithms were proposed for the optimal solution search. The Bayesian optimization uses a probabilistic model for the objective function. Genetic algorithms use mutation, crossover, and selection operations to find optimal solutions. For the training stage, different gradient-based optimizers were proposed: mini-batch based training (Stochastic Gradient Descent optimizer), adaptive learning rate optimizer (Adam optimizer), and Newton optimization optimizer (Limited-memory Broaden-Fletcher-Goldfarb-Shannon).
Abbas et al. [26] proposed a study in which they implemented a glaucoma deep learning model in which an unsupervised CNN extracted the features. A CDR threshold of 0.5 discriminated between normal and glaucomatous cases. The accuracy was 89.67%, the sensitivity was 83.33%, and the specificity was 93.89%, while the AUC was 0.93. According to the research led by Alexander et al. [27], a CNN architecture was utilized to automatically extract the image features, and the classification into normal and glaucomatous images was performed by means of the SVM. The achieved accuracy was 88.2%, the specificity was 90.8% and the sensitivity was 85%. Training from scratch of a new deep convolutional neural network (DCNN) for glaucoma detection was proposed by Chen et al. [28]; this method achieved an AUC and accuracy of 0.887 and 0.831, respectively. Among the training optimization techniques, transfer learning has been used to train the model on general information generated by a huge dataset. Orlando et al. [29] used a pretrained CNN model for glaucoma detection. Various CNNs were compared in [30] to demonstrate the impact of the DCNN architecture, transfer learning and the dataset. The results demonstrate that VGG-19 achieved an AUC of 0.89, a sensitivity of 0.87 and a specificity of 0.89.
A novel method based on OD and optic cup segmentation was proposed in [31]. A generated bespoke model, UNET++, was constructed, and a specific loss function corrected the diminutive optic nerve size. The obtained accuracy was 96%. Another deep model named Unet-SNet was proposed in [32]. First, UNET architecture is trained for OD segmentation. Then, a Squeeze Net is fine-tuned, based on OD properties, to classify the images. The obtained glaucoma detection accuracy was 93.61%. The researchers in [33] proposed an architecture named Self-Organized Operational Neural Networks that achieved higher detection performance and decreased the computational complexity, as demonstrated in the experimentation.
Two deep models, M-Net and DENet, were proposed in [34], where the first model performs image segmentation and the second one predicts Glaucoma from ultrasound fundus images based on four deep streams. A two-stage framework presented in [35] started by cropping the OD according to graph saliency. Then, the authors used three different CNNs and combined the architecture’s output using different combination approaches.
Deep learning models are specific networks designed to extract deep features and recognize a particular pattern. Learning algorithms are implemented to adjust the network weights and biases to achieve maximum network efficiency. Compared to traditional approaches, deep learning techniques provide a more dimensional feature space and nonlinear mapping of the output labels. Different uses of deep learning include image categorization and illness detection. We present a conceptually general framework for CAD systems that handles two tasks: object instance detection (OD in our case) and pathology diagnosis. Our approach is flexible and can be extended to other pathology’s diagnosis systems.
Several efforts have been made to develop automated approaches for OD and OC segmentation. Such tasks optimized the recognition capability, the diagnosis time, and the diagnosis accuracy. Various approaches have addressed fundus image processing and disease diagnosis, including DCNNs, especially the OD detection task, namely U-Net [31], M-Net [36], C-Net [37], and GCN [37]. Developing an automated computer-aided ocular diagnosis system requires reliable OD detection. Mask-RCNN, as a segmentation-object-based DCNN, has promising performance in object instance detection. Considering the OD detection problem as object detection extends the object concept and allows further improvements in CAD systems that should provide a suitable alternative for deformable-models-based systems.
We addressed OD localization, segmentation, and glaucoma detection using decision fusion. Fig. 1 illustrates the sequence of our proposed methodology. Our approach started with a focus on deep object instance detection, where the Mask-RCNN model was employed to achieve the precise prediction of object instance positions. The dataset underwent annotation using the VGG annotation tool, with each image being categorized into normal and Glaucoma classes.

Figure 1: Block diagram for OD localization and glaucoma classification
Subsequently, the annotated data was utilized to train and fine-tune the Mask-RCNN model, leveraging its pre-existing weights. The refined model was then utilized to segment the optic disc, resulting in the extraction of relevant data patches. These patches were stored and employed to classify optic discs into normal and Glaucoma classes. For this classification task, we employed and retrained the VGG-16, Resnet-18, and Inception-v3 models. Furthermore, we utilized feature extraction techniques such as Histogram of Oriented Gradients (HOG) and Gabor filters.
The accuracy of classification was utilized to assign weights reflecting the model’s confidence level. These assigned weights, together with the decisions made by the models, were incorporated into a decision fusion process. This process ensured that the final decision benefits from both the individual models’ insights and their corresponding confidence levels.
We used a transfer learning-based approach for both OD localization and glaucoma diagnosis. Using a pretrained DCNN from a large dataset has the advantages of removing the requirement of having a large dataset [38,39], saving training time and improving the machine learning performance. This key contribution ensures high accuracy and framework efficiency in CAD systems.
Using multiple DCNNs for glaucoma diagnosis in addition to handcrafted feature extraction classification is promising in pathology diagnosis consolidation. When the pathologies are confused and require further diagnosis and analysis, using the decision fusion approach may improve CAD accuracy. In our case, glaucoma diagnosis can be confused with other pathologies or can be missed, especially in the initial stages.
3.1 OD Localization and Segmentation Based on Mask-RCNN
The main objective of this step is to determine the OD object in retinal images independently of the acquisition artifacts and the pathology cases. The optic disc contains different structures, including the blood vessels, veins and the cup disc. The OD localization here was based on an object detection deep network.
Due to the limited availability of fundus datasets, the images were augmented to reduce the overfitting problem. Another purpose of the augmentation was to reduce the imbalance of sample categories. The augmentation transformations included image rotation, scaling, cropping, horizontal reflection (mirror) and flipping (vertical, diagonal and orthogonal). We limited the rotation degree to a small interval (−15, −10, −5, 10, and 15) to maintain the vertical ellipse shape of the OD.
These augmentations may allow the OD detection system to detect more fundus images complications and image acquisitions transformations. The reason for using the augmentation method in addition to the transfer learning method is that pretrained models mostly use natural images [40–43]. The existing DCNNs pretrained on fundus images were not considered in our framework, as we aimed to use a deep network of object instance detection and to feed the cropped mask for glaucoma diagnosis with multi-classifier fusion.
3.1.2 Deep Object Detection Networks
Object detection has witnessed considerable advancements [44,45] with the utilization of deep convolutional neural networks (DCNN). These approaches can be applied for one instance detection or a set of object detections, where a network is used for the region proposal generation and feature extraction networks [46,47].
Starting with the RCNN architecture [48], the classification was optimized in addition to a bounding box regression task in Fast-RCNN architecture [49]. Faster-RCNN introduces a network for region proposals [50], while YOLO is based on a fixed-grid regression. The proposal generation identifies regions that may potentially be objects, while a classification network identifies the correct region label.
Developed by the Facebook AI Research group in 2017, Mask-RCNN [51] is an extension of Faster RCNN [52]. Similarly to Fast-RCNN, Mask-RCNN contains a backbone, a region proposal network, and two head branches. The backbone performs feature extraction. ResNet [53] is a common choice for the backbone in several studies. The Region Proposal Network (RPN) extracts the region of interest that will be fed into the head’s branches. The first head allows bounding box regression, while the second head performs classification. Mask-RCNN extends Faster-RCNN by adding an extra fully connected network branch—for instance, segmentation—using the region of interest. It produces in parallel a predicted object mask. Features are extracted from the entire image, while the branches are extracted for each ROI. Related feature maps are cropped and aligned before going through the three branches. Mask-RCNN has the advantage of providing the bounding box and semantic segmentation. The training loss is adjusted using a total weight including the classification loss, the bounding box regression loss and the segmentation loss.
Multiple regions are generated by the RPN, some of which may have significant overlap; these regions are discarded, and regions of interest are produced using non-maximum suppression algorithms. Considering that our main aim in this paper is retrieving the OD and then applying a learning-based method for glaucoma detection, using Mask-RCNN on the entire fundus image will provide an efficient localization.
3.2 Glaucoma Detection Based on Deep Classifiers
Detecting Glaucoma is a major challenge that needs to be faced to address the increasing disease burden [54,55]. Clinically, Glaucoma is diagnosed by analyzing the optic disc. The wide variation of the OD structure and size may impact the diagnosis process, especially with limited examiner experience. Glaucoma can be confused with non-glaucomatous optic nerve neuropathy. Several factors are determinants for an accurate glaucoma assessment. Traditional evaluation methods have focused on the measurement of the size and shape of the optic cup and the neuroretinal rim [56]. These two sizes vary with the optic disc size. Moreover, optic disc size estimation depends on the measurement technique, and the disc size range depends on patients’ race (Black people have larger discs) and other demographic characteristics (sex, age, etc.). A glaucomatous appearance is hard to detect in small OD. Therefore, Glaucoma in patients with small discs is under-diagnosed, while Glaucoma in patients with large discs is over-diagnosed [57]. Thus, to overcome the optic disc size bias in glaucoma detection and to achieve accurate and automated glaucoma assessment, our approach was based on previous OD region localization and automatic classification, namely DCNNs, and a handcrafted classification.
The three DCNNs were pretrained on the large dataset ImageNet (1000 categories) to acquire generic and distinct features that were applicable to different image datasets. These features were then applied to the OD region to extract specific, discriminative and high-level features that may contribute to detecting glaucoma cases.
The reason behind using different DCNN architectures for glaucoma detection is that different DCNN architectures can capture different descriptors. The glaucoma classification based on the detected features provides more discriminative abilities. After that, decision fusion consolidates the glaucoma detection based on each DCNN’s prediction. The architecture of each DCNN is briefly explained in the following paragraphs.
The VGG model is the most common deep learning architecture, including 13 convolutional layers and 3 fully connected layers. Convolution layers are stacked depth-wise, with residual connections in a modular architecture. The feature extraction is provided by 3 × 3 convolutional filters with stride 1. The first two layers have 24 filters each. The second two layers have 128 filters; the remaining convolutional layers have 512 filters each. Max pulling layers always use 2 × 2 filters. This repeated architecture allows us to learn hierarchical representations of visual patterns.
The ability of the VGG-16-based detection algorithm to generalize unseen data relies on the diversity and representativeness of the training data. In our case, the training data adequately covers the range of variations and scenarios encountered in the unseen data. The algorithm is more likely to perform well.
This architecture was designed to address the vanishing gradient problem in deep networks. Convolution layers are stacked depth-wise, with residual connections in a modular architecture. 36 convolutional layers provide the feature extraction. Each layer, except for the first and last modules, is structured into 14 modules with linear residual connections. One of the key characteristics is the use of skip connections to propagate the information from earlier layers to later layers. Global Average Pooling provides compact representation and helps avoid overfitting. Similarly, the ability of the Resnet-18-based detection algorithm to generalize unseen data depends on the training data. The used datasets present varieties of populations in age and ethnicity, as well as different image resolution. Moreover, both image augmentation and transfer learning will be used to enhance the generalization and the algorithm’s performance on unseen data and mitigate the detrimental effects of image quality and lighting variations.
The Inception architecture was refined as Inception-v2 and Inception-v3. The current architecture is known as Inception-Resnet [58]. Inception has been proven to provide superior performance and is based on the Inception module, which is like a convolutional feature extractor but is capable of learning richer representations with a reduced number of parameters. Using Inception, cross-channel correlations and spatial correlations are decoupled. The key feature of the Inception-v3 architecture is the usage of a series of Inception modules that are designed to capture different scales of spatial information and to learn rich and diverse representations. The factorized convolutional helps to capture the spatial relationship and reduce the computational cost. Inception-v3 adds auxiliary classifiers that help reduce the vanishing gradient problem. Batch normalization after convolutional layers will accelerate the convergence. Inception-v3 has shown robust performance in detecting objects in unseen data, especially when trained on large and diverse datasets.
The three models have been trained on the widely used ImageNet dataset. This extensive training allows the deep models to acquire learning ability and gain generalizability. The learned features by transfer learning can fit a wide range of objects and environments. However, the performance of deep models on unseen data can still be influenced by certain factors including the low resolution, noise, artifacts and light variations. Utilizing pretrained models can help mitigate the detrimental effects of image quality and lighting variations. Enhancement techniques can mitigate the detrimental effects but may not eliminate these issues. The overall performance of deep models on unseen data will depend on the severity of the variations and the model’s capacity to generalize. Fine-tuning can further improve a deep model’s ability to handle image quality and lighting challenges.
3.3 Glaucoma Detection Based on Content-Based Feature Extraction and the SVM Classifier
The cup-to-disc ratio is the traditional measurement for Glaucoma optic-nerve evaluation. According to research conducted in this field, optic disc rim tissue health and extent are the most noteworthy features in glaucoma diagnosis. Following the ISNT rule, for a normal disc, the Superior and nasal rims are thickest, followed by inferior disc rims, and then temporal and nasal rims. In glaucomatous discs, the inferior or superior disc rims are thinning or notched, so ISNT is not applicable. Another key diagnosis is the cup region pattern, which is the brighter region in the optic disc. The cup region is enlarged in glaucomatous discs in a vertical oval pattern.
In summary, the subtle characteristics that should be examined for early glaucomatous damage are the following:
• The size and shape of the neuroretinal rim, the optic disc, the optic cup, and the vessels in the optic disc.
• The integrity, pattern, and configuration of the rim, the vessels and the peripapillary region.
• The cup-to-disc ratio.
• The color of the rim.
• The presence of dots in the cup.
To address the visual OD pattern, we will present a multi-feature analysis methodology in this section.
Due to the diversity of OD appearances as presented in Fig. 2 in both normal and Glaucoma cases, we combined multiple features to build a robust feature descriptor.
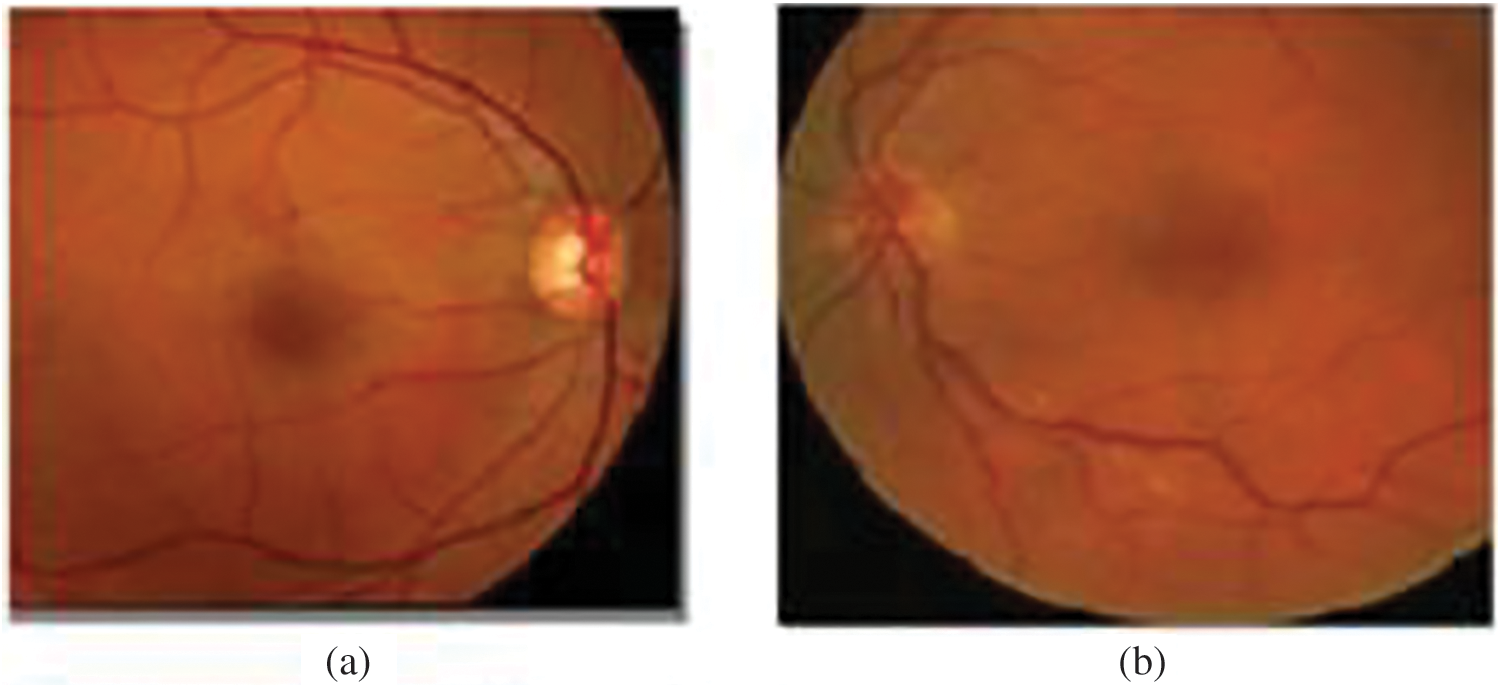
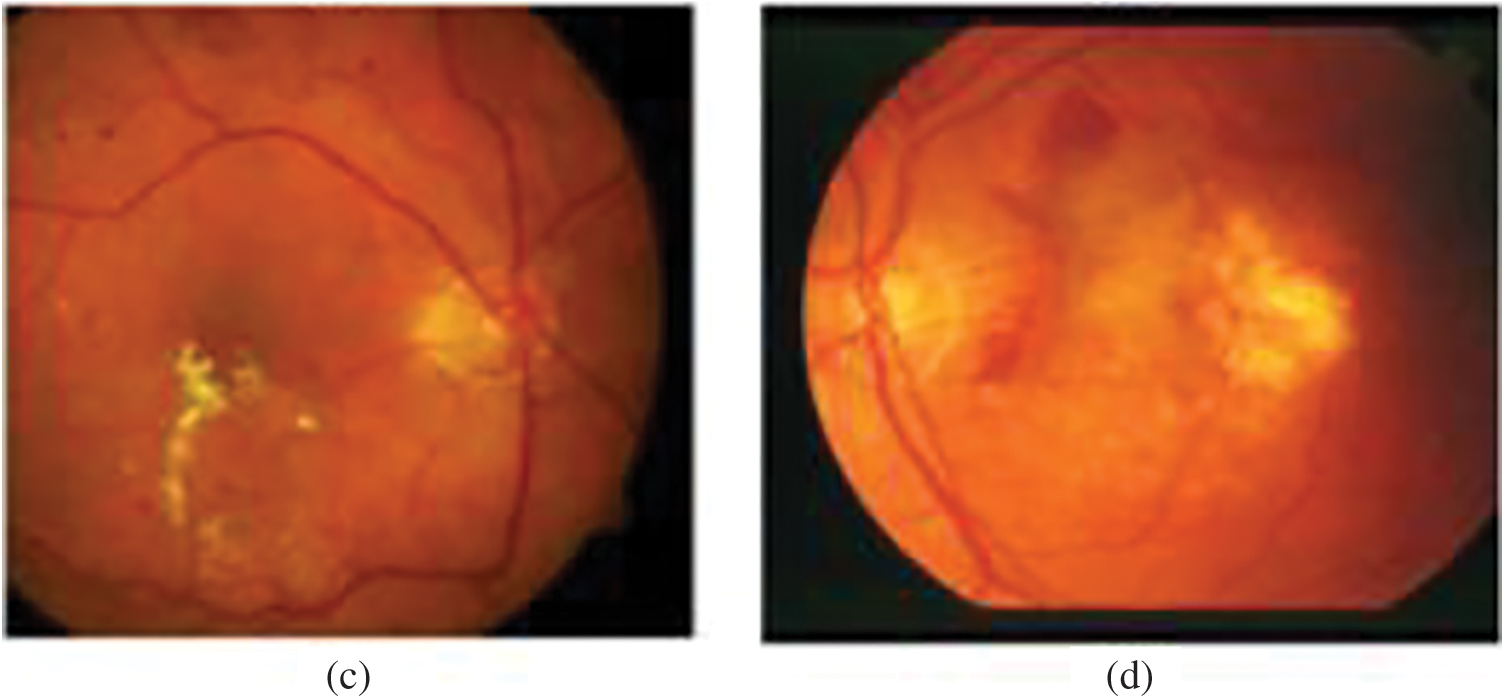
Figure 2: A variety of OD appearances. (a) Brightest OD. (b) OD is not as bright. (c) OD and pathologies brightness. (d) OD with pathologies
We proposed a combination of several types of content-based features to capture glaucomatous properties including texture, intensity, color moments, and histogram attributes.
Visual features offer a semantic and resilient representation for object recognition. In our case, we extracted SIFT (Scale Invariant and Feature Transform), HOG and Haar-like. These features have the advantage of producing representations associated with human brain cells.
Using structural risk minimization, SVM performs well even when applied outside of the training set and to small datasets. Finding an optimal hyperplane to separate data into two categories is the principal idea behind SVM. Such a hyperplane
To maximize the distance between the hyperplane and the data, the extreme data are considered and are known as support values. Using the relaxation variable
A dimensional increase is applied to data to obtain the data separability, where original data, inseparable in the original space, are mapped to higher dimensional space
The radial basis kernel function, formulated in (4), is used within this study. The hyperparameter γ is the interaction width.
As presented in the methodology section, the main purpose of the second stage was glaucoma detection based on combining all of the abovementioned classifiers: VGG-16, Xception and Inception-v3.
Ensemble models rely on using multiple base algorithms or multiple variants of the same algorithm to achieve higher performance compared to a single base algorithm. Furthermore, the ensemble model achieves classification stability, as each model provides different knowledge and interpretations. While majority voting seems to be the most commonly used method, multiple ensemble models are considered in the literature, including the sum of the probabilities, the sum of the maximal probabilities and the product of probabilities.
The decision principle is presented in Fig. 3. We aimed to obtain higher glaucoma detection accuracy by considering the classifier performance obtained from the validation step. By combining the predictions, the three deep models, an ensemble models can be created and helps reduce individual model biases and errors and therefore improved predictions. Ensemble model can potentially outperform any single model by leveraging the diverse strengths of its constituent models. Considering the validation accuracy for the classifier

Figure 3: Decision system. w1, w2, w3, w4, and w5 are the classifier confidence values
Based on the validation phase’s accuracy,
The final decision is considered as Glaucoma if d ≥ 0.5.
The validation of OD localization was performed by measuring the overlap between the identified OD and the ground truth. Specifically, by assessing the area of overlap. When the retrieved OD center was within the overlap with the area of the real OD, then the detection is successful. We considered the pixels that match the ground truth. The evaluation metrics are provided below TP is the number of pixels correctly predicted in the OD area. TN is the number of correctly predicted non-OD pixels. FP is the number of wrongly predicted OD pixels. FN is the number of wrongly predicted as non-OD pixels. Three evaluation metrics are considered: the accuracy, the Dice coefficient, and the Intersection over Union (IoU).
The Dice score, Intersection over Union (IoU), and accuracy metrics are commonly used evaluation measures for object detection tasks. These metrics provide different perspectives on the performance of object detection methods. The Dice score and IoU focus on the spatial overlap between predicted and ground truth bounding boxes, while accuracy provides a more general measure of correctness. The Dice score measures the similarity between the predicted bounding boxes and the ground truth bounding boxes for the OD. It is computed as the ratio of twice the intersection of the predicted and ground truth bounding boxes to the sum of their areas. The IOU determines the overlap between the predicted bounding boxes and the ground truth bounding boxes and is computed as the ratio of the intersection area to the union area of the two bounding boxes. The last parameter, accuracy measures the overall correctness of the predicted bounding boxes compared to the ground truth.
For glaucoma case detection, ophthalmologists use an ophthalmoscope or fundus camera to detect abnormalities. This method is expensive and time-consuming and requires elevated expertise. With the aim of achieving an accurate automatic glaucoma detection system, we investigate the performance of our glaucoma detection classifier based on two performance measurements to provide a comprehensive assessment of the model’s performance, which are the accuracy and the area under the receiver operating characteristic (ROC) curve. The accuracy gives an overall measure of the classifier ability, while AUC-ROC evaluates the model’s ability to distinguish between Glaucoma and non-glaucoma cases across different classification thresholds. The ROC curve illustrates the relationship between the true positive rate (sensitivity) and the false positive rate (specificity) at different classification thresholds.
In this section, we present the datasets and the results obtained for OD localization and glaucoma detection.
Public glaucoma datasets have various aspects and display heterogeneity in their sizes, field of view, luminosity, and resolutions. Table 1 presents a description of the databases, including their usage and properties. The dataset samples are from various ethnic groups.
1. DRISHTI-GS: 101 fundus images with 70 glaucomatous cases and 31 healthy cases. This dataset has homogeneous illumination and contrast. Dataset samples are presented in Fig. 4. The dataset is available at the URL: http://cvit.iiit.ac.in/projects/mip/drishti-gs/mip-dataset2/Home.php. The dataset was captured using the Fundus Imaging System (FIS) developed by the Indian Institute of Technology (IIT) Bombay. The image resolution is 2896 × 1944. The capture Field-Of-View (FOV) was 30-degrees. The dataset covers a wide range of age groups and includes both male and female subjects.
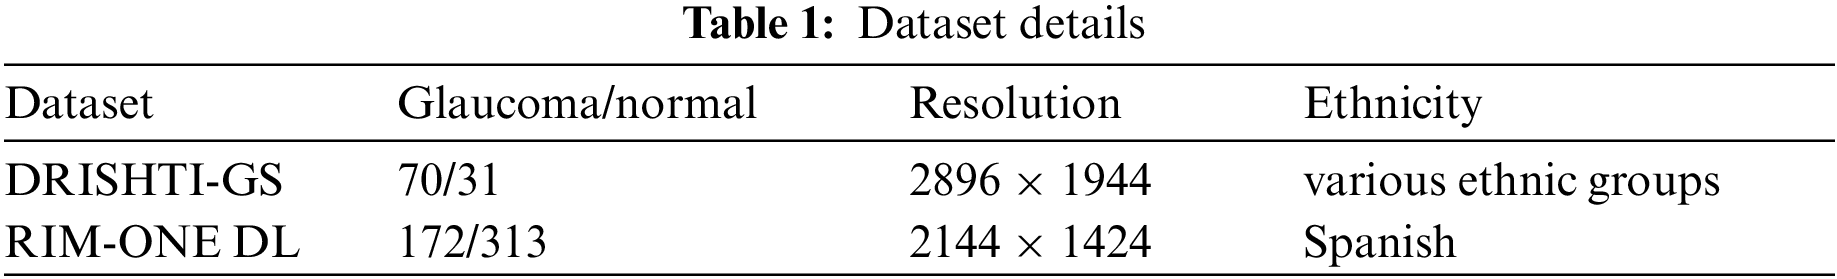
2. RIM-ONE DL: 485 images with 172 glaucomatous cases and 313 healthy cases. This dataset has enormous variation in the images’ illumination and contrast. Dataset samples are presented in Fig. 5. The repository is accessible through https://medimrg.webs.ull.es. The fundus image was acquired using the Topcon TRC NW6 non-mydriatic fundus camera. These images were captured in three Spanish hospitals in Madrid. It includes subjects from different age groups and various ethnicities. The dataset includes retinal images captured using the Topcon TRC NW6 non-mydriatic fundus camera, which typically captures a wide-angle view of the retina. The images do not have a fixed FOV for all images and can vary across different images in the dataset.
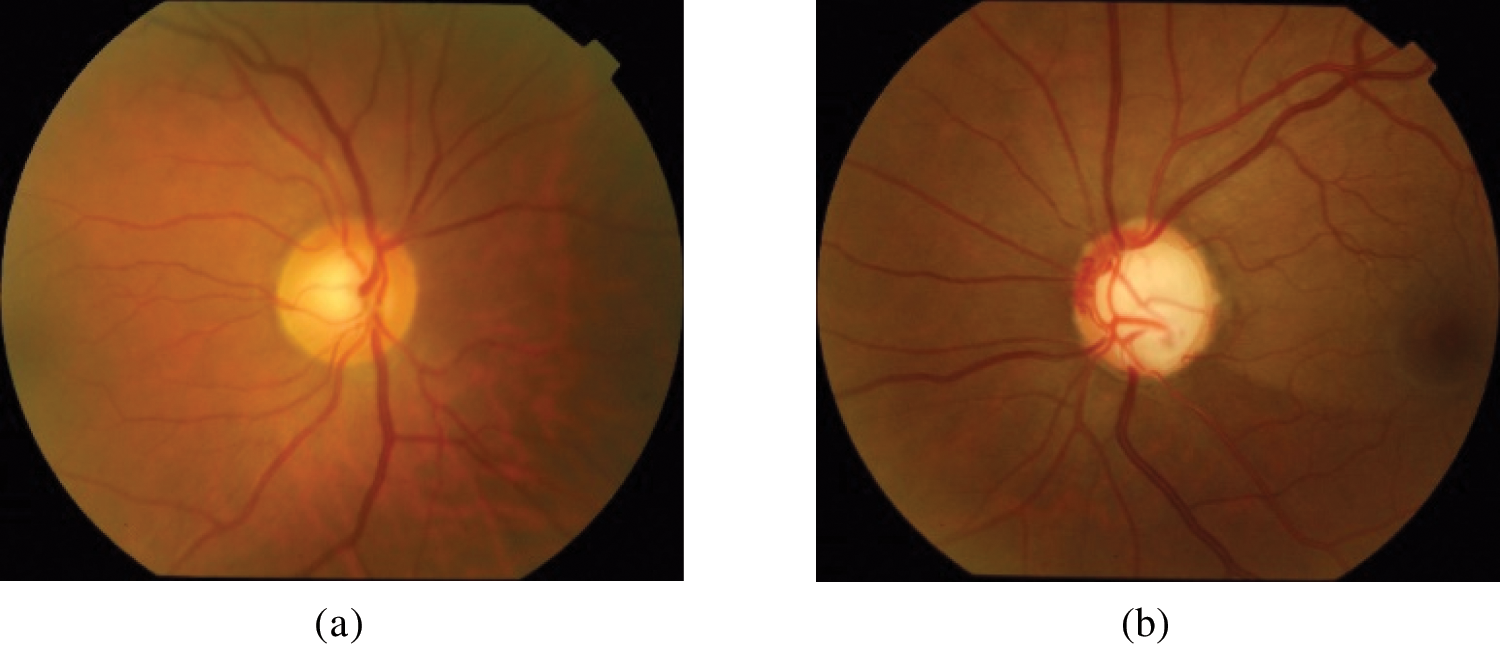
Figure 4: DRISHTI-GS dataset samples. (a) Normal; (b) glaucoma

Figure 5: RIM-ONE DL dataset samples. (a) Normal; (b) glaucoma
The two datasets present different ethnicity and age ranges. The images were acquired using different FOV and resolution. Furthermore, the images were captured from different ages. This may help improve the learning performance and the model’s generalizability.
4.2 Preprocessing and Annotation
The method starts with contrast enhancement. In fundus images, the contrast tends to decrease as the pixel becomes increasingly distant from the center of the image. To reduce this effect, adaptive contrast equalization intensifies the contrast as well as limiting the problem of noise and oversaturation among similar regions. Contrast-limited adaptive histogram equalization (CLAHE) is mainly used to ameliorate the contrast for digital medical images. This method has proved to be more efficient in this area than common histogram equalization and adaptive histogram equalization [13]. While histogram equalization performs noise enhancement, CLAHE limits this enhancement. The function that maps the contrast to a targeted contrast is limited by the height of the histogram, which is called as clipping operation. The image is separated into tiles. The local contrast of the tiles is enhanced by evening out the local histogram of the tile. Then, the clipping operation is performed. We perform CLAHE on the luminosity channel to maintain shading distances. For this purpose, the picture is transformed into the l * a * b space. The luminance is, therefore, ameliorated with CLAHE [14]. The preprocessing result is presented in Fig. 6. The contrast enhancement performed on the image shows the optic disc’s details, which is a basic step in the research process on the region of interest.
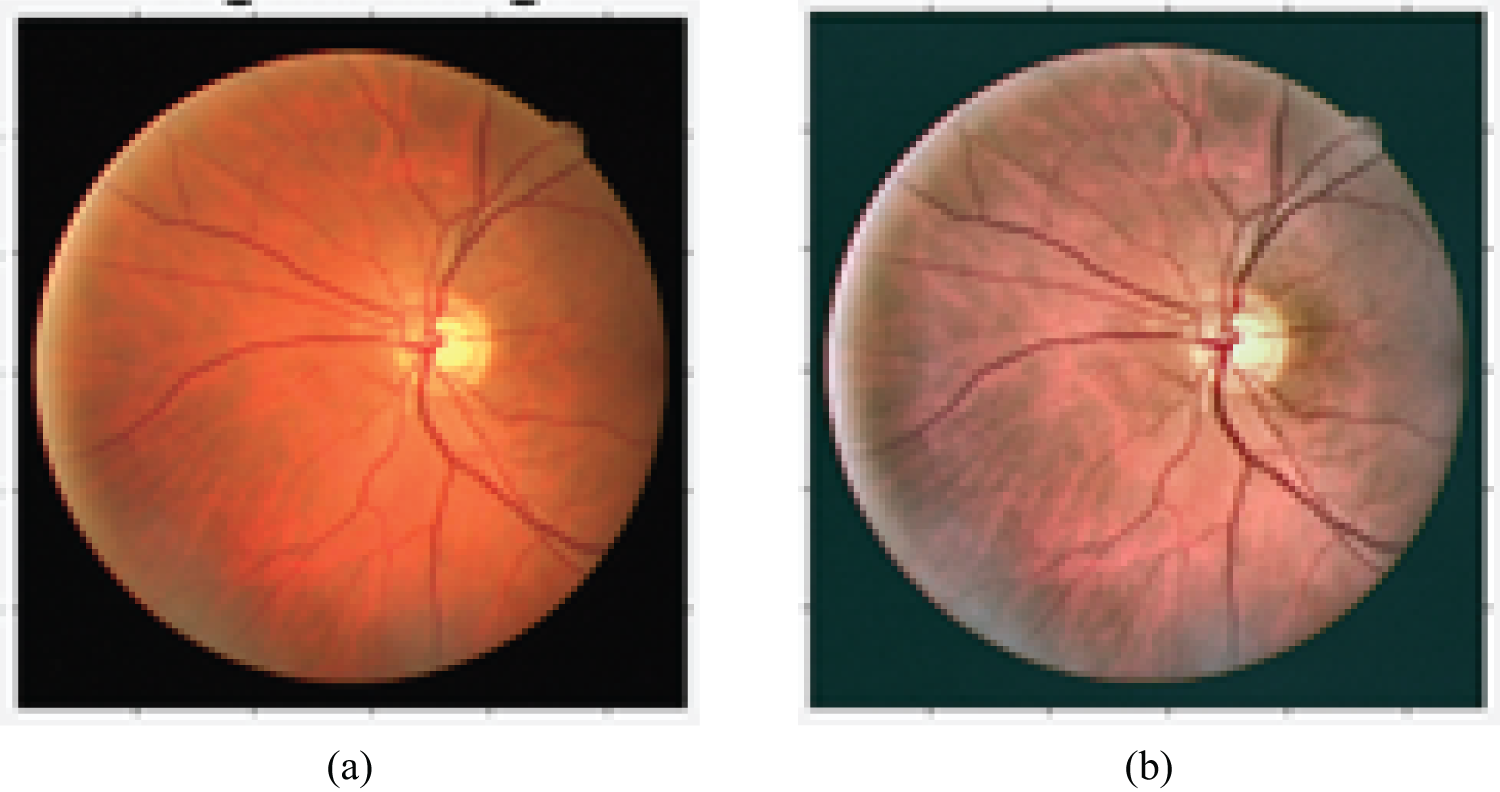
Figure 6: Impact of preprocessing on contrast enhancement. (a) Before contrast enhancement; (b) after contrast enhancement
Fig. 6 shows the contrast enhancement’s impact on demonstrating the OD’s morphology.
The manual annotation process is presented in Fig. 7 for normal (a) and glaucoma (b) cases.

Figure 7: Annotation of glaucoma (b, d) and normal optical discs (a, c). (a) Annotated region of the normal optic disc in the DRISHTI-GS dataset; (b) annotated region of the glaucomatous optic disc in the DRISHTI-GS dataset; (c) annotated region of the normal optic disc in the RIM-ONE DL dataset; (d) annotated region of the glaucomatous optic disc in the RIM-ONE DL dataset
To update the pretrained Mask-RCNN model, we needed to train the model based on our custom dataset. First, we prepared the custom dataset by annotating Glaucoma and normal images using the VGG annotation tool. In this annotation process, we loaded the images into the VGG annotator and selected the regions corresponding to Glaucoma and normal areas. These regions were then labeled accordingly. The annotated dataset was exported in JSON format, and we used this dataset along with the original images to retrain the Mask-RCNN model. The fine-tuned model helped the model to improve its ability to detect Glaucoma in the vicinity of the optic disc.
OD localization was accomplished using a trained Mask-RCNN model, which underwent 100 epochs of training on each dataset, including DRISHTI-GS, RIM-ONE DL, and a combined dataset. Initially, we set the learning rate to 0.001 and used a decay to gradually decrease the learning rate during learning phase. We selected the stochastic gradient descent optimizer and the momentum was set to 0.9. In Figs. 8 and 9, we present the results of OD localization on the DRISHTI-GS dataset. Specifically, Figs. 8a and 9a showcase the successful detection of the OD for both normal and Glaucoma cases. Subsequently, in Figs. 9b and 10b, we illustrate the segmented area, which serves as a mask for the optic disc. This mask area is essential for precisely cropping the optic disc from the original image, enabling us to utilize it as classification data for distinguishing between Glaucoma and normal classes.
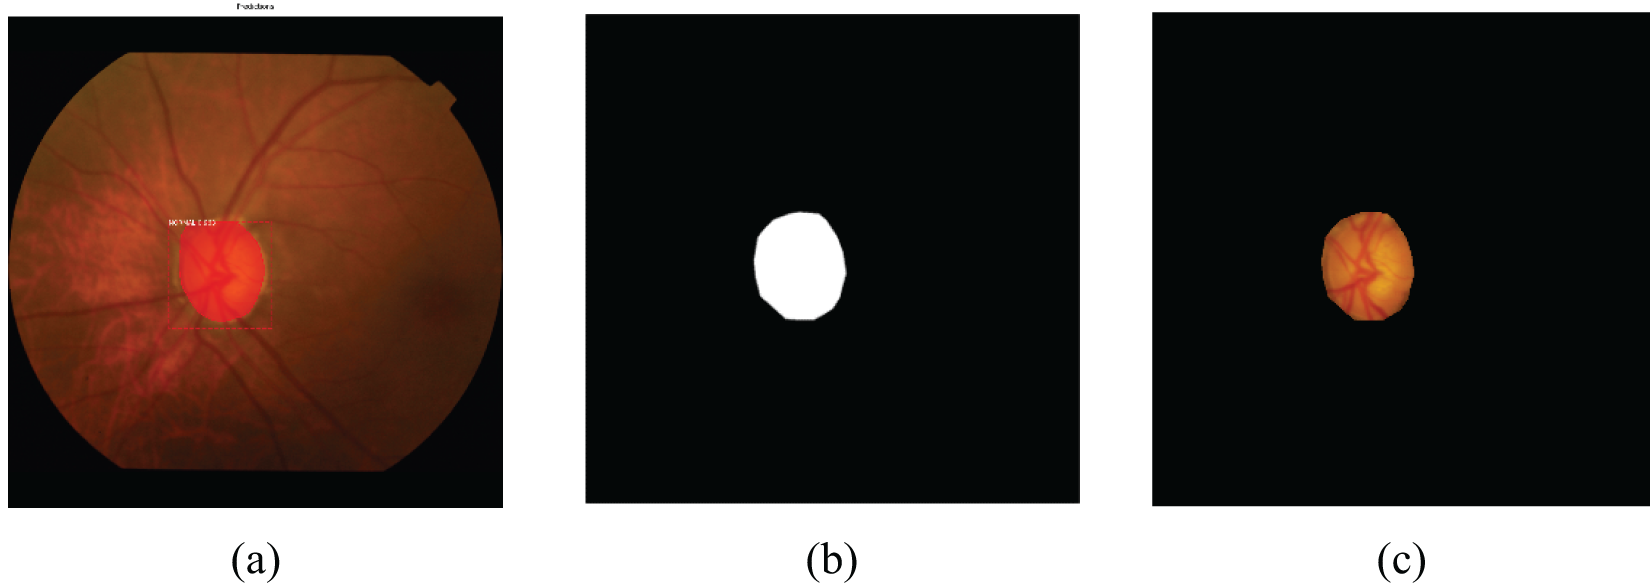
Figure 8: Normal optical disc localization of the DRISHTI-GS dataset. (a) Detected normal region; (b) mask of the normal region; (c) cropped normal optic disc

Figure 9: Glaucoma optical disc localization of the DRISHTI-GS dataset. (a) Detected glaucoma region; (b) mask of the glaucoma region; (c) cropped glaucoma optic disc

Figure 10: Normal optical disc localization of the RIM-ONE r3 dataset. (a) Detected normal region; (b) mask of the normal region; (c) cropped normal optic disc
Figs. 10 and 11 depict the outcome of OD localization for both normal and Glaucoma retinas for the RIM-ONE DL dataset. The process begins with segmenting the ODc area using a trained Mask-RCNN model, followed by selecting this segmented region. Subsequently, a mask representing the optic disc’s coverage area is generated from this selected region. Finally, this mask image is employed to extract and isolate the optic disc from the input image for further analysis.

Figure 11: Glaucoma optical disc localization of the RIM-ONE r3 dataset. (a) Detected glaucoma region; (b) mask of the glaucoma region; (c) cropped glaucoma optic disc
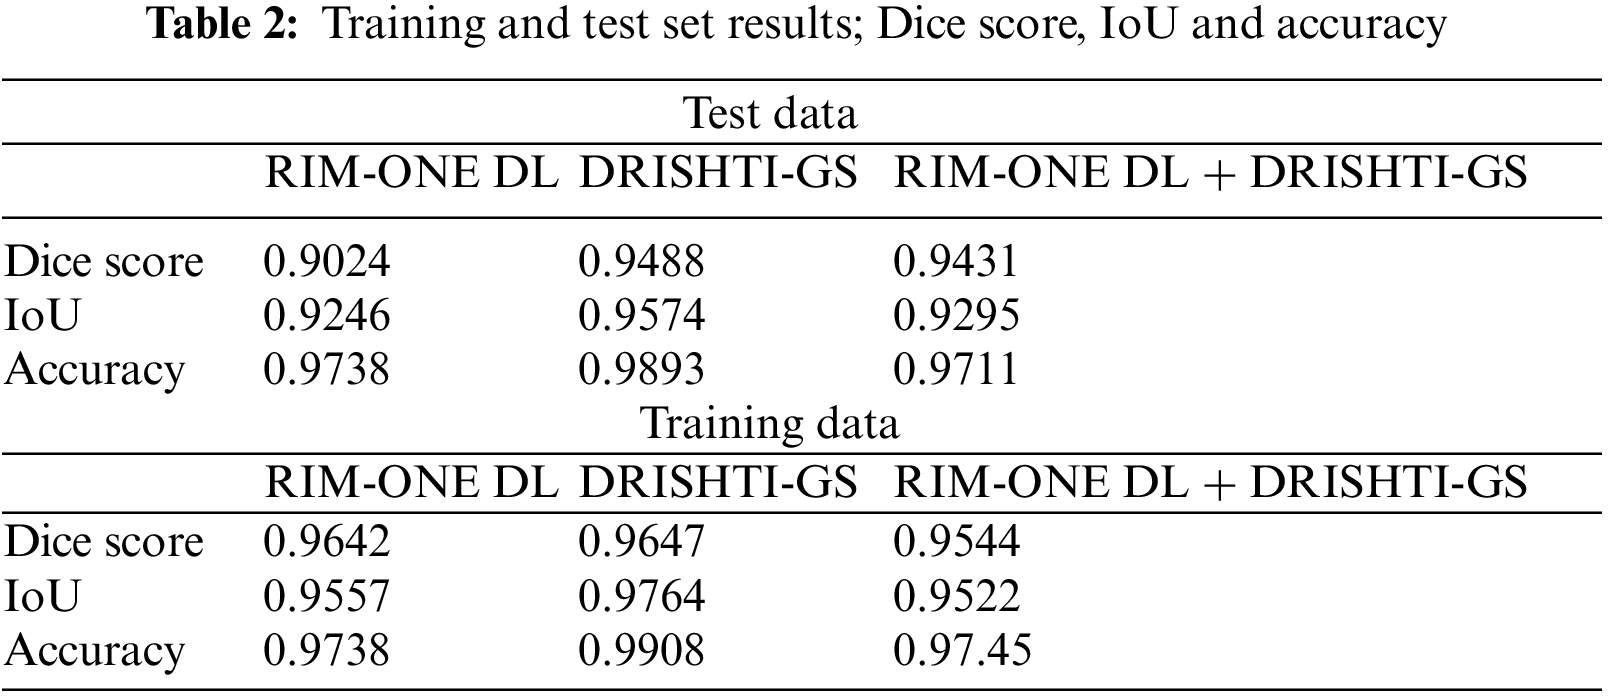
In the context of OD detection, the proposed model demonstrates comparable or superior performance, particularly in terms of accuracy rate, when compared to baseline models. The proposed model is evaluated in Table 2 using metrics such as the Dice score, Intersection over Union (IoU), and accuracy. These metrics are commonly employed to gauge the effectiveness of localization and segmentation tasks.
To prepare the data for OD localization, the Mask-RCNN model is utilized for the accurate segmentation and localization of the OD in retinal images. Subsequently, the localized ODs are cropped and preserved to train classification models, aimed at distinguishing between normal and glaucomatous retinas. This approach capitalizes on precise OD localization favorizing the glaucoma detection model.
The outcomes in Table 3 indicate a notable improvement in glaucoma detection across all of the evaluated metrics. The three metrics for object detection are the Dice score, the IoU and the accuracy. The three metrics are higher in the training sets than in the test sets. However, the value reached is more than 0.9 for the test data, which demonstrates the efficiency of the object detection and segmentation step.

For the three test datasets, the Dice score exceeds 0.9 which presents a strong overlap between the segmentation mask and the ground truth of the OD. The maximum Dice score is obtained for the DRIDHTI-GS dataset. The overlap between bounded boxes, expressed by the IOU score, is maximal for the DRISHTI-GS. The accuracy is higher than 97% for the tree datasets.
The feature extraction part is based on three backbone components to enable an enhanced feature extraction method. The classifier categorizes the cases into healthy or glaucomatous cases based on the OD region.
The proposed model not only considers the knowledge of Mask-RCNN, but also uses the decision-level fusion method to improve the performance of the model. In this experimental study, a selection of deep learning models, namely VGG-19, Inception-ResNet-V2, and Xception, are employed. These models are not trained from scratch but rather are fine-tuned using a two-step process with data prepared using the Mask-RCNN model. This process involves utilizing pre-existing weights for these models as an initial starting point. These pretrained weights were typically learned from a large dataset on a related task, such as ImageNet classification.
In the first step, these pretrained weights are used to initialize the deep learning models. This initialization helps the models to already possess some level of knowledge about features and patterns in images, which is beneficial and favors the learning of specific characteristics of the task at hand—glaucoma detection in this case.
In the second step, the retraining and fine-tuning process begins. During this phase, the models are exposed to the glaucoma detection data prepared using the Mask-RCNN model. They learn to adapt and update their weights by minimizing the difference between their predictions and the ground truth labels for this specific task. This fine-tuning process is essential because it tailors the models to become highly proficient at recognizing the relevant features and patterns associated with Glaucoma in retinal images.
To acquire high generalization, data augmentation can generate a vast number of OD images based on the training sets. This augmentation enriches the dataset, considering the variation of the fundus images due to the image acquisition conditions and the high variability in the OD pattern. As the proposed method is based on glaucoma assessment, it is favored in cases of a scarcity of data, meaning that rotations, shifts, and zooms, to avoid the overfitting problem, are applied to the training set. After this, we resize the cropped image to 224 × 224.
Another noteworthy specificity of the proposed approach is the glaucoma assessment based on the OD region, which will reduce the error generated when considering the whole of the fundus image. This will essentially enable glaucoma assessment to exclude other eye diseases by excluding other retinal structures. For real-time and offline assessments, this approach will provide fast diagnosis due to the training mode. Depending on the first OD detection step, the glaucoma assessment may provide inferior results when the OD localization is not successful. This case is highly likely for extreme pathologies.
Two datasets serve as the foundation for our experimental procedures, assessing the effectiveness of both the Mask-RCNN-based localization model and the decision-level fusion model. In the context of decision-level fusion, our models are trained concurrently, and the final decision is obtained by combining the outputs of these models based on their respective performance. When dealing with deep learning models, the convolutional layers autonomously extract salient features from the input data, while the fully connected layer, equipped with a SoftMax activation function, calculates class probabilities. The architecture is detailed in Fig. 1 in the sub-block glaucoma assessment. On the other hand, feature extraction techniques are a prerequisite for the effective classification of data for the SVM classifier. These techniques are applied to obtain discriminative features that are subsequently fed into the SVM classifier for classification. Detailed explanations of the feature extraction methods and the SVM classifier are provided in the upcoming section of our study.
The feature extraction vector was based on the following components:
1. Histogram of Oriented Gradients: HOG is a feature descriptor technique that computes the distribution of gradients (edge directions) in an image. It divides the image into small cells and then calculates the histogram of gradients within each cell. The resulting histograms are then used as features to represent the image. Figs. 12 and 13 present the HOG visualization from the DRISHTI-GS dataset sample and RIM-ONE DL, respectively. Based on the gradient magnitude, HOG allows retrieving the fundus images particularities, specifically the blood vessels. Moreover, low-level and statistical features are also extracted using HOG.
2. Gabor Filters: Gabor filters are a set of bandpass filters that are used to analyze the texture and frequency content of an image. They are often used for texture analysis because they can capture both local frequency and orientation information. By convolving an image with Gabor filters at multiple scales and orientations, one can obtain Gabor filter responses, which serve as texture features for classification tasks. Figs. 14 and 15 present the Gabor filter-based extracted features from the DRISHTI-GS and RIM-ONE DL datasets.

Figure 12: HOG-based feature extraction from the DRISHTI-GS dataset
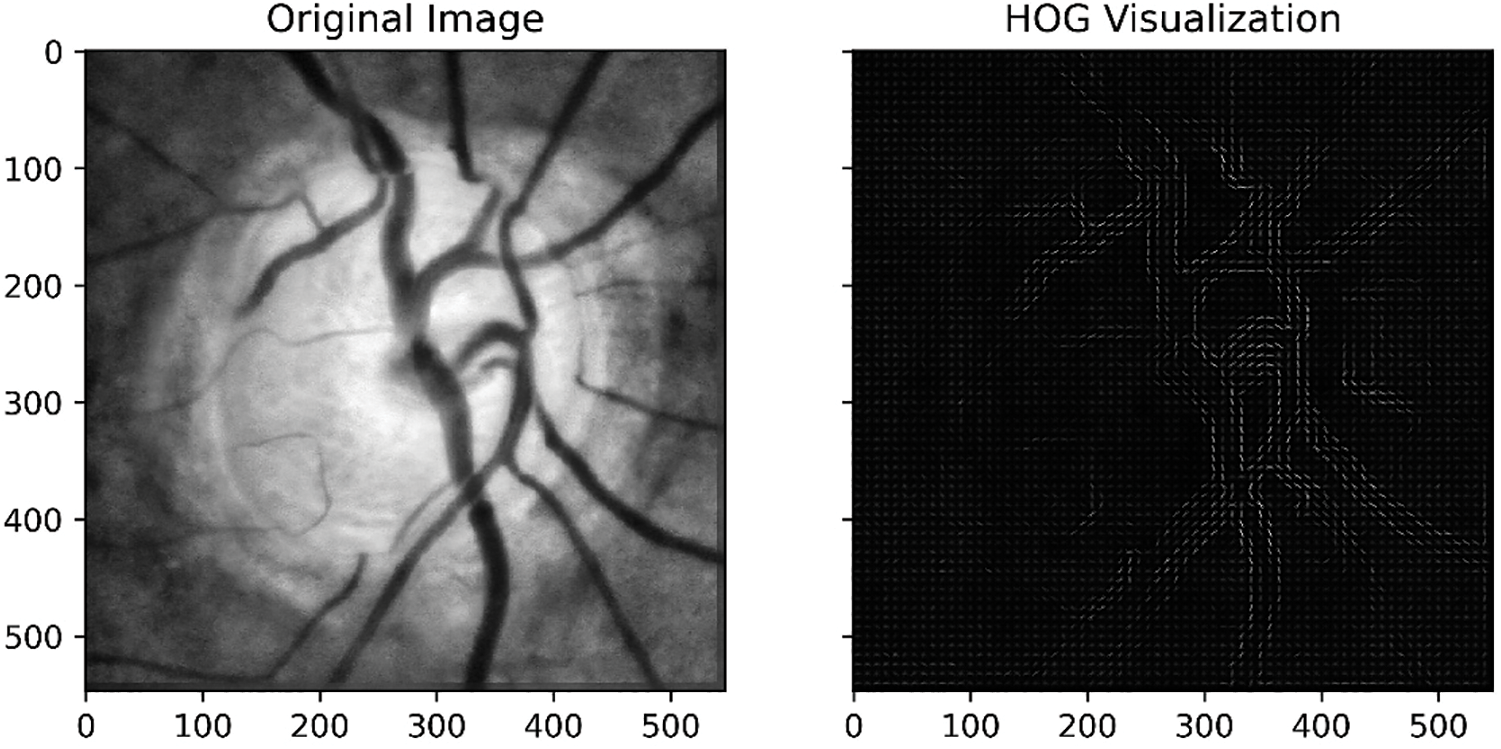
Figure 13: HOG-based feature extraction from the RIM-ONE DL dataset

Figure 14: Gabor filter-based extracted features from the DRISHTI-GS dataset
Figure 15: Gabor filter-based extracted features from the RIM-ONE DL dataset
The proposed decision-level fusion-based classification approach is assessed using four candidate models: VGG-16, Resnet-18, Inception-v3, and an SVM model. Each of these candidate models is trained independently on their respective datasets, and their individual decisions are later merged. The outcomes, as presented in Table 3, display the accuracy of these independently trained models alongside the fusion model.
Using the Adam optimizer, the learning rate was set to 0.001. The classification models were able to learn briefly. This is due to the limitation of the OD zone for the glaucoma assessment. Moreover, using transfer learning and augmentation has favored the learning ability in the first iterations and the convergence.
The highest accuracy is obtained for DRISHTI-GS using the fusion model. Overall, the fusion model provides an accuracy higher than VGG-16, Resnet-18, Inception-v3 and SVM for the three datasets. The main accuracy increase of the fusion model is obtained for DRISHTI-GS + RIM-ONE DL where the fusion model accuracy increased by 2.45 compared to the SVM accuracy. Merging the two datasets has decreased the accuracy of all the classification models specifically for the classifier VGG-16.
The results unmistakably demonstrate the superior performance of the proposed fusion model when compared to the independently trained models. This improvement can be attributed to the amalgamation of the weighted knowledge from all models, with each candidate model contributing to the final decision. Furthermore, in Figs. 16a–16c, ROC curves are presented for the DRISHTI-GS dataset, RIM-ONE DL dataset, and the merged data, respectively. Plotting the obtained TPR values (x-axis) against the FPR (y-axis) creates the RPC curve. The area under the ROC curve provides a summary measure of the discrimination ability. The curve is close to 1 for the fusion model and covers a larger area under the curve, emphasizing its effectiveness in classification.

Figure 16: Area under the ROC curve for all three datasets
Models with higher confidence in their predictions are given more weight in the final decision-making process. This approach ensures that the diagnostic outcome is influenced more by the models with a strong record of accomplishment of accuracy, reducing the risk of incorrect or misleading diagnoses. Advancements in learning models have significantly improved disease diagnosis and ushered in a new era of intelligent medicine. Current research in disease recognition is indeed aligned with this trend [59–61].
Optic disc localization has been a focus of research for aided computer-aided diagnosis systems. Researchers have made efforts in the area of retinopathy disease diagnosis. The primary objective of the presented framework is to offer an efficient solution for glaucoma detection. It addresses the pressing need to automate the diagnostic process, reducing the burden on ophthalmologists in terms of effort and time. By automating the diagnosis, this system has the potential to significantly expedite the identification of Glaucoma, which is crucial for early intervention. What sets this framework apart is its unique approach: it begins by focusing on OD localization, which is a critical component of glaucoma diagnosis. By accurately pinpointing the OD within retinal images, this framework eliminates the noise and irrelevant background image data that can hinder traditional diagnostic methods. This means that only the ODs, which are highly relevant for glaucoma assessment, are extracted and used as the basis for classification. A combination of machine learning models is employed to build the glaucoma detection system. Three deep learning models are selected for their ability to learn complex features from the OD data. Additionally, a machine learning model, specifically the SVM, is chosen. Each of these models is carefully trained on the extracted OD data to make informed glaucoma predictions. A weighted fusion technique was introduced to enhance the reliability of the diagnostic process. This technique assigns different weights to the models based on their confidence levels. The proposed method produces meaningful results through simple computational steps. The datasets were acquired from different standard datasets. The framework used to transfer learning approach to overcome the availability limitation of fundus samples as well as the diversity of fundus pattern. The suggested method achieved a qualitative and quantitative performance higher than or comparable to the baselines for three different fundus datasets.
Our research will contribute effectively to identifying the OD area and reduce the time cost of glaucoma assessment. Moreover, the proposed algorithm entails a simple technique that can be combined with other algorithms. However, it entails more features than OD entropy, and so in future work, combining entropy with vessel information in order to generate a robust algorithm is suggested for OD localization. Relative information regarding the vessels’ properties will also contribute to the rapid assessment of Glaucoma. Moreover, adapting large-scale datasets collected in real-time from hospitals will increase the framework’s accuracy and usability.
Acknowledgement: This research project was funded by the Deanship of Scientific Research, Princess Nourah bint Abdulrahman University, through the Program of Research Project Funding after Publication, Grant No (43-PRFA-P-31).
Funding Statement: This research project was funded by the Deanship of Scientific Research, Princess Nourah bint Abdulrahman University, through the Program of Research Project Funding after Publication, Grant No (43-PRFA-P-31).
Author Contributions: Elmannai, H.: methodology, implementation, results reporting and manuscript draft writing, Hamdi, M., Ayadi, M., Meshoul, S., Alhussan, A., and Ksibi, A.: data acquizition, methodology and paper reviewing.
Availability of Data and Materials: The datasets used in this paper are available for DRISHTI-GS and RIM-ONE DL, respectively, http://cvit.iiit.ac.in/projects/mip/drishti-gs/mip-dataset2/Home.php and https://medimrg.webs.ull.es.
Conflicts of Interest: The authors declare that they have no conflicts of interest to report regarding the present study.
References
1. David SA, Naveena NR, Ravikumar S, Belinda MCM. Optic disc and optic cup segmentation based on deep learning methods. In: Artificial intelligence, blockchain, computing and security, vol. 2. USA: CRC Press; 2024. p. 334–8. [Google Scholar]
2. Bi L, Guo Y, Wang Q, Feng D, Fulham M, Kim J. Automated segmentation of the optic disk and cup using dual-stage fully convolutional networks. arXiv:1902.04713. 2019. [Google Scholar]
3. Sanghavi J, Kurhekar M. An efficient framework for optic disk segmentation and classification of Glaucoma on fundus images. Biomed Signal Process Control. 2024;89:105770. [Google Scholar]
4. Bazi Y, Al Rahhal MM, Elgibreen H, Zuair M. Vision transformers for segmentation of disc and cup in retinal fundus images. Biomed Signal Process Control. 2024;91:105915. [Google Scholar]
5. Oliveira M, Vieira C, de Filippo AP, Leles MCR, Dias D, Guimarães M, et al. Automatic features extraction from the optic cup and disc segmentation for glaucoma classification. In: Computational science and its applications–ICCSA 2023. Cham: Springer Nature Switzerland; 2023. p. 550–63. [Google Scholar]
6. Li T, Bo W, Hu C, Kang H, Liu H, Wang K, et al. Applications of deep learning in fundus images: a review. Med Image Anal. 2021;69:101971. [Google Scholar] [PubMed]
7. Sun Z, Yang D, Tang Z, Ng DS, Cheung CY. Optical coherence tomography angiography in diabetic retinopathy: an updated review. Eye. 2021 Jan;35(1):149–61. doi:10.1038/s41433-020-01233-y. [Google Scholar] [PubMed] [CrossRef]
8. Zhou W, Wu H, Wu C, Yu X, Yi Y. Automatic optic disc detection in color retinal images by local feature spectrum analysis. Comput Math Methods Med. 2018;2018:1942582. [Google Scholar] [PubMed]
9. Zahoor MN, Fraz MM. Fast optic disc segmentation in retina using polar transform. IEEE Access. 2017;5:12293–12300. [Google Scholar]
10. Wankhede PRR, Khanchandani K. Optic disc detection using histogram based template matching. In: Proceedings of the 2016 International Conference on Signal Processing, Communication, Power and Embedded System (SCOPES), 2016 Oct 3–5; Paralakhemundi, India. p. 182–5. [Google Scholar]
11. Yu H, Barriga ES, Agurto C, Echegaray S, Pattichis MS, Bauman W, et al. Fast localization and segmentation of optic disk in retinal images using directional matched filtering and level sets. IEEE Trans Inf Tech Biomed. 2012;16:644–57. [Google Scholar]
12. Muhammed LA. Localizing optic disc in retinal image automatically with entropy based algorithm. Int J Biomed Imaging. 2018;2018:2815163. [Google Scholar] [PubMed]
13. Gui B, Shuai RJ, Chen P. Optic disc localization algorithm based on improved corner detection. Procedia Comput Sci. 2018;131:311–9. [Google Scholar]
14. Cheng J, Li Z, Gu Z, Fu H, Wong DW, Liu J. Structure-preserving guided retinal image filtering and its application for optic disk analysis. IEEE Trans Med Imaging. 2018;37:2536–46. [Google Scholar] [PubMed]
15. Mahfouz AE, Fahmy AS. Fast localization of the optic disc using projection of image features. IEEE Trans Image Process. 2010;19:3285–9. [Google Scholar] [PubMed]
16. Mohamed NA, Zulkifley MA, Zaki WM, Hussain A. An automated glaucoma screening system using cup-to-disc ratio via simple linear iterative clustering superpixel approach. Biomed Signal Process Control. 2019;53:101454. [Google Scholar]
17. Thakur N, Juneja M. Optic disc and optic cup segmentation from retinal images using hybrid approach. Expert Syst Appl. 2019;127:308–22. [Google Scholar]
18. Ramani RG, Shanthamalar JJ. Improved image processing techniques for optic disc segmentation in retinal fundus images. Biomed Signal Process Control. 2020;58:101832. [Google Scholar]
19. Khan MA, Mir N, Sarirete A, Nasir MR, Abdelazim MM, Yasin MZ. Optic disc detection and segmentation with vessel convergence and elliptical symmetry evidences. Procedia Comput Sci. 2019(163):609–17. [Google Scholar]
20. Dietter J, Haq W, Ivanov IV, Norrenberg LA, Völker M, Dynowski M, et al. Optic disc detection in the presence of strong technical artifacts. Biomed Signal Process Control. 2019;53:101535. [Google Scholar]
21. Kumar S, Adarsh A, Kumar B, Singh AK. An automated early diabetic retinopathy detection through improved blood vessel and optic disc segmentation. Opt Laser Tech. 2019;121:105815. [Google Scholar]
22. Singh LK, Khanna M. A novel multimodality based dual fusion integrated approach for efficient and early prediction of Glaucoma. Biomed Signal Process Control. 2022;73:103468. [Google Scholar]
23. Abbas Q. Glaucoma-deep: detection of glaucoma eye disease on retinal fundus images using deep learning. Int J Adv Comput Sci Appl. 2017;8:41–5. [Google Scholar]
24. Tutsoy O, Tanrikulu C. A machine learning-based 10 years ahead prediction of departing foreign visitors by reasons: a case on Türkiye. Appl Sci. 2021;12(21):11163. doi: 10.3390/app122111163. [Google Scholar] [CrossRef]
25. Chen X, Xu Y, Wong DWK, Wong TY, Liu J. Glaucoma detection based on deep convolutional neural network. In: Proceedings of the 2015 37th Annual International Conference of the IEEE Engineering in Medicine and Biology Society (EMBC), 2015 Aug 25–29; Milan, Italy. p. 715–8. [Google Scholar]
26. Orlando JI, Prokofyeva E, del Fresno M, Blaschko MB. Convolutional neural network transfer for automated glaucoma identification. In: Proceedings of the 12th International Symposium on Medical Information Processing and Analysis, 2016 Dec 5–7; Tandil, Argentina. [Google Scholar]
27. Gómez-Valverde JJ, Antón A, Fatti G, Liefers B, Herranz A, Santos A, et al. Automatic glaucoma classification using color fundus images based on convolutional neural networks and transfer learning. Biomed Opt Express. 2019;10:892–913. [Google Scholar]
28. Tulsani A, Kumar P, Pathan S. Automated segmentation of optic disc and optic cup for glaucoma assessment using improved UNET++ architecture. Biocybern Biomed Eng. 2021;41:819–32. [Google Scholar]
29. Natarajan D, Sankaralingam E, Balraj K, Karuppusamy S. A deep learning framework for glaucoma detection based on robust optic disc segmentation and transfer learning. Int J Imaging Syst Tech. 2022;32(1):230–50. [Google Scholar]
30. Devecioglu OC, Malik J, Ince T, Kiranyaz S, Atalay E, Gabbouj M. Real-time glaucoma detection from digital fundus images using Self-ONNs. IEEE Access. 2021;9:140031–41. [Google Scholar]
31. Fu H, Cheng J, Xu Y, Liu J. Glaucoma detection based on deep learning network in fundus image. In: Deep learning and convolutional neural networks for medical imaging and clinical informatics. Cham, Switzerland: Springer; 2019. p. 119–37. [Google Scholar]
32. Serte S, Serener A. Graph-based saliency and ensembles of convolutional neural networks for glaucoma detection. IET Image Process. 2021;15:797–804. [Google Scholar]
33. Fu H, Cheng J, Xu Y, Wong DWK, Liu J, Cao X. Joint optic disc and cup segmentation based on multi-label deep network and polar transformation. IEEE Trans Med Imaging. 2018;37:1597–1605. doi: 10.1109/TMI.2018.2791488. [Google Scholar] [PubMed] [CrossRef]
34. Tian Z, Zheng Y, Li X, Du S, Xu X. Graph convolutional network based optic disc and cup segmentation on fundus images. Biomed Opt Express. 2020;11:3043–57. [Google Scholar] [PubMed]
35. Deng J, Wei D, Socher R, Li LJ, Li K, Li FF. ImageNet: A large-scale hierarchical image database. In: Proceedings of the 2009 IEEE Conference on Computer Vision and Pattern Recognition, 2009 Jun 20–25; Miami, FL, USA. p. 248–55. [Google Scholar]
36. Chen LC, Zhu Y, Papandreou G, Schro F, Adam H. Encoder-decoder with atrous separable convolution for semantic image segmentation. In: Proceedings of the Springer on European Conference on Computer Vision (ECCV), 2018 Sep 8–14; Munich, Germany. p. 801–18. [Google Scholar]
37. Salehi AW, Khan S, Gupta G, Alabduallah BI, Almjally A, Alsolai H, et al. A study of CNN and transfer learning in medical imaging: advantages, challenges, future scope. Sustain. 2023;15(7):5930. [Google Scholar]
38. Kaur M, Kamra A. Detection of retinal abnormalities in fundus image using transfer learning networks. Soft Comput. 2023;27(6):3411–25. [Google Scholar]
39. Xu P, Wan C, Cheng J, Niu D, Liu J. Optic disc detection via deep learning in fundus images. In: Fetal, infant and ophthalmic medical image analysis. Berlin/Heidelberg, Germany: Springer; 2017. p. 134–41. [Google Scholar]
40. Sikaroudi M, Hosseini M, Gonzalez R, Rahnamayan S, Tizhoosh HR. Generalization of vision pre-trained models for histopathology. Sci Rep. 2023;13(1):6065. [Google Scholar] [PubMed]
41. Wu X, Sahoo D. Hoi, SCH recent advances in deep learning for object detection. Neurocomput. 2020;396:39–64. doi:10.1016/j.neucom.2020.01.085. [Google Scholar] [CrossRef]
42. Christian S, Toshev A, Erhan D. Deep neural networks for object detection. In: Advances in neural information processing systems 26. Lake Tahoe, Nevada, USA; 2013. Available from: https://papers.nips.cc/paper/5207-deep-neural-networks-for-object-detection.pdf. [Accessed 2022]. [Google Scholar]
43. Hu K, Jin J, Zheng F, Weng L, Ding Y. Overview of behavior recognition based on deep learning. Artif Intell Rev. 2023;56(3):1833–65. [Google Scholar]
44. Lin T, Goyal P, Girshick R, He K, Doll’ar P. Focal loss for dense object detection. In: Proceedings of the 2017 IEEE International Conference on Computer Vision (ICCV), 2017 Oct 22–29; Venice, Italy. p. 2980–8. [Google Scholar]
45. Song X, Zhou H, Feng X. Research on remote sensing image object detection based on deep learning. In: Proceedings of the World Conference on Intelligent and 3-D Technologies (WCI3DT 2022) Methods, Algorithms and Applications, 2023 Jan; Singapore: Springer Nature Singapore. p. 471–81. [Google Scholar]
46. Ren S, He K, Girshick R, Sun J. Faster R-CNN: towards real-time object detection with region proposal networks. IEEE Trans Pattern Anal Mach Intell. 2017;39:1137–49. [Google Scholar] [PubMed]
47. Ren S, He K, Girshick R, Sun J. Faster R-CNN: towards real-time object detection with region proposal networks. In: Advances in Neural Information Processing Systems 28; Curran Associates, Inc. Red Hook, NY, USA; 2015. p. 91–9. [Google Scholar]
48. Chen J, Chen J, Wang W, Zhu Y. Improved model for image tampering monitoring based on fast-RCNN. In: 2023 2nd International Conference on Data Analytics, Computing and Artificial Intelligence (ICDACAI), 2023 Oct; Zakopane, Poland, IEEE; p. 760–4. [Google Scholar]
49. Xin F, Zhang H, Pan H. Hybrid dilated multilayer faster RCNN for object detection. Vis Comput. 2023;40(1):1–14. [Google Scholar]
50. Erciyas A, Barışçı N, Ünver HM, Polat H. Improving detection and classification of diabetic retinopathy using CUDA and Mask RCNN. Signal, Image Video Process. 2023;17(4):1265–73. [Google Scholar]
51. Quigley H, Broman AT. The number of with Glaucoma worldwide in 2010 and 2020. Br J Ophthalmol. 2006;90:262–7. [Google Scholar] [PubMed]
52. Rodriguez-Una I, Azuara-Blanco A. New Technologies for glaucoma detection. Asia Pac J Ophthalmol. 2018 Nov;7(6):394–404. doi:10.22608/APO.2018349. [Google Scholar] [CrossRef]
53. Jonas Jost B, Wang Ya X, Dong L, Panda-Jonas S. High myopia and glaucoma-like optic neuropathy. Asia Pac J Ophthalmol. 2020;9(3):234–8. doi:10.1097/APO.0000000000000288. [Google Scholar] [CrossRef]
54. Brian F, David J, Austin L, April F. Can you differentiate these tough glaucoma cases?. Rev Optom. 2019. [Google Scholar]
55. Esther H, Linda Z, Jonathan C, Robert W. Optic disk size and glaucoma. Surv Ophthalmol. 2007;52(132–49. doi:10.1016/j.survophthal.2006.10.002. [Google Scholar] [CrossRef]
56. Ramos S, Aragon K, Powell JM. Best practices and strategies for medical educators to acknowledge and address REHD in educational materials. In: Best practices for acknowledging and addressing racial and ethnic health disparities in medical education. Cham: Springer International Publishing; 2023. p. 69–117. [Google Scholar]
57. Chollet FX. Xception: deep learning with depthwise separable convolutions. In: Proceedings of the IEEE Conference on Computer Vision and Pattern Recognition (CVPR), 2017 Jul 21–26; Honolulu, HI, USA. p. 1251–8. [Google Scholar]
58. Christian S, Ioffe S, Vanhoucke V, Alemi A. Inception-v4, inception-resnet and the impact of residual connections on learning. In: Proceedings of the AAAI Conference on Artificial Intelligence, 2017 Feb 4–9; San Francisco, CA, USA. [Google Scholar]
59. Turgut B. Pearls for correct assessment of optic disc at glaucoma diagnosis. US Ophthalmic Rev. 2017;10(2):104–10. doi:10.17925/USOR.2017.10.02.104. [Google Scholar] [CrossRef]
60. Khan AA, Alsubai S, Wechtaisong C, Almadhor A, Kryvinska N, Al Hejaili A, et al. CD-FL: cataract images based disease detection using federated learning. Comput Syst Sci Eng. 2023;47(2):1733–50. [Google Scholar]
61. Khan AA, Madendran RK, Thirunavukkarasu U, Faheem M. D2PAM: epileptic seizures prediction using adversarial deep dual patch attention mechanism. CAAI Trans Intell Tech. 2023;8(3):755–69. [Google Scholar]
Cite This Article
 Copyright © 2024 The Author(s). Published by Tech Science Press.
This work is licensed under a Creative Commons Attribution 4.0 International License , which permits unrestricted use, distribution, and reproduction in any medium, provided the original work is properly cited.
 Downloads
 Citation Tools