
 Submit a Paper
 Propose a Special lssue
 Open Access
ARTICLE

Modeling the Interaction between Vacancies and Grain Boundaries during Ductile Fracture
Department of Engineering Mechanics, School of Naval Architecture, Ocean and Civil Engineering, Shanghai Jiao Tong University, Shanghai, 200240, China
* Corresponding Author: Ping Yang. Email:
(This article belongs to the Special Issue: Computational Design and Modeling of Advanced Composites and Structures)
Computer Modeling in Engineering & Sciences 2024, 140(2), 2019-2034. https://doi.org/10.32604/cmes.2024.048334
Received 05 December 2023; Accepted 30 January 2024; Issue published 20 May 2024
 View Full Text
 Download PDF
Abstract
The experimental results in previous studies have indicated that during the ductile fracture of pure metals, vacancies aggregate and form voids at grain boundaries. However, the physical mechanism underlying this phenomenon remains not fully understood. This study derives the equilibrium distribution of vacancies analytically by following thermodynamics and the micromechanics of crystal defects. This derivation suggests that vacancies cluster in regions under hydrostatic compression to minimize the elastic strain energy. Subsequently, a finite element model is developed for examining more general scenarios of interaction between vacancies and grain boundaries. This model is first verified and validated through comparison with some available analytical solutions, demonstrating consistency between finite element simulation results and analytical solutions within a specified numerical accuracy. A systematic numerical study is then conducted to investigate the mechanism that might govern the micromechanical interaction between grain boundaries and the profuse vacancies typically generated during plastic deformation. The simulation results indicate that the reduction in total elastic strain energy can indeed drive vacancies toward grain boundaries, potentially facilitating void nucleation in ductile fracture.Keywords
The ductile fracture of metallic materials is primarily caused by the interaction between vacancies generated by plastic deformation and other defects such as dislocations, grain boundaries, inclusions, and pre-existing micro-voids. This interaction is the primary source of complexity in the mechanistic understanding of ductile fracture, relating to how point defects (i.e., vacancies) interact with extended defects, including the underlying microstructure [1]. For a fracture model with accurate predictive capability at the macroscopic level, it is essential to comprehend the physical mechanism of ductile fracture at the microscopic level. Tipper [2] and Puttick [3] were the first to reveal that ductile fracture can be divided into three stages: void nucleation, growth, and coalescence. Subsequently, Needleman et al. [4–6] developed models for void growth and coalescence based on experimental results. Segurado et al. [7,8] investigated the impact of different critical physical parameters on void growth at the microscopic scale. Currently, there is a relatively clear understanding of the micro-mechanisms of void growth and coalescence stages [9,10]. However, the fracture and material science community has yet to reach a consensus on the void nucleation mechanism, and existing models for void growth and coalescence presuppose a certain volume fraction of voids in the crystal [11,12]. Although real materials’ microstructures invariably contain distribution defects introduced by manufacturing or service history, little experimental evidence or theoretical analysis supports the assumption of pre-existing voids in ductile fracture modeling [13]. Therefore, studying void nucleation at the microscopic scale is necessary to enhance the predictive accuracy and applicability of these models of void growth and coalescence [14].
Early experiments on ductile fracture indicated grain boundaries as the major nucleation sites for voids [15–17]. More recent experiments by Noell et al. [18,19] demonstrated that the mechanism of void nucleation is vacancy condensation. These experimental results suggest that the vacancy concentration at grain boundaries is significantly higher than within the grain interiors. However, the mechanisms underlying this phenomenon or theoretical conjectures remain unclear [20,21]. It has not been thoroughly analyzed whether the configuration that vacancies accumulate more preferentially at grain boundaries is energetically favorable. Since crystal defects involved in the mechanisms of ductile fracture initiation can be well described in a unified theory [22,23], studying this issue from the micromechanical perspective is both possible and intriguing. This study presents a micromechanical model of vacancies and grain boundaries. We first derives an analytical solution for the equilibrium distribution of vacancies at grain boundaries. Then, we develop a finite element numerical model to study more general cases of interaction between vacancies and grain boundaries. This model assumes several probability density functions to account for possible vacancy distributions at grain boundaries in real materials. The conclusions drawn may shed light on the micro-mechanisms responsible for the transition from plastic deformation to the formation of micro damages, such as micro-voids.
2 Thermodynamic Equilibrium Distribution of Vacancies at a Grain Boundary
In Section 2.1, an analytical model of the vacancies’ distribution in thermodynamic equilibrium is derived. This model is then utilized in Section 2.2 to study the vacancies’ distribution near grain boundaries.
2.1 Thermodynamic Modeling of Vacancy Equilibrium Distribution
Vacancies represent the most prevalent point defects in metallic materials, significantly impacting the materials’ mechanical properties and responses under external thermal or mechanical loads [24]. Fig. 1a depicts the creation of a vacancy in a perfect lattice due to the absence of an atom. The interaction forces between atoms compel those near the vacancy to deviate markedly from their equilibrium positions in the perfect lattice, resulting in lattice distortion [25].
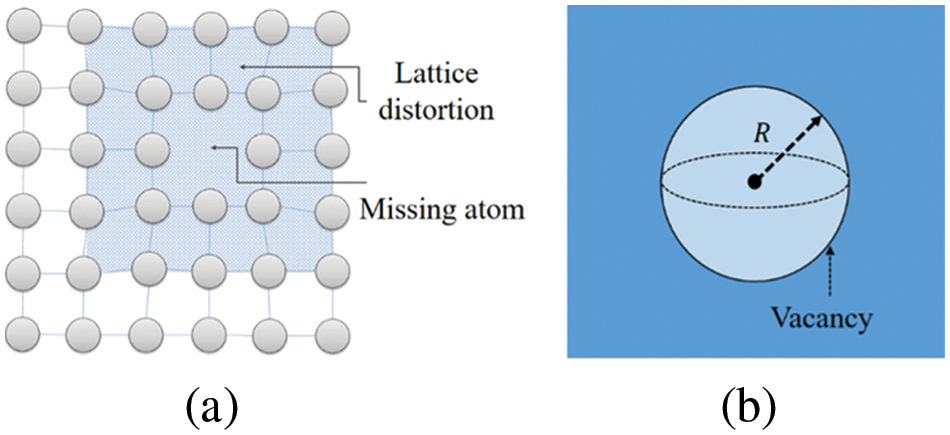
Figure 1: (a) Schematic diagram of generating a vacancy; (b) Micromechanical model of the vacancy
The formation energy
where
where
In current model, we evaluate the elastic field of vacancies using the Eshelby spherical inclusions model. The size of the spherical inclusions is comparable to the size of an atom. Therefore, we can approximate that the stress of the extended defects is uniformly distributed within the spherical inclusion, similar to the stress at the center of the spherical inclusion. As a result, the interaction energy of the vacancy and the extended defect can be approximated as
where
When
Thereafter, combining Eqs. (6) and (7) gives rise to the distribution of vacancies in equilibrium state (for
The above equation defines the relative vacancy concentration
2.2 Distribution of Vacancies at a Grain Boundary
Polycrystalline materials consist of numerous grains with varying orientations. The grain boundary, the interface between two adjacent grains, is instrumental in defining the material’s mechanical properties [30]. Despite the efforts that have been given for decades, it is still challenging to appropriately incorporate grain boundaries into many micromechanical modeling, owing to the complicated structures and properties associated with essentially an infinite set of possible grain boundaries contained in a real material [30–32]. However, for a low-angle symmetric tilt grain boundary, a widely accepted model describes the boundary using dislocations. As depicted in Fig. 2a, the grain boundary is represented by a series of infinitely long edge dislocations with an identical Burgers vector; the associated misorientation angle
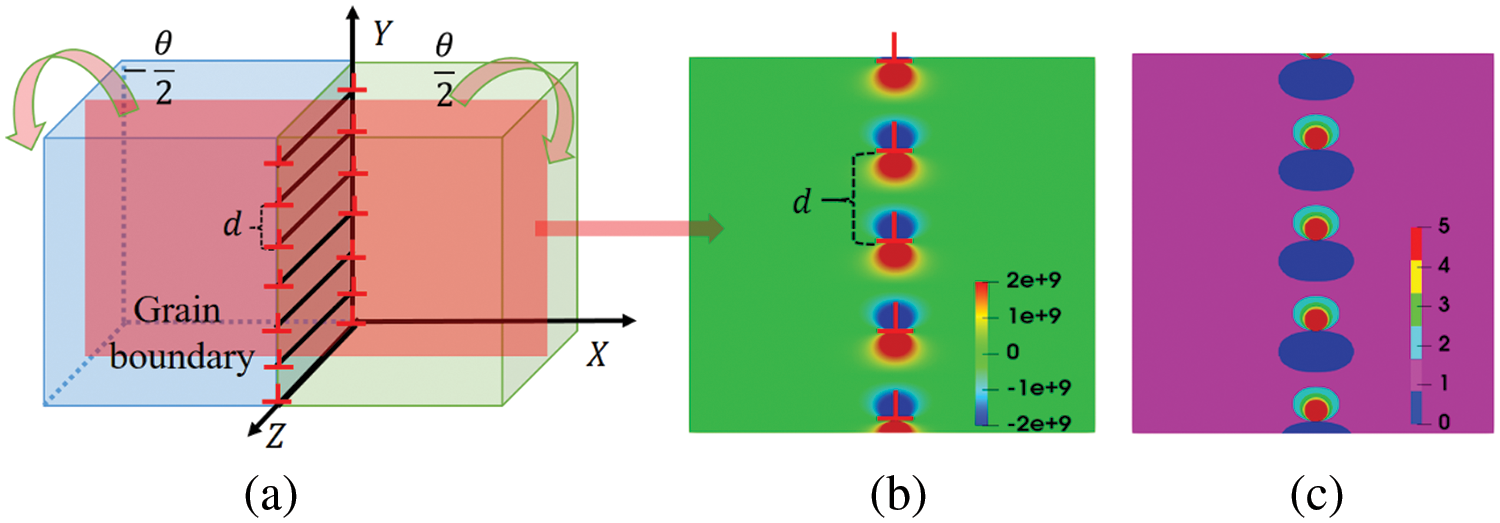
Figure 2: (a) Schematic of symmetrically tilted grain boundaries; (b) Hydrostatic stress field near grain boundary, the unit is GPa; (c) Distribution of relative vacancy concentration near grain boundary
where
where
The parameters utilized in the model are enumerated in Table 1. Figs. 2b and 2c illustrate the hydrostatic stress field near the grain boundary and the spatial distribution of the relative vacancy concentration

3 Development of the Finite Element Model
Since plastic deformation in actual materials involves dislocation slips (and potentially phase transformations), these highly non-equilibrium irreversible processes likely result in vacancy distributions different from the equilibrium state previously discussed. Therefore, understanding the driving forces behind the equilibrium distribution of vacancies at the grain boundary is crucial. According to thermodynamic theory, this distribution can persist long enough for thermodynamically possible damage processes like void nucleation to occur. Utilizing the unified micromechanics theory of crystal defects, a finite element model is developed using the open-source software deal.II [35]. This model will be applied in Section 4 to investigate the broader scenarios of interaction between vacancies and grain boundaries during plastic deformation. Numerical validations for the developed finite element model are subsequently conducted.
3.1 Numerical Validation of the Vacancy Elastic Field
The micromechanical model presented above for vacancies corresponds to an infinite medium. However, in finite element simulations, only finite regions are considered. Before initiating the simulation, determining the appropriate size of the region for obtaining sufficiently accurate numerical solutions remains unknown. The required size for finite element simulations is approximated by analyzing the distribution of the vacancy elastic strain energy. This energy is calculated as follows:
where
A spherical region with a radius of
Eq. (14) clearly shows that
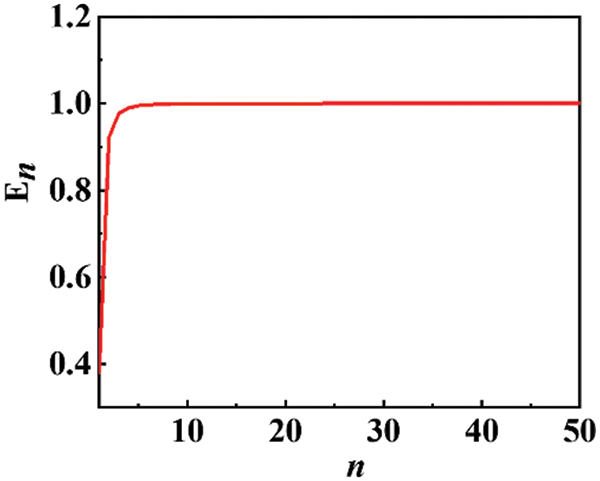
Figure 3: Relationship between
Consider a matrix with a cubic shape, an edge length of 1, and a spherical inclusion of radius 0.1 at its center. The units of length here and subsequently are all reduced (dimensionless). The finite element simulation employs 8-node hexahedral elements with a 64 × 64 × 64 regular subdivision mesh, imposing zero displacement constraints on the boundary conditions, with parameters as listed in Table 1. All finite element simulations in this study are conducted using the open-source finite element library deal.II [35].
Since the spherical inclusion only applies hydrostatic eigenstrain, the shear eigenstrain component is zero. Analytical solutions (Eq. (2)) indicate that the normal stresses within the inclusions are constant and equal, while the shear stress remains zero. Fig. 4 presents the finite element simulation results for stress, closely mirroring the stress distribution characteristics. To further validate the finite element model’s accuracy, a comparison of the simulation results for stress along the y-axis in the cross-section plane (shown in Fig. 4) with the analytical solutions (illustrated in Fig. 5) is conducted. The finite element simulation results and the analytical solutions closely align in regions distant from the inclusion boundary. However, near the inclusion boundary, the discontinuity in eigenstrain leads to greater discrepancies between the methods. The finite element simulation results show high accuracy for the normal stresses but relatively lower accuracy for the shear stress component. The primary sources of error include abrupt changes in eigenstrain at the inclusion interfaces and the use of regular grids in the simulation. These errors are an acknowledged issue in the numerical modeling of micromechanics with discontinuities and can be mitigated by using a finer mesh, albeit at the expense of increased computational resources. However, this study’s ultimate goal is to analyze the elastic interaction between vacancies and grain boundaries based on trends, and the current simulation results are sufficiently accurate for these purposes (The details are discussed in Section 4).
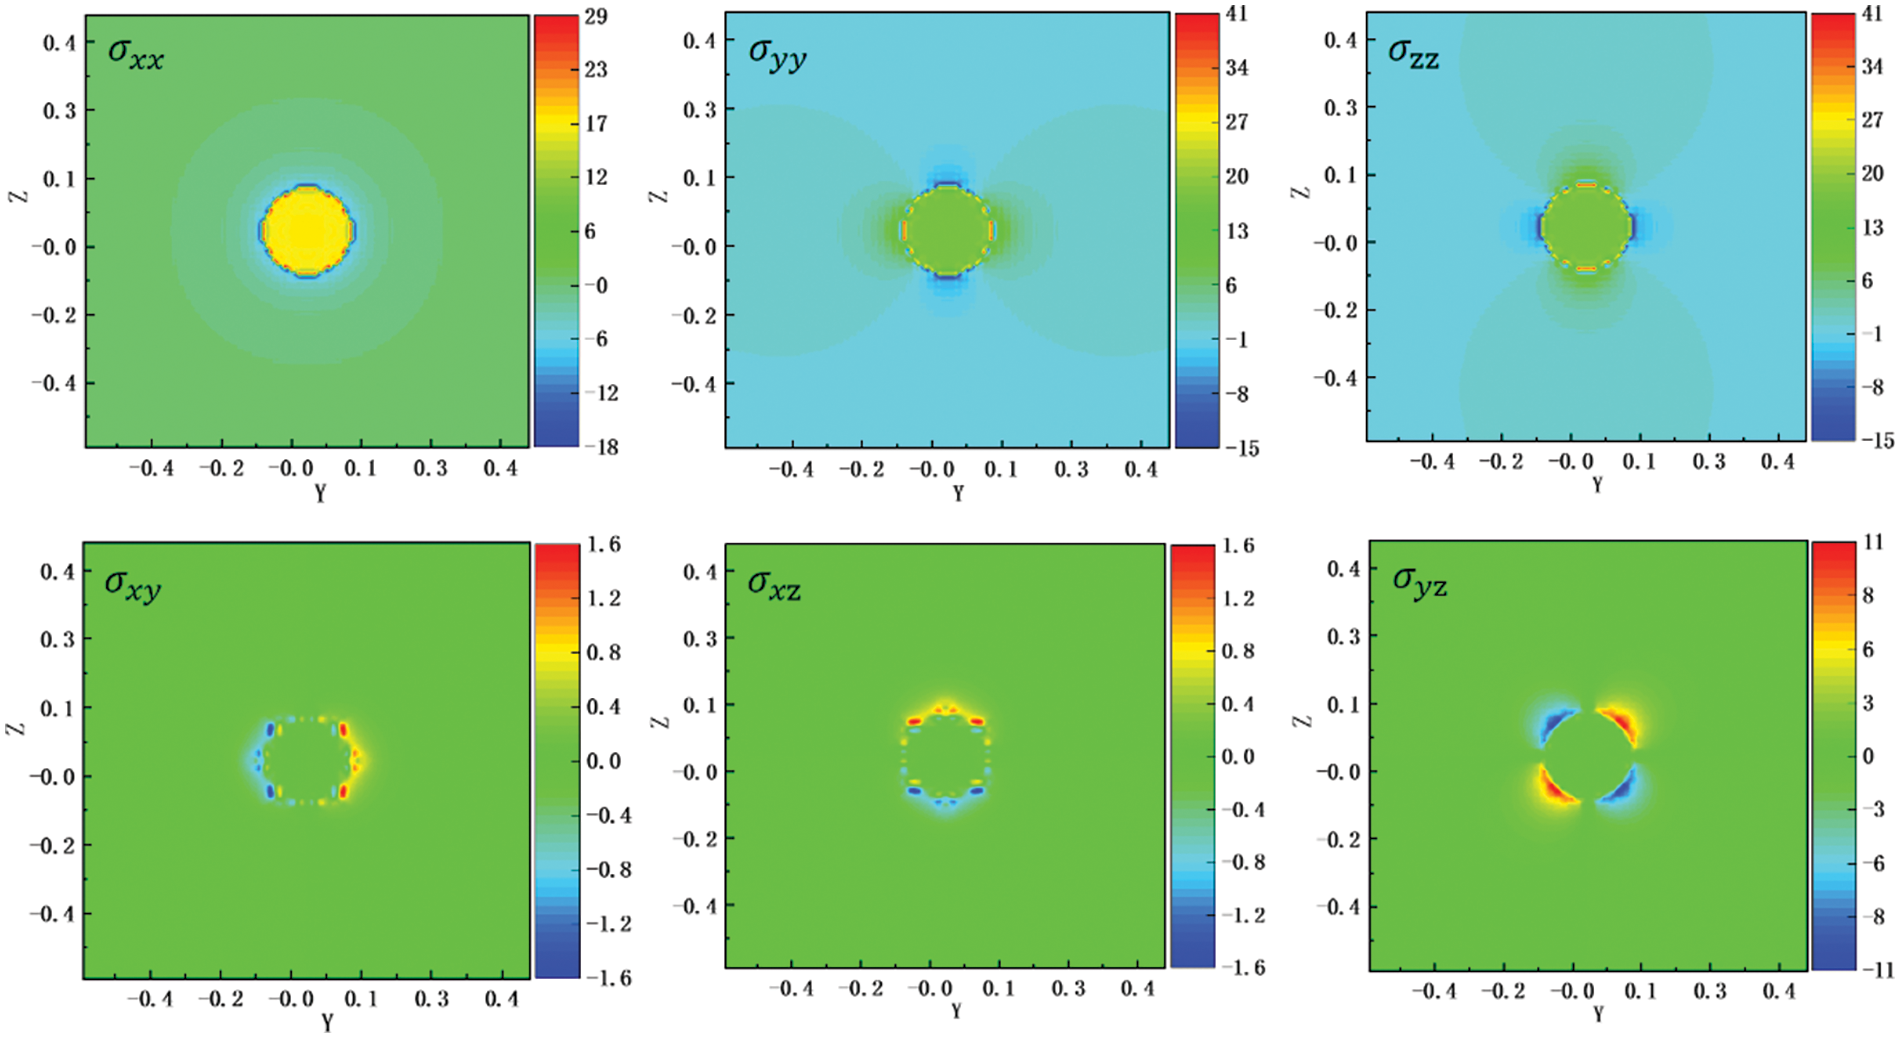
Figure 4: Finite element simulation results from stress (on the
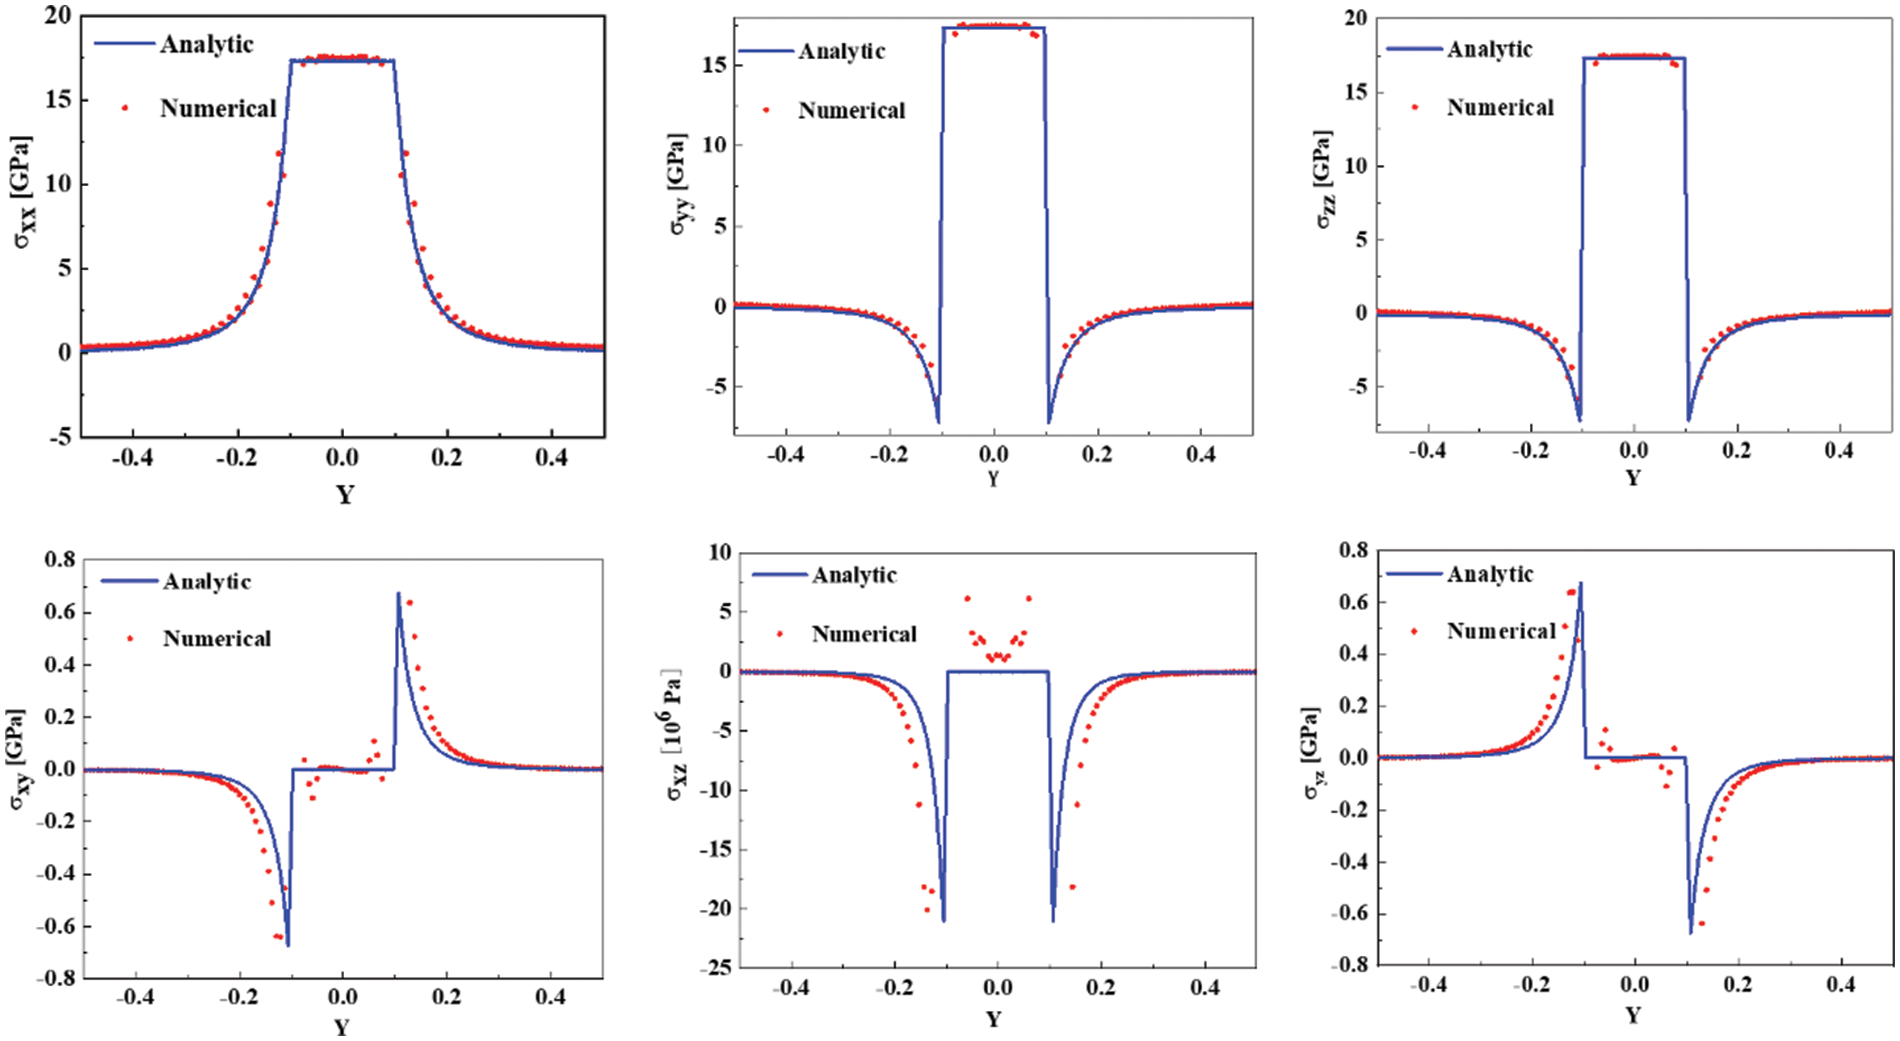
Figure 5: Comparison of finite element simulation results and analytical solutions for stress (y-axis)
3.2 Numerical Validation of Grain Boundary Elastic Field
In order to correctly implement micromechanical simulations of vacancy and grain boundary interactions, the researchers first established a finite element model of the grain boundary and validated its accuracy. As illustrated in Fig. 6, since dislocation lines can terminate only inside materials at interfaces or other defects, dislocations in these simulations exist exclusively as dislocation loops [36]. In the finite element simulation, a pair of grain boundary dipoles (each with equal but oppositely directed Burgers vector magnitudes) is placed within a
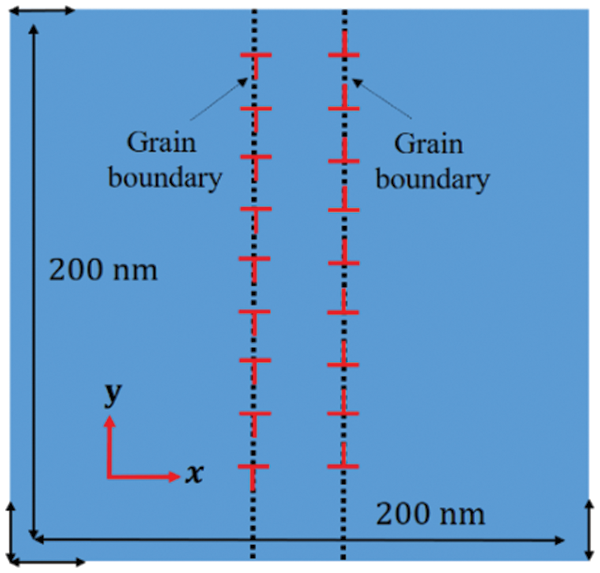
Figure 6: Schematic diagram of finite element model for symmetric tilted grain boundaries
Fig. 7a displays the finite element simulation results of stresses generated by the grain boundary, highlighting stress concentration near the grain boundary. Figs. 7b and 7c contrast these finite element simulation results with the analytical stress solution. While the results align well in the direction perpendicular to the grain boundary, there is less agreement parallel to it, indicating only a compatible trend. This discrepancy primarily arises because the finite element simulation can consider only a limited number of dislocations over a finite region. In contrast, the analytical solution involves summing an infinite series of stress terms from each dislocation, leading to inevitable differences between the analytical and numerical solutions. However, as Section 4 notes, only the qualitative elastic interaction between vacancies and grain boundaries is analyzed, making these finite element simulation results adequately sufficient.
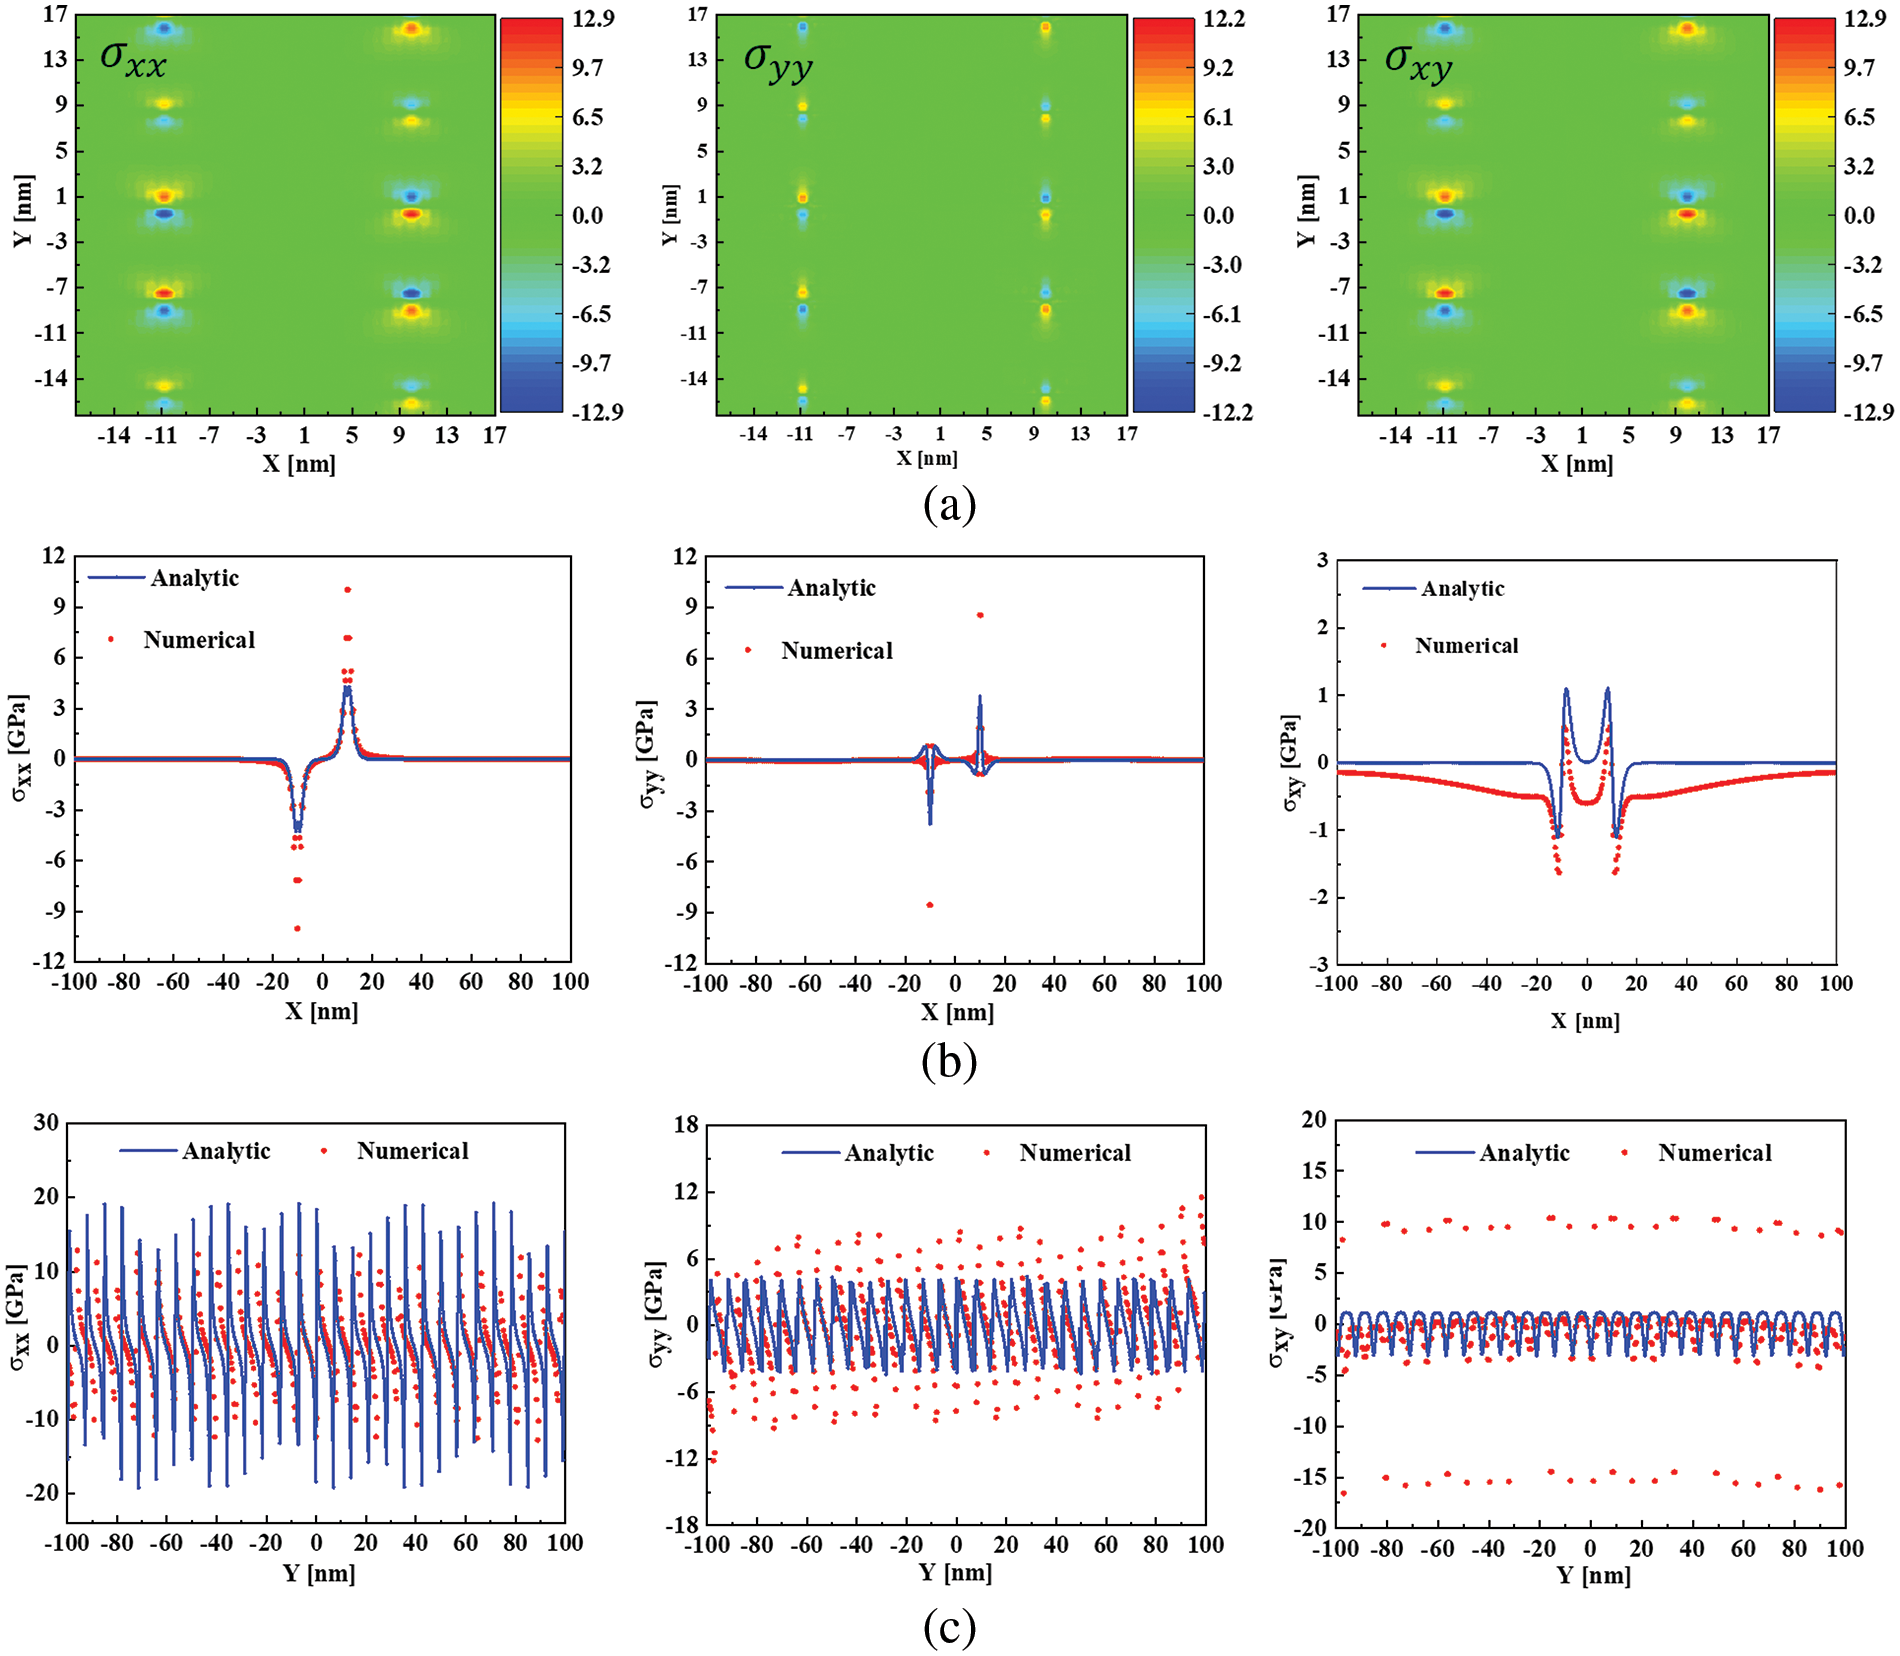
Figure 7: (a) Finite element simulation results of stress generated by grain boundary, in GPa; (b) Comparisons between the finite element simulation results and the analytical solutions of stresses (Vertical grain boundary); (c) Comparisons between the finite element simulation results and the analytical solutions of stresses (Parallel grain boundary direction)
4 Modeling the Interaction between Vacancies and the Grain Boundary
Section 2.1 suggests that the system’s entropy remains constant at a consistent temperature and vacancy number. Consequently, the equilibrium distribution defined by Eq. (8) results in the system’s lowest elastic strain energy among all potential vacancy distributions. The methodology involves generating vacancy distributions that satisfy Eq. (8), calculating the system’s elastic strain energy
Assuming the vacancy distribution is a function of the distance
where
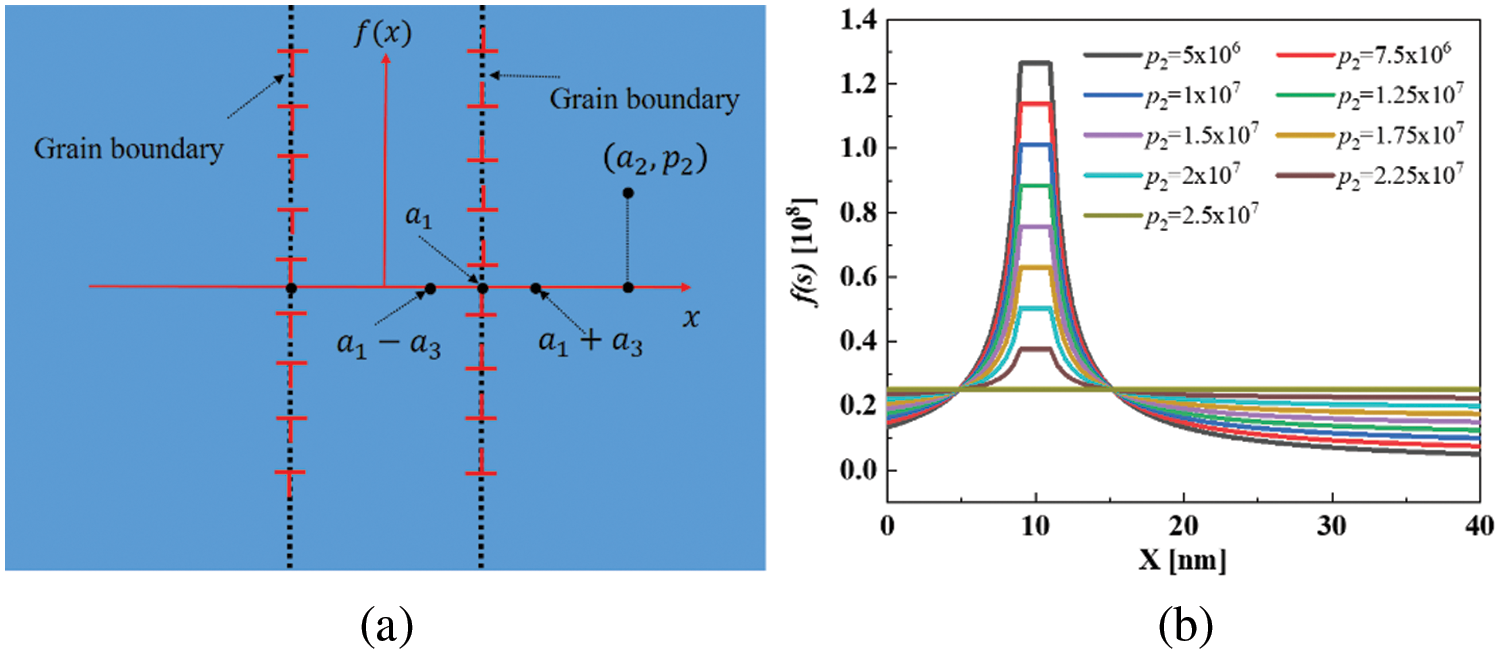
Figure 8: (a) Schematic diagram of the elastic interaction between simulated vacancies and grain boundaries; (b) Probability density functions of vacancy distributions
Further assuming that
The probability density function must satisfy the following relation within its domain of definition:
It can be deduced by simultaneous equations and simplification that as long as
In the finite element simulations, a cubic region with a 100 nm side length is defined. Considering that the stress field generated by vacancies is approximately null outside a region more than five times the inclusion radius (refer to Section 3.1), and the vacancy count decreases with increasing distance from the grain boundary, setting
Based on these vacancy distribution functions, 4,000 vacancies are positioned within the finite element simulation area, with 2,000 vacancies on each side of the y-axis. These vacancies are distributed according to a selected probability density function in the direction perpendicular to the grain boundary and uniformly along the direction parallel to it. Fig. 9a illustrates the planar schematic of the vacancy distribution around the grain boundaries for
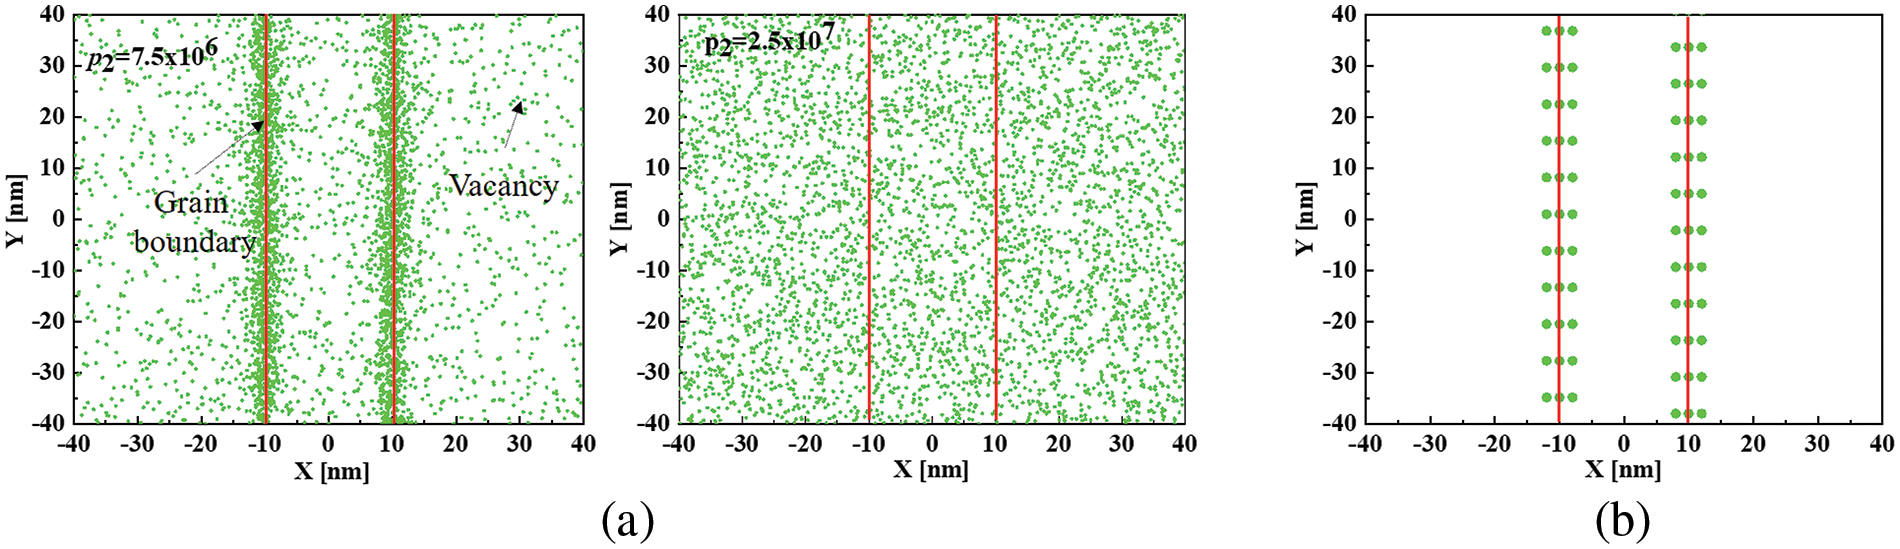
Figure 9: (a) Schematic diagram of the vacancies distribution generated by
Finite element simulation results show that when the vacancy distribution at grain boundaries closely aligns with the equilibrium distribution (

During the void nucleation process, vacancies condense to form three-dimensional voids, which in turn generate new voids, indicating that the elastic energy of the vacancies is released. The system increases the surface energy of the voids while the voids generate elastic interactions with external loads and grain boundaries, further reducing the system’s free energy. These factors influence the thermodynamics and kinetics of void nucleation. Yang et al. [20] conducted research on void nucleation by vacancy condensation and established a theoretical model that systematically considers the changes in the system’s free energy before and after void nucleation. The results indicate that both the activation-free energy barrier and the nucleation time required for void nucleation are closely related to the local vacancy concentration. The higher the local vacancy concentration, the smaller the activation-free energy barrier and the shorter the nucleation time required for void nucleation. In this study, it is demonstrated that there is a higher local vacancy concentration at grain boundaries in an equilibrium state. Combined with the work of Yang et al. [20], it is highly plausible for voids to nucleate at grain boundaries, consistent with experimental observations [17,18].
Several limitations associated with the current model warrant discussion and need to be addressed in future works. Firstly, the simulation of vacancy and grain boundary elastic interactions is based on the discrete dislocation model of the grain boundary in the current model. The stress field of the grain boundary requires the superposition of the stress field from an infinite number of edge dislocations before convergence is achieved. However, due to computational efficiency limitations, only a limited number of dislocations can be placed in the finite element simulation to mimic the elastic field of the grain boundary. Furthermore, it is assumed that the distribution configuration of vacancies at grain boundaries satisfies the pre-assumed distribution. Nonetheless, the distribution of vacancies at a certain point during ductile fracture may deviate from this pre-assumed distribution. To study the interaction of vacancies and grain boundaries more accurately, incorporating microscopic/atomic modeling is essential.
In this study, an analytical model for the distribution of vacancies in thermodynamic equilibrium is derived based on micromechanics theory. Subsequently, a finite element model for vacancies and grain boundaries is established, and its correctness is verified by comparison with the analytical solutions. Finally, based on this finite element model, the elastic interaction between vacancies and grain boundaries is studied, and the correctness of the analytical model is validated. Particularly, it is shown that in regions where the hydrostatic stress is less than zero, a higher concentration of local vacancies is observed, and the lower the hydrostatic stress, the greater the tendency to promote a higher local vacancy concentration, thereby helping to lower the system’s elastic strain energy. The current findings may provide a micromechanical explanation for the experimentally observed void nucleation at grain boundaries and may thus be further utilized in full-field simulations of void nucleation and ductile fracture in metals.
Acknowledgement: The authors would like to thank the editor and anonymous reviewers for their valuable comments.
Funding Statement: This work is supported by the National Key Research and Development Program of China under Grant No. 2023YFB3712401 and the National Natural Science Foundation of China under Grant Nos. 12102254 and 12327802.
Author Contributions: The authors confirm their contribution to the paper as follows: study conception and design: Mingjian Li, Ping Yang, Pengyang Zhao; data collection: Mingjian Li, Ping Yang; analysis and interpretation of results: Mingjian Li, Ping Yang, Pengyang Zhao; draft manuscript preparation: Mingjian Li, Ping Yang, Pengyang Zhao. All authors reviewed the results and approved the final version of the manuscript.
Availability of Data and Materials: The data that support the findings of this study are available from the corresponding author upon reasonable request.
Conflicts of Interest: The authors declare that they have no conflicts of interest to report regarding the present study.
References
1. Anderson, T. L. (2017). Fracture mechanics: Fundamentals and applications, 4th edition. Boca Raton: Taylor & Francis Group. [Google Scholar]
2. Tipper, C. F. (1949). The fracture of metals. Metallurgia, 39(231), 133–137. [Google Scholar]
3. Puttick, K. E. (1959). Ductile fracture in metals. Philosophical Magazine, 4(44), 964–969. https://doi.org/10.1080/14786435908238272 [Google Scholar] [CrossRef]
4. Needleman, A., Tvergaard, V. F. (1984). An analysis of ductile rupture in notched bars. Journal of the Mechanics and Physics of Solids, 32(6), 461–490. https://doi.org/10.1016/0022-5096(84)90031-0 [Google Scholar] [CrossRef]
5. Gurson, A. L. (1977). Continuum theory of ductile rupture by void nucleation and growth: Part I—Yield criteria and flow rules for porous ductile media. Journal of Engineering Materials and Technology, 99(1), 2–15. https://doi.org/10.1115/1.3443401 [Google Scholar] [CrossRef]
6. Rice, J. R., Tracey, D. M. (1969). On the ductile enlargement of voids in triaxial stress fields. Journal of the Mechanics and Physics of Solids, 17(3), 201–217. https://doi.org/10.1016/0022-5096(69)90033-7 [Google Scholar] [CrossRef]
7. Segurado, J., Llorca, J. (2010). Discrete dislocation dynamics analysis of the effect of lattice orientation on void growth in single crystals. International Journal of Plasticity, 26(6), 806–819. https://doi.org/10.1016/j.ijplas.2009.10.009 [Google Scholar] [CrossRef]
8. Hosseini, N., Nieto-Fuentes, J. C., Dakshinamurthy, M., Rodríguez-Martínez, J. A., Vadillo, G. (2022). The effect of material orientation on void growth. International Journal of Plasticity, 148, 103149. https://doi.org/10.1016/j.ijplas.2021.103149 [Google Scholar] [CrossRef]
9. Wu, W., Xia, R., Qian, G., Liu, Z., Razavi, N. et al. (2023). Mechanostructures: Rational mechanical design, fabrication, performance evaluation, and industrial application of advanced structures. Progress in Materials Science, 131, 101021. https://doi.org/10.1016/j.pmatsci.2022.101021 [Google Scholar] [CrossRef]
10. Jha, J. S., Toppo, S. P., Singh, R., Tewari, A., Mishra, S. K. (2021). Deformation behavior of Ti-6Al-4V microstructures under uniaxial loading: Equiaxed Vs. transformed-β microstructures. Materials Characterization, 171, 110780. https://doi.org/10.1016/j.matchar.2020.110780 [Google Scholar] [CrossRef]
11. Yalçinkaya, T., Tandoğan, İ.T., Özdemir, İ. (2021). Void growth based inter-granular ductile fracture in strain gradient polycrystalline plasticity. International Journal of Plasticity, 147, 103123. https://doi.org/10.1016/j.ijplas.2021.103123 [Google Scholar] [CrossRef]
12. Torki, M. E. (2019). A unified criterion for void growth and coalescence under combined tension and shear. International Journal of Plasticity, 119, 57–84. https://doi.org/10.1016/j.ijplas.2019.02.002 [Google Scholar] [CrossRef]
13. Tekoglu, C., Leblond, J. B., Pardoen, T. (2012). A criterion for the onset of void coalescence under combined tension and shear. Journal of the Mechanics and Physics of Solids, 60(7), 1363–1381. https://doi.org/10.1016/j.jmps.2012.02.006 [Google Scholar] [CrossRef]
14. Li, G., Cui, S. (2020). A review on theory and application of plastic meso-damage mechanics. Theoretical and Applied Fracture Mechanics, 109, 102686. https://doi.org/10.1016/j.tafmec.2020.102686 [Google Scholar] [CrossRef]
15. Bringa, E. M., Traiviratana, S., Meyers, M. A. (2010). Void initiation in fcc metals: Effect of loading orientation and nanocrystalline effects. Acta Materialia, 58(13), 4458–4477. https://doi.org/10.1016/j.actamat.2010.04.043 [Google Scholar] [CrossRef]
16. Lu, L., Pan, Q., Hattar, K., Boyce, B. L. (2021). Fatigue and fracture of nanostructured metals and alloys. MRS Bulletin, 46, 258–264. https://doi.org/10.1557/s43577-021-00054-y [Google Scholar] [CrossRef]
17. Noell, P., Carroll, J., Hattar, K., Clark, B., Boyce, B. (2017). Do voids nucleate at grain boundaries during ductile rupture? Acta Materialia, 137, 103–114. https://doi.org/10.1016/j.actamat.2017.07.004 [Google Scholar] [CrossRef]
18. Noell, P. J., Sabisch, J. E. C., Medlin, D. L., Boyce, B. L. (2020). Nanoscale conditions for ductile void nucleation in copper: Vacancy condensation and the growth-limited microstructural state. Acta Materialia, 184, 211–224. https://doi.org/10.1016/j.actamat.2019.11.022 [Google Scholar] [CrossRef]
19. Noell, P. J., Sills, R. B., Boyce, B. L. (2020). Suppression of void nucleation in high-purity aluminum via dynamic recrystallization. Metallurgical and Materials Transactions A, 51, 154–166. https://doi.org/10.1007/s11661-019-05457-w [Google Scholar] [CrossRef]
20. Yang, P., Zhao, P. (2023). Void nucleation at dislocation boundaries aided by the synergy of multiple dislocation pile-ups. International Journal of Plasticity, 171, 103779. https://doi.org/10.1016/j.ijplas.2023.103779 [Google Scholar] [CrossRef]
21. Noell, P. J., Sills, R. B., Benzerga, A. A., Boyce, B. L. (2023). Void nucleation during ductile rupture of metals: A review. Progress in Materials Science, 135, 0079–6425. [Google Scholar]
22. Eshelby, J. D. (1956). The continuum theory of lattice defects, pp. 79–144. USA: Elsevier Science & Technology. [Google Scholar]
23. Mura, T. (1987). Micromechanics of defects in solids, 2nd edition. Dordrecht: Springer Netherlands. [Google Scholar]
24. Ungár, T., Schafler, E., Hanák, P., Bernstorff, S., Zehetbauer, M. (2007). Vacancy production during plastic deformation in copper determined by in situ X-ray diffraction. Materials Science and Engineering, 462(1–2), 398–401. [Google Scholar]
25. Hull, D., Bacon, D. J. (2001). Introduction to dislocations, 4th edition. San Diego: Elsevier Science. [Google Scholar]
26. Cai, W., Sills, R. B., Barnett, D. M., Nix, W. D. (2014). Modeling a distribution of point defects as misfitting inclusions in stressed solids. Journal of the Mechanics and Physics of Solids, 66, 154–171. https://doi.org/10.1016/j.jmps.2014.01.015 [Google Scholar] [CrossRef]
27. Cui, Z., Fan, X., Zhang, G. (2021). Molecular dynamic study for concentration-dependent volume relaxation of vacancy. Microelectronics Reliability, 120, 114127. https://doi.org/10.1016/j.microrel.2021.114127 [Google Scholar] [CrossRef]
28. Eshelby, J. D. (1957). The determination of the elastic field of an ellipsoidal inclusion, and related problems. Mathematical and Physical Sciences, 241(1226),376–396. [Google Scholar]
29. Eshelby, J. D. (1959). The elastic field outside an ellipsoidal inclusion. Mathematical and Physical Sciences, 252(1271), 561–569. [Google Scholar]
30. Mishnaevsky Jr, L., Levashov, E. (2015). Micromechanical modelling of nanocrystalline and ultrafine grained metals: A short overview. Computational Materials Science, 96, 365–373. https://doi.org/10.1016/j.commatsci.2014.09.024 [Google Scholar] [CrossRef]
31. Han, J., Thomas, S. L., Srolovitz, D. J. (2018). Grain-boundary kinetics: A unified approach. Progress in Materials Science, 98, 386–476. https://doi.org/10.1016/j.pmatsci.2018.05.004 [Google Scholar] [CrossRef]
32. Raabe, D., Sun, B., Kwiatkowski Da Silva, A., Gault, B., Yen, H. W. et al. (2020). Current challenges and opportunities in microstructure-related properties of advanced high-strength steels. Metallurgical and Materials Transactions A, 51, 5517–5586. https://doi.org/10.1007/s11661-020-05947-2 [Google Scholar] [CrossRef]
33. Aifantis, K. E. (2009). Interfaces in crystalline materials. Procedia Engineering, 1(1), 167–170. https://doi.org/10.1016/j.proeng.2009.06.039 [Google Scholar] [CrossRef]
34. Hirth, J. P., Lothe, J. (1982). Theory of dislocations. New York: Wiley. [Google Scholar]
35. Arndt, D., Bangerth, W., Blais, B., Clevenger, T. C., Fehling, M. et al. (2020). The deal.II library, version 9.2. Journal of Numerical Mathematics, 28(3), 131–146. https://doi.org/10.1515/jnma-2020-0043 [Google Scholar] [CrossRef]
36. Chen, B., Li, S., Zong, H., Ding, X., Sun, J. et al. (2020). Unusual activated processes controlling dislocation motion in body-centered-cubic high-entropy alloys. Proceedings of the National Academy of Sciences, 117(28), 16199–16206. https://doi.org/10.1073/pnas.1919136117 [Google Scholar] [PubMed] [CrossRef]
Cite This Article
 Copyright © 2024 The Author(s). Published by Tech Science Press.
This work is licensed under a Creative Commons Attribution 4.0 International License , which permits unrestricted use, distribution, and reproduction in any medium, provided the original work is properly cited.
 Downloads
 Citation Tools