
 Submit a Paper
 Propose a Special lssue
 Open Access
ARTICLE

Constitutive Behavior of the Interface between UHPC and Steel Plate without Shear Connector: From Experimental to Numerical Study
1 School of Naval Architecture, Ocean and Civil Engineering, Shanghai Jiao Tong University, Shanghai, 200240, China
2 Department of Bridge Engineering, Tongji University, Shanghai, 200092, China
* Corresponding Author: Hui Wang. Email:
(This article belongs to the Special Issue: Computer-Aided Uncertainty Modeling and Reliability Evaluation for Complex Engineering Structures)
Computer Modeling in Engineering & Sciences 2024, 140(2), 1863-1888. https://doi.org/10.32604/cmes.2024.048217
Received 01 December 2023; Accepted 21 February 2024; Issue published 20 May 2024
 View Full Text
 Download PDF
Abstract
The application of ultra-high performance concrete (UHPC) as a covering layer for steel bridge decks has gained widespread popularity. By employing a connection without a shear connector between the steel plate and UHPC, namely, the sandblasted interface and the epoxy adhesive with sprinkled basalt aggregate interface, the installation cannot only be simplified but also the stress concentration resulting from the welded shear connectors can be eliminated. This study develops constitutive models for these two interfaces without shear connectors, based on the interfacial pull-off and push-out tests. For validation, three-point bending tests on the steel-UHPC composite plates are conducted. The results indicated that the proposed bilinear traction-separation model for the sandblasted interface and the trapezoidal traction-separation model for the epoxy adhesive with sprinkled basalt aggregate interface can generally calibrate the interfacial behavior. However, the utilization of the experimentally determined pure shear strength underestimates the load-carrying capacity of the composite plates in the case of three-point bending tests. By recalling the Mohr-Coulomb criterion, this underestimation is attributed to the enhancement of the interface shear strength by the presence of normal stress.Keywords
Ultra-high performance concrete (UHPC) exhibits exceptional material properties, including remarkable tensile and compressive strengths, ductility, and superior durability. These advantageous characteristics have led to the extensive application of UHPC in various engineering structures, particularly in bridge projects [1–5]. Orthotropic steel deck bridges commonly encounter fatigue cracks in the steel deck and pavement fractures due to bending deformation related to traffic loads [6–8]. Utilizing UHPC as the rigid pavement layer of the orthotropic steel deck facilitates the mitigation of fatigue cracks within the deck structure, enhancement of cracking resistance in the pavement layer, and improvement of the overall stiffness of the steel bridge panels [9,10]. Consequently, replacing traditional asphalt pavement with UHPC has increased in popularity [11].
The reliable connection between the UHPC layer and the steel bridge deck significantly influences the behavior of the composite structure [12]. Two connection modes are generally employed for UHPC and orthotropic bridge decks. The first involves welding mechanical connectors, mainly studs, onto the steel bridge deck [13]. The other mode is the connection without a shear connector, achieved by direct bonding between the steel bridge deck and the UHPC layer [2]. The interfacial behavior of the steel-UHPC composite, using mechanical connectors, has been extensively investigated [14–16], reaching a relatively mature stage. However, welding many studs onto the steel bridge deck is labor-intensive in practical engineering applications. This also inevitably leads to welding defects and residual stresses, which can threaten the fatigue resistance of orthotropic decks [11,17].
In contrast, the non-mechanical connection between the steel bridge deck and the UHPC layer by direct bonding presents an alternative option [18,19], exhibiting prominent advantages. Experimental studies have reported on investigating the bonding behavior and potential promotion measures of interfacial bonding. For example, Zhao et al. [20] conducted push-out tests on a steel-concrete composite structure bonded with epoxy resin mortar, and observed brittle failure of the concrete at the adhesive interface. Zou et al. [21] investigated the toughness of four different steel-UHPC bonding interfaces: the epoxy direct bonding interface, the quartz sand particle embedded interface, the helical fiber toughening interface, and the steel wire mesh toughening interface. The steel wire mesh toughening interface demonstrated superior mechanical properties and the potential to replace stud-connected interfaces. Duan et al. [22] experimentally investigated the effectiveness of UHPC, using an epoxy resin adhesive-bonded interface, to strengthen orthotropic steel decks, which exhibits significant improvement in the load-carrying capacity and stiffness of the steel deck, comparable to those achieved with mechanical connectors, albeit exhibiting brittle interface damage. Kumar et al. [23] compared the shear stiffness of the steel-concrete interface between the epoxy resin adhesive-bonded sample and the stud-connected sample, revealing significantly higher shear stiffness of the bonded sample. Wang et al. [24] conducted interfacial tests on the UHPC-steel composite beams with epoxy resin-bonded limestone interfaces subjected to static loading, comparing them with the composite beams with traditional stud interfaces. They found that the ultimate load of the former reached 93.2% of the latter. Souici et al. [25] conducted an experimental study on two types of steel-concrete beams, one using conventional stud connections and the other employing epoxy glue connections. They observed that the bending moments, resistance, and deflection of the bonded combination beams could be accurately estimated with minimal deformation and significant mechanical advantages. Apart from the epoxy-adhered interface, the sandblasted interface could also be a choice. Zhang et al. [2] tested the mechanical properties of steel-UHPC decks with the sandblasted interface treatment, epoxy adhesive, and sprinkled-in basalt aggregate interface treatment, subjected to static and fatigue loading. Their load-carrying capacity exceeded that of the decks with stud-connected interfaces, while the fatigue resistance of the stud-connected interface was superior to that of the epoxy-adhered interface but weaker than that of the sandblasted interface. However, reasonable constitutive models for these two interfaces without shear connectors are still lacking.
The interfacial constitutive models are generally integrated with numerical simulations to study the behavior of UHPC-steel composites. For instance, Zou et al. [26] conducted experimental research on the properties of UHPC steel composites and simulated the epoxy resin bonding interface using a cohesive element. The simulation results were in good agreement with the experimental findings. Jiang et al. [27] used finite element analysis to predict the performance of an epoxy resin adhesive-bonded UHPC-steel composite bridge deck and discussed the role of the bond interface in substituting for shear bonds. de Corte et al. [28] analyzed the shear damage of steel-UHPC interfaces bonded with epoxy adhesives through experiments and generalized fracture mechanics methods based on finite element analysis. Zhang et al. [29] proposed an energy-density-based failure criterion that directly relates critical stretch to mechanical strength. Jiang et al. [30] successfully simulated a prefabricated UHPC-steel epoxy bond interface using cohesive elements in ABAQUS software. This approach is followed in the present study to integrate the established constitutive models to investigate the structural behavior of UHPC-steel composites, employing non-mechanical interfacial connections.
The mechanical behavior of two typical interfaces without shear connectors, namely the sandblasted (SB) interface and the epoxy adhesive (EA) interface with sprinkled basalt aggregate, is investigated in this study. The constitutive models of these interfaces are established based on experimental measurements, which are further integrated into finite element simulations to analyze the mechanical behavior of the interfaces under complex stress states. The effectiveness of the models is validated with three-point bending tests of the steel-UHPC composite plates. The failure mechanisms, damage evolution patterns of the interfaces, and interfacial strength under complex stress states are discussed. The study is structured as follows: The push-out and pull-off tests of these two interfaces are presented in Section 2, which serves as the basis for establishing the interfacial constitutive models. The models are validated by simulation of the three-point bending tests in Section 3, followed by discussions in Section 4. Concluding remarks are drawn in Section 5.
2 Establishment of Interfacial Constitutive Models
Interface property tests were designed for the SB and EA interfaces to obtain an accurate constitutive model. Based on the pull-off and push-out test data, two traction-separation models were established to describe the constitutive behavior of the interfaces.
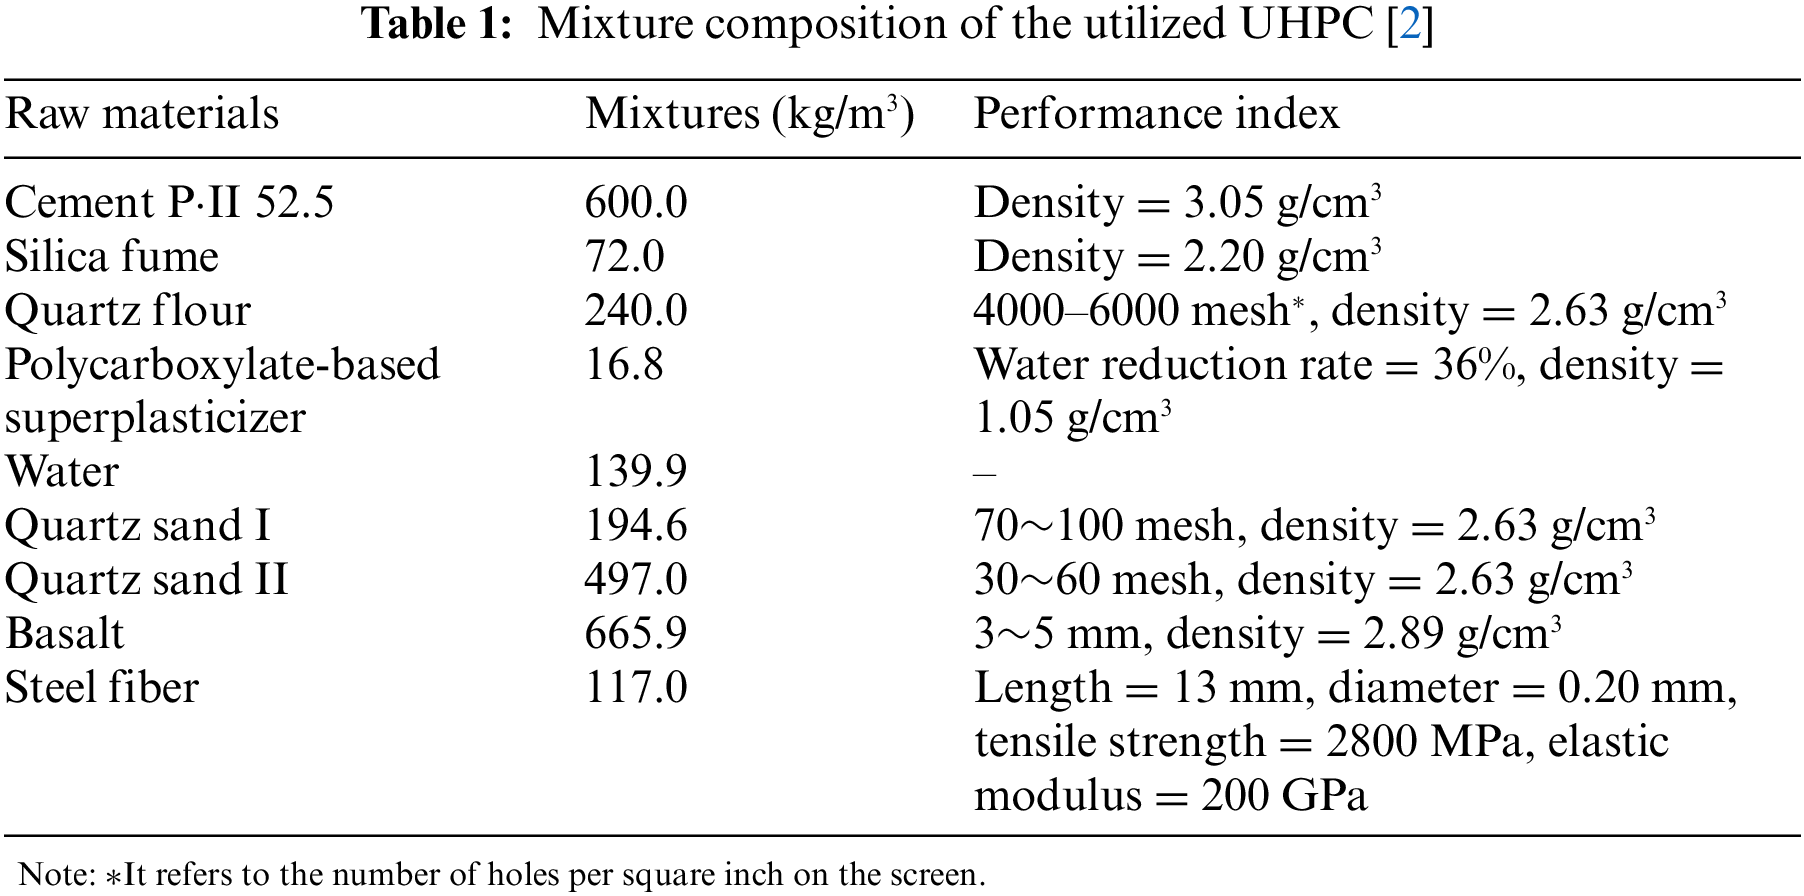
The composition of the UHPC reads as Table 1 [2]. Experimental results have demonstrated the notable mechanical properties of the UHPC formulated with this specific mixture. Its compressive strength (
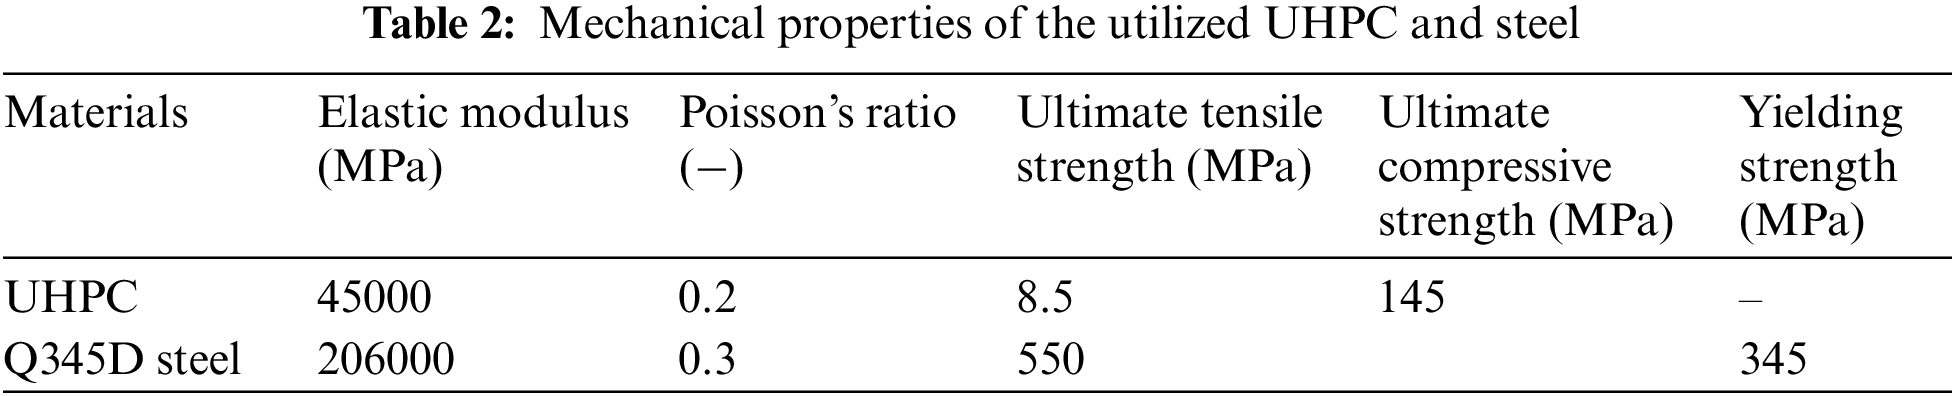
Regarding the steel plates employed in this study, they were fabricated from Q345D steel, per the specifications in GB/T 714 [31], which is equivalent to S355D steel as stipulated in ISO 630 [32]. Following the standard testing, the mechanical properties of the steel plates were determined as follows. The yielding strength (
Two types of non-mechanical steel-UHPC interfaces were considered, each involving bonding without shear studs. The first type involved a sandblasting treatment of the steel plate’s surface. A shot blasting machine propelled steel shots onto the smooth steel plate, creating a rough surface with an average depth of approximately 100 μm. This interfacial treatment is called the sandblasted interface, referred to as the SB interface, as shown in Fig. 1a. The second type involved the application of 0.7 kg/m2 of epoxy resin adhesive to the steel plate’s surface, followed by the sprinkling of basalt particles with a size range of 3–5 mm. This process resulted in the formation of an epoxy adhesive interface with sprinkled basalt aggregate, referred to as the EA interface, as shown in Fig. 1b.
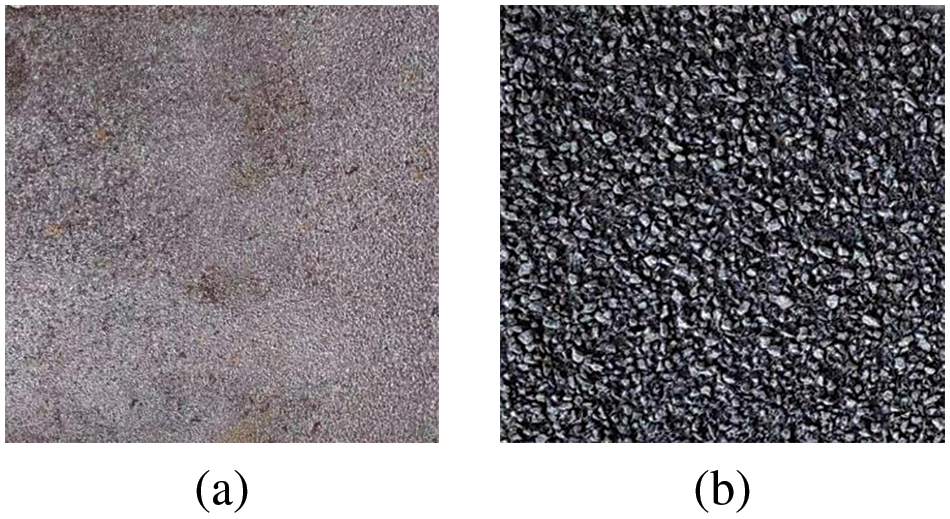
Figure 1: Interface treatment on steel plate: (a) SB interface; (b) EA interface
The mechanical performance of the SB and EA interfaces, under pure tensile and shear stress, was experimentally studied using pull-off and push-out tests, respectively. For each interface, six sets of pull-off tests and three sets of push-out tests were conducted. All specimens were cured for 28 days, with their surfaces kept moist by water sprinkling.
The testing setup for the pull-off tests is illustrated in Fig. 2, consisting of a 40 mm-thick UHPC layer and a 20 mm-thick steel plate. Six specimens, each with a diameter of 55 mm and a depth of 40 mm, were carefully extracted from the steel-UHPC composite plate after the SB and EA treatments of the interfaces. To ensure a strong connection between the samples and the loading instrument, a steel drawing disk with a diameter of 50 mm was securely attached to the upper surface of each drilled core sample with epoxy adhesive, as seen in Fig. 2. Tensile loading was applied at a constant rate of 40 kPa/s to the specimen until failure occurred. The ultimate load was then recorded for analysis.
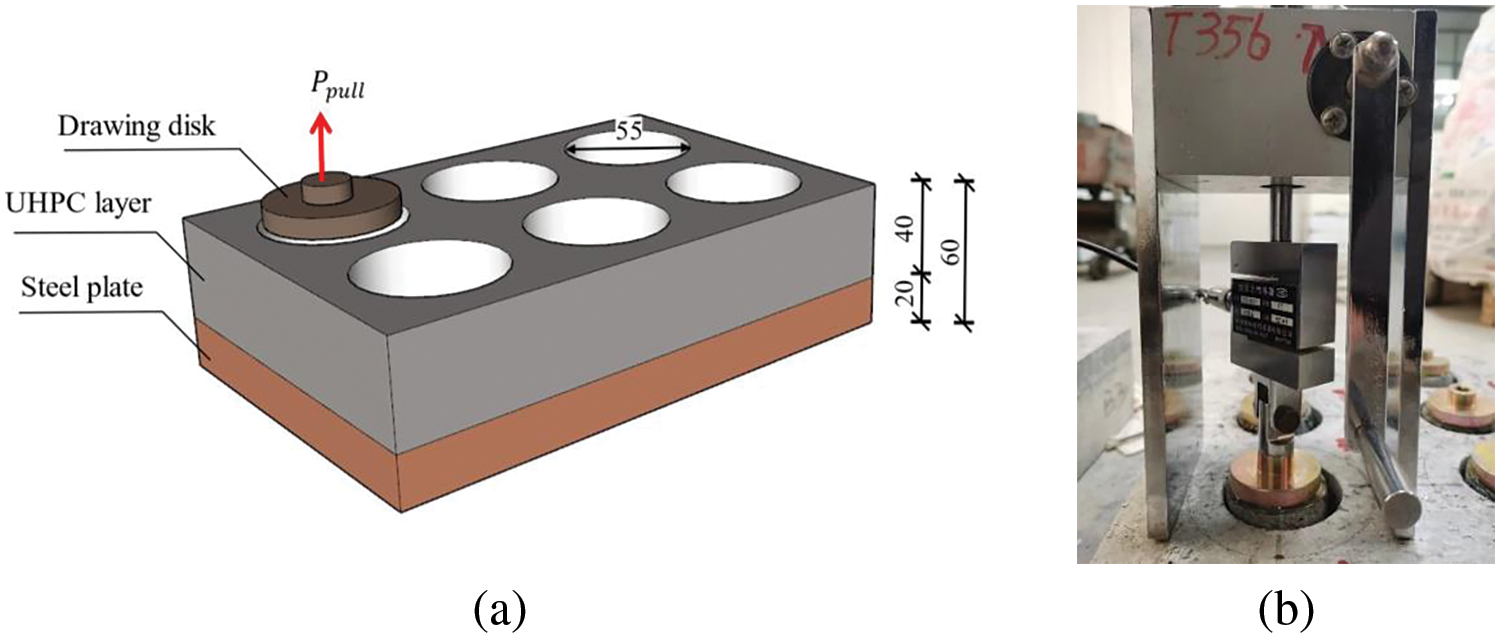
Figure 2: Testing setup for pull-off tests: (a) the schematic setup; (b) the actual setup [2]; unit: mm
The testing setup for the push-out tests is illustrated in Fig. 3, consisting of an I-steel beam and two UHPC layers. The I-beam had a width of 150 mm and a height of 320 mm. The UHPC layers on both sides of the beam were 60 mm thick, 290 mm wide, and 320 mm high. At the midpoint of the top surface of the I-beam, a 30-ton electro-hydraulic servo test system applied a pressure load. The loading process used a displacement loading control method, preloading and loading the specimen at a constant rate of 0.5 mm/min until failure. The relative slip between the steel member and UHPC was measured by four linear variable differential transformers (LVDTs), labeled D1-D4, strategically positioned on the specimen’s surface, as shown in Fig. 3. Throughout the loading process, the load and displacement were recorded at a frequency of 10 Hz.
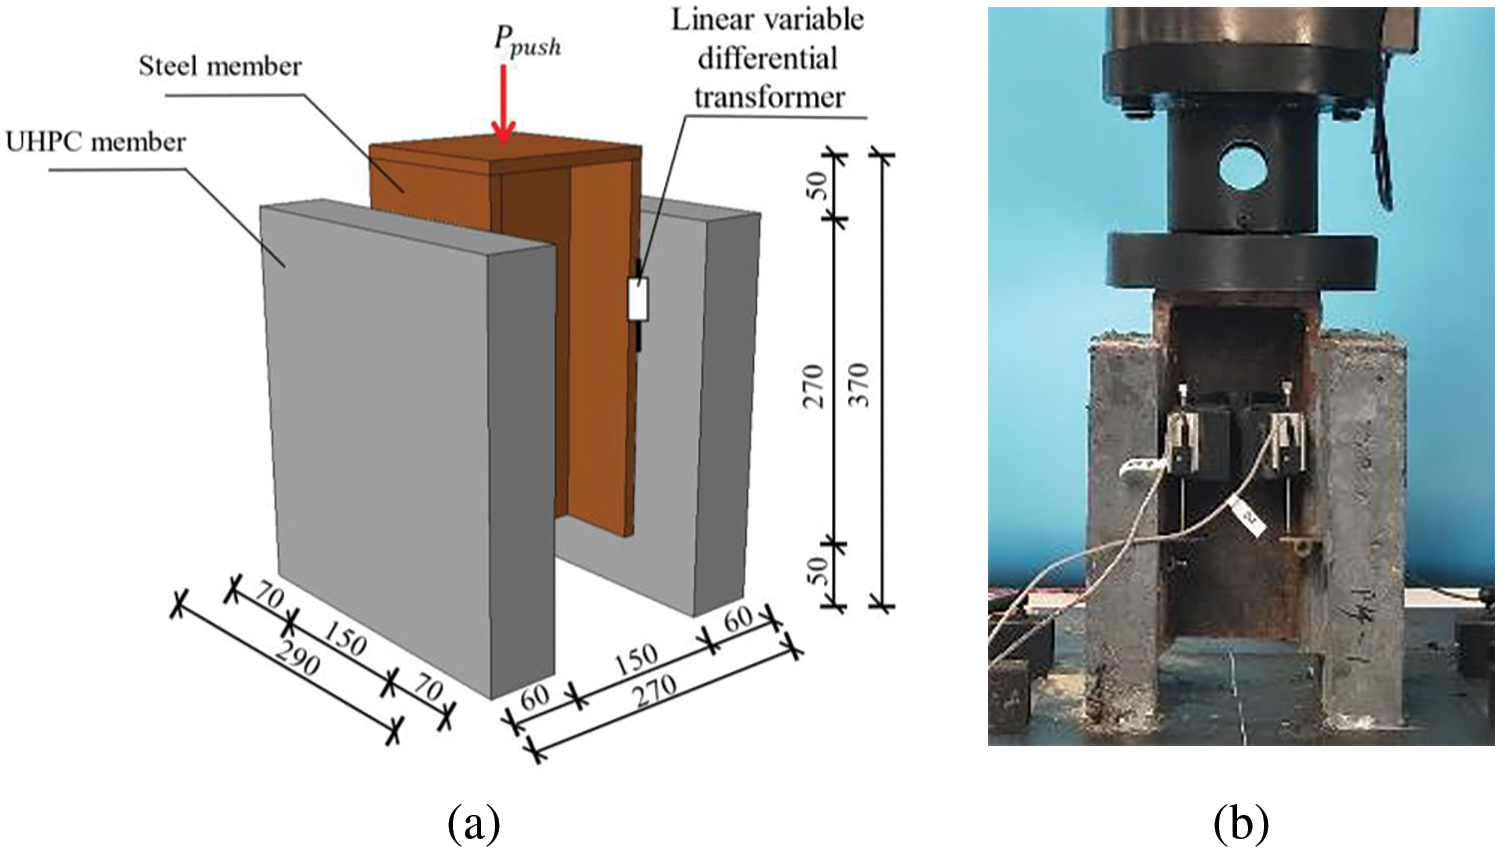
Figure 3: Testing setup for push-out test: (a) the schematic setup; (b) the actual setup [2]; unit: mm
During the pull-off test, failure can occur either at the drilled UHPC core sample or at the steel-UHPC interface. If the tensile strength of the interface is higher than that of the UHPC, failure will occur at the drilled UHPC core sample and vice versa. The results indicated that the failure mode for both interface treatments primarily occurs at the steel-UHPC interface, representing the most vulnerable component within the steel-UHPC composite structure. The nominal bond strength or interfacial cohesion,
where
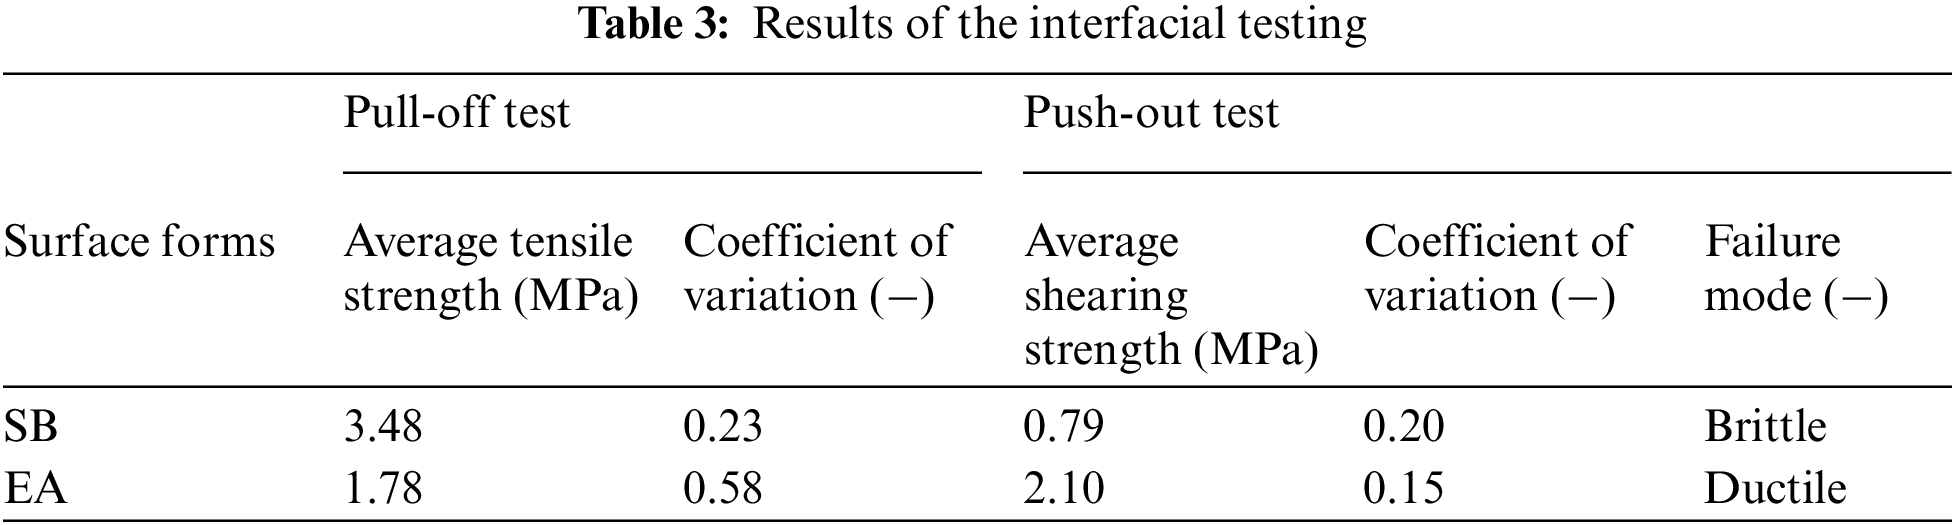
The load-slip curves for the steel-UHPC interface, derived from push-out tests, are depicted in Fig. 4. These experimental results reveal distinct behaviors between the SB and EA-treated interfaces. Specifically, the SB interface exhibits a brittle failure mode, characterized by a rapid decrease in load capacity after reaching its peak, with a relatively small interface slip. In contrast, the EA interface exhibits a ductile failure mode, characterized by significant slip at the interface upon failure. As loading progresses, the EA interface experiences gradual and slow slip. After reaching the maximum load, the slip continues to develop while the load capacity gradually decreases until ultimate failure. The average shearing strength,
where
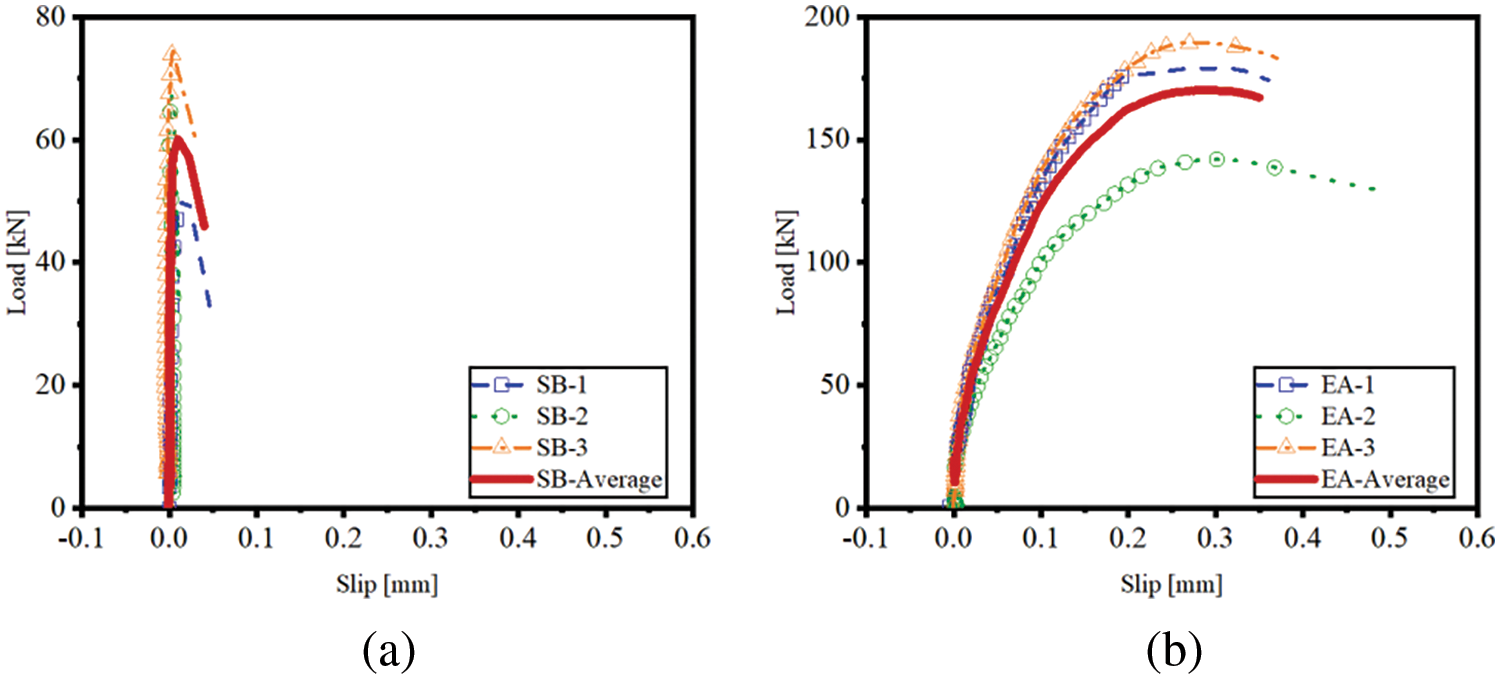
Figure 4: Load-slip curve of the push-out testing: (a) SB specimen; (b) EA specimen [2]
2.2 Interfacial Constitutive Models
The results from the pull-off and push-out tests aid in establishing the constitutive relations for the SB and EA interfaces. The traction-separation model, which includes bilinear, exponential, trapezoidal, and other types, is commonly used to describe interface fractures [33,34]. Reflecting on the characteristics of the load-slip curves for the SB and EA interfaces, they are modeled by a bilinear and a trapezoidal traction-separation model, respectively, as depicted in Fig. 5.
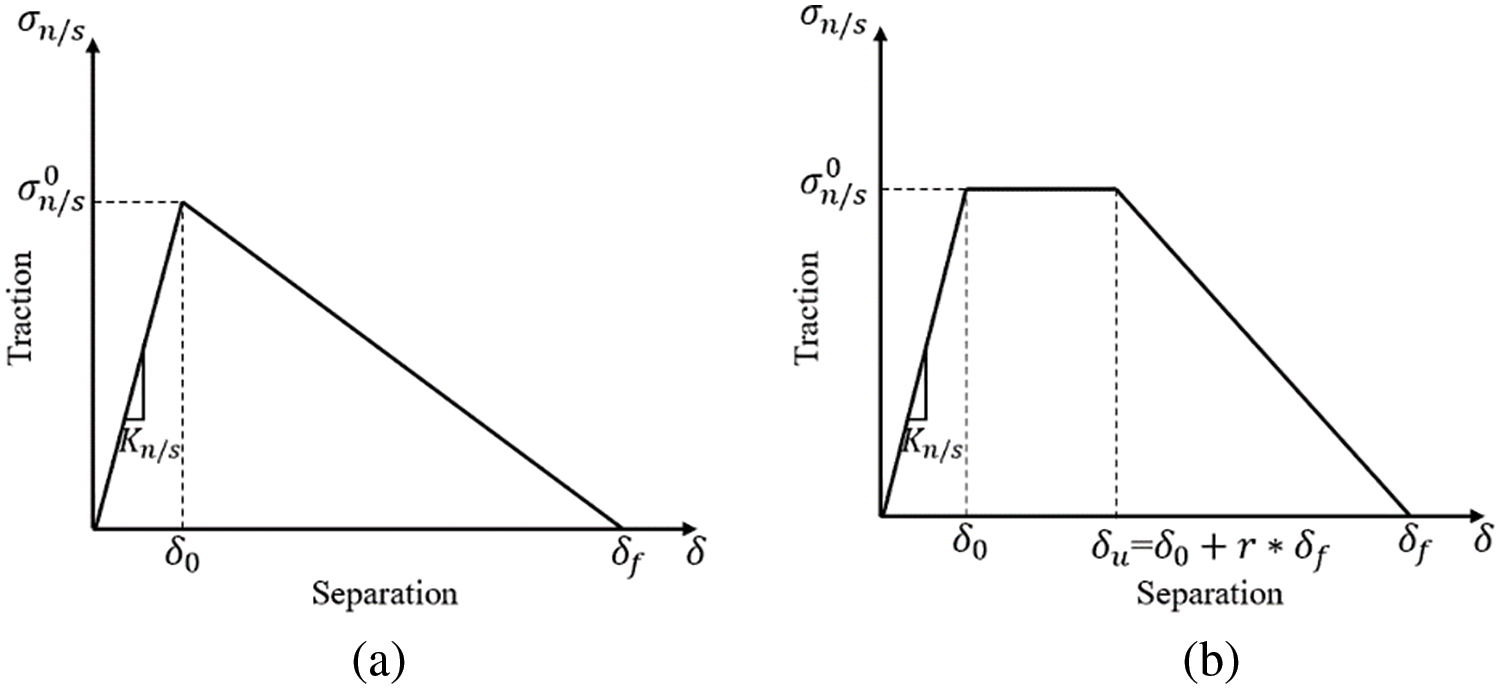
Figure 5: Interfacial constitutive models: (a) the bilinear traction-separation model for the SB interface and (b) the trapezoidal traction-separation model for the EA interface
Regarding the SB interface, an increasing load leads to a relatively small slip between the steel and UHPC interfaces, as indicated by the steep linear rise of the load-slip curve in Fig. 5a. Upon reaching the peak, the load quickly decreases with increasing slip. Thus, the constitutive behavior of the SB interface can be divided into two phases: the elastic phase and the failure phase. During the elastic phase, the interface remains intact, but it swiftly transitions to the failure phase after reaching the ultimate load, significantly reducing load-bearing capacity. The following constitutive model describes this behavior.
where
The test results clearly indicate the EA interface’s ductile mechanical behavior. Upon reaching the maximum load, the interface does not fail abruptly but continues slipping and gradually reduces its load-carrying capacity until final failure. Therefore, the constitutive behavior of the EA interface can be described by a trapezoidal traction-separation model consisting of the elastic, plastic, and failure phases. The plastic phase ensures the interface does not immediately enter the failure phase upon reaching its maximum load-bearing capacity. The constitutive model is expressed as follows:
where
2.2.2 Parameters Identification
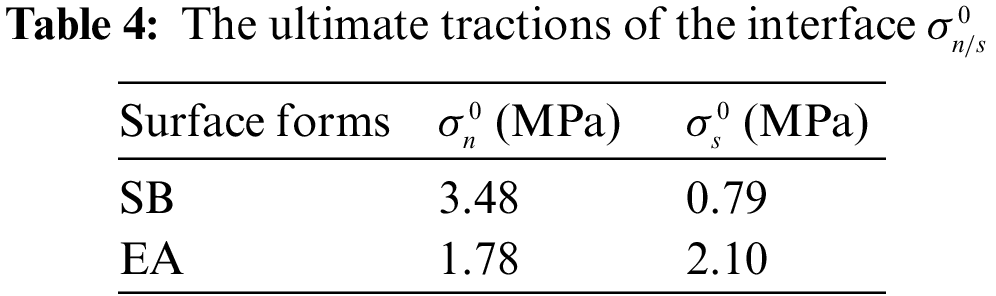
In the traction-separation model, the ultimate tractions of the interface,
The trapezoidal shape parameter,
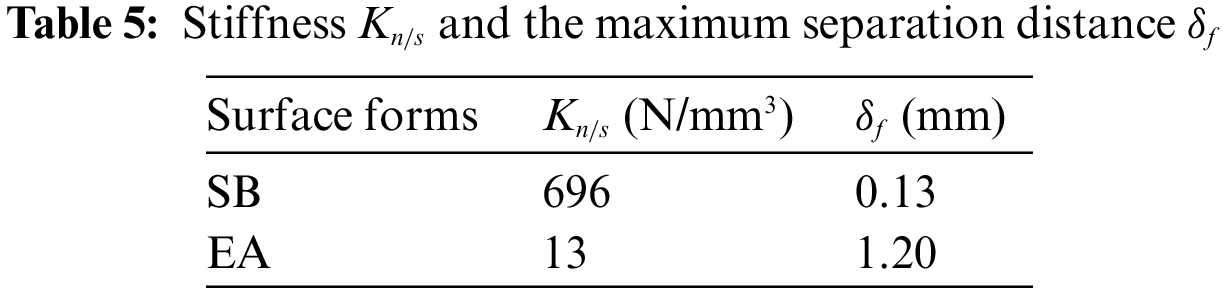
The stiffness
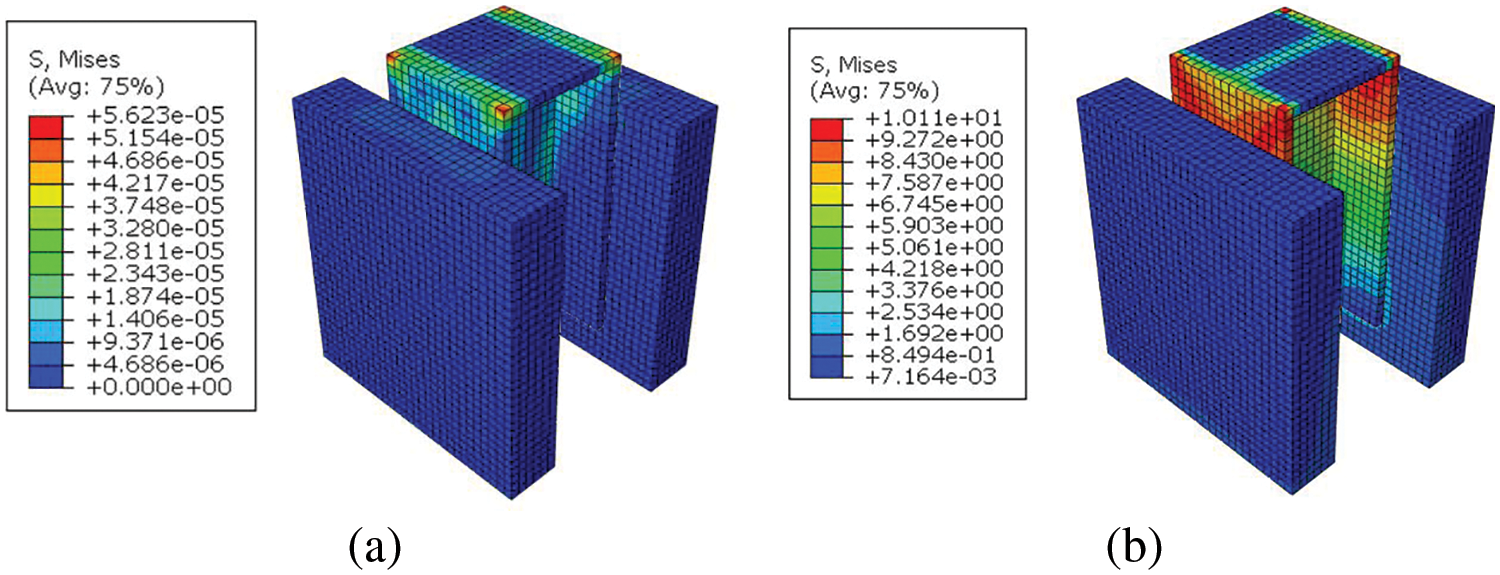
Figure 6: Mises stress cloud of the push-out FE model: (a) SB interface; (b) EA interface
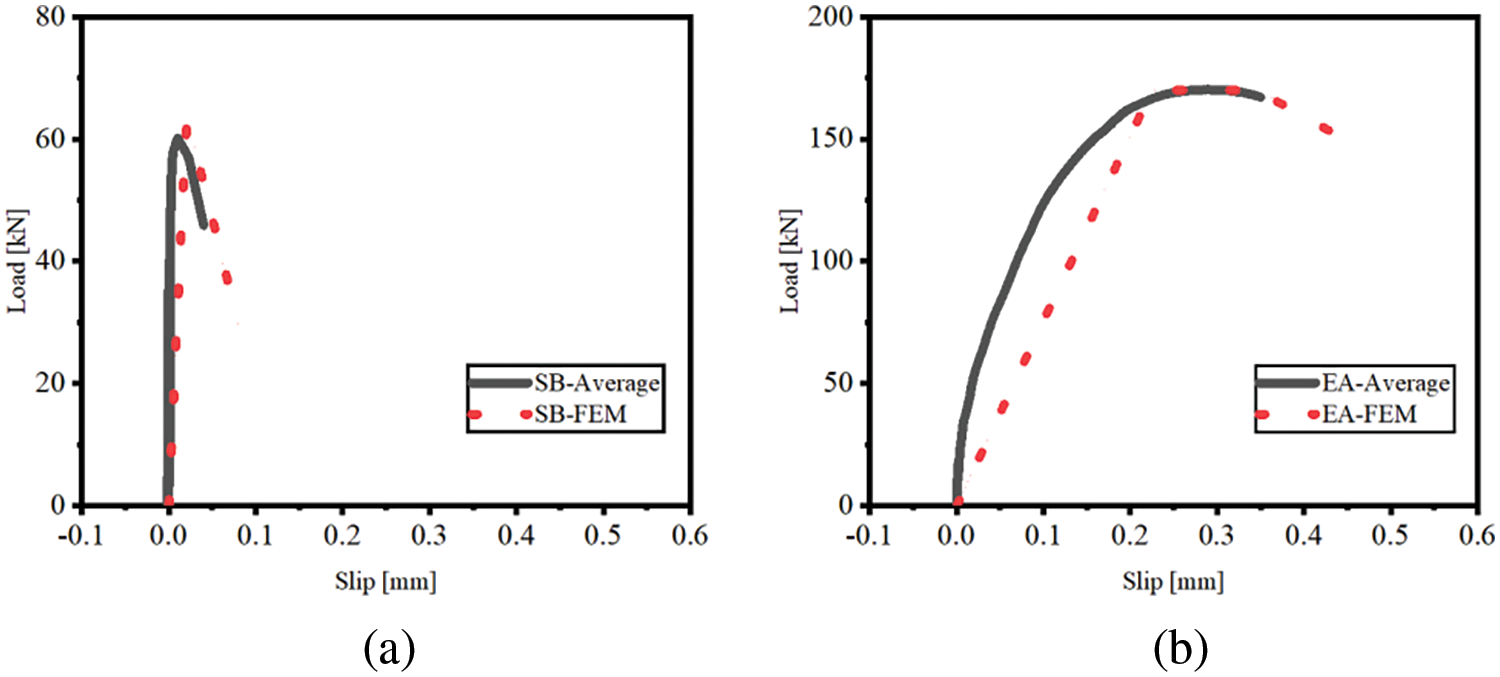
Figure 7: Comparison of the load-slip curves of the push-out tests between experimental measures and finite element simulations: (a) SB interface; (b) EA interface
In order to validate the developed interface constitutive models, a three-point bending test on a steel-UHPC composite plate was performed, followed by a comparison with numerical simulations based on the established constitutive relation.
The three-point bending test was conducted on a steel-UHPC composite plate, illustrated in Fig. 8a. The specimen consisted of a 60 mm-thick UHPC overlay and a 10 mm-thick steel plate with specific surface treatments, forming the SB interface and EA interface. Its geometric dimensions were 800 mm in length, 150 mm in width, and 70 mm in thickness. The same UHPC and steel materials used in the interfacial testing were employed.
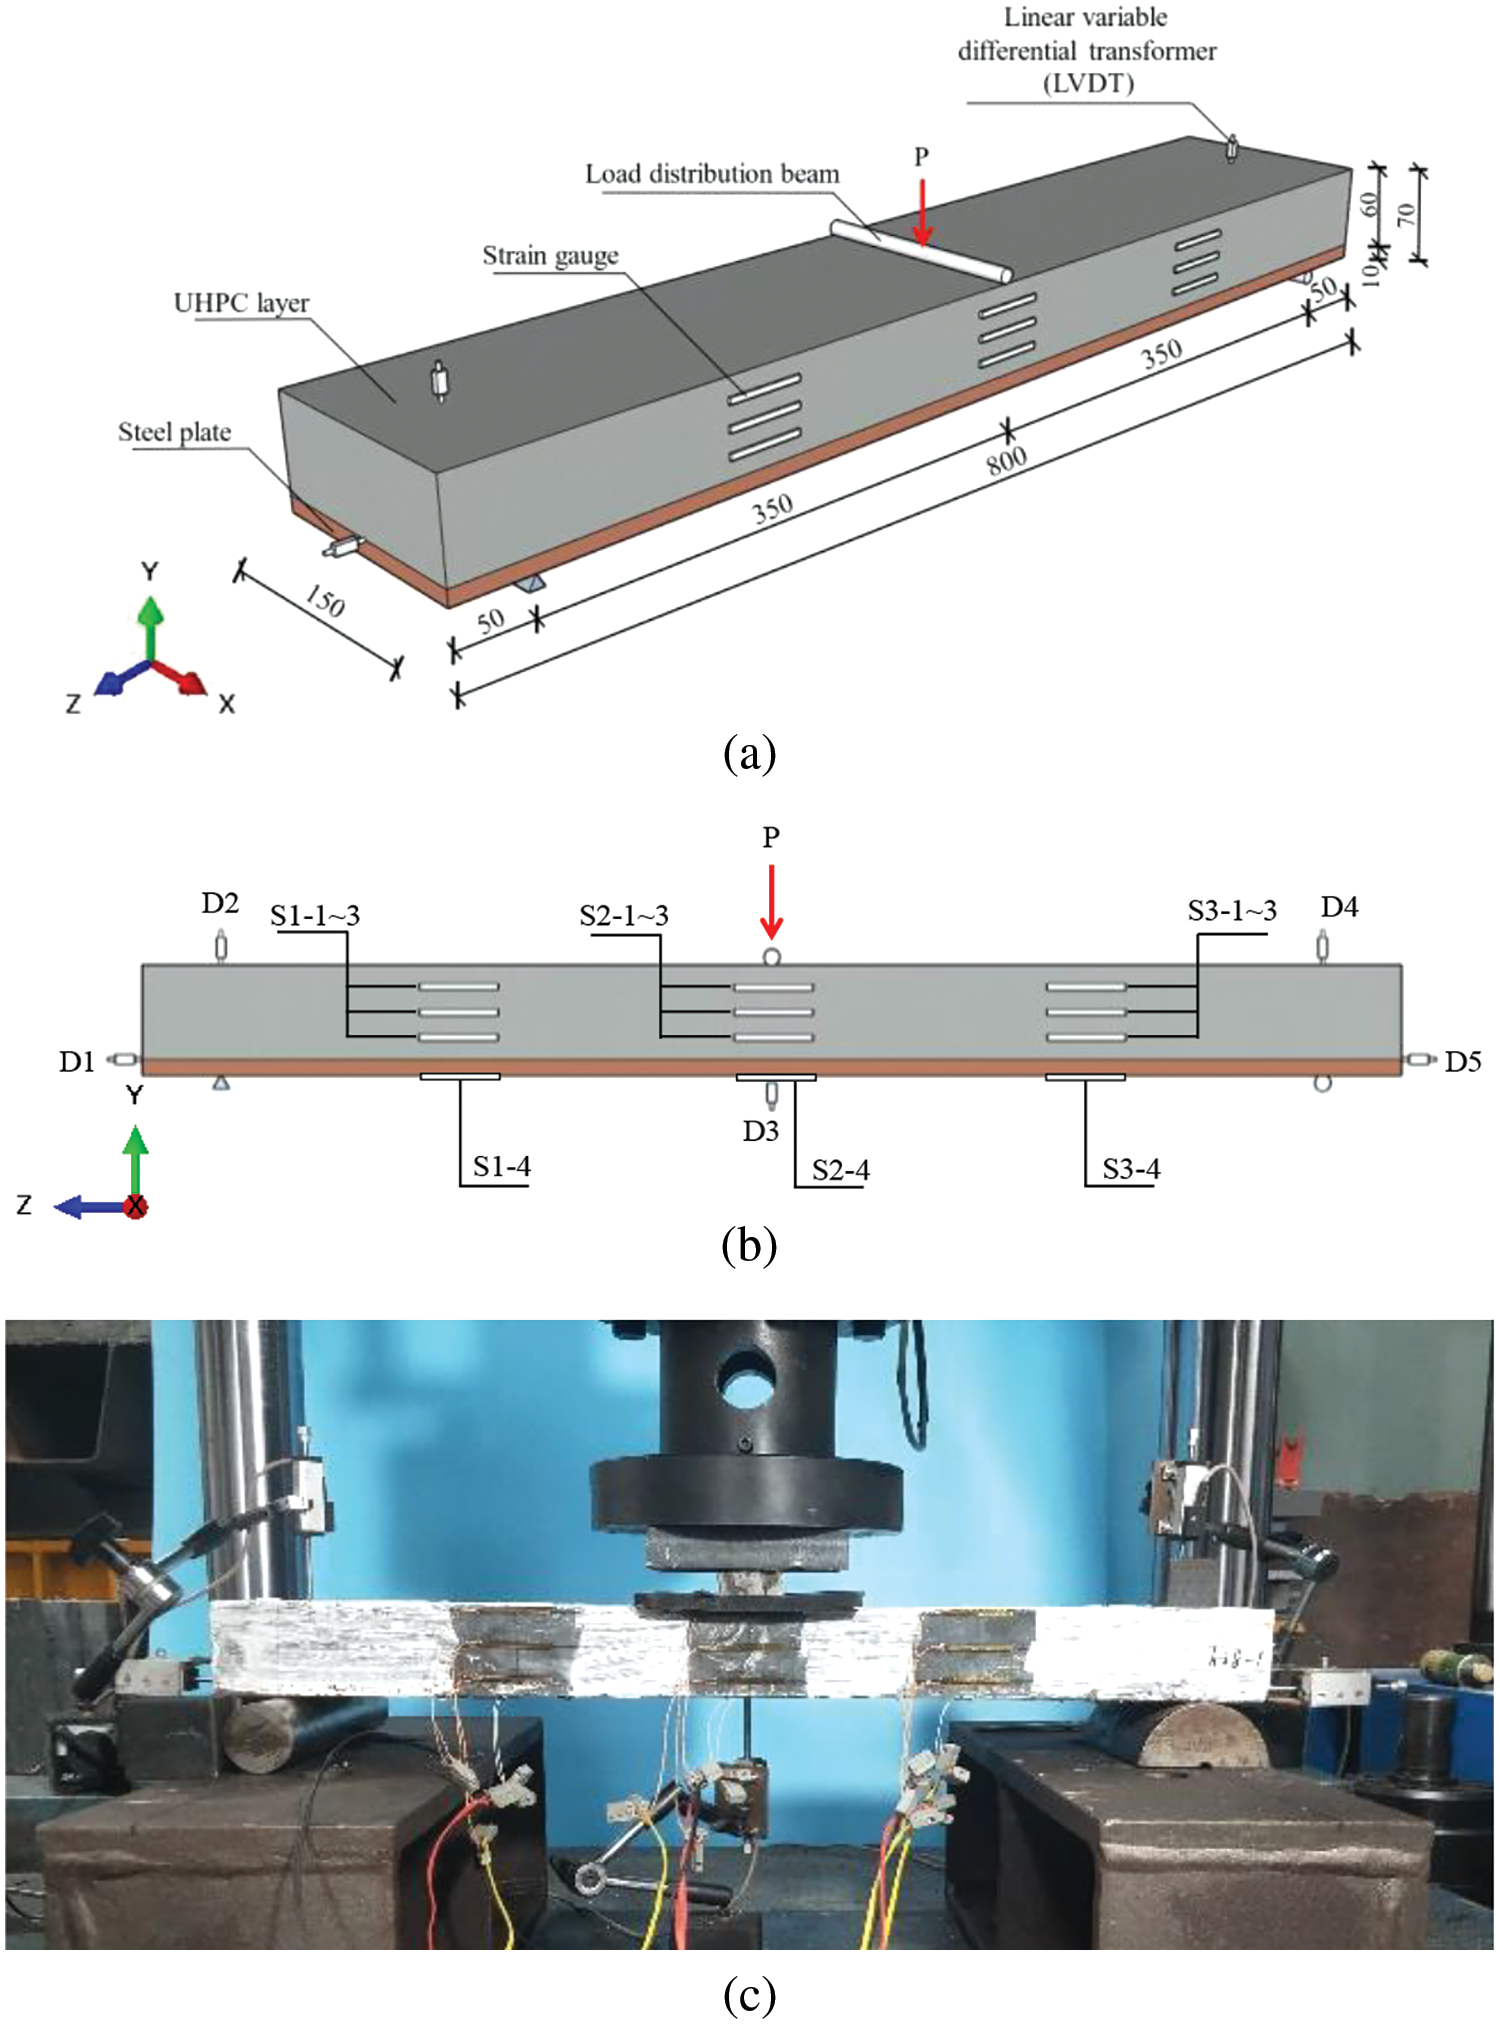
Figure 8: Testing setup for three-point bending tests: (a) the schematic setup; (b) the measurements; (c) the actual setup [2]; unit: mm
For measuring the deflection and strain of the steel-UHPC composite plate during loading, a total of 5 LVDTs and 12 strain gauges were installed on the specimen, as illustrated in Fig. 8b. The LVDTs, labeled D1 to D5, were positioned as follows: D2 and D4 at the top of the supports and D3 at the middle span to monitor deflections during loading. D1 and D5 were placed at the specimen’s extremities to measure interfacial slip. Strain gauges installed at the 1/4 span, 1/2 span, and 3/4 span of the plate were denoted as S1-1 to S1-4, S2-1 to S2-4, and S3-1 to S3-4, respectively. Notably, strain gauges labeled 1, 2, and 3 were positioned on the UHPC layer, while those labeled 4 were placed on the bottom surface of the steel plate.
The setup of the three-point bending test for the steel-UHPC composite plate is depicted in Fig. 8c. The specimen was simply supported at its extremities. The point load was applied using a rigid load distribution beam to achieve uniform stress along the x-direction of the plate. Following preloading, the specimen was loaded using a 30-ton electro-hydraulic servo testing system at a constant speed of 0.5 mm/min until final failure. Throughout the loading process, both the applied load and displacement were recorded at a sampling frequency of 10 Hz.
3.2 Finite Element Simulations
The commercial software Abaqus FEA [39] was utilized for finite element simulations. The steel plate and the UHPC layer were simulated using the three-dimensional stress 8-node linear brick element, referred to as “C3D8R” in Abaqus. For the interface between the steel plate and the UHPC, the cohesive element “COH3D8” was used, which was tied to both the steel plate and the UHPC layer. A convergence study and a trade-off between simulation accuracy and computational effort resulted in the characteristic size of the finite elements being set to 10 mm, as shown in Fig. 9 for the finite element mesh. The mechanical properties of the steel plate, the UHPC, and the interfacial zone were defined as follows:
(1) Steel
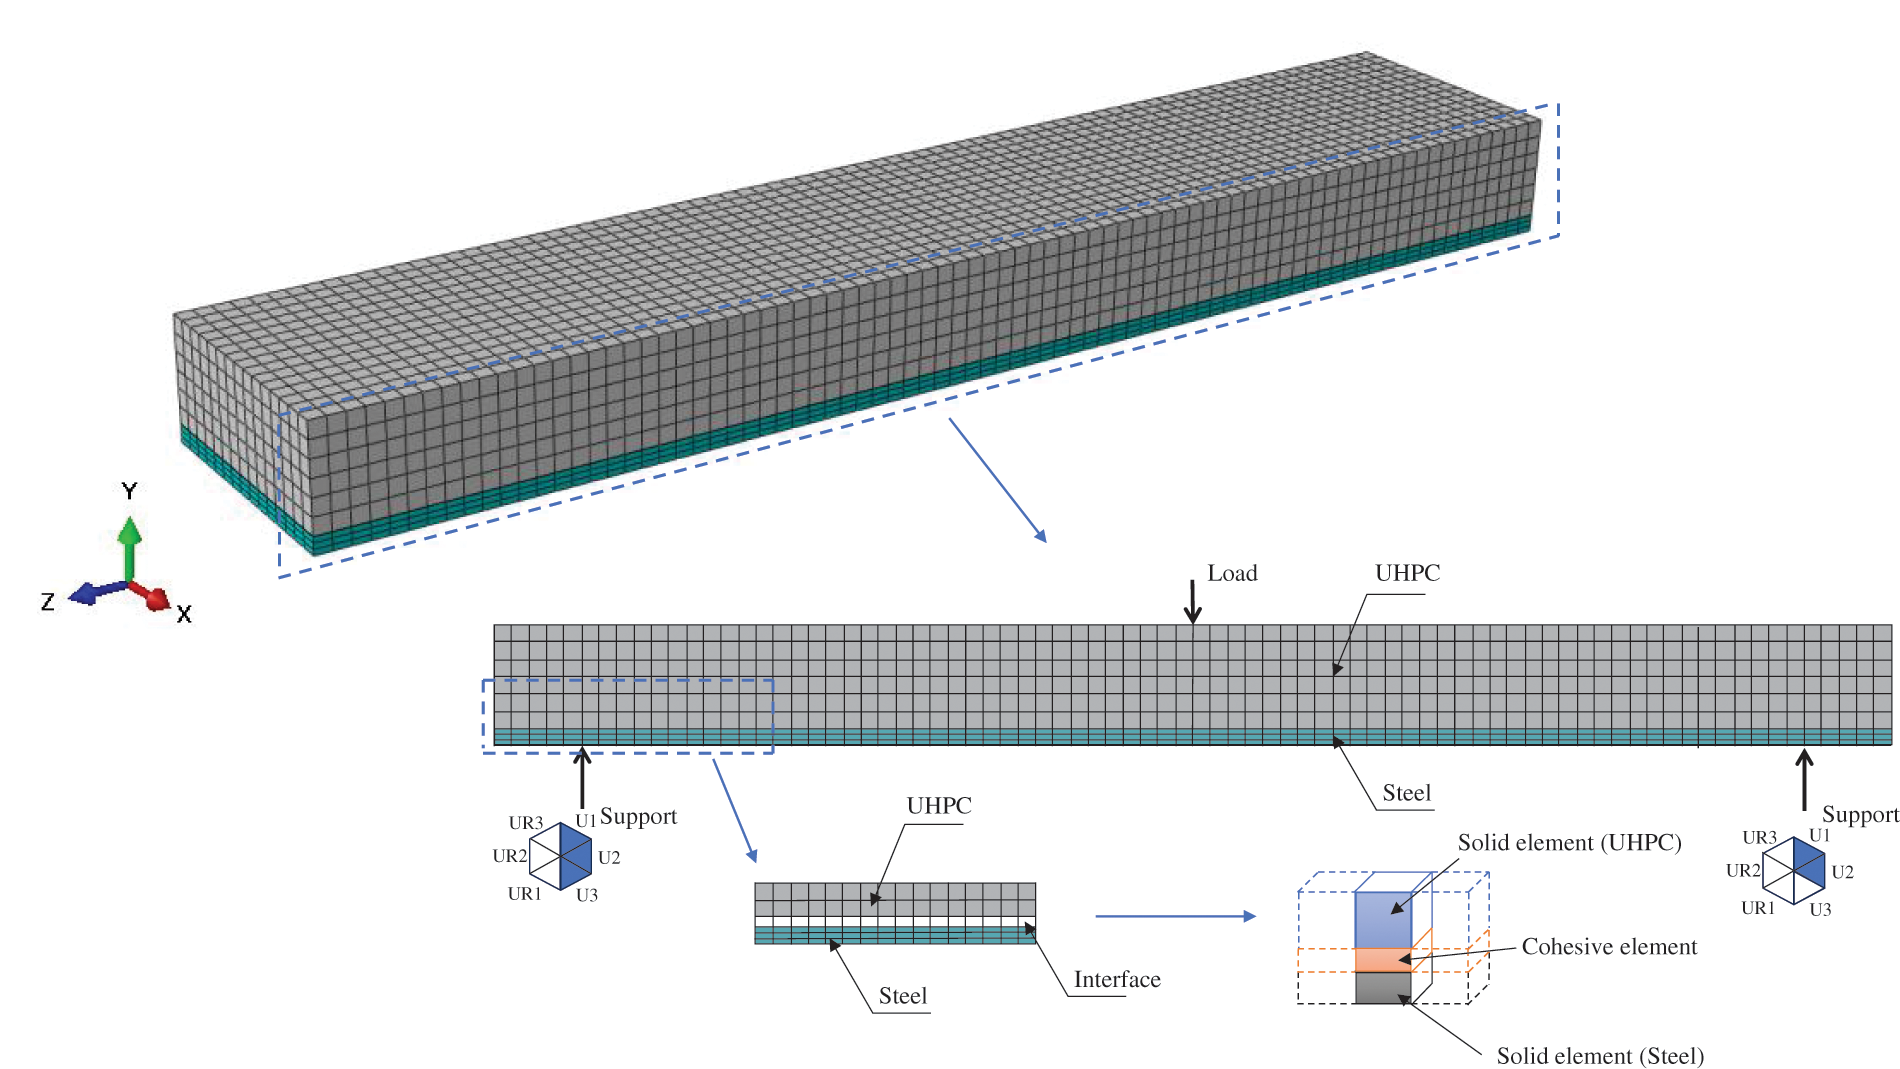
Figure 9: Three-dimensional finite element model of the analyzed three-point bending test specimen
Considering the strengthening behavior of the steel plate material beyond the yielding stress, an elastoplastic bilinear model was employed to simulate its constitutive behavior.
Following the experimental results of Table 2, the yield strength is taken as
(2) UHPC
The constitutive model of the UHPC follows the model in [40] for compression and the model in [41] for tension, as shown in the stress-strain relations of Eqs. (6) and (7), respectively.
where
The stress-strain curves of UHPC are transformed into the stress-inelastic strain relation, as defined by the concrete damage plasticity (CDP) model in ABAQUS [39]. The inelastic strains in case of compression and tension are quantified as follows:
This allows quantifying the damage parameters in the CDP model.
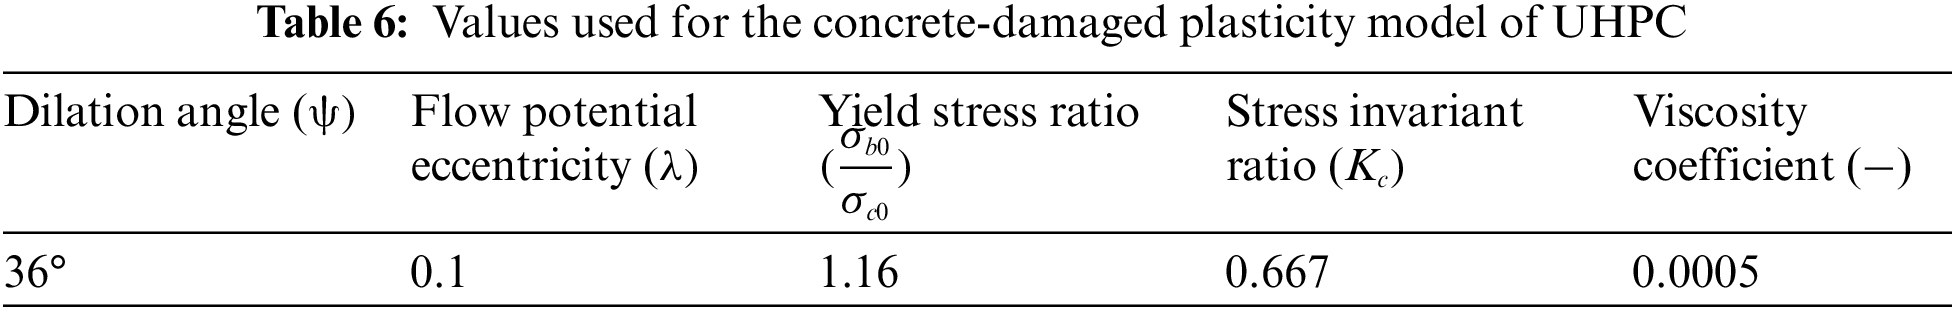
Calibrating the compressive and tensile damage, respectively. In the context of the CDP model, it is necessary to define five additional parameters: the dilatation angle, flow potential eccentricity, the biaxial compressive yield stress ratio to uniaxial compressive yield stress, the ratio of the second stress invariant on the tension meridian to that on the compression meridian, and the viscosity coefficient. These parameters are defined following those of the same UHPC utilized in this work [42], as seen in Table 6.
(3) Interface model
In the finite element simulations, the interface between the UHPC and the steel plate is simulated by establishing a cohesive interface element with zero thickness. The cohesive interfacial elements were generated by offsetting from the surface mesh of the steel plate, and the other side of the cohesive interface element naturally forms common node constraints with those of the steel plate surface. Thus, the mesh sizes of the cohesive interfacial elements are consistent with those of the steel plate mesh, as detailed in Fig. 9.
The maximum stress criterion is adopted as the failure criterion for cohesive elements, indicating that damage initiates when the stress in any direction reaches the predefined stress limit. The interface is completely damaged once the maximum separation distance is reached, representing its final failure.
For calibration of the damage extent of the interface, the damage variable is introduced, representing the ratio of stress loss caused by interface damage to the undamaged stress of the interface. Its value ranges from 0 to 1, indicating the development of the interface from intact condition to complete damage. For the UHPC-sandblasted steel plate (SB) interface, the interface remains undamaged when
The corresponding damage coefficient at this stage is defined as follows:
When
As for the epoxy adhesive (EA) interface with sprinkled basalt aggregate, the interface remains undamaged when
This leads to the damage coefficient defined below:
When
This results in the damage coefficient as follows:
When the slip value exceeds the maximum separation distance, i.e.,
3.3 Comparison between Experimental and Numerical Results
3.3.1 Experimental Results of Three-Point Bending Test
In three-point bending tests, composite plates with SB and EA interfaces exhibit a similar mode of longitudinal shear failure along the interface. The applied load leads to gradual sliding and separation of the UHPC overlay from the steel plate. At the stage of ultimate failure, the collaborative action between the UHPC and steel plates is lost, resulting in significant bending deformation and bending failure.
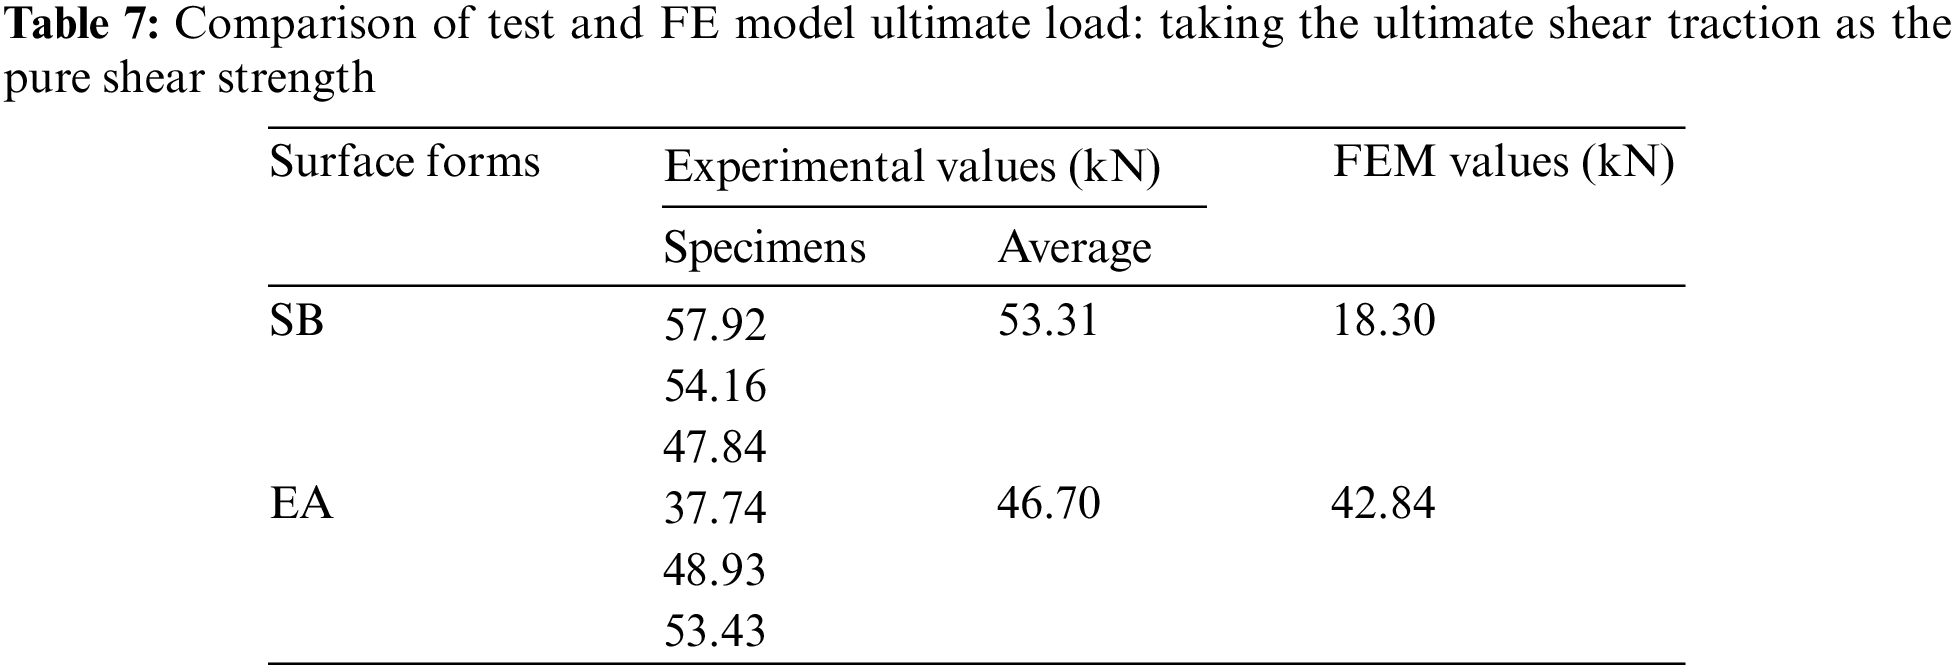
However, the load-deflection curves of these two composite plates differ, as shown in Fig. 10. For the SB specimens, the deflection increases linearly with the applied load, and interfacial sliding is insignificant before the final failure. Correspondingly, no evident signs of damage manifest during this stage. As the peak load approaches, minor interfacial dislocations appear within the range of 1/4 to 3/4 of the plate span, followed by slight bending cracks. Simultaneously, interface fracture emerges, leading to an abrupt loss of bearing capacity, accompanied by a significant sound. The average ultimate load of the composite plate using the SB interface is 53.31 kN. For the EA specimens, the load-deflection curve is almost linear during the initial stage. Upon reaching the ultimate stage, interfacial dislocations and obliquely oriented bending-shear cracks arise at around 3/8 span of the specimen. These cracks propagate from the bottom to the top of the UHPC layer, decreasing specimen stiffness. As the ultimate load stage is reached, the specimen loses its load-bearing capacity and eventually fails. The average ultimate load-bearing capacity of components using the EA interface is 46.70 kN.
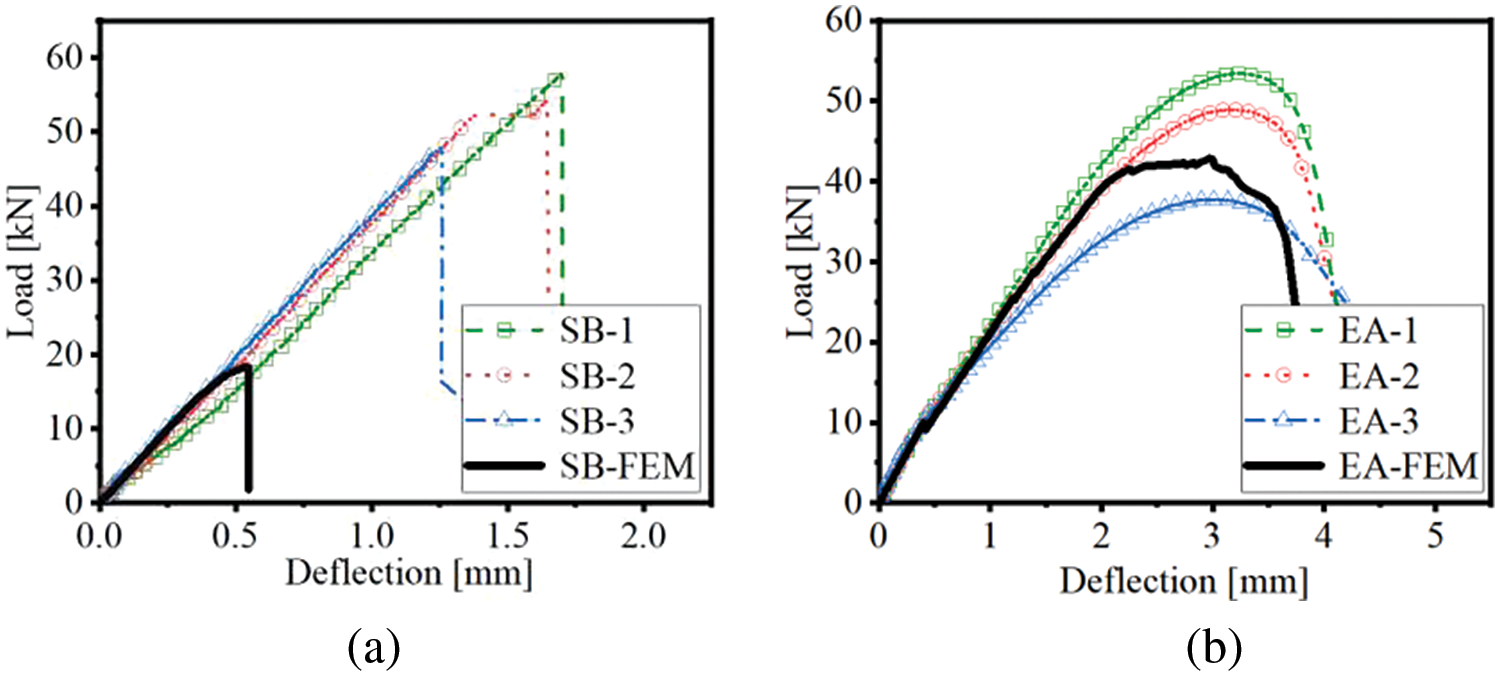
Figure 10: Comparison of the experimentally-measured [2] load-deflection curves of the three-point bending tests of the steel-UHPC plate with the FE simulations by taking the ultimate shear traction as the pure shear strength: (a) SB interface; (b) EA interface
3.3.2 Taking the Ultimate Shear Traction as the Pure Shear Strength
During the simulation of the steel-UHPC interface, the experimentally derived interface pure shear strength was used as the value for the interface model
The experimentally measured pure shear strength was taken as the ultimate shear traction of the interface in the numerical simulations, that is
3.3.3 Taking the Ultimate Shear Traction as the Improved Shear Strength
The results of the preceding section indicate that taking the experimentally measured pure shear strength as the ultimate shear traction of the interface underestimates the bearing capacity of the steel-UHPC composite plate. This discrepancy is attributed to the normal stresses acting on the interface during the three-point bending test, which leads to an improvement in the ultimate shear strength of the interface [43–45], as indicated by an increase in the shear strength of the polymer-modified asphalt interface by 2–3.5 times due to the contribution of normal stress [46]. The Mohr-Coulomb strength theory is recalled for the quantitative determination of this improvement [47,48].
where
An iterative method, combined with the Mohr-Coulomb strength theory, was established to determine the improved shear strength of the interface subjected to complex stress states and, thus, the bearing capacity of the composite plates, as shown in Fig. 11. The experimentally measured pure shear strength, i.e., the normal cohesion
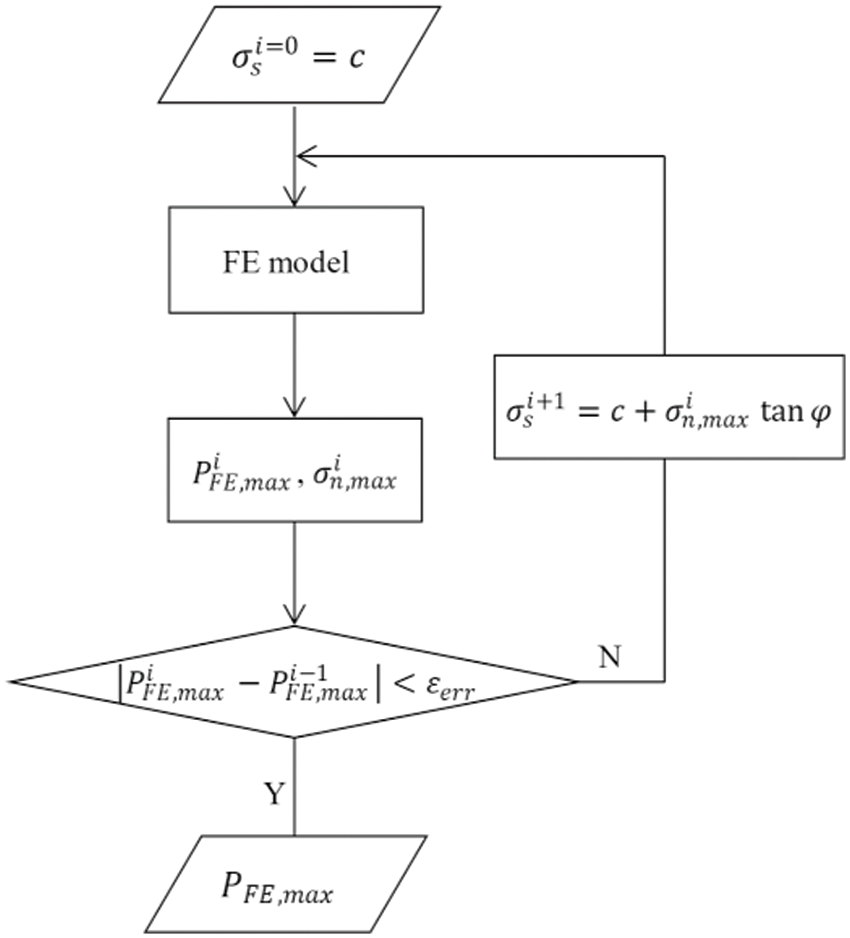
Figure 11: The iterative process for determination of the improved shear strength of the interface and the bearing capacity of the steel-UHPC plate
In this investigation, the critical error was set to
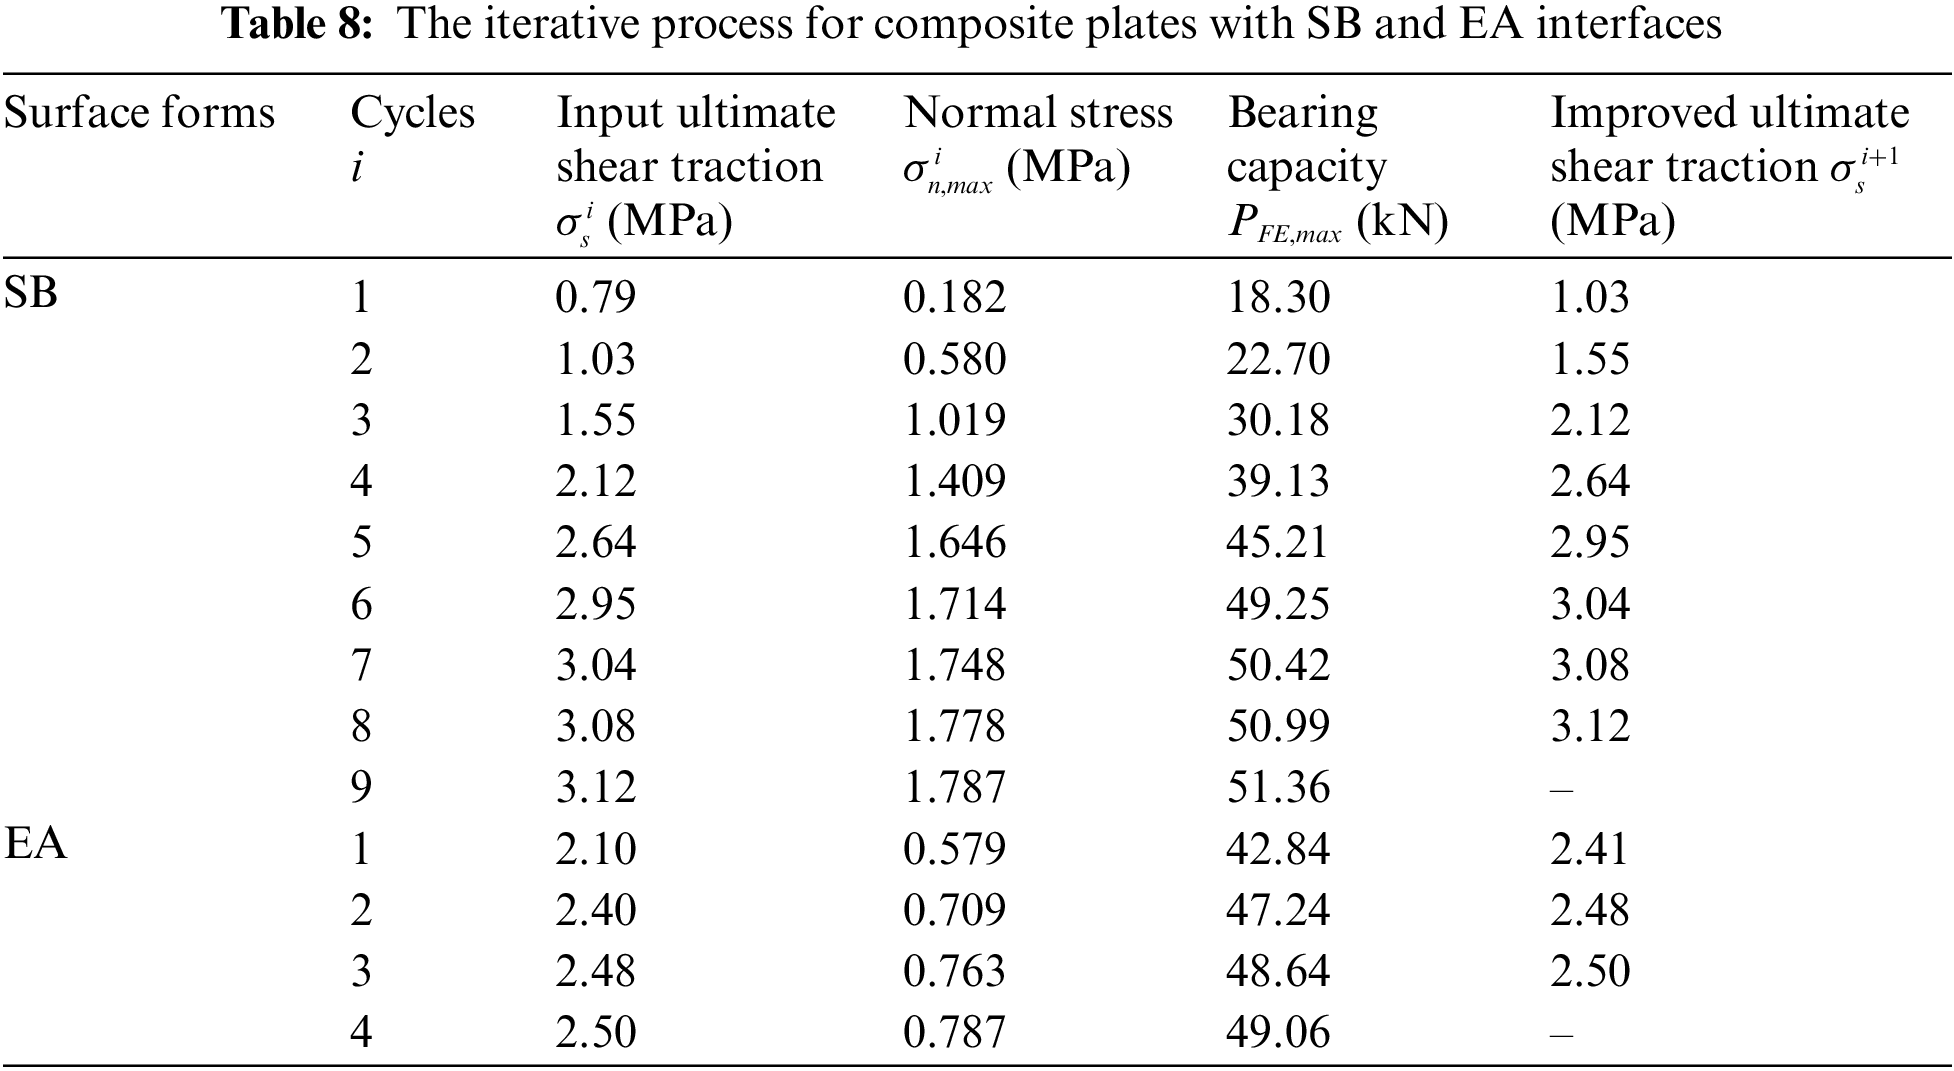
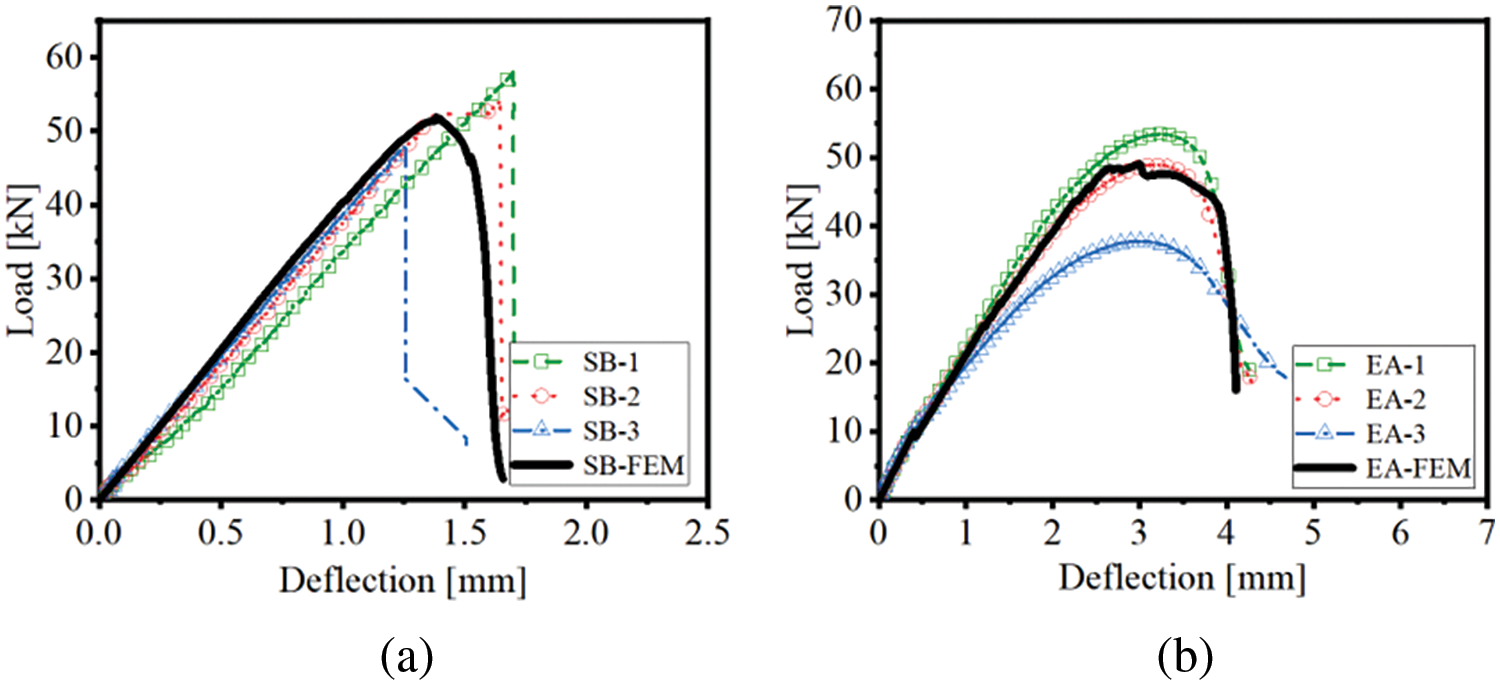
Figure 12: Comparison of the experimentally-measured [2] load-deflection curves of the three-point bending tests of the steel-UHPC plate with the FE simulations by taking the ultimate shear traction as the improved shear strength: (a) SB interface; (b) EA interface
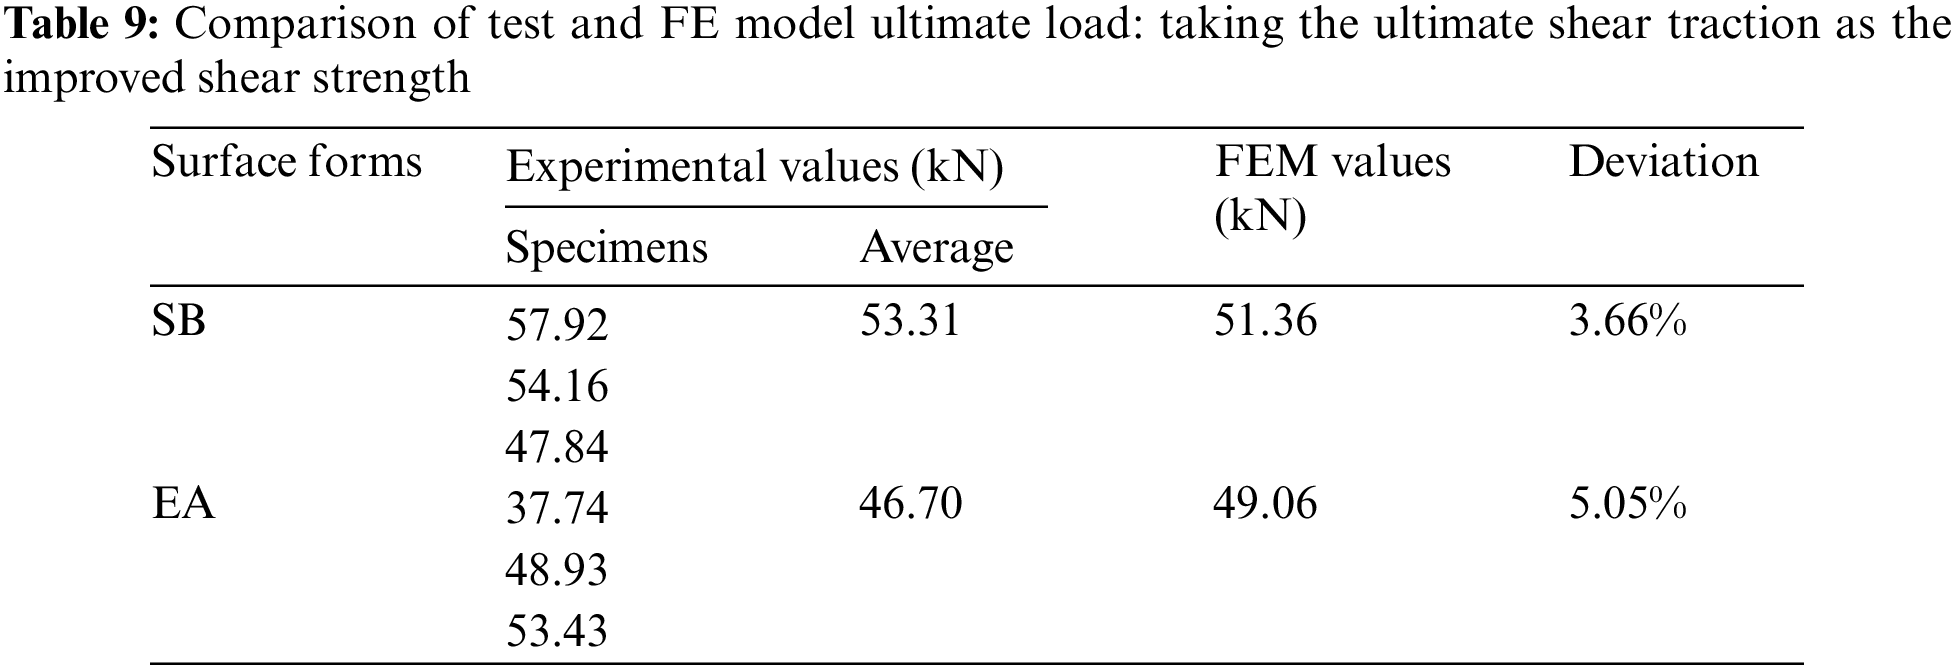
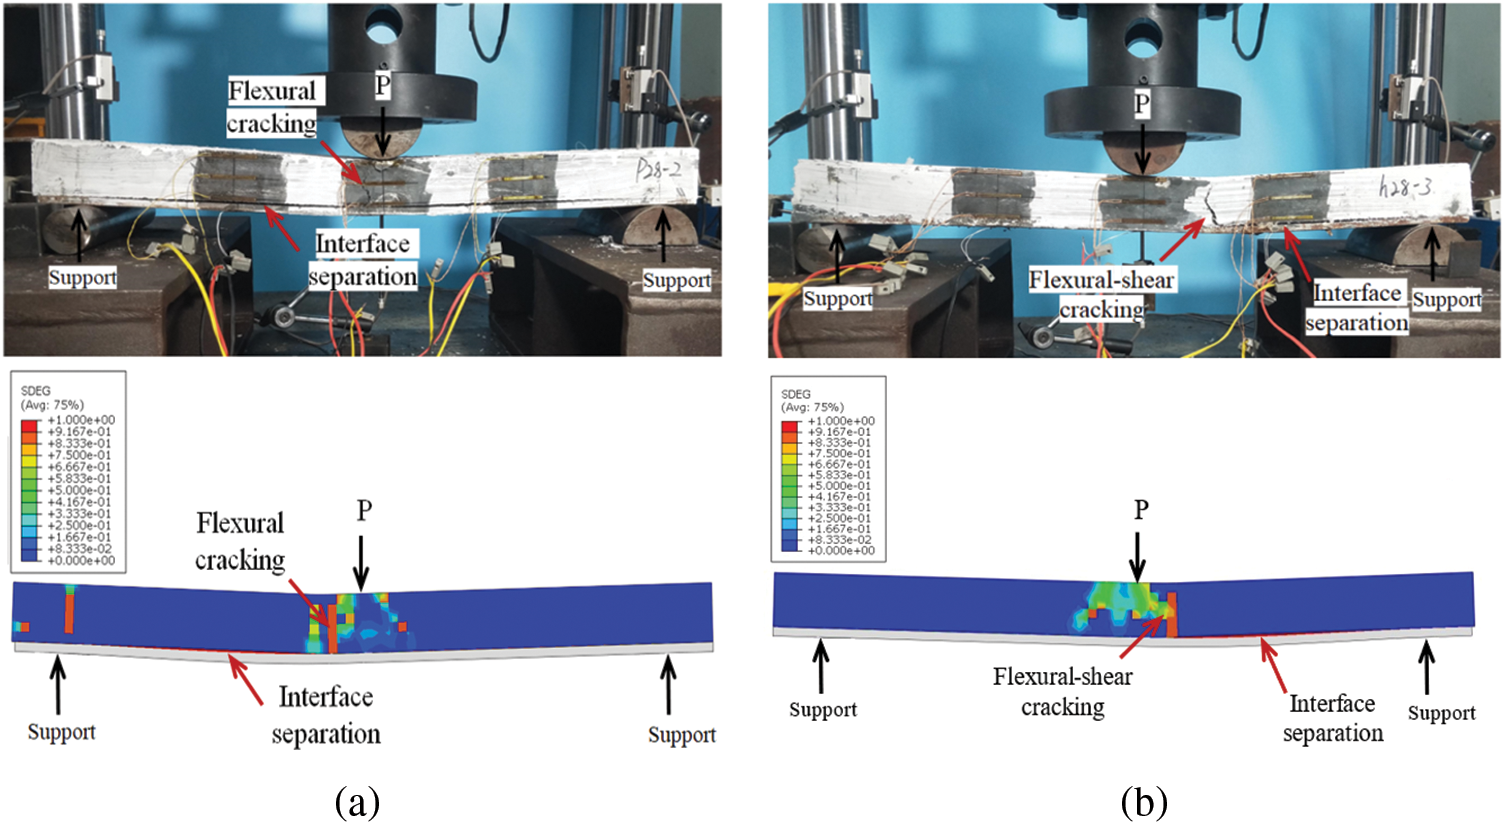
Figure 13: Comparison of the experimentally-measured [2] final failure patterns of the three-point bending tests of the steel-UHPC plate with the FE simulations: (a) SB interface; (b) EA interface
4.1 Evolution of Interface Damage
The scalar stiffness degradation (SDEG) is utilized to calibrate the damage extent of the interface [51], as shown in Figs. 14a and 14b. With SDEG equal to 1, the cohesive element is fully damaged [52]. Shear damage occurs on both sides of the interface as the loading increases. This is due to the deformation compatibility between the UHPC layer and the steel plate. Fig. 14 shows the interfacial damage at three feature points: when the interface begins to fail, when the load reaches its maximum value, and when the component loses its load-bearing capacity.
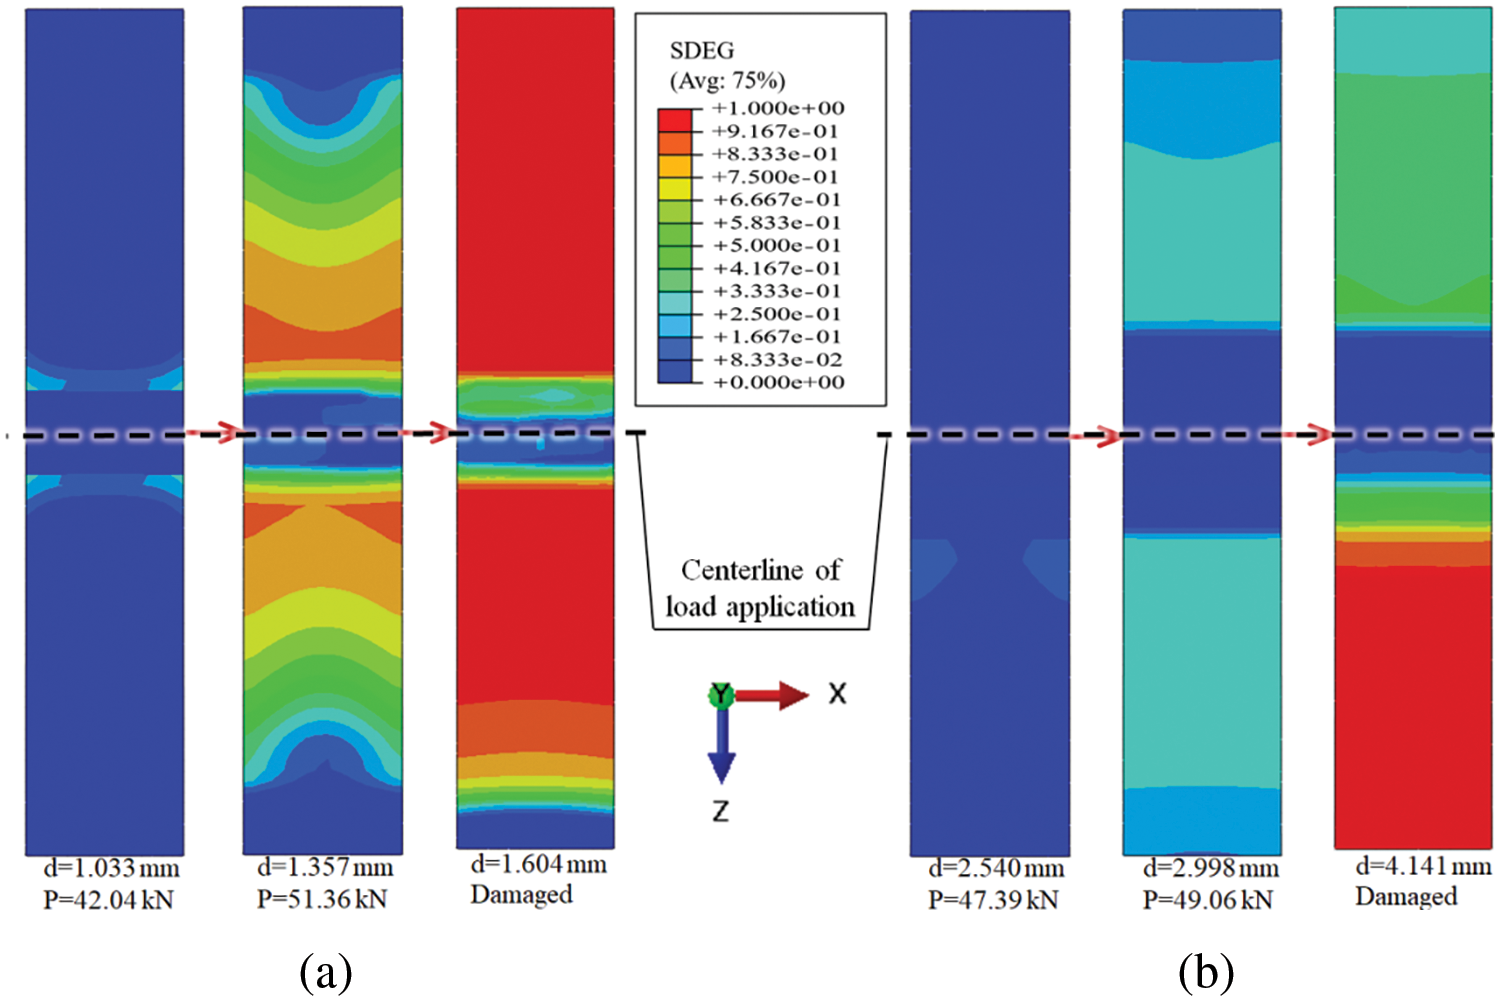
Figure 14: Distribution of SDEG at different deflections until ultimate state: (a) SB interface; (b) EA interface
When the deflection of the plate reached 1.033 mm, damage began to occur at the SB interface, with the applied load recorded as 42.04 kN. As the loading increased, the deflection continued to develop, and interface damage developed rapidly. When the deflection reached 1.357 mm, the composite plate reached its maximum bearing capacity of 51.36 kN, characterized by large-scale damage at the interface. When deflection increased to 1.604 mm, the interface was completely damaged, and the plate could no longer bear the applied loading. For the EA interface, only minor damage occurred when the deflection reached 2.540 mm, with the applied loading recorded as 47.39 kN. The maximum loading of 49.06 kN was reached at a deflection of 2.998 mm. When the deflection increased to 4.141 mm, the composite plate was destroyed and lost its load-bearing capacity. With the continuous increase in deflection, the applied loading was almost constant, but the crack continued to develop.
Overall, the composite plate with the SB interface exhibited a higher bearing capacity but faster interface degradation with increasing deflection, failing in a brittle fashion. However, the composite plate with EA interfaces exhibited a lower bearing capacity but slower interface degradation with increasing deflection, failing in a ductile fashion.
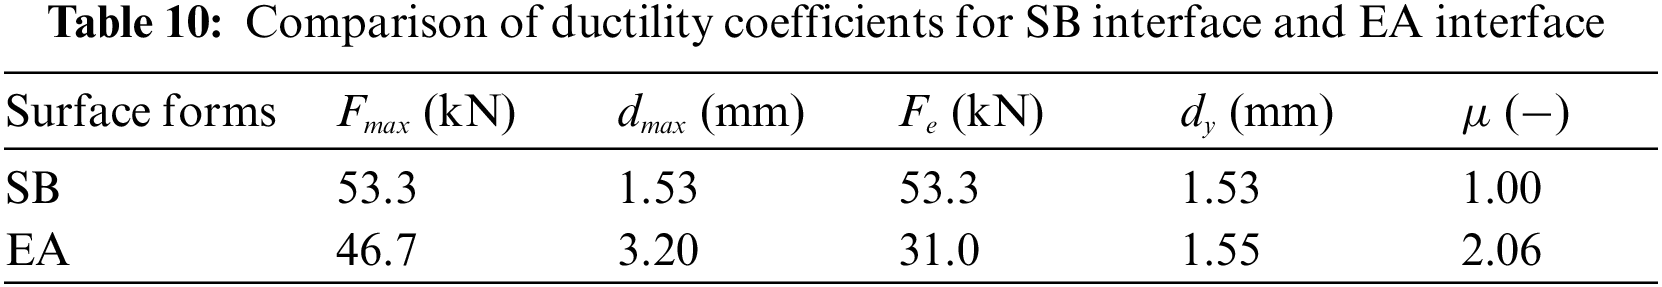
4.2 Differences of Interfacial Ductility and Bearing Capacity
Steel-UHPC composite plates with SB and EA interfaces differ in load-bearing capacity and ductility during three-point bending tests. Averages of the elastic ultimate load (
Table 10,
The steel-UHPC composite plates with SB and EA interfaces exhibit distinct bearing capacities and ductilities, attributed to their differing interfacial behaviors. An increase in roughness, as the primary factor, leads to an increase in the strength of the SB interface [54]. This strength originates from the mechanical locking between the UHPC overlay and the sandblasted surface of the steel plate, which fails in a brittle fashion as the interlock breaks [55]. Therefore, the strength of the composite plate with the SB interface can be improved by employing high working pressure, small abrasive particle size, and large impact angles in sandblasting [56]. In contrast, the strength and ductility of the EA interface are mainly influenced by the adhesive layer [57,58]. Due to the plastic deformation capacity of the epoxy resin adhesive layer, the EA interface gradually fails in a ductile fashion. However, an increase in the thickness of the adhesive layer can also lead to a decrease in bearing capacity due to internal defects [58]. Therefore, determining an optimal thickness of the adhesive layer for the composite plate with the EA interface in practical engineering merits further research.
This study establishes constitutive models for two interfaces between steel and UHPC without a shear connector based on experimental results of interfacial testing. It validates these models by comparing three-point bending testing results of the steel-UHPC composite plates. Based on the results and discussions of this study, the following conclusions are drawn:
• The proposed bilinear traction-separation model for the SB interface and the trapezoidal traction-separation model for the EA interface successfully calibrate the interfacial behavior of the steel-UHPC composite.
• The steel-UHPC composite plates with the SB interface exhibit higher load-carrying capacities but poorer ductility. These plates fail in a brittle fashion due to interface debonding. Conversely, the steel-UHPC composite plates with the EA interface exhibit lower load-carrying capacities than those with the SB interface but better ductility, failing in a ductile fashion due to interface debonding.
• Numerical simulations indicate that utilizing the experimentally determined pure shear strength as the traction-separation model’s ultimate shear traction underestimates the composite plates’ load-carrying capacity in three-point bending tests. The presence of normal stress improves the shear strength of the SB and EA interfaces by 3.95 and 1.19 times compared to the pure shear strength, respectively.
• The pure shear strength of the SB interface is lower than that of the EA interface. However, in practical engineering, the load-carrying capacity of the steel-UHPC composite bridge decks with the SB interface is superior to that of decks with the EA interface. This can be quantitatively explained by recalling the Mohr-Coulomb criterion, which enhances shear strength due to normal stress.
Based on this study, the following recommendations can be made for practical engineering:
• Apart from the interfacial pull-off and push-out tests, it is recommended to conduct three-point bending tests of the steel-UHPC plates for a comprehensive investigation of the interfacial behavior. In practical engineering, interfaces are normally subjected to complex stress states; therefore, the contribution of normal stress to shearing strength should be considered.
• Determining the interfacial treatment method between UHPC and steel should consider practical requirements. The SB interface is favorable for composite structures requiring high load-bearing capacities, whereas the EA interface is suitable for structures requiring superior ductility.
• In the case of surface treatment of the SB interface, ensuring roughness is recommended, employing high working pressure, small abrasive particle size, and significant impact angles during the sandblasting process [56]. For the EA interface, emphasis should be placed on eliminating internal defects within the adhesive layer, and a uniform thickness of the adhesive layer is recommended [58].
Acknowledgement: The authors acknowledge the help from Mr. He and Mr. Yu during the testing setup.
Funding Statement: This work was supported by the National Natural Science Foundation of China (Grant Nos. 52108168 & 52208398).
Author Contributions: The authors confirm their contributions to the paper as follows: study conception and design: H. Wang, B. Zhang; data collection: Z. Wang, B. Zhang; analysis and interpretation of results: Z. Wang, H. Wang, B. Zhang; draft manuscript preparation: Z. Wang, H. Wang, A. Qing, X. Huang. All authors reviewed the results and approved the final version of the manuscript.
Availability of Data and Materials: Data is available on request to the authors.
Conflicts of Interest: The authors declare that they have no conflicts of interest to report regarding the present study.
References
1. Yu, J., Zhang, B., Chen, W., Liu, H. (2022). Multi-scale analysis on the tensile properties of UHPC considering fiber orientation. Composite Structures, 280, 114835. https://doi.org/10.1016/j.compstruct.2021.114835 [Google Scholar] [CrossRef]
2. Zhang, B., Yu, J., Chen, W., Sun, H., Chen, S. et al. (2022). Interfacial properties between ultra-high performance concrete (UHPC) and steel: From static performance to fatigue behavior. Engineering Structures, 273, 115145. https://doi.org/10.1016/j.engstruct.2022.115145 [Google Scholar] [CrossRef]
3. Sbia, L. A., Peyvandi, A., Soroushian, P., Lu, J., Balachandra, A. M. (2014). Enhancement of ultrahigh performance concrete material properties with carbon nanofiber. Advances in Civil Engineering, 2014,1–10. [Google Scholar]
4. Lee, M. G., Wang, Y. C., Chiu, C. T. (2007). A preliminary study of reactive powder concrete as a new repair material. Construction and Building Materials, 21(1), 182–189. https://doi.org/10.1016/j.conbuildmat.2005.06.024 [Google Scholar] [CrossRef]
5. Rossi, P. (2000). Ultra-high performance fibre reinforced concretes (UHPFRCAn overview. Fifth RILEM Symposium on Fibre-Reinforced Concretes (FRC), pp. 87–100. Lyon, France. [Google Scholar]
6. Boersma, P. D., de Jong, F. B. P. (2003). Techniques and solutions for rehabilitation of orthotropic steel bridge decks in the Netherlands. Proceedings of the 10TH International Conference and Exhibition-Structural Faults and Repair Conference, pp. 901–910. London, UK. [Google Scholar]
7. Shi, Z., Zhou, Y., Sun, Z., Yang, S. (2022). Fatigue performance of orthotropic steel decks in a wide steel-box girder. Journal of Constructional Steel Research, 190, 107109. https://doi.org/10.1016/j.jcsr.2021.107109 [Google Scholar] [CrossRef]
8. Abdelbaset, H., Cheng, B., Tian, L., Li, H. T., Zhao, J. (2022). Enhancing fatigue resistance of rib-to-floorbeam welded connections in orthotropic steel bridge decks by using UHPC layer: An experimental study. Structures, 36, 153–167. https://doi.org/10.1016/j.istruc.2021.12.008 [Google Scholar] [CrossRef]
9. Shao, X., Qu, W., Cao, J., Yao, Y. (2018). Static and fatigue properties of the steel-UHPC lightweight composite bridge deck with large U ribs. Journal of Constructional Steel Research, 148, 491–507. https://doi.org/10.1016/j.jcsr.2018.05.011 [Google Scholar] [CrossRef]
10. Murakoshi, J., Yanadori, N., Ishii, H. (2008). Research on steel fiber reinforced concrete pavement for orthotropic steel deck as a countermeasure for fatigue. Stress, 1, 1–13. [Google Scholar]
11. Shao, X., Yi, D., Huang, Z., Zhao, H., Chen, B. et al. (2013). Basic performance of the composite deck system composed of orthotropic steel deck and ultrathin RPC layer. Journal of Bridge Engineering, 18(5), 417–428. https://doi.org/10.1061/(ASCE)BE.1943-5592.0000348 [Google Scholar] [CrossRef]
12. Zou, Y., Di, J., Zhou, J., Zhang, Z., Li, X. et al. (2020). Shear behavior of perfobond connectors in the steel-concrete joints of hybrid bridges. Journal of Constructional Steel Research, 172, 106217. https://doi.org/10.1016/j.jcsr.2020.106217 [Google Scholar] [CrossRef]
13. Zou, Y., Qin, F., Zhou, J., Zheng, Z., Huang, Z. et al. (2021). Shear behavior of a novel bearing-shear connector for prefabricated concrete decks. Construction and Building Materials, 268, 121090. https://doi.org/10.1016/j.conbuildmat.2020.121090 [Google Scholar] [CrossRef]
14. Fang, Z., Fang, S., Liu, F. (2022). Experimental and numerical study on the shear performance of short stud shear connectors in steel-UHPC composite beams. Buildings, 12(4), 418. https://doi.org/10.3390/buildings12040418 [Google Scholar] [CrossRef]
15. Zhou, F., Guo, C., Zhang, J., Guo, J., Jiang, J. et al. (2023). Experimental and numerical investigation of the shear performance of PSCC shear connectors with poured UHPC. Buildings, 13(1), 212. https://doi.org/10.3390/buildings13010212 [Google Scholar] [CrossRef]
16. Yan, J. B., Guan, H. N., Wang, T. (2020). Numerical studies on steel-UHPC-steel sandwich beams with novel enhanced C-channels. Journal of Constructional Steel Research, 170, 106070. https://doi.org/10.1016/j.jcsr.2020.106070 [Google Scholar] [CrossRef]
17. Bouazaoui, L., Perrenot, G., Delmas, Y., Li, A. (2007). Experimental study of bonded steel concrete composite structures. Journal of Constructional Steel Research, 63(9), 1268–1278. https://doi.org/10.1016/j.jcsr.2006.11.002 [Google Scholar] [CrossRef]
18. Wang, Y., Shao, X., Cao, J., Zhao, X., Qiu, M. (2021). Static and fatigue flexural performance of ultra-high performance fiber reinforced concrete slabs. Engineering Structures, 231, 111728. https://doi.org/10.1016/j.engstruct.2020.111728 [Google Scholar] [CrossRef]
19. Zhang, Y., Zhu, Y., Yeseta, M., Meng, D., Shao, X. et al. (2019). Flexural behaviors and capacity prediction on damaged reinforcement concrete (RC) bridge deck strengthened by ultra-high performance concrete (UHPC) layer. Construction and Building Materials, 215, 347–359. https://doi.org/10.1016/j.conbuildmat.2019.04.229 [Google Scholar] [CrossRef]
20. Zhao, W., Yu, Y., Xie, Q. (2019). Nonuniform interface failure of steel-concrete composite structures bonded using epoxy resin mortar. Engineering Structures, 184, 447–458. https://doi.org/10.1016/j.engstruct.2019.01.109 [Google Scholar] [CrossRef]
21. Zou, Y., Jiang, J., Yang, J., Zhang, Z., Guo, J. (2023). Enhancing the toughness of bonding interface in steel-UHPC composite structure through fiber bridging. Cement and Concrete Composites, 137, 104947. https://doi.org/10.1016/j.cemconcomp.2023.104947 [Google Scholar] [CrossRef]
22. Duan, L., Brühwiler, E., Wang, C. S. (2020). Cold stiffening of orthotropic steel decks by a composite UHPFRC layer. Journal of Constructional Steel Research, 172, 106209. https://doi.org/10.1016/j.jcsr.2020.106209 [Google Scholar] [CrossRef]
23. Kumar, P., Patnaik, A., Chaudhary, S. (2018). Effect of bond layer thickness on behaviour of steel-concrete composite connections. Engineering Structures, 177, 268–282. https://doi.org/10.1016/j.engstruct.2018.07.054 [Google Scholar] [CrossRef]
24. Wang, Z., Nie, X., Fan, J. S., Lu, X. Y., Ding, R. (2019). Experimental and numerical investigation of the interfacial properties of non-steam-cured UHPC-steel composite beams. Construction and Building Materials, 195, 323–339. https://doi.org/10.1016/j.conbuildmat.2018.11.057 [Google Scholar] [CrossRef]
25. Souici, A., Berthet, J. F., Li, A., Rahal, N. (2013). Behaviour of both mechanically connected and bonded steel-concrete composite beams. Engineering Structures, 49, 11–23. https://doi.org/10.1016/j.engstruct.2012.10.014 [Google Scholar] [CrossRef]
26. Zou, Y., Jiang, J., Zhou, Z., Wang, X., Guo, J. (2021). Study on the static performance of prefabricated UHPC-steel epoxy bonding interface. Advances in Civil Engineering, 2021, 1–15. [Google Scholar]
27. Jiang, J., Leng, J., Zhang, J., Guo, J. (2022). Interfacial behavior of the steel-UHPC composite deck with toughened epoxy bonding. Frontiers in Materials, 9, 859214. https://doi.org/10.3389/fmats.2022.859214 [Google Scholar] [CrossRef]
28. de Corte, W., Helincks, P., Boel, V., Klusak, J., Seitl, S. et al. (2017). Generalised fracture mechanics approach to the interfacial failure analysis of a bonded steel-concrete joint. Frattura ed Integrità Strutturale, 42,147–160. [Google Scholar]
29. Zhang, Y., Yang, X., Wang, X., Zhuang, X. (2021). A micropolar peridynamic model with non-uniform horizon for static damage of solids considering different nonlocal enhancements. Theoretical and Applied Fracture Mechanics, 113, 102930. https://doi.org/10.1016/j.tafmec.2021.102930 [Google Scholar] [CrossRef]
30. Jiang, J., Zou, Y., Yang, J., Zhou, J., Zhang, Z. et al. (2021). Study on bending performance of epoxy adhesive prefabricated UHPC-steel composite bridge deck. Advances in Civil Engineering, 2021, 1–16. [Google Scholar]
31. GB/T 714 (2015). Structural steel for bridges. Beijing: Standards Press of China. [Google Scholar]
32. ISO 630-2 (2021). Structural steels—Part 2: Technical delivery conditions for structural steels for general purposes. Switzerland: ISO. [Google Scholar]
33. Park, K., Paulino, G. H. (2011). Cohesive zone models: A critical review of traction-separation relationships across fracture surfaces. Applied Mechanics Reviews, 64(6), 060802. https://doi.org/10.1115/1.4023110 [Google Scholar] [CrossRef]
34. Ridha, M., Tan, V. B. C., Tay, T. E. (2011). Traction-separation laws for progressive failure of bonded scarf repair of composite panel. Composite Structures, 93(4), 1239–1245. https://doi.org/10.1016/j.compstruct.2010.10.015 [Google Scholar] [CrossRef]
35. Zhang, J., Zhu, S., Cai, C., Wang, M., Li, H. (2020). Experimental and numerical analysis on concrete interface damage of ballastless track using different cohesive models. Construction and Building Materials, 263, 120859. https://doi.org/10.1016/j.conbuildmat.2020.120859 [Google Scholar] [CrossRef]
36. Tvergaard, V., Hutchinson, J. W. (1992). The relation between crack growth resistance and fracture process parameters in elastic-plastic solids. Journal of the Mechanics and Physics of Solids, 40(6), 1377–1397. https://doi.org/10.1016/0022-5096(92)90020-3 [Google Scholar] [CrossRef]
37. Wu, Y., Chen, W. (2010). Cohesive zone model based analysis of bond strength between FRP and concrete. Engineering Mechanics, 27(7), 113–119 (In Chinese). [Google Scholar]
38. Yang, Q. D., Thouless, M. D., Ward, S. M. (1999). Numerical simulations of adhesively-bonded beams failing with extensive plastic deformation. Journal of the Mechanics and Physics of Solids, 47(6), 1337–1353. https://doi.org/10.1016/S0022-5096(98)00101-X [Google Scholar] [CrossRef]
39. ABAQUS (2016). ABAQUS documentation. France: Dassault Systèmes. [Google Scholar]
40. Guan, P., Tu, Y., Zhang, P. (2019). A review on constitutive relationship of ultra-high performance concrete under uniaxial compression and tension. Acta Materiae Compositae Sinica, 36(5), 1295–1305 (In Chinese). [Google Scholar]
41. Zheng, W., Li, S., Li, L. (2011). Experimental research on mechanical performance of reactive powder concrete beams reinforced with GFRP bars. Journal of Building Structures, 32(6), 115 (In Chinese). [Google Scholar]
42. Zhang, B., Yu, J., Chen, W., Liu, H. (2022). Failure evolution and fiber toughing mechanism of ultra-high performance concrete under uniaxial compression. Journal of Sustainable Cement-Based Materials, 12(4), 441–459. [Google Scholar]
43. Medani, T. O., Liu, X., Huurman, M., Scarpas, A., Molenaar, A. A. A. (2008). Experimental and numerical characterization of a membrane material for orthotropic steel deck bridges: Part 1: Experimental work and data interpretation. Finite Elements in Analysis and Design, 44(9–10), 552–563. [Google Scholar]
44. Yin, H., Zhu, Y. T., Yin, C. L. (2013). Study on the mechanical properties of tack coat between asphalt layers by interlaminar shear tests. Applied Mechanics and Materials, 361, 1490–1494. [Google Scholar]
45. Wu, S., Sun, X., Yang, J., Yang, R., Zhu, J. (2020). Experimental study of environmental conditions on in-situ engineered cementitious composites-steel deck interface. Applied Sciences, 10(6), 2123. https://doi.org/10.3390/app10062123 [Google Scholar] [CrossRef]
46. Yao, B., Li, F., Wang, X., Cheng, G. (2016). Evaluation of the shear characteristics of steel-asphalt interface by a direct shear test method. International Journal of Adhesion and Adhesives, 68, 70–79. https://doi.org/10.1016/j.ijadhadh.2016.02.005 [Google Scholar] [CrossRef]
47. Feng, S., Xiao, H., Geng, J. (2020). Bond strength between concrete substrate and repair mortar: Effect of fibre stiffness and substrate surface roughness. Cement and Concrete Composites, 114, 103746. https://doi.org/10.1016/j.cemconcomp.2020.103746 [Google Scholar] [CrossRef]
48. Zanotti, C., Banthia, N. (2016). Modified slant shear cylinder test for inherent characterization of bond in concrete repairs. Indian Concrete Journal, 90(8), 32–40. [Google Scholar]
49. Zanotti, C., Rostagno, G., Tingley, B. (2018). Further evidence of interfacial adhesive bond strength enhancement through fiber reinforcement in repairs. Construction and Building Materials, 160, 775–785. https://doi.org/10.1016/j.conbuildmat.2017.12.140 [Google Scholar] [CrossRef]
50. Ziraba, Y. N., Baluch, M. H., Basunbul, I. A., Azad, A. K., Al-Sulaimani, G. J. et al. (1995). Combined experimental-numerical approach to characterization of steel-glue-concrete interface. Materials and Structures, 28, 518–525. https://doi.org/10.1007/BF02473156 [Google Scholar] [CrossRef]
51. Qiu, X., Xiao, S. L., Xu, J. X., Yang, Q., Li, C. L. (2019). Meso-scale finite element analysis on creep behaviour of asphalt mixture considering interface effect. IOP Conference Series: Materials Science and Engineering, pp. 12–50. Xiamen, China. [Google Scholar]
52. Cheng, J., Jiang, H., Qu, X., Jiang, Y., Li, C. (2021). Numerical simulation study on rock breaking efficiency of shield cutters in large-size boulder strata. IOP Conference Series: Earth and Environmental Science, 719, 042067. [Google Scholar]
53. Park, R. (1989). Evaluation of ductility of structures and structural assemblages from laboratory testing. Bulletin of the New Zealand Society for Earthquake Engineering, 22(3), 155–166. https://doi.org/10.5459/bnzsee.22.3.155-166 [Google Scholar] [CrossRef]
54. Hong, L., Gu, X., Lin, F. (2014). Influence of aggregate surface roughness on mechanical properties of interface and concrete. Construction and Building Materials, 65, 338–349. https://doi.org/10.1016/j.conbuildmat.2014.04.131 [Google Scholar] [CrossRef]
55. Qasim, M., Lee, C. K., Zhang, Y. X. (2022). An experimental study on interfacial bond strength between hybrid engineered cementitious composite and concrete. Construction and Building Materials, 356, 129299. https://doi.org/10.1016/j.conbuildmat.2022.129299 [Google Scholar] [CrossRef]
56. Bechikh, A., Klinkova, O., Maalej, Y., Tawfiq, I., Nasri, R. (2020). Sandblasting parameter variation effect on galvanized steel surface chemical composition, roughness and free energy. International Journal of Adhesion and Adhesives, 102, 102653. https://doi.org/10.1016/j.ijadhadh.2020.102653 [Google Scholar] [CrossRef]
57. Yu, Y., He, K., Hang, Z., Liu, W., Zhao, W. (2023). Effects of adhesive layer thickness on the fracture properties of a concrete-epoxy resin interface. Theoretical and Applied Fracture Mechanics, 130, 104239. [Google Scholar]
58. Zhang, D., Huang, Y. (2021). Influence of surface roughness and bondline thickness on the bonding performance of epoxy adhesive joints on mild steel substrates. Progress in Organic Coatings, 153, 106135. https://doi.org/10.1016/j.porgcoat.2021.106135 [Google Scholar] [CrossRef]
Cite This Article
 Copyright © 2024 The Author(s). Published by Tech Science Press.
This work is licensed under a Creative Commons Attribution 4.0 International License , which permits unrestricted use, distribution, and reproduction in any medium, provided the original work is properly cited.
 Downloads
 Citation Tools