
 Submit a Paper
 Propose a Special lssue
 Open Access
ARTICLE

Multi-Strategy Assisted Multi-Objective Whale Optimization Algorithm for Feature Selection
1 School of Information Engineering, Hebei GEO University, Shijiazhuang, 050031, China
2 Faculty of Science, University of Alberta, Edmonton, T2N1N4, Canada
3 College of Resources and Environment, Beibu Gulf University, Qinzhou, 535011, China
4 Clinical Laboratory, The Frist Hospital of Hebei Medical University, Shijiazhuang, 050000, China
* Corresponding Author: Chong Zhou. Email:
(This article belongs to the Special Issue: Bio-inspired Optimization in Engineering and Sciences)
Computer Modeling in Engineering & Sciences 2024, 140(2), 1563-1593. https://doi.org/10.32604/cmes.2024.048049
Received 26 November 2023; Accepted 22 February 2024; Issue published 20 May 2024
 View Full Text
 Download PDF
Abstract
In classification problems, datasets often contain a large amount of features, but not all of them are relevant for accurate classification. In fact, irrelevant features may even hinder classification accuracy. Feature selection aims to alleviate this issue by minimizing the number of features in the subset while simultaneously minimizing the classification error rate. Single-objective optimization approaches employ an evaluation function designed as an aggregate function with a parameter, but the results obtained depend on the value of the parameter. To eliminate this parameter’s influence, the problem can be reformulated as a multi-objective optimization problem. The Whale Optimization Algorithm (WOA) is widely used in optimization problems because of its simplicity and easy implementation. In this paper, we propose a multi-strategy assisted multi-objective WOA (MSMOWOA) to address feature selection. To enhance the algorithm’s search ability, we integrate multiple strategies such as Levy flight, Grey Wolf Optimizer, and adaptive mutation into it. Additionally, we utilize an external repository to store non-dominant solution sets and grid technology is used to maintain diversity. Results on fourteen University of California Irvine (UCI) datasets demonstrate that our proposed method effectively removes redundant features and improves classification performance. The source code can be accessed from the website: .Keywords
Classification challenges encompass a wide range of real-world issues, including image analysis [1], biological and biomedical issues [2], business and financial issues [3], and text mining issues [4]. In data mining and machine learning, classification is a crucial activity, but it can be difficult when working with high-dimensional datasets. The exponential growth of the search space as the dimensionality of the dataset rises is known as the “curse of dimensionality” [5]. The possibility of
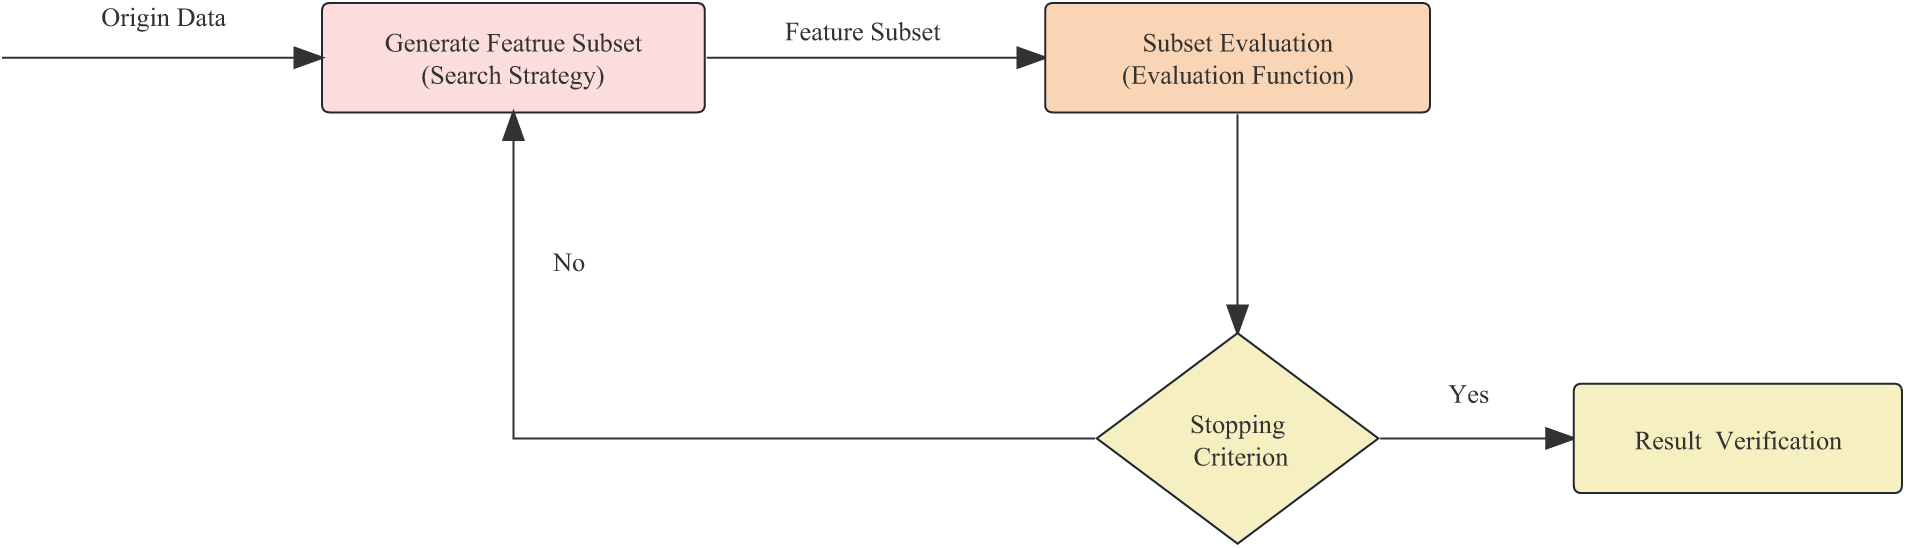
Figure 1: Five key steps of feature selection process
These techniques are not without their drawbacks and restrictions, though. These include an effective amount of features in the subset and a relatively low classification accuracy rate. The implementation of an effective global search technology is necessary to address these shortcomings. The capabilities of evolutionary computation (EC) technology in global search is well known [7]. When used to solve feature selection (FS) issues, EC approaches can both locally and globally explore the search space. Particle Swarm Optimization (PSO) [13–15] and Genetic Algorithm (GA) [16] are two often employed EC methods. Grey Wolf Optimization (GWO) [17,18], Artificial Bee Colony (ABC) [19,20], Hunger Games Search (HGS) [21], Salp Swarm Algorithm (SSA) [22,23], Harris Hawks Optimization (HHO) [24,25], and Slime Mould Algorithm (SMA) [26–28]. As demonstrated in [29], numerous methods have been used to handle feature selection difficulties.
Evolutionary algorithms can be divided into single-objective and multi-objective categories. The single evaluation function in the single-objective approach takes into account both the chosen feature subset and the classification accuracy rate, which is controlled by a parameter. By contrasting the evaluation function values, the evolutionary algorithm seeks to identify the best solution. The multi-objective approach, on the other hand, incorporates at least two optimization goals into the evaluation process. Because the optimal answer cannot be found by simple comparison but rather by using a dominance relationship, the solutions acquired by a multi-objective evolutionary algorithm constitute a set. Minimizing the number of selected features and lowering the classification error rate are often the two key goals in the context of feature selection (FS) difficulties. As a result, FS issues can be categorized as multi-objective optimization problems (MOPs). Due to their population-based search process, which can produce numerous trade-off solutions in a single run, EC technologies are especially good at tackling multi-objective optimization issues. Multi-objective feature selection issues have been addressed using a number of EC methods, including GA, PSO, GWO, and ABC. The No-Free-Lunch (NFL) Theorem, which asserts that there is not one universally superior optimization technique that can resolve all optimization issues, should be noted. This suggests that certain problems may see performance degradation while using existing feature selection methods. The Whale Optimization Algorithm (WOA) [30] is a cutting-edge optimization method that mimics humpback whales’ bubble-net foraging, circling, and search activities. Numerous feature selection issues have been solved with WOA [31–33]. Existing WOA-based approaches, however, handle the FS problem as a single-objective optimization problem by aggregating the two objectives using a parameter. It is relatively uncommon to formulate feature selection as a multi-objective optimization problem using multiobjective WOA.
A Multi-Strategy assisted Multi-Objective Whale Optimization Algorithm (MSMOWOA) is therefore suggested for feature selection in order to alleviate these limitations. We present a multi-strategy solution that combines the Grey Optimization technique, Levy flight, and adaptive mutation in order to improve the performance of MOWOA. In addition, An external repository in which non-dominated solutions are stored is employed to address multi-objective optimization problems. We use grid technology, splitting the grid depending on the non-dominated solutions, to maintain diversity within the repository. An elaborate experiment is created to assess the performance of the suggested algorithm. The outcomes show that MSMOWOA performs admirably in handling feature selection issues.
The main contributions of the paper are listed as follows:
• A multi-strategy assisted multi-objective whale optimization algorithm is proposed to solve the feature selection problem.
• The effectiveness of three strategies including grey wolf optimization, levy flight, and adaptive mutation is evaluated.
• The performance of the proposed MSMOWOA is evaluated on 14 UCI datasets to research its efficiency for the multi-objective feature selection.
The remaining sections of the paper are organized as follows. The typical Whale Optimization Algorithm is described in Section 2, along with the core ideas of multi-objective optimization. It also includes the most recent feature selection research as well as a feature selection technique built on the Whale Optimization Algorithm. Section 3 gives a thorough explanation of the suggested feature selection strategy that makes use of the WOA algorithm. In Section 4, the experimental plan is described, and in Section 5, the results of the experiment are shown and their implications are discussed. The report is concluded with a discussion of probable future development tendencies in Section 6.
2.1 Whale Optimization Algorithm
The Whale Optimization Algorithm (WOA) [30] is a new optimization technique for solving optimization problems. This algorithm which mimics the hunting behavior of humpback whales includes three operators to simulate the search for prey, encircling prey and bubble-net foraging behavior of humpback whales. The mathematical formulation of encircling prey is as follows:
where
To simulate the bubble-net foraging behavior of humpback whales, two mechanisms of encircling prey and spiral updating position are described. The spiral updating position is modeled mathematically as follows:
where
To model the bubble-net foraging behavior of humpback whales, a probability of 50% is assumed to select between either the encircling prey mechanism or the spiral model to update the position of whales during the optimization process as in Eq. (6).
where
For the search for prey, the humpback whales search for prey randomly. The mathematical model of the search for prey is as follows:
where
2.2 Multi-Objective Optimization Problem
Multiple objectives that compete with one another make up multi-objective optimization issues. To give an example, the following formulation of the problem can be used without losing generality:
where the number of variables in the problem is represented by
Finding the best solution in a single-objective optimization issue is very simple because there is only one objective function. However, in multi-objective optimization situations, incomparability and conflicting objectives make it more difficult to find the best solution. If a solution exhibits better or equal values across all objective functions and has better values on at least one objective function, it can be said to be superior to another solution in such circumstances. The ensuing ideas are introduced to address this.
Pareto Dominance: Supposed that there are two vectors such as:
Pareto Optimality: A solution
Pareto Optimality Set: The set of Pareto optimal solutions is Pareto optimal set.
Pareto Front: In Pareto Optimality set, the set containing objective value corresponding to Pareto Optimal solution is called Pareto front.
2.3.1 Existing Feature Selection Approaches
The challenges of feature selection include choosing pertinent features, removing superfluous and duplicate information, and decreasing the dimensionality of the data. Three different types of feature selection methods are currently in use: classical methods, single-objective based evolutionary algorithms, and multi-objective based evolutionary methods.
Sequential forward selection (SFS) and sequential backward selection (SBS) are two often used techniques in traditional feature selection methodologies [12]. SFS begins with a blank feature subset and gradually adds features until it is unable to enhance classification performance. SBS, on the other hand, starts with every characteristic and gradually eliminates them until the classification performance cannot be enhanced. Despite being simple to use, SFS and SBS have a high computational complexity and a propensity to converge to local optimum solutions. Researchers have suggested sequential forward float selection (SFFS) and sequential backward float selection (SBFS) as enhanced versions of SFS and SBS to overcome these problems [34]. In addition, greedy stepwise backward selection (GSBS) [35] and linear forward selection (LFS) [36] based on SFS have been developed. In [37], Gulay Tasci et al. developed two novel conditional feature extraction functions that improve upon traditional local binary pattern (LBP) functions by utilizing maximum and minimum distance vectors to generate patterns. In this paper, they employed wavelet packet decomposition to construct a multileveled feature extraction model and evaluated several feature selection techniques.
Researchers have used evolutionary computation methods to get beyond the drawbacks of conventional feature selection methods in single-objective based evolutionary algorithms. This includes applying techniques like the Dragonfly Algorithm (DA) [38], Emperor Penguin Optimizer (EPO) [39], Particle Swarm Optimization (PSO), Genetic Algorithm (GA), and so on. A GA-based feature selection method, for instance, was suggested by Raymer et al. [16] and outperformed SFFS [34]. A hybridized GA (HGA) that incorporates local search operations was introduced by Oh et al. [40], and it performs better than a normal GA. A multi-swarm PSO-based feature selection method that weights classification accuracy and F-score was proposed by Liu et al. [41]. Potential particle swarm optimization (PPSO), a technique described by Tran et al. [42], narrows the search space and makes use of a novel fitness function to direct the search. Different EPO variations that employ various methods to update coefficients for feature selection have been proposed by Dhiman et al. [39]. A binary DA (BDA) that employs several coefficient updating tactics for feature selection was introduced by Hammouri et al. [38]. In order to enhance searching behavior and avoid local optima, Too et al. [43] introduced the Hyper Learning Binary Dragonfly Algorithm (HLBDA). HLBDA is also used to diagnose the condition using a dataset for coronavirus disease (COVID-19).
In multi-objective based evolutionary algorithms, the feature selection problem involves the conflicting objectives of maximizing classification accuracy and minimizing the number of selected features. Evolutionary algorithms based on multi-objective optimization have been widely adopted to address this challenge. Hamdani et al. [44] proposed a genetic algorithm based on non-dominated sorting II (NSGA-II) for feature selection. Xue et al. [45] introduced a multi-objective PSO feature selection approach inspired by crowding distance, non-dominated sorting, and mutation. Experimental results demonstrate that this approach outperforms NSGA-II. Han et al. [46] developed a novel feature selection algorithm based on multi-objective particle swarm optimization with adaptive strategies (MOPSO-ASFS) to enhance the selection pressures of the population. They incorporated an adaptive penalty mechanism based on the PBI parameter and an adaptive leading particle selection based on feature information, combining opposite mutation and feature frequencies. Aljarah et al. [23] proposed an enhanced multi-objective SSA algorithm (MODSSA-lbest) that utilizes a dynamic time-varying strategy and local fittest solutions to balance exploration and exploitation. The results show that MODSSA-lbest achieves significantly promising results compared to other algorithms. Nouri-Moghaddam et al. [47] introduced a multi-objective feature selection algorithm based on forest optimization algorithm (FOA) that incorporates archive, grid, and region-based selection concepts. Compared to other multi-objective algorithms, MOFOA with continuous representation demonstrates the ability to reduce classification errors using a smaller number of features in most cases. Piri et al. [48] proposed a new algorithm called Binary Multi-objective Chimp Optimization Algorithm (BMOChOA) for feature selection in medical data. BMOChOA incorporates a dual archive and a k-nearest neighbors (KNN) classifier to extract relevant aspects. They implemented 12 versions of BMOChOA based on group information and types of chaotic functions used, and experimental results demonstrate the superiority of the proposed method in finding the best trade-off solutions. These approaches aim to improve the performance of feature selection and address the challenges posed by multi-objective optimization.
The feature selection challenge in multi-objective based evolutionary algorithms combines the competing goals of maximizing classification accuracy and decreasing the number of selected features. Multi-objective optimization-based evolutionary methods have been widely used to address this problem. For feature selection, Hamdani et al. [44] presented a genetic algorithm based on non-dominated sorting II (NSGA-II). A multi-objective PSO feature selection method was introduced by Xue et al. [45] and was influenced by crowding distance, non-dominated sorting, and mutation. Experimental findings show that this strategy performs better than NSGA-II. To increase the population’s selection pressures, Han et al. [46] created a novel feature selection technique based on multi-objective particle swarm optimization with adaptive strategies (MOPSOASFS). They combined opposite mutation and feature frequencies, incorporating an adaptive penalty mechanism based on the PBI parameter and an adaptive leading particle selection based on feature information. In order to balance exploration and exploitation, Aljarah et al. [23] suggested an improved multi-objective SSA algorithm (MODSSA-lbest) that makes use of a dynamic time-varying approach and local fittest solutions. The findings demonstrate that, when compared to other algorithms, MODSSA-lbest yields significantly promising results. A multi-objective feature selection system built on the forest optimization algorithm (FOA) by Nouri-Moghaddam et al. [47] includes concepts from archive, grid, and region-based selection. In most instances, MOFOA with continuous representation shows the capacity to decrease classification errors utilizing a reduced amount of features as compared to other multi-objective algorithms. For the purpose of choosing features in medical data, Piri et al. [48] introduced the Binary Multi-objective Chimp Optimization Algorithm (BMOChOA). To extract pertinent details, BMOChOA uses a dual archive and a k-nearest neighbors (KNN) classifier. The experimental findings show the superiority of the suggested method in identifying the optimum trade-off solutions. They constructed 12 versions of BMOChOA based on group information and the types of chaotic functions employed. In [49], for solving feature selection issues, Zhang et al. proposed a multi-objective Harris Hawks Optimization algorithm. To enhance HHO’s search capabilities, associative learning, grey wolf optimization, and chaotic local search are all added. These strategies try to deal with the difficulties brought on by multi-objective optimization and enhance the performance of feature selection. Wang et al. [50] proposed an Information-Theory-based Nondominated Sorting Ant Colony Optimization, called INSA, for multi-objective feature selection. INSA adopts information theroy to identify the importance of features used to modify the probabilistic function. In addition, construct solutions and pheromone updating strategies are designed to enhance the performance of INSA. In [51], Li et al. proposed a novel multi-objective binary grey wolf optimization based on a guided mutation strategy (GMS), called MOBGWO-GMS, for multi-objective feature selection. MOBGWO-GMS utilizes Pearson correlation coefficient to guide mutation strategy.
2.3.2 WOA-Based Feature Selection Approaches
A natural optimization method that imitates the bubble-net hunting tactic is called the Whale Optimization Algorithm (WOA). In the feature selection industry, it has become more well-liked. Two hybridization models of WOA and simulated annealing (SA) were presented for various feature selection strategies in a study by Mafarja et al. [52]. While the second model used SA to enhance the best solution discovered after each iteration of the WOA algorithm, the first model included the SA method into WOA. A brand-new binary variant of WOA known as bWOA was introduced by Hussien et al. [53] with the intention of solving dimensionality reduction and classification issues. This type converts the elements of the position vectors from 0 to 1 into binary space using an S-shaped transfer function. To find the best feature subsets, Mafarja et al. [54] presented two binary variations of the WOA algorithm. While the second variant added crossover and mutation operators to improve the exploitation of the WOA algorithm, the first variant used Tournament and Roulette Wheel selection processes in place of random operators. Another work by Zheng et al. [55] introduced the Maximum Pearson Maximum Distance Improved Whale Optimization approach (MPMDIWOA), a hybrid feature subset selection approach. Based on changes in the Maximum Value Weighted Correlation (MVWC) and a threshold, this algorithm dynamically applies filter and wrapper algorithms. The Quantum Whale Optimization Algorithm (QWOA) was developed by Agrawal et al. [56] to improve the performance of the conventional Whale Optimization Algorithm (WOA). This method makes use of modified evolutionary operators, quantum rotation gates, and Q-bit representation. Additionally, Too et al. [57] unveiled the Spatial Bounding Whale Optimization Algorithm (SBWOA), a fresh variation of WOA. To extract possible features from high-dimensional feature spaces, SBWOA uses a spatial bounding method. These studies show how the WOA algorithm has been improved and used in a variety of applications for feature selection.
3 Multi-Strategy Assisted Multi-Objective Whale Optimization Algorithm
3.1 The Framework of the Proposed Algorithm
The whole workflow of the proposed multi-strategy assisted multi-objective whale optimization algorithm is shown in the section. In order to improve the efficiency of WOA for feature selection, a multi-strategy which includes Grey Optimization strategy, levy flight, and adaptive mutation is introduced to it. Due to easily falling into the local optimal solution of the original WOA, the stage of WOA is determined by the value of the B parameter relating to the iteration number to improve the global search capacity of the WOA. When the absolute value of the B is less than 1, the method executes the exploitation phase and updates the position of the search agent using the update mechanism selected by a random number
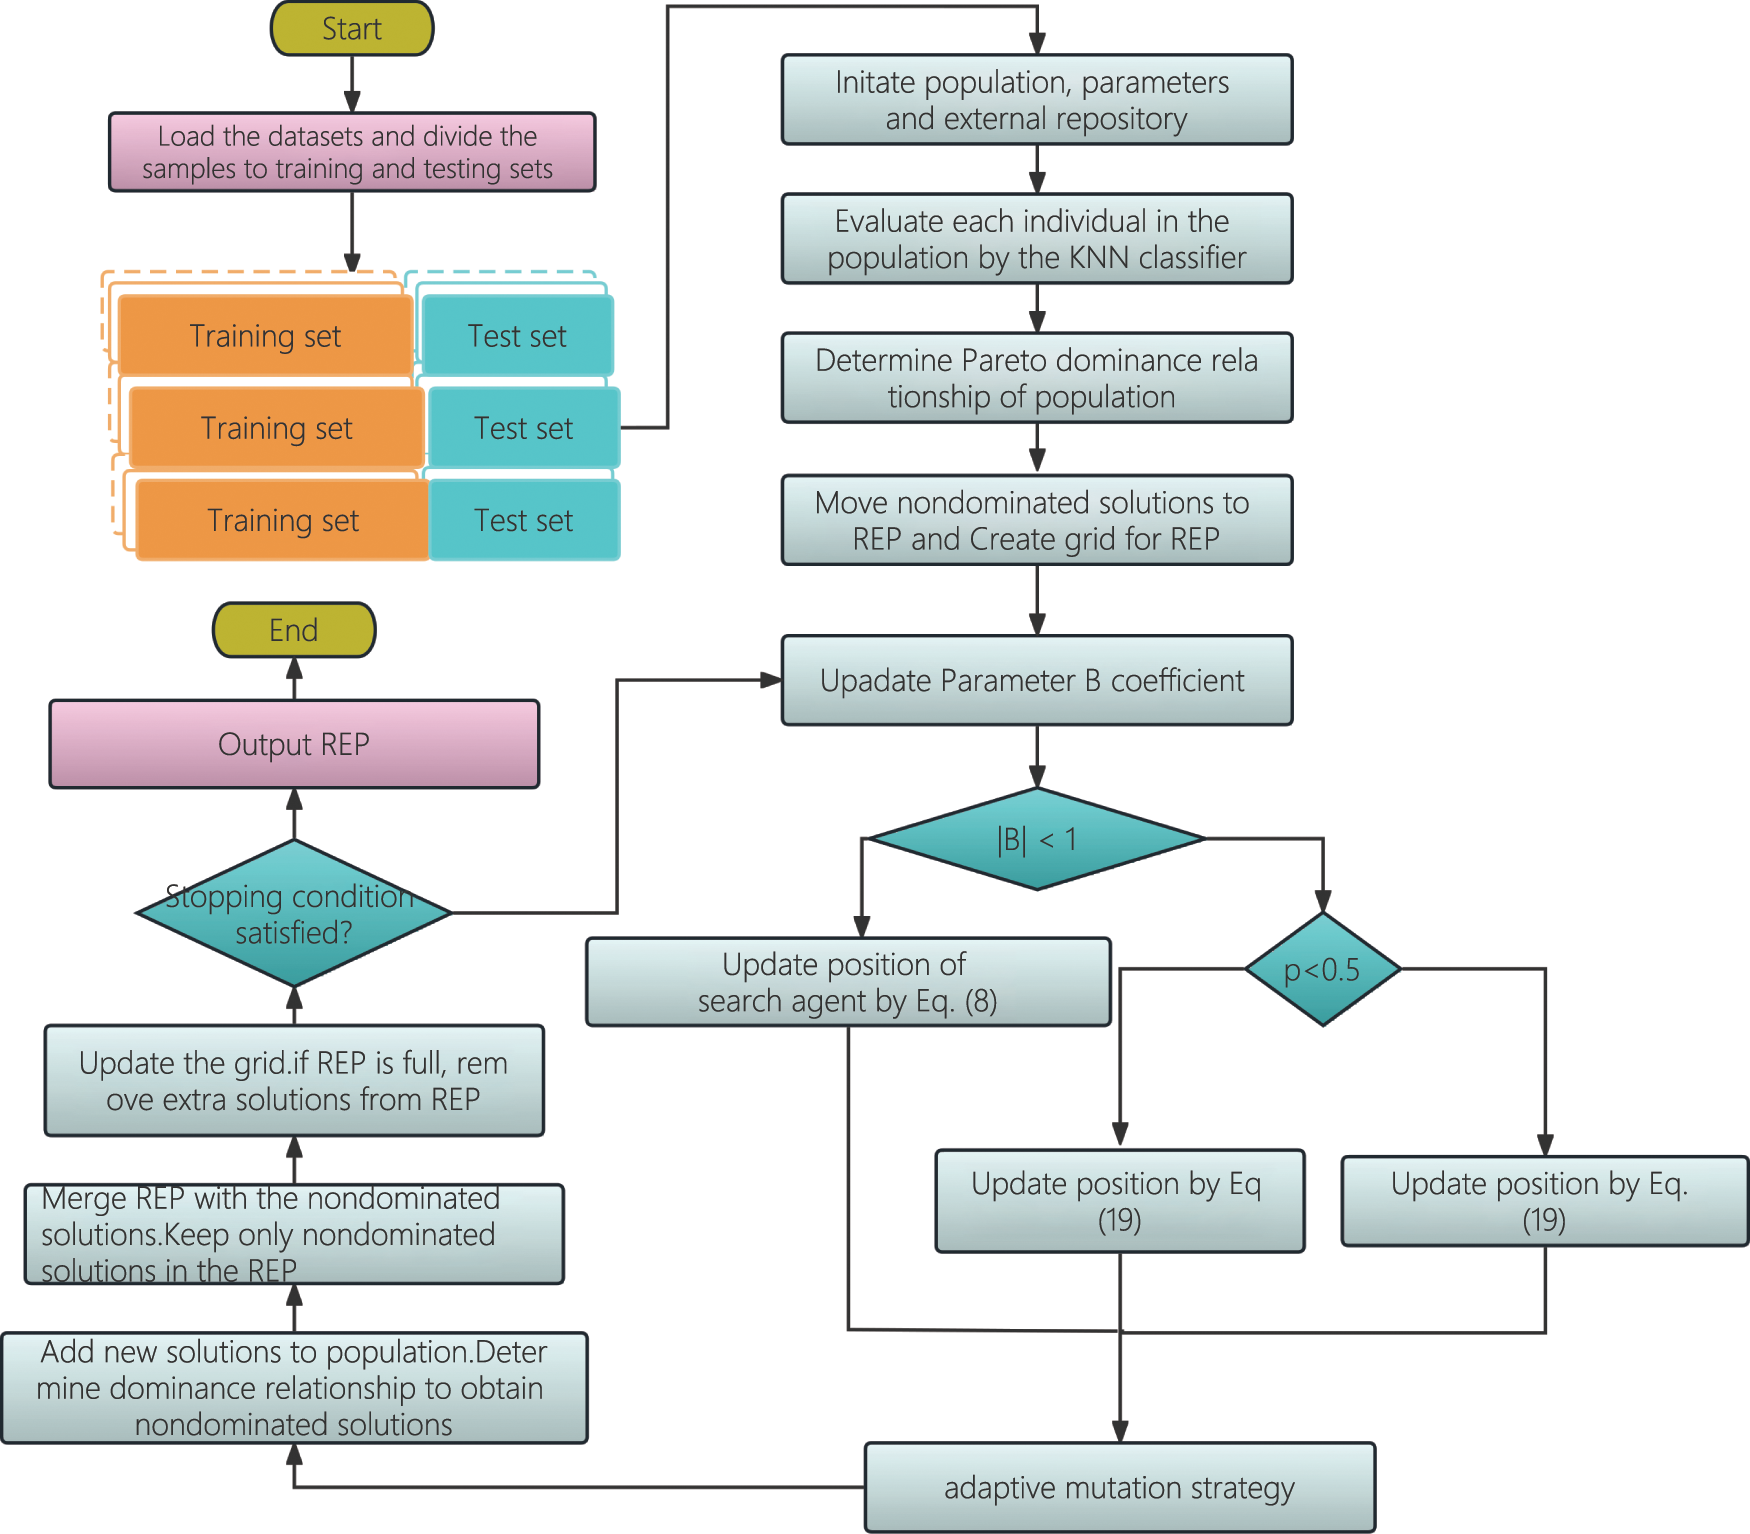
Figure 2: Flowchart of the proposed MSMOWOA
3.2 Grey Optimization Strategy
Grey Wolf Optimization Algorithm (GWO) has a stronger convergence performance than WOA. Like Whale Optimization Algorithm, GWO is also proposed by Seyedali Mirjalili. And in the grey Wolf algorithm, the global optimal solution, the global suboptimal solution and the global third best solution of the Grey Wolf Optimization algorithm surround the prey in the same way as the contraction surrounding position update mechanism in the exploitation stage of the whale algorithm. In order to further improve the convergence speed of the whale algorithm and effectively reduce the feature dimension, under the condition of retaining the position update mechanism of spiral motion in the exploitation stage of WOA, the position update mechanism of GWO, as shown in Eqs. (10)–(15), can replace the contraction and bounding mechanism in the exploitation stage of the whale algorithm. The new position update mechanism is listed in Eq. (16).
In the improved position update formula, the three best solutions which are the optimal solution, the suboptimal solution, and the third best solution are included. The improved whale algorithm not only combines the Grey Wolf mechanism to enhance the local exploitation ability, but also retains the global search ability of WOA.
Named after French mathematician Paul Levy, Levy Flight is isotropic with a step size that conforms to a heavy-tailed distribution. Fig. 3 is a schematic of Levy’s flight trajectory.
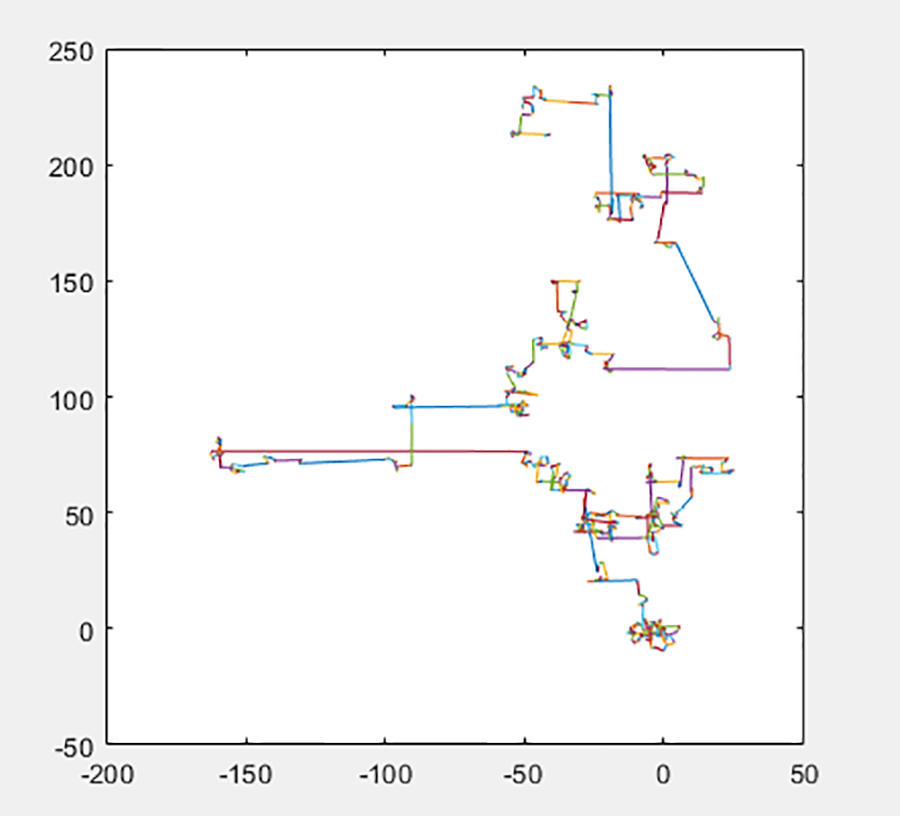
Figure 3: Levy’s flight path
Since the probability distribution of the step size of the “Levy flight” conforms to the heavy-tailed distribution, and in the study of heavy-tailed distributions, a probability distribution, called
The
Some MATLAB functions related to
1) Gaussian distribution
2) The Cauchy distribution is given by stblrnd
3) When the input parameters
The function stblrnd
Here,
The random number obtained from the
3.4 Adaptive Mutation Strategy
This paper suggests an adaptive mutation strategy that dynamically modifies the current individual mutation probability based on the last individual evaluation value, where the evaluation value is the classification error rate attained by the KNN classifier model, in order to further enhance the convergence of whale optimization algorithm. The classic mutation operator’s mutation probability is often kept constant during the iteration process or altered based on the number of iterations the person has received overall and the current iteration number. The adaptive mutation probability utilized in this study differs from the two more widely used traditional mutation techniques in that it is based on the magnitude of the individual’s evaluation value at the end of the algorithm’s operation. The present individual’s mutation probability is dynamically altered. The mutation probability is set to 0 for solutions that are superior to the previous individual but have a smaller evaluation value, meaning that they are retained rather than mutated. Contrarily, the mutation chance is suitably enhanced for the solutions with the higher evaluation values that are worse than the last individual, allowing the solutions with superior effect to be kept to the greatest extent.
However, in the iterative process of the standard multi-objective optimization methods, the solutions with bad fitness values are frequently directly discarded, despite the fact that these solutions with poor fitness values occasionally contain individuals with exceptional features in a particular aspect. Therefore, using these subpar solutions in their direct discard cannot fully utilize the particular resources of the whale population. This technique differs from the adaptive mutation probability suggested in this research. In order to effectively exploit the individual resources of the whale population and speed up population convergence, the mutation chance of these individuals with low fitness values is appropriately boosted.
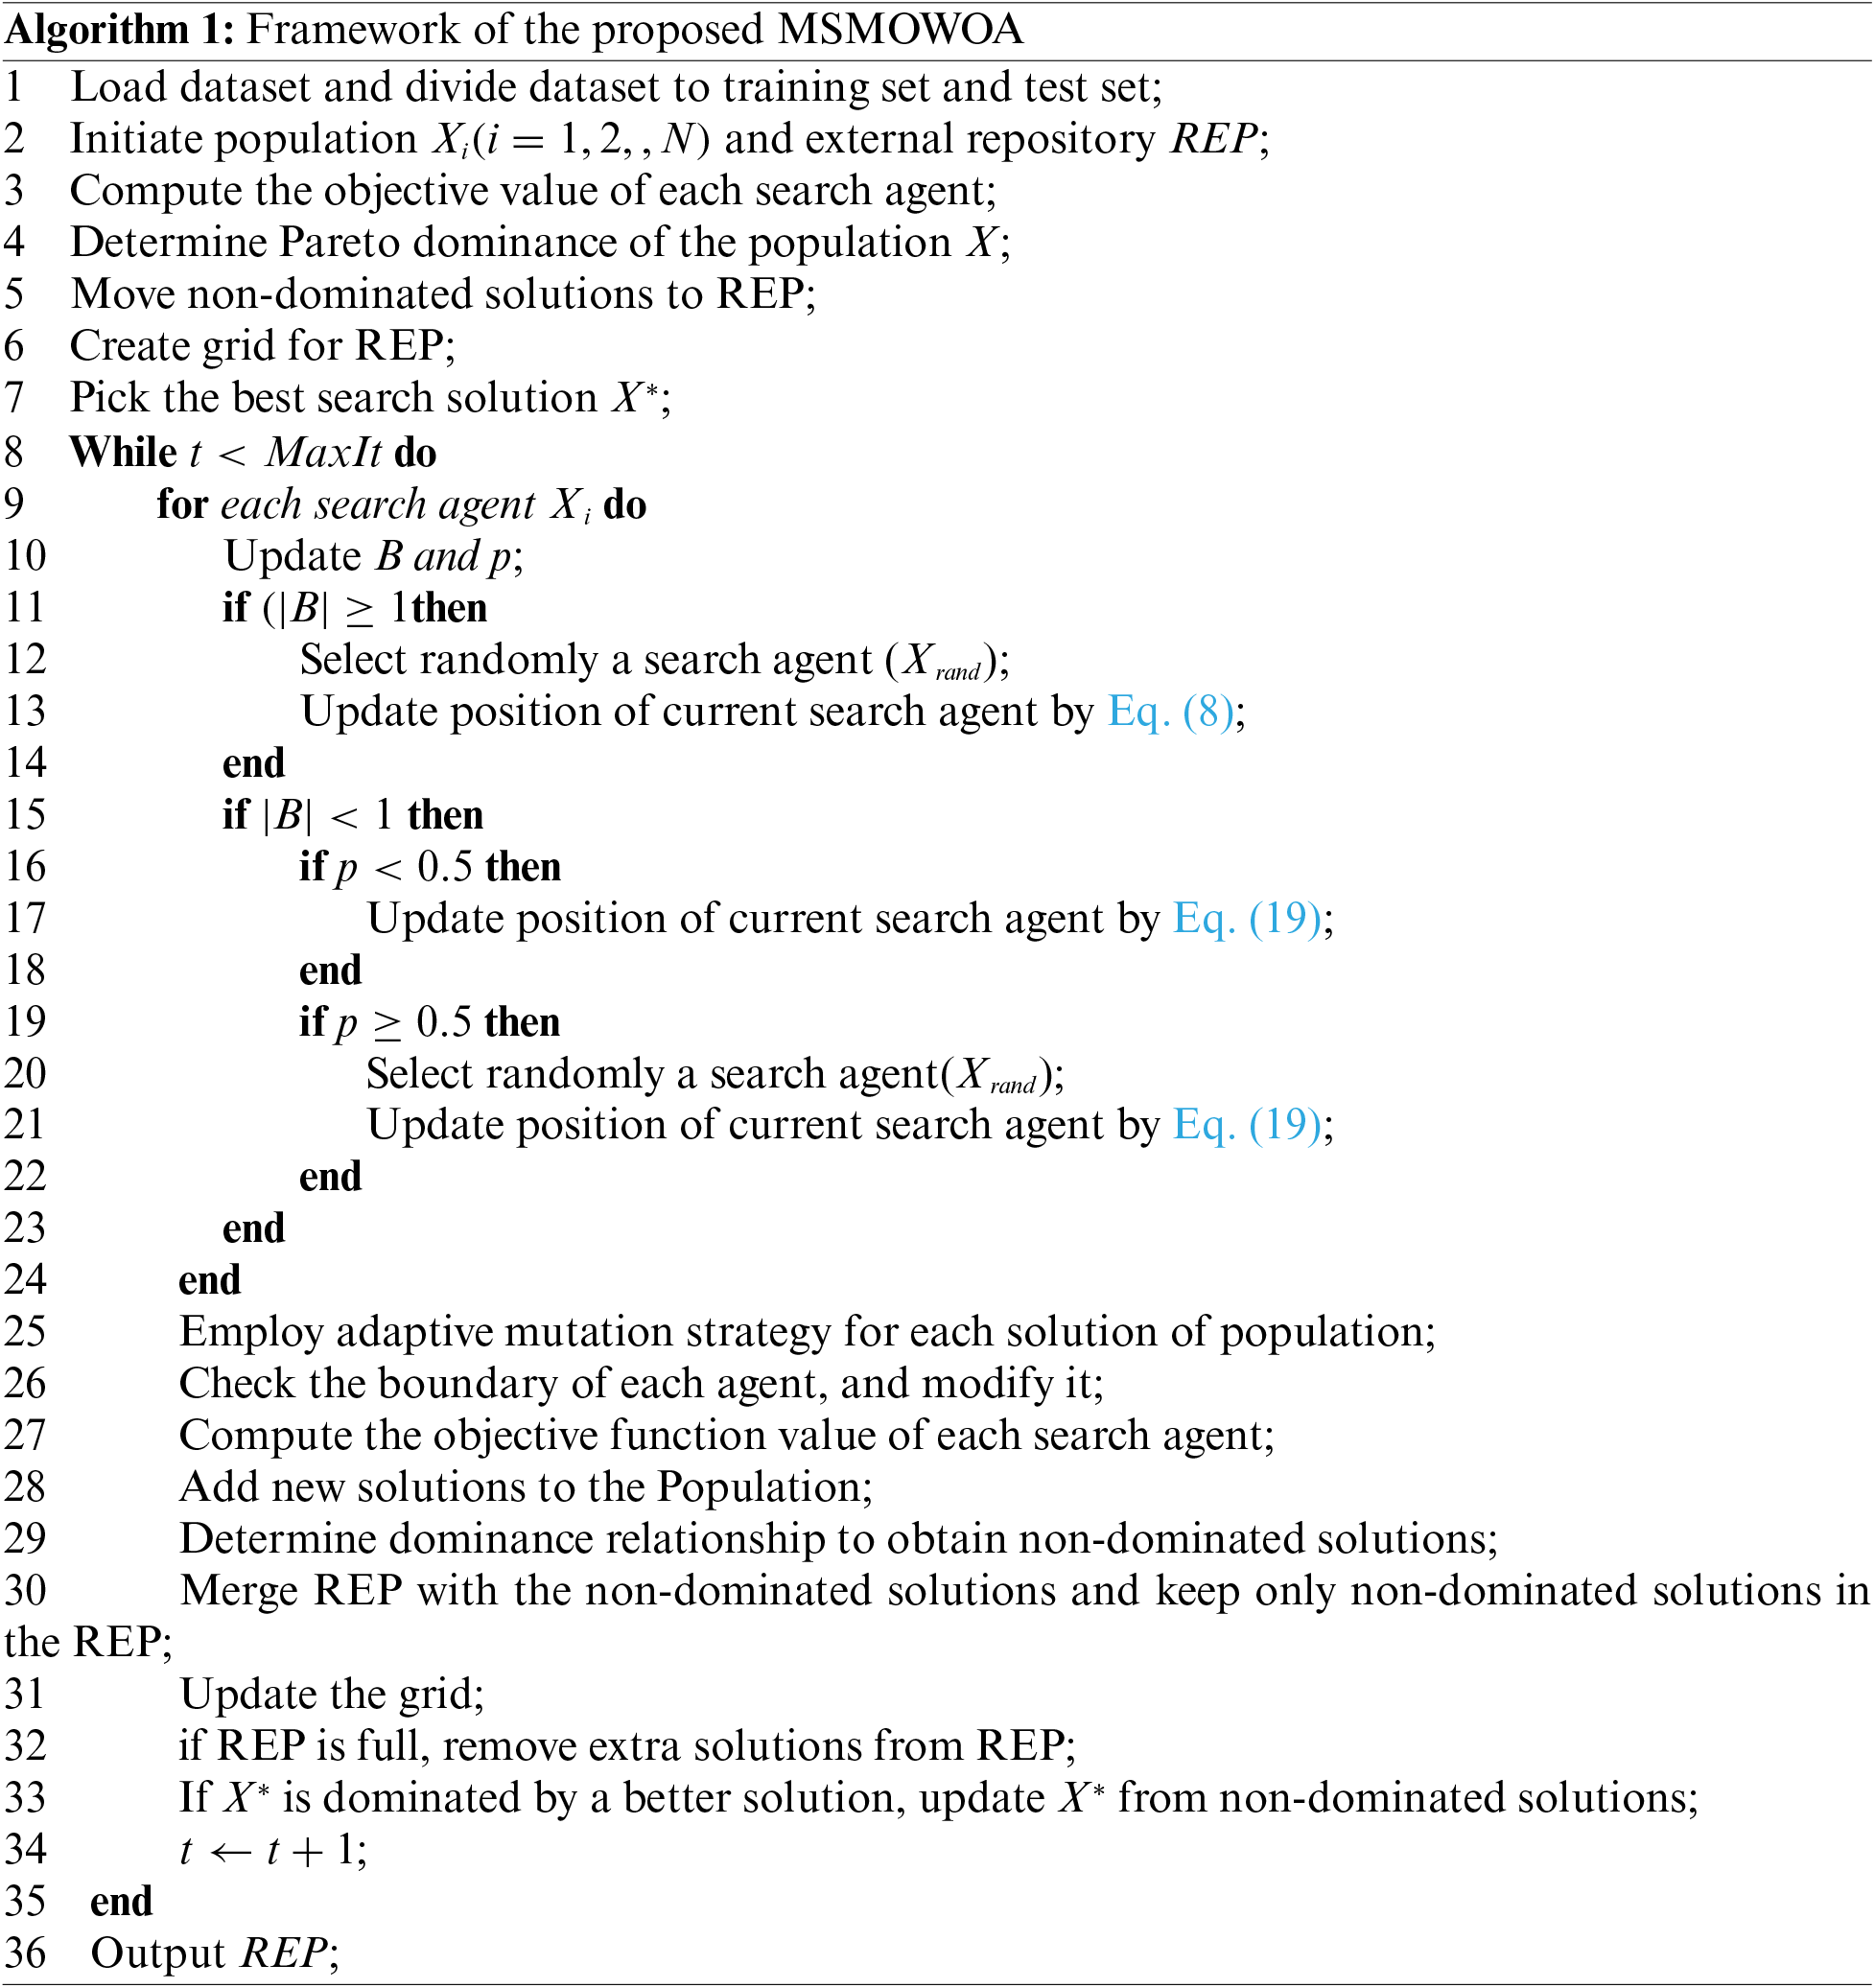
3.5 Complexity of the Proposed Algorithm
The Pareto dominance in lines 4 and 29 and the generation of new solutions in lines 13 to 25 determine the suggested Algorithm 1’s complexity, respectively. The computing complexity of determining Pareto dominance is
All experimental programs are performed in Windows version of Windows 7 Ultimate edition, Intel(R) Core(TM) i5-3230M CPU @ 2.60 GHz 2.60 GHz, installed memory (RAM) 4.00 GB, Windows 7 Ultimate Edition. The system type is a 64-bit operating system. The programming language used in the experiments is Matlab, the version is Matlab R2020a.
The training set and test set each make up 70% and 30% of the total dataset, respectively. The classification error of a feature subset is calculated using the kNN algorithm. The test set’s prediction results are used as input when calculating additional assessment indicators. The performance of the nondominated subsets generated in the repository is assessed using the test set. The test set will be used to evaluate Pareto fronts in the repository, and the evaluation metrics’ average will be reported.
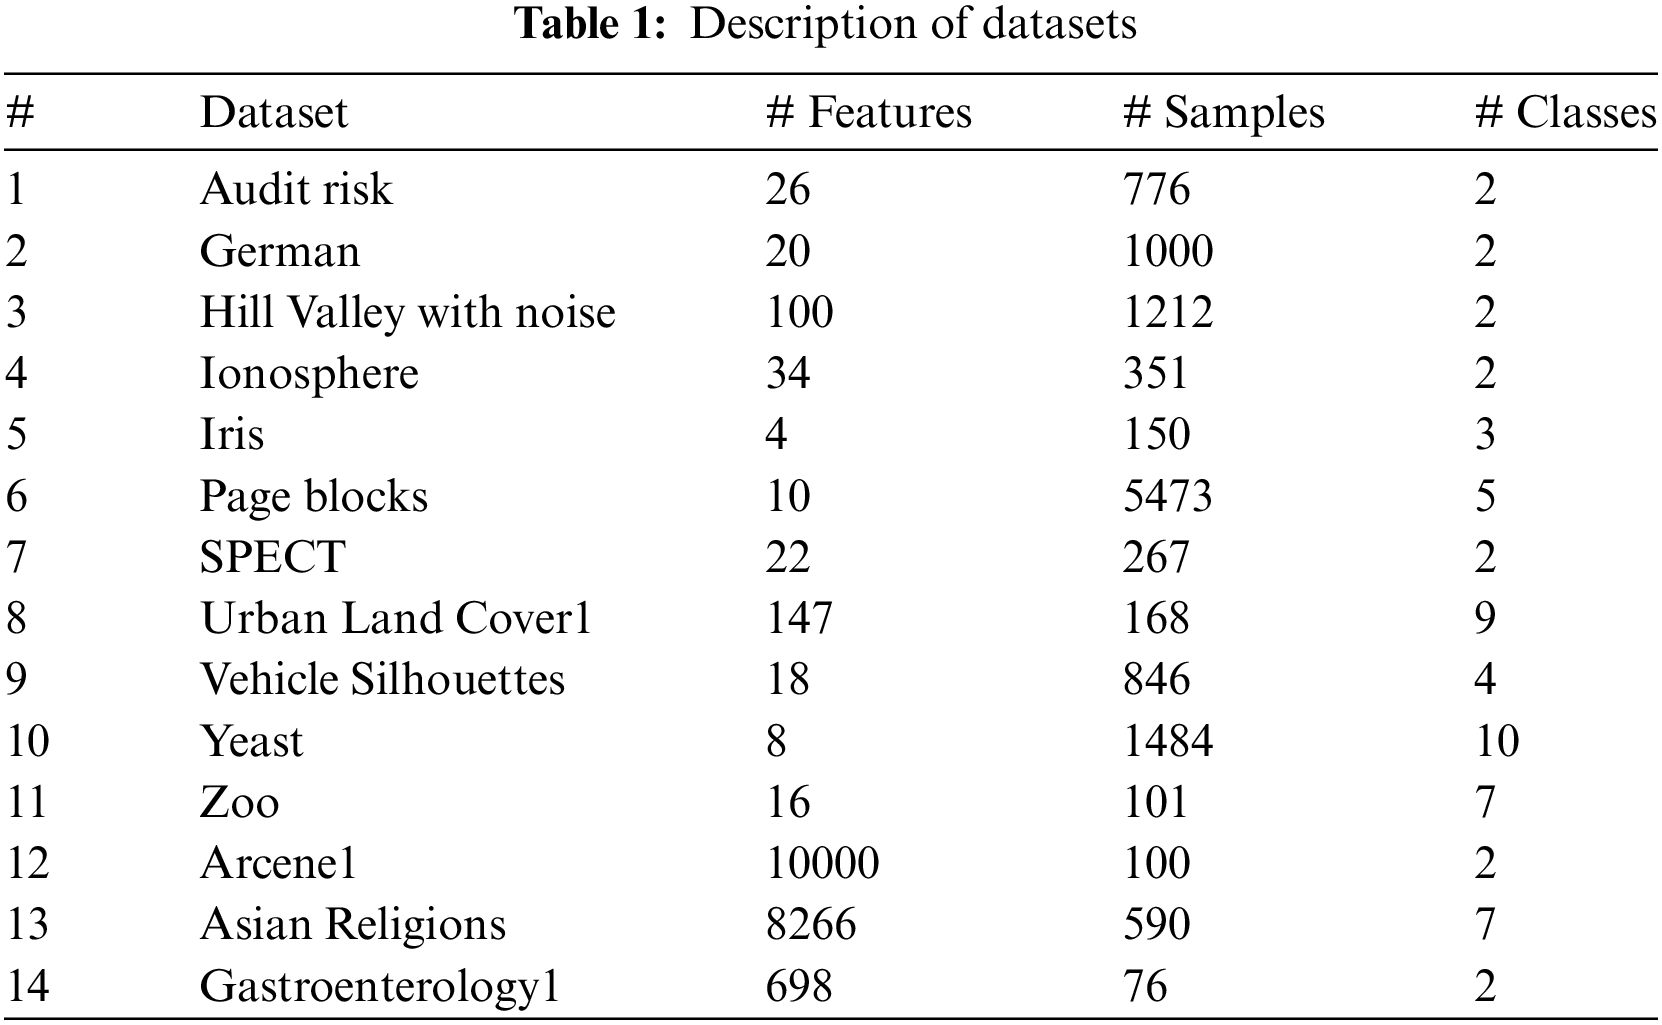
To evaluate the performance of the multi-objective optimization algorithm used in this paper, 14 benchmark datasets are employed. Fourteen datasets are extracted from the UCI Machine Learning repository. These datasets differ in the number of features (attributes) and samples (instances), where three high-dimensional datasets (datasets with far more features than samples) are included. These are arcene1 (Cancer discrimination dataset), Asian Religions (Asian Religious Scriptures study dataset), and gastroenterology1 (Gastroenterology dataset). Table 1 gives the relevant information for the 14 datasets used.
Two objective functions, namely the function to calculate the classification error rate and the function to calculate the ratio of the number of features in the feature subset to the total number of features, also known as the feature proportion, must be generally optimized when solving feature selection problems using the multi-objective optimization algorithm. The minimization objective functions stated in Section 1 are these two functions. The goal of feature selection is generally to reduce both the proportion of features and the classification error rate. These two objectives, however, contradict with one another. The feature percentage and classification error cannot be minimized at the same time.
The feature proportion is used as the first objective function, denoted as f1. It is expressed as the ratio of the number of selected features to the total number of features, and is calculated as shown in Eqs. (20) and (21):
where D is the total number of features and
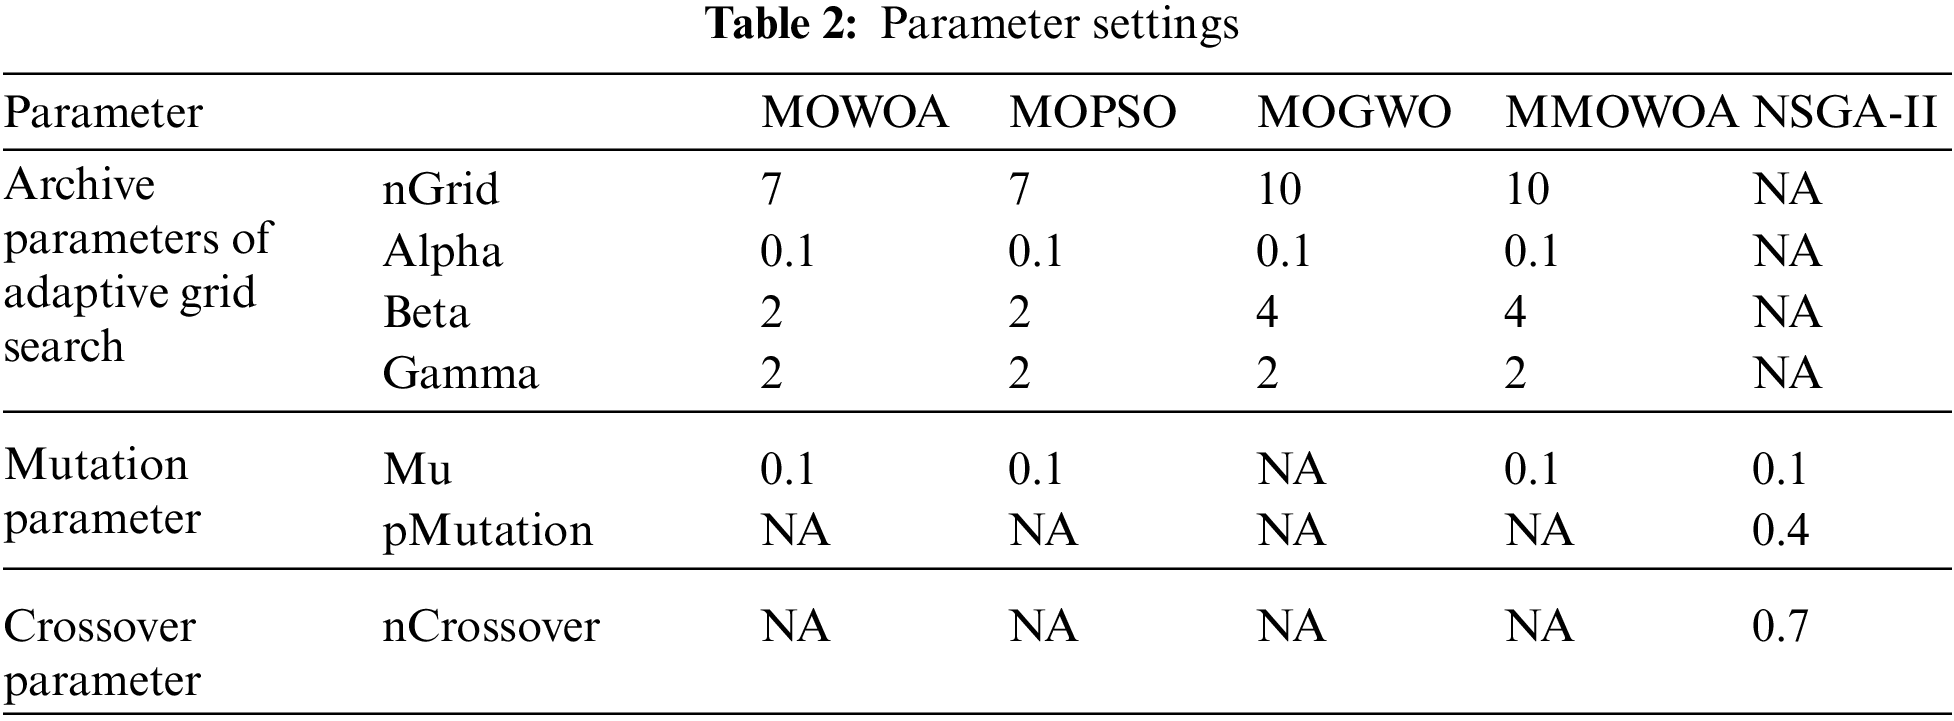
For all algorithms in the experiment in this paper, the population size is set to 20, the archive size is set to 20, the number of iterations is set to 30 and the number of runs is set to 10. Other parameter settings of all algorithms are listed in Table 2.
Various indicators are used in this paper, mainly including second-level measures: error rate (Er), precision, recall, specificity, Jaccard coefficient (Jaccard_index), and third-level indicators: F-score and G-mean. TP, TN, FP and FN are first-level measures. There is also the Feature rate (Fr), the run time, and the HV (hypervolume) measures for the multi-objective algorithm.
1) Error rate: It is determined by dividing the total number of erroneously classified samples by the total number of dataset samples, which is the percentage of incorrect predictions or classifications made by the KNN classifier. In general, the multiobjective optimization technique performs better the lower the classification error rate is. In Eq. (23), the mathematical process is displayed.
2) Precision: It focuses mostly on the outcomes of predictions. The performance of the multi-objective optimization technique improves with increasing accuracy. The following is a list of the calculation equation:
3) Recall: Its primary goal is to assess the actual samples. The multi-objective optimization approach performs better in general the greater the recall rate. Eq. (25) displays the equation for the calculation.
4) Specificity: The basic goal of specificity is to evaluate actual samples. How many of these samples that are genuinely negative are accurately predicted by the KNN classifier is referred to as specificity. The multi-objective optimization approach performs better in general the higher the specificity. In Eq. (26), the mathematical process is displayed (26).
5) Jaccard coefficient: It assesses both the actual sample and the anticipated outcome. When comparing all samples that are actually positive or where the projected result is positive, the Jaccard coefficient shows the likelihood that both the actual and predicted results will be positive. The multi-objective optimization approach generally performs better the higher the Jaccard coefficient index is. Eq. (27) displays the equation for the calculation.
6) F1-score: The harmonic mean of recall and precision is referred to as the F1-score, a third-level measurement. The precision and recall metrics are fully taken into account by the F1-score measurement. In general, the multi-objective optimization technique performs better the higher the F1-score is. In Eq. (28), the calculating process is displayed.
7) G-mean: The third-level measure known as “G-mean” represents the geometric mean of recall and specificity. In this article, it serves as a trade-off between the classification performance of a majority class and a minor class and is frequently used to gauge the degree of data imbalance. The performance of the multi-objective optimization technique generally increases with the size of the G-mean. In Eq. (29), the calculating process is displayed.
8) Hypervolume (HV): The HV denotes the area’s volume in the objective space that is bounded by the non-dominated solution set and the predetermined reference point that was produced by the multi-objective optimization technique. Without knowing the true Pareto Front, it can be used to assess the search outcomes of multi-objective optimization problems as well as the convergence and variety of multi-objective optimization techniques. Generally speaking, the multi-objective optimization technique performs better the higher the HV value is. Eq. (30) displays the equation for the calculation.
where
9) Feature rate (Fr): The term “Feature rate” (Fr) describes the proportion of features in a feature subset to all features. The multi-objective optimization approach performs better in general the lower the feature rate. Eqs. (31) and (32) illustrate the calculating process.
Four multi-objective evolutionary algorithms including MOWOA, MOGWO [59], MOPSO [58] and NSGA-II [60] are chosen as the benchmark methods compared with the proposed MSMOWOA. MOWOA is the multi-objective version of Whale Optimization Algorithm [30]. MOWOA, MOGWO and MOPSO are implemented by proposing an archive, grid and leader selection mechanism based on origin WOA, GWO and PSO. NSGA-II is based on fast nondominated sorting approach and crowding distance.
The section shows the results obtained by the proposed algorithm. First, the proposed algorithm MSMOWOA is compared with the original MOWOA in terms of various indicators. Then, in order to verify the performance of MSMOWOA, it is compared with other multi-objective evolutionary algorithms. Finally, the Wilcoxon rank sum test and Friedman test are employed to test the significant difference of MSMOWOA according to HV.
5.1 Comparisons of Origin MOWOA and the Proposed MSMOWOA
Table 3 compares the performance of the improved multi-objective whale algorithm with that of the original multi-objective whale algorithm on 14 data sets. Average error rate (Er), Precision, Recall, Specificity, Jaccard coefficient, F-score, G-mean, HV, and Feature rate (Fr) are evaluated. AVG represents the average value and STD represents the standard deviation value of the unbiased estimate in the Table 3.
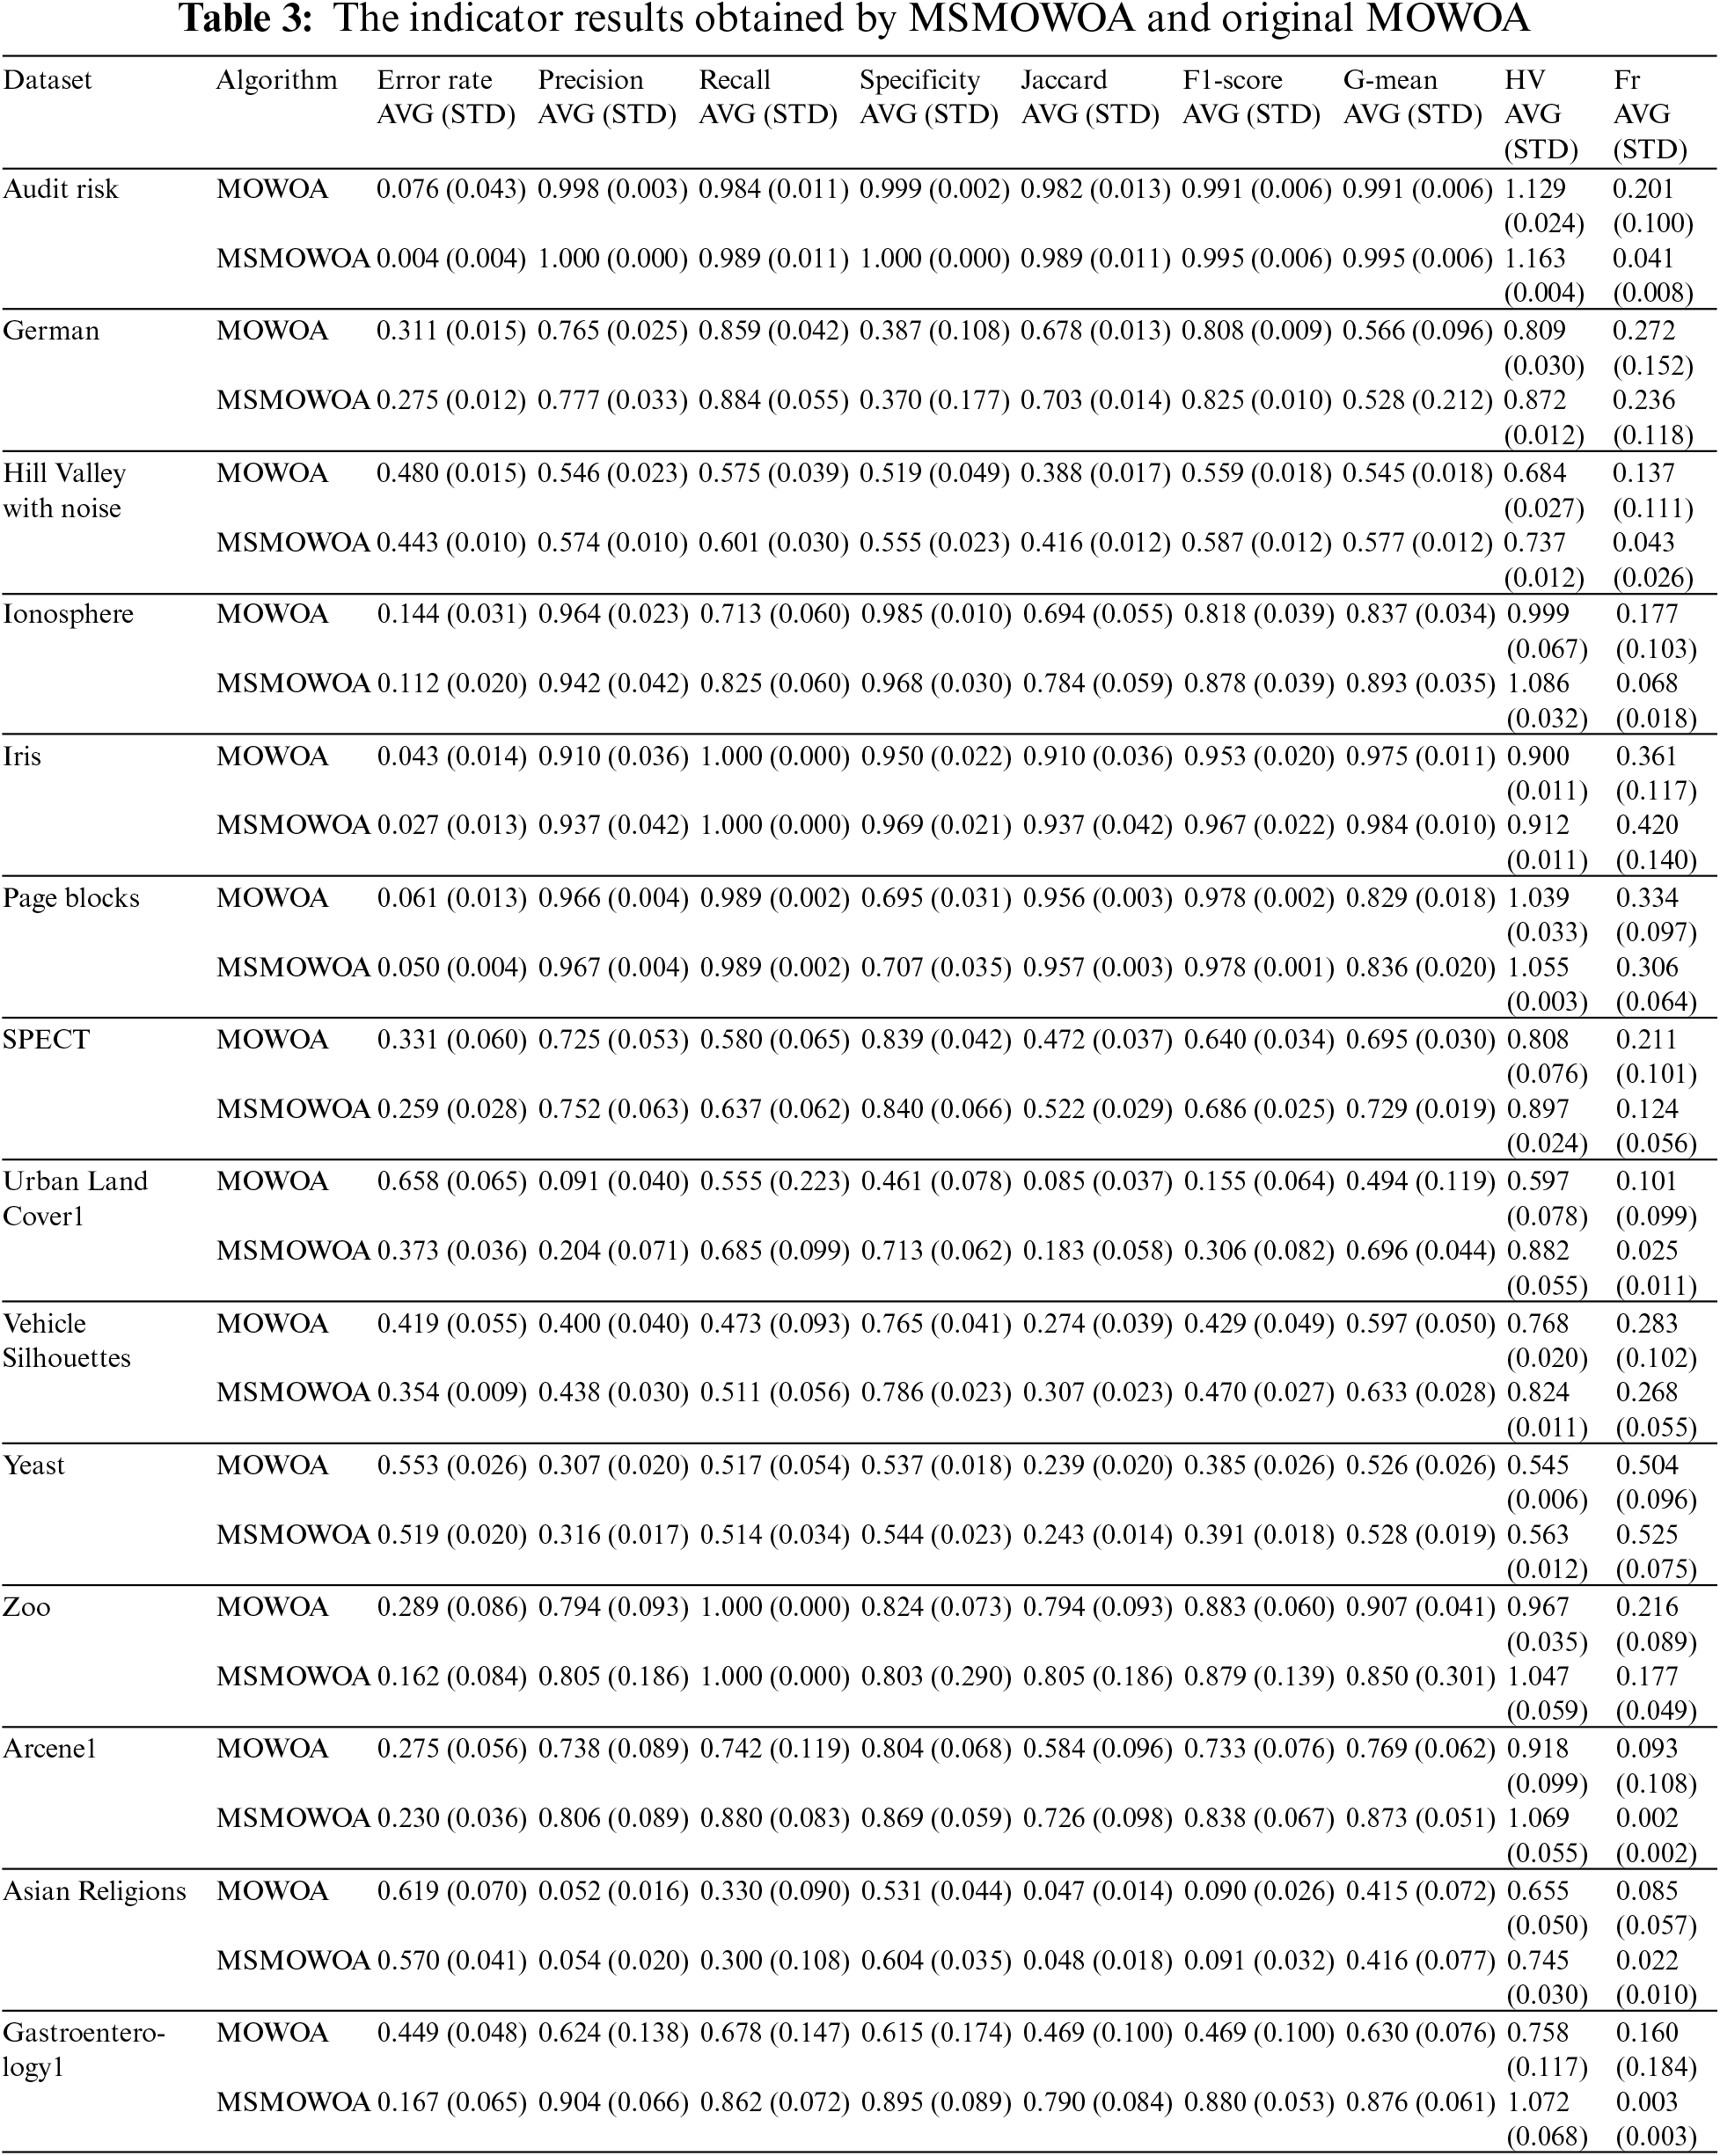
In terms of the average error rate, compared with the original multi-objective whale algorithm, the proposed multi-strategy multi-objective whale algorithm MSMOWOA has achieved a lower classification error rate on all 14 data sets (100% of the data sets), and the performance of MSMOWOA is improved significantly. In terms of the average feature rate, MSMOWOA obtains a lower feature rate on 86% of the datasets, which also means that the feature number reduction rate (RR) of MSMOWOA algorithm is higher on 86% of the datasets. In Fig. 4, average feature rates obtained by MSMOWOA and other compared algorithms on the 14 datasets are shown using radar map.
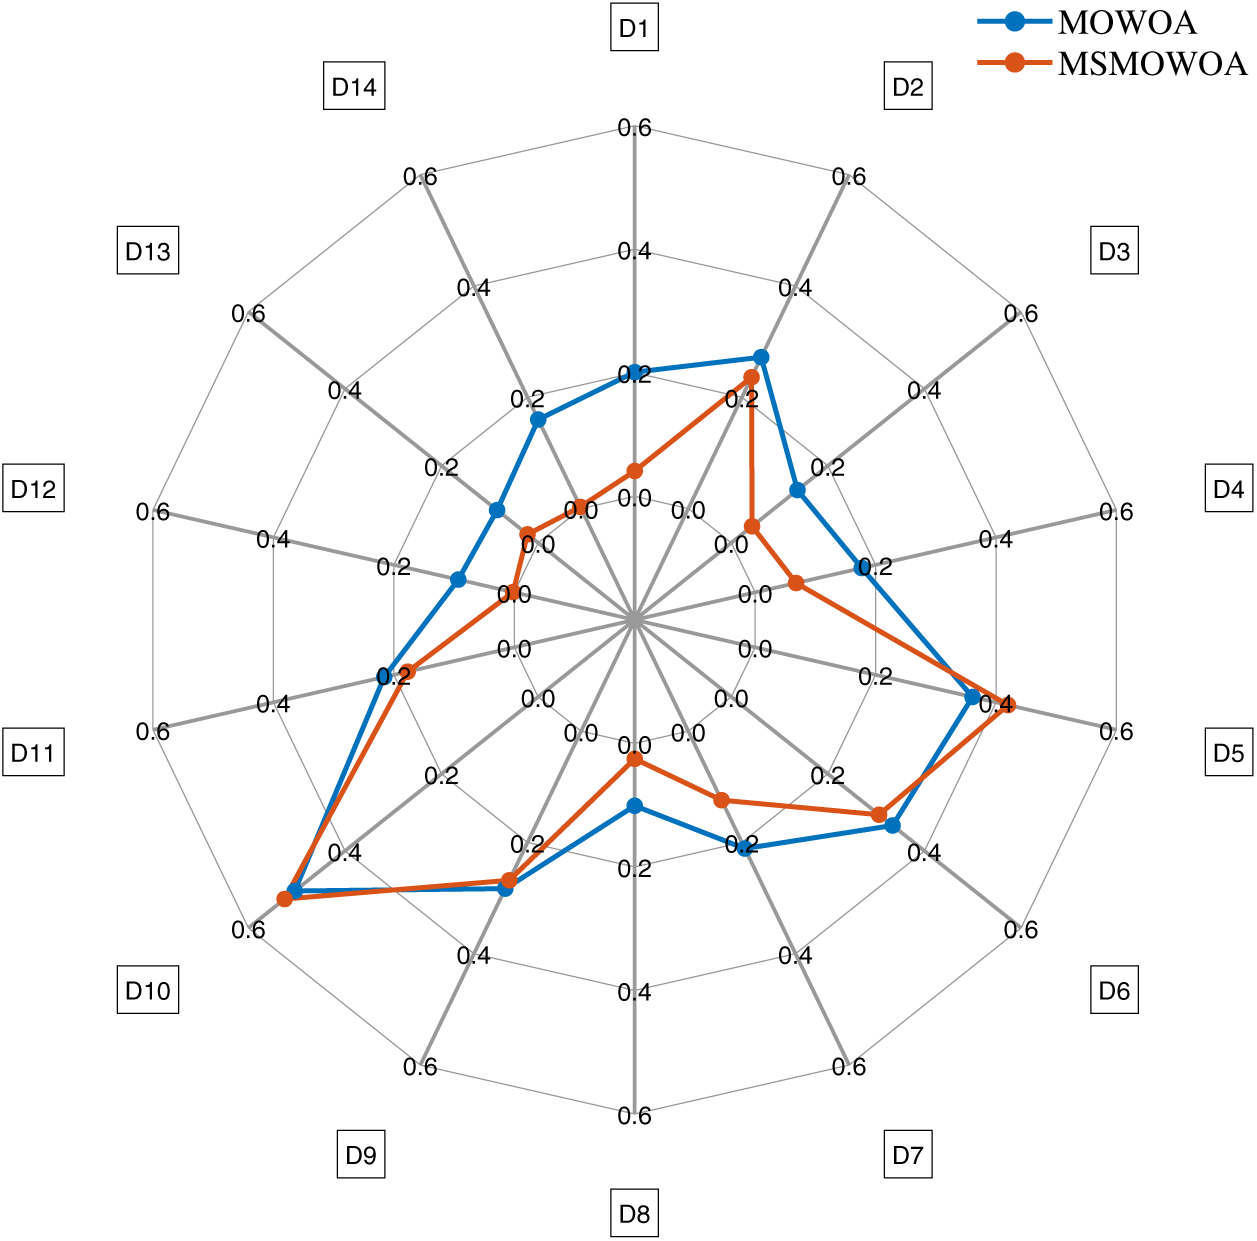
Figure 4: Average feature rate obtained by MSMOWOA and MOWOA on 14 datasets. D1 (audit risk), D2 (German), D3 (Hill Valley with noise), D4 (ionosphere), D5 (Iris), D6 (page blocks), D7 (SPECT), D8 (Urban Land Cover1), D9 (Vehicle Silhouettes), D10 (Vehicle Silhouettes), D11 (zoo), D12 (arcene1), D13 (Asian Religions) and D14 (gastroenterology1)
In terms of average precision, MSMOWOA outperforms MOWOA in 93% of datasets. In terms of average Recall, MSMOWOA also outperforms MOWOA in 71% of the datasets and achieves the same recall with MOWOA in the iris, page blocks, and zoo datasets. As for average Specificity, MSMOWOA is superior to MOWOA in 79% of datasets. From the perspective of Jaccard coefficient, MSMOWOA obtains higher Jaccard coefficient on all 14 datasets, namely 100% of the datasets.
For the third-level indicator F1-score, MSMOWOA gets a higher F-score on 86% of the datasets, and both MSMOWOA and MOWOA obtain the same F1-score on the page blocks dataset. For another third-level index G-mean, MSMOWOA also obtains a higher G-mean on 86% of the datasets.
From the HV, MSMOWOA achieves higher HV value on all 14 datasets, namely 100% of the datasets, and the convergence and diversity of the proposed multi-objective whale algorithm are significantly improved. However, due to the mixed Grey Wolf algorithm which is more complex than the original whale algorithm and the adaptive mutation strategy, the complexity of MSMOWOA is increased. As a result, the average running time of the proposed multi-objective whale algorithm on all data sets is higher than that of the original MOWOA algorithm to a different extent.
The average Pareto Front comparing MSMOWOA and MOWOA across all datasets is shown in Fig. 5. It can be clearly seen from the figure that the MSMOWOA algorithm has achieved the lowest classification error rate on all 14 datasets (100% of the datasets), and the classification performance of the MSMOWOA is quite obvious compared with that of MOWOA.
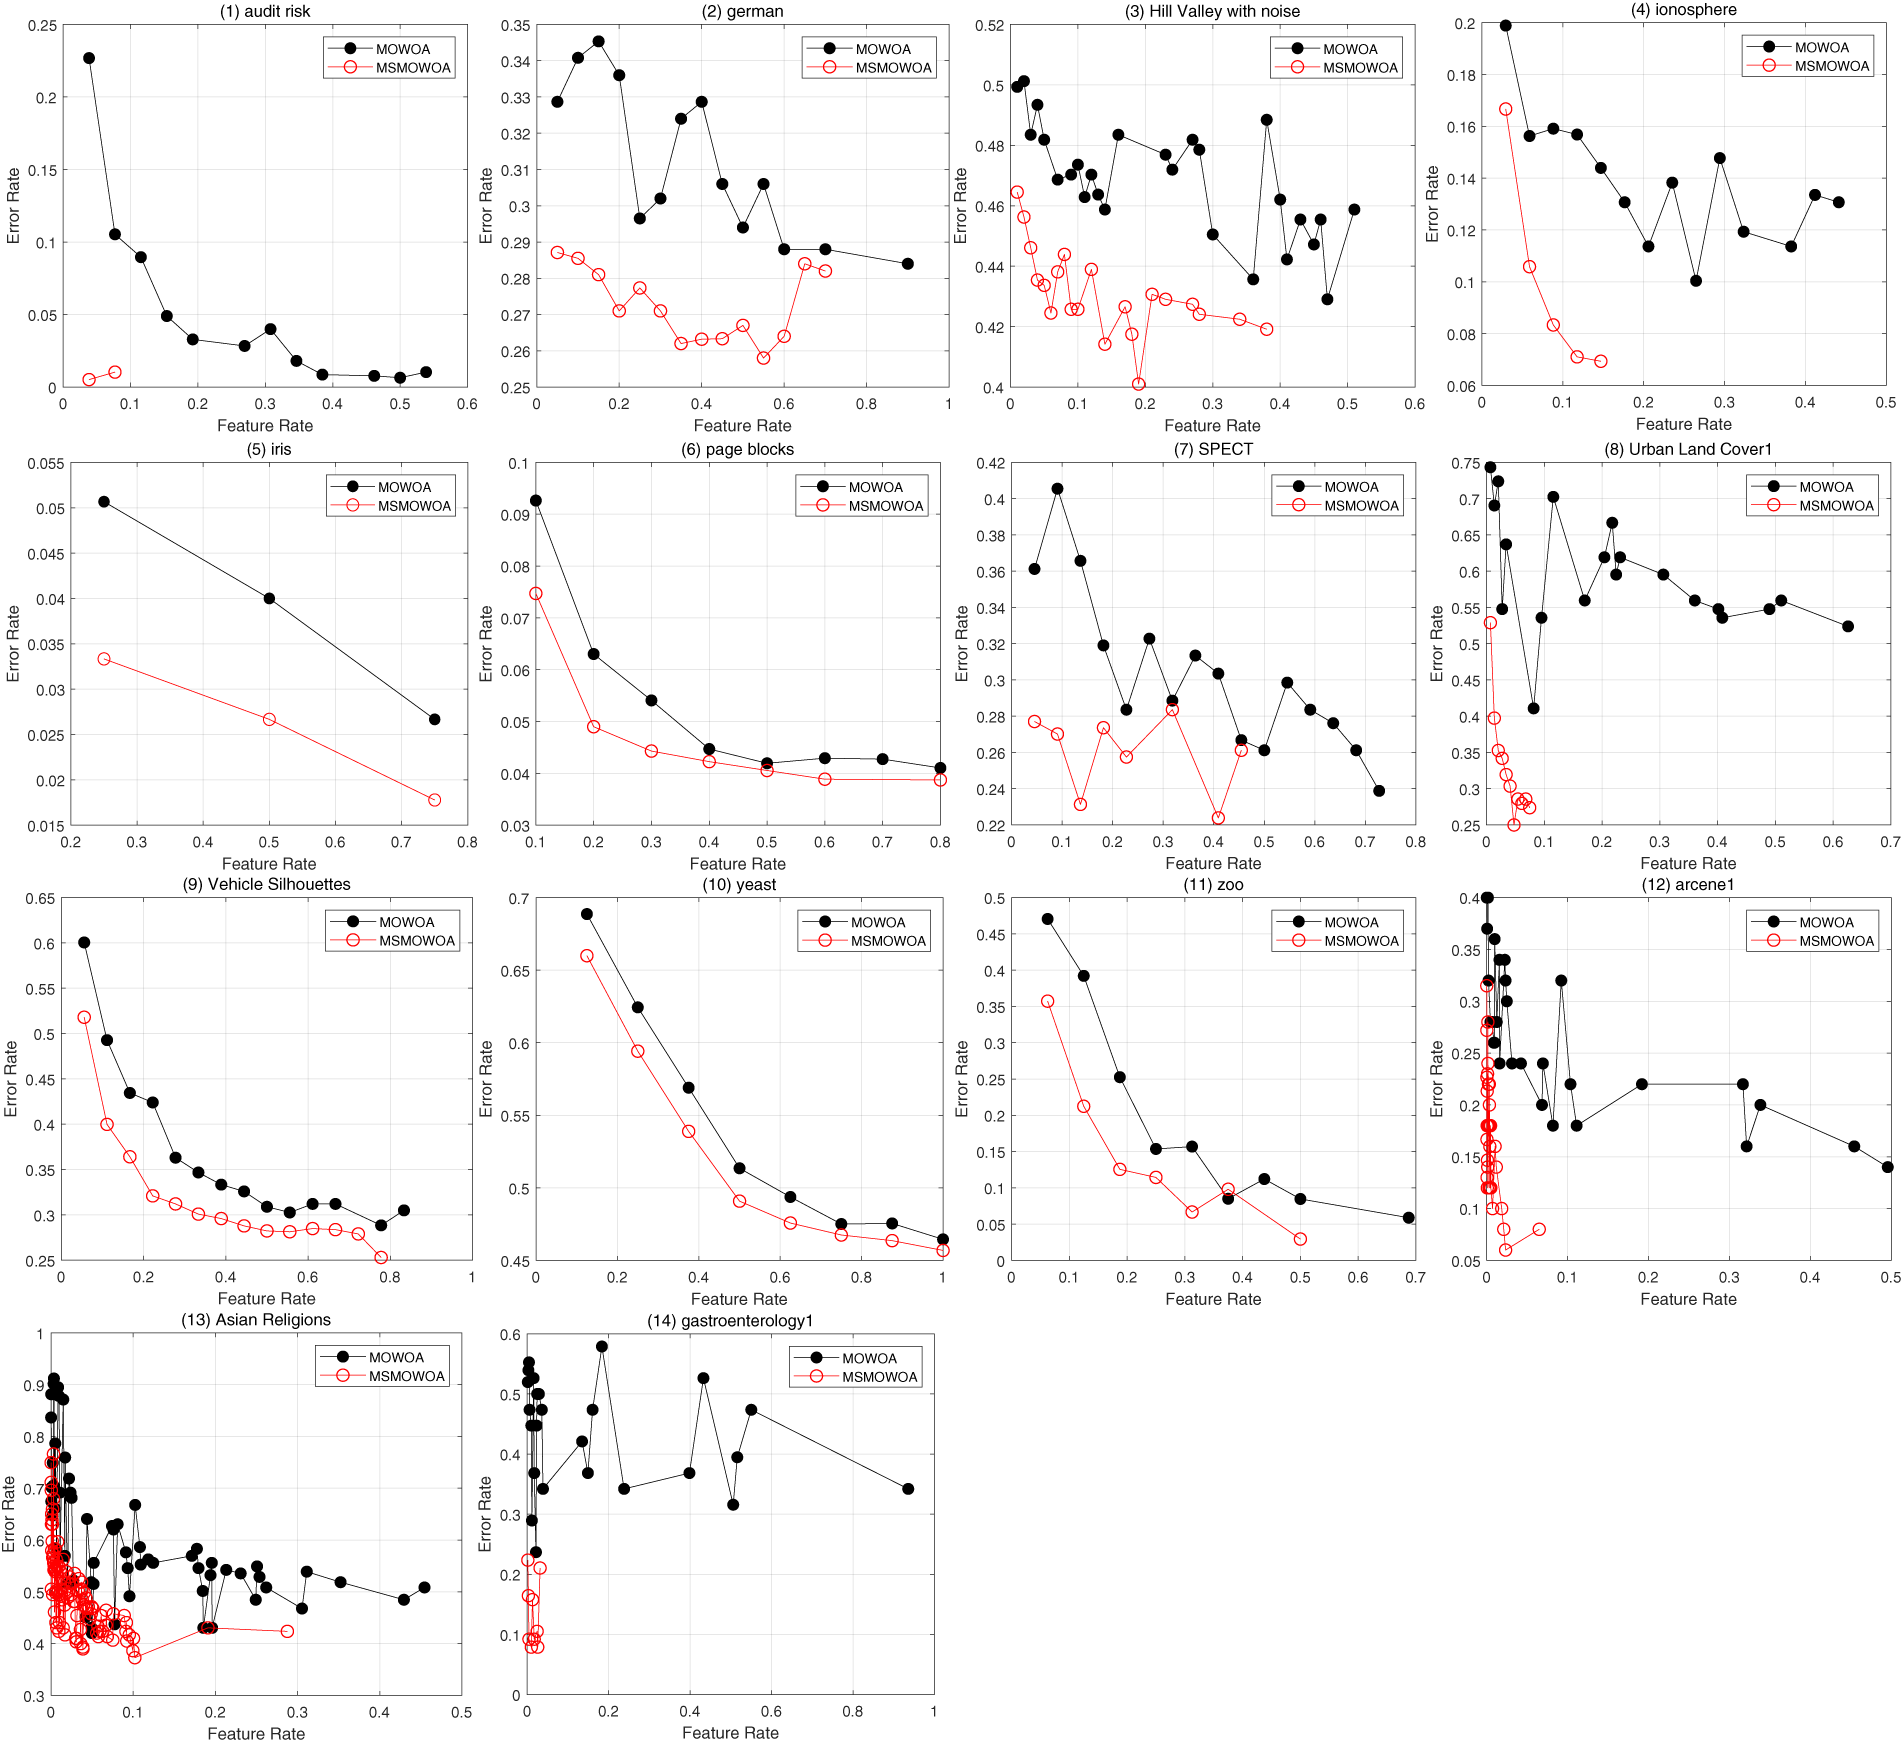
Figure 5: Average Pareto front obtained by MSMOWOA and MOWOA on 14 datasets
5.2 Comparisons of the Proposed MSMOWOA and Other Algorithms
Table 4 compares the performance of the proposed multi-objective whale algorithm with other commonly used multi-objective optimization algorithms on 14 datasets. Average error rate (Er), Precision, Recall, Specificity, Jaccard coefficient, F1-score, G-mean, HV, Feature rate (Fr), and Running time are computed. AVG represents the average value and STD denotes the standard deviation value of the unbiased estimate in Table 4.
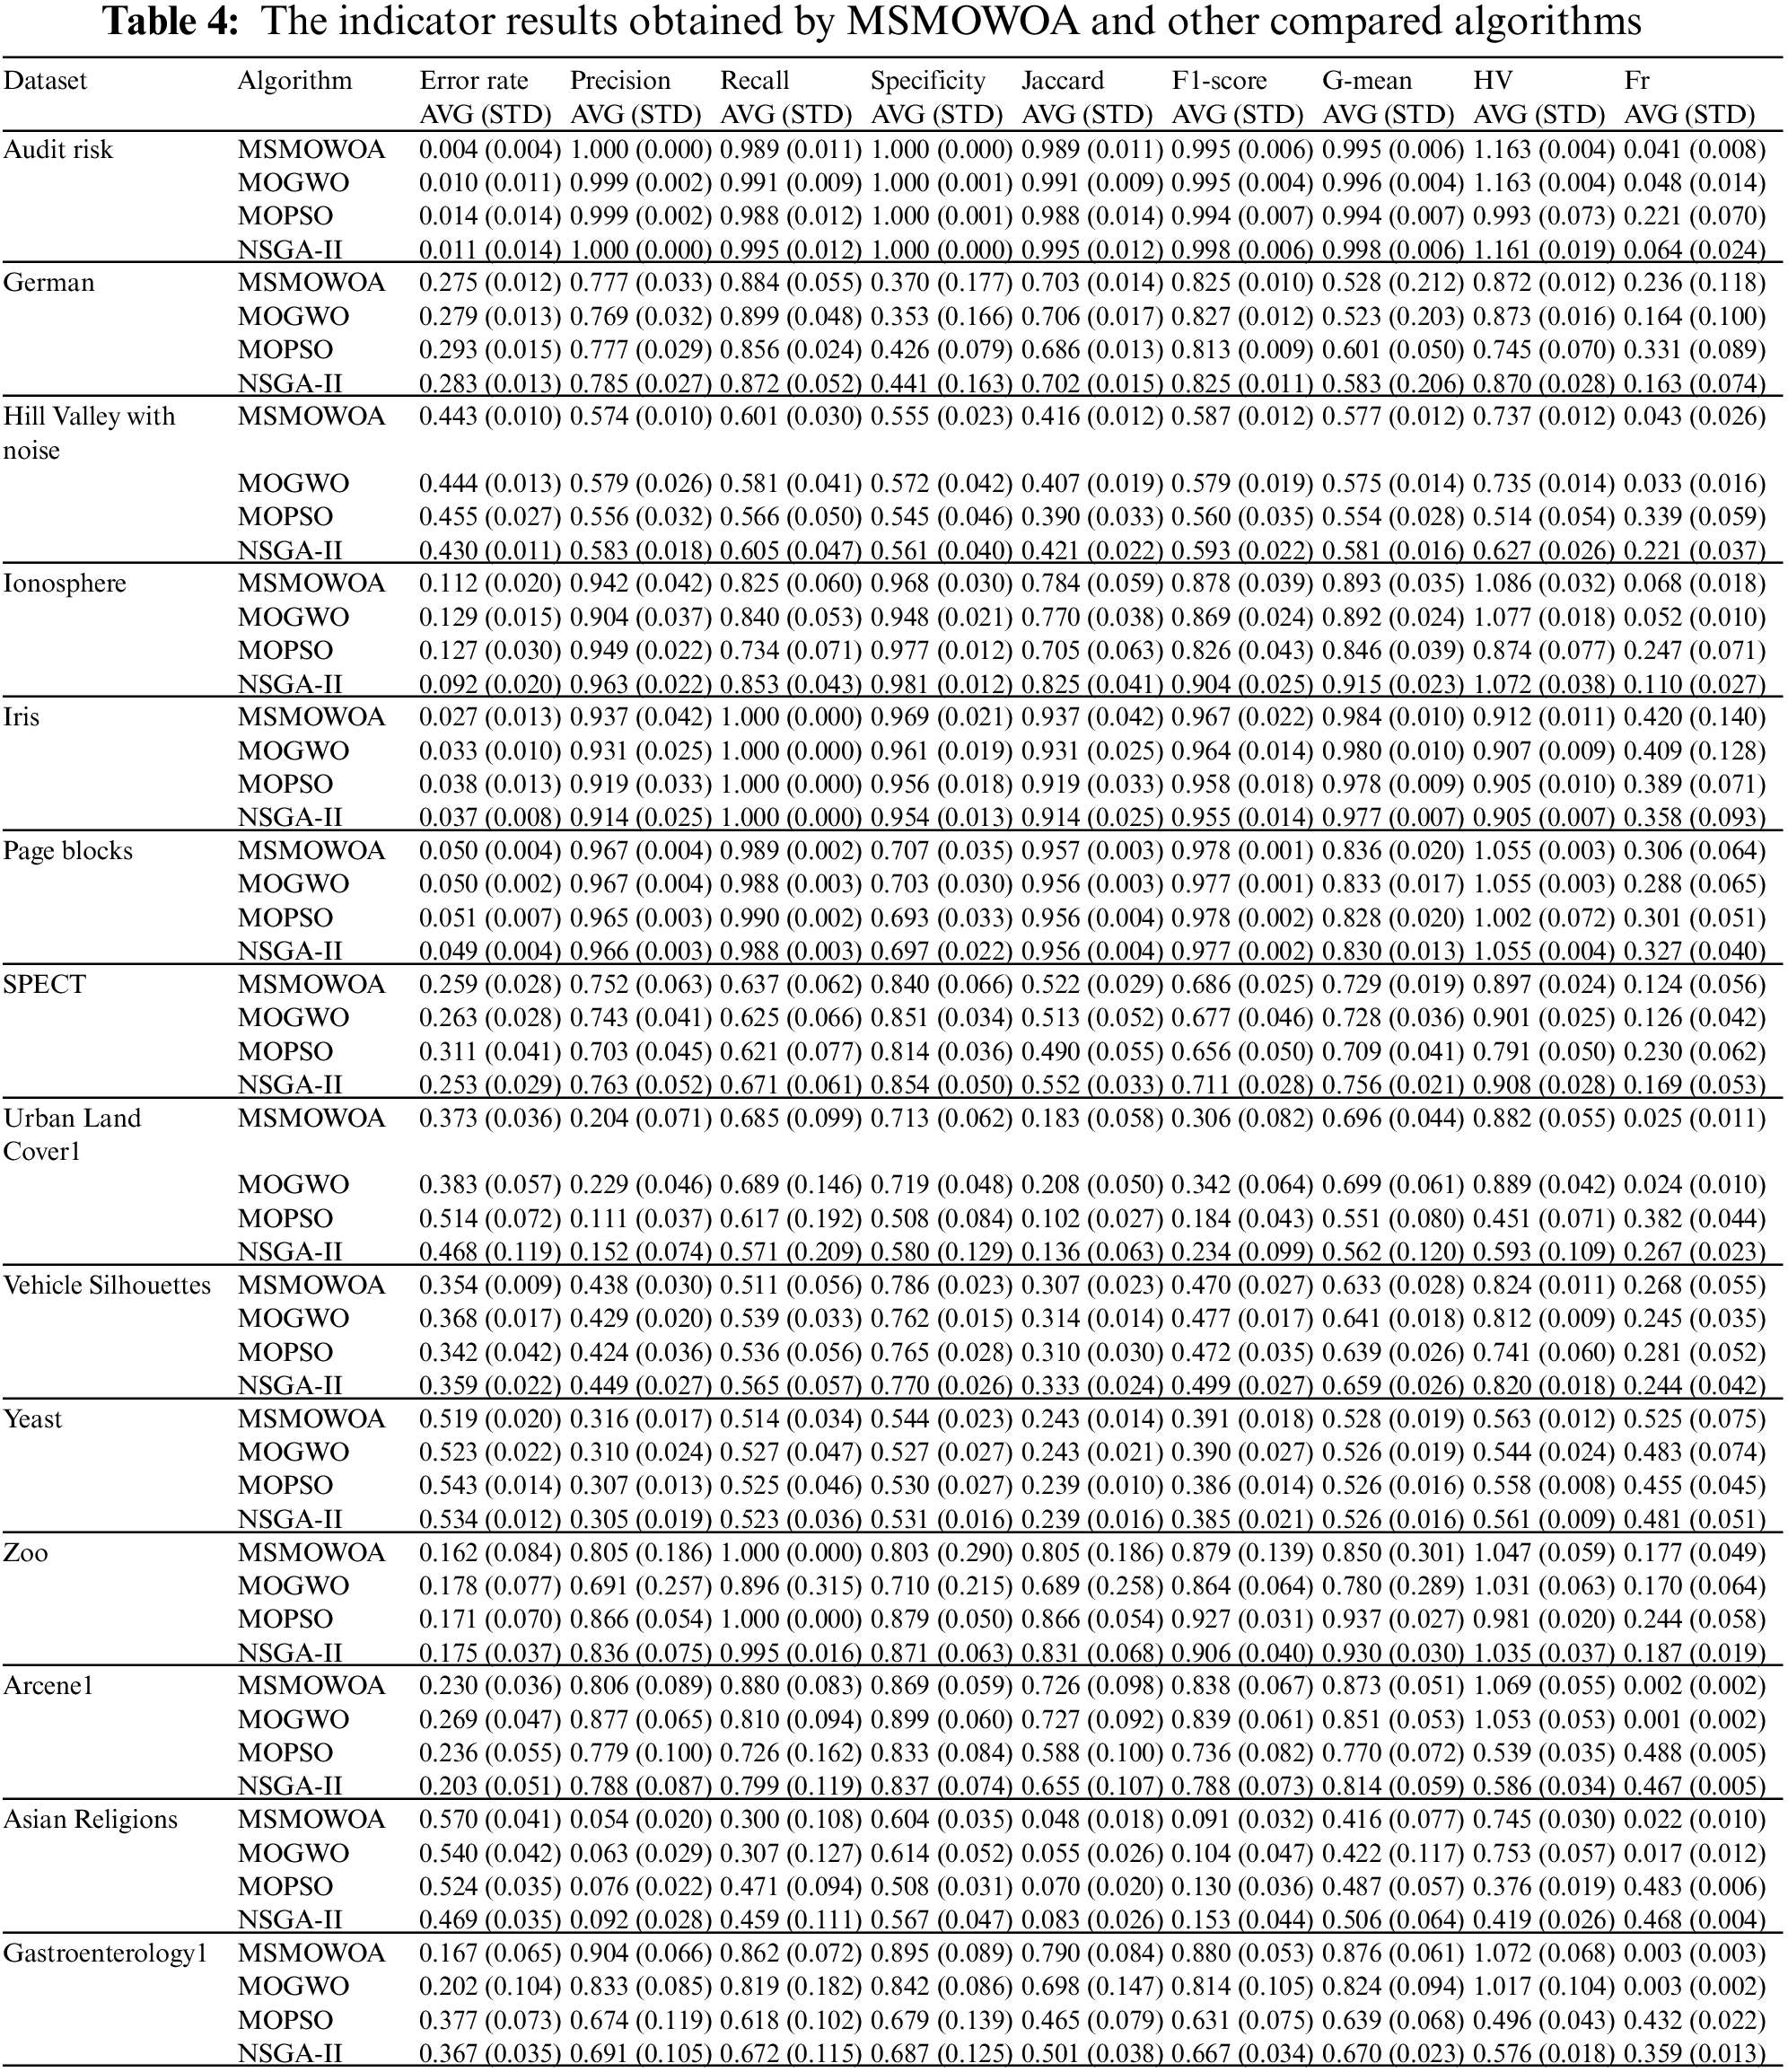
In terms of average error rate, compared with the other three multi-objective optimization algorithms, the proposed MSMOWOA achieves the lowest classification error rate among the four algorithms on 7 data sets (50% data sets), and the top two lowest classification error rate on 13 data sets (93% data sets). It is proved that the proposed MSMOWOA has a remarkable effect even compared with several popular multi-objective optimization algorithms. In terms of average feature rate, MSMOWOA can get a lower feature proportion on 14% of the datasets, but obtain the top two feature rate on 64% of the datasets, which also means that the feature reduction rate (RR) of MSMOWOA ranks the second position among the four multi-objective optimization algorithms on 64% of the datasets. In Fig. 6, average feature rates obtained by MSMOWOA and other compared algorithms on the 14 datasets are shown using radar map.
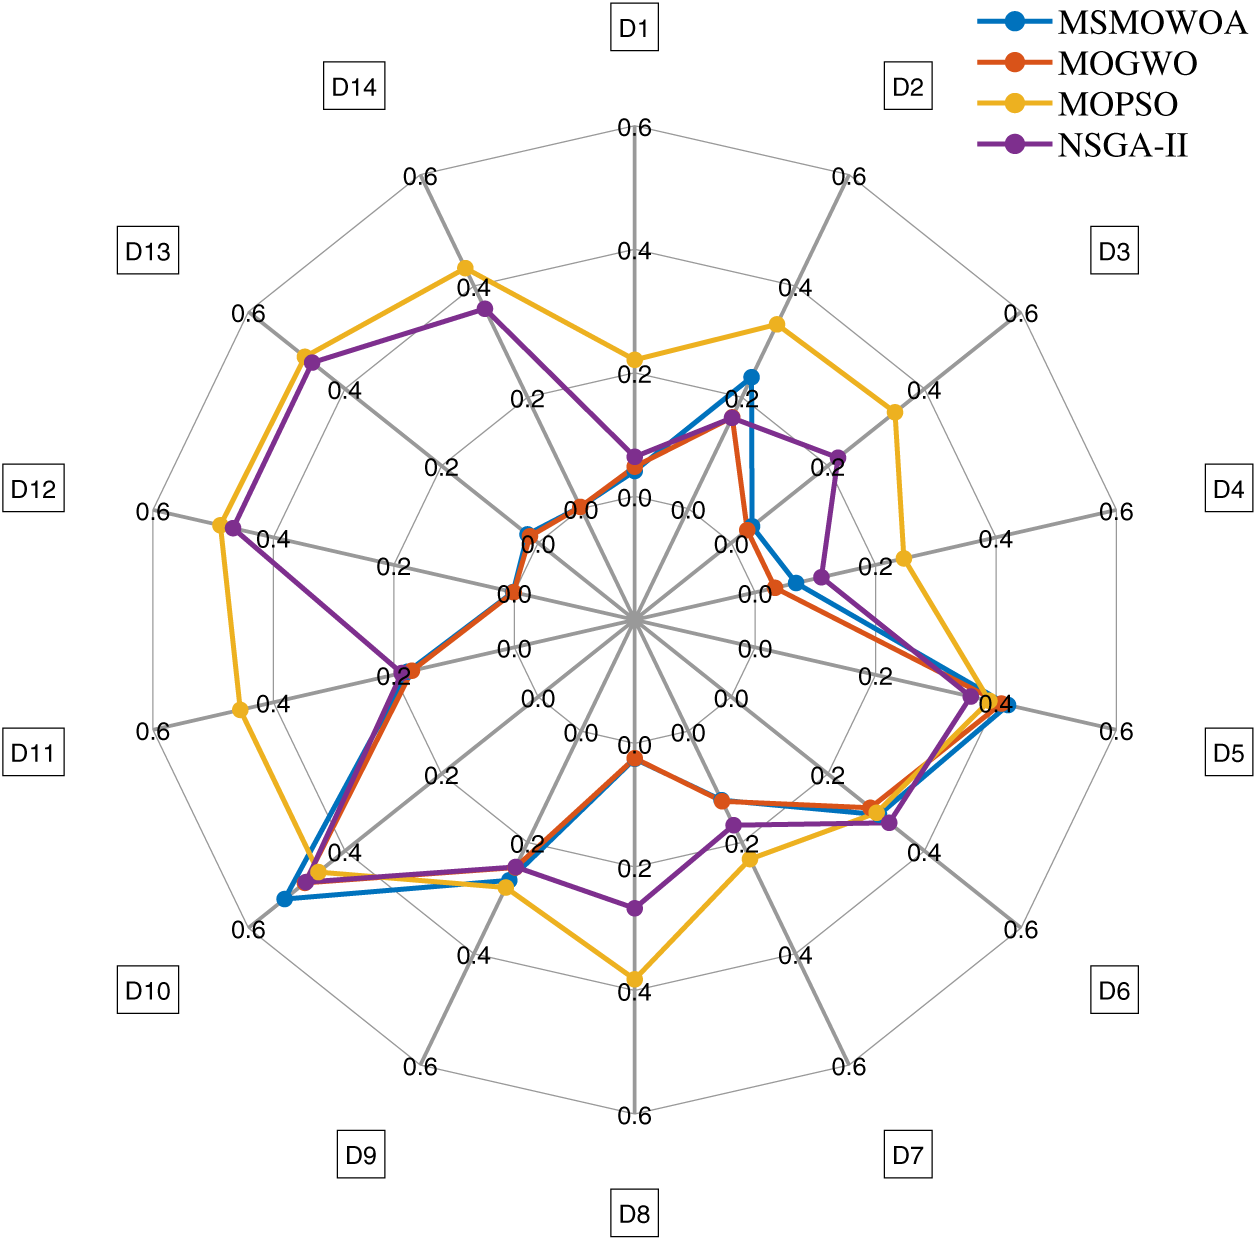
Figure 6: Average feature rate obtained by MSMOWOA and others compared algorithms on 14 datasets. D1 (audit risk), D2 (German), D3 (Hill Valley with noise), D4 (ionosphere), D5 (Iris), D6 (page blocks), D7 (SPECT), D8 (Urban Land Cover1), D9 (Vehicle Silhouettes), D10 (Vehicle Silhouettes), D11 (zoo), D12 (arcene1), D13 (Asian Religions) and D14 (gastroenterology1)
For the third-level measure F1-score, MSMOWOA obtains the highest F1-score value in 21% of the datasets, and the top two average F1-score value in 79% of the datasets. For another third-level indicator G-mean, MSMOWOA obtains the highest G-mean in 36% of the datasets, and the top two average G-means in 64% of the datasets.
With respect to HV, MSMOWOA achieves higher HV value at 10 datasets, namely 71% of the datasets, which fully indicates that MSMOWOA still achieves very good convergence and diversity compared with other multi-objective optimization algorithms. In terms of the average running time, MSMOWOA combines the grey Wolf algorithm with high time complexity and utilizes adaptive mutation strategy, which greatly increases the algorithm complexity. On all the 14 datasets, the lowest average running time of the algorithm is not achieved. The second lowest average running time of the algorithm is obtained in 21% of the datasets, and the top three lowest average running time of the algorithm is obtained in 79% of the datasets.
Average Pareto Front plots of MSMOWOA, MOGWO, MOPSO, and NSGA-II are compared on the all datasets, as shown in Fig. 7. It can be clearly seen from the figure that MSMOWOA algorithm has achieved the lowest classification error rate on 7 datasets, namely 50% of the datasets, and the classification performance of MSMOWOA is remarkable.
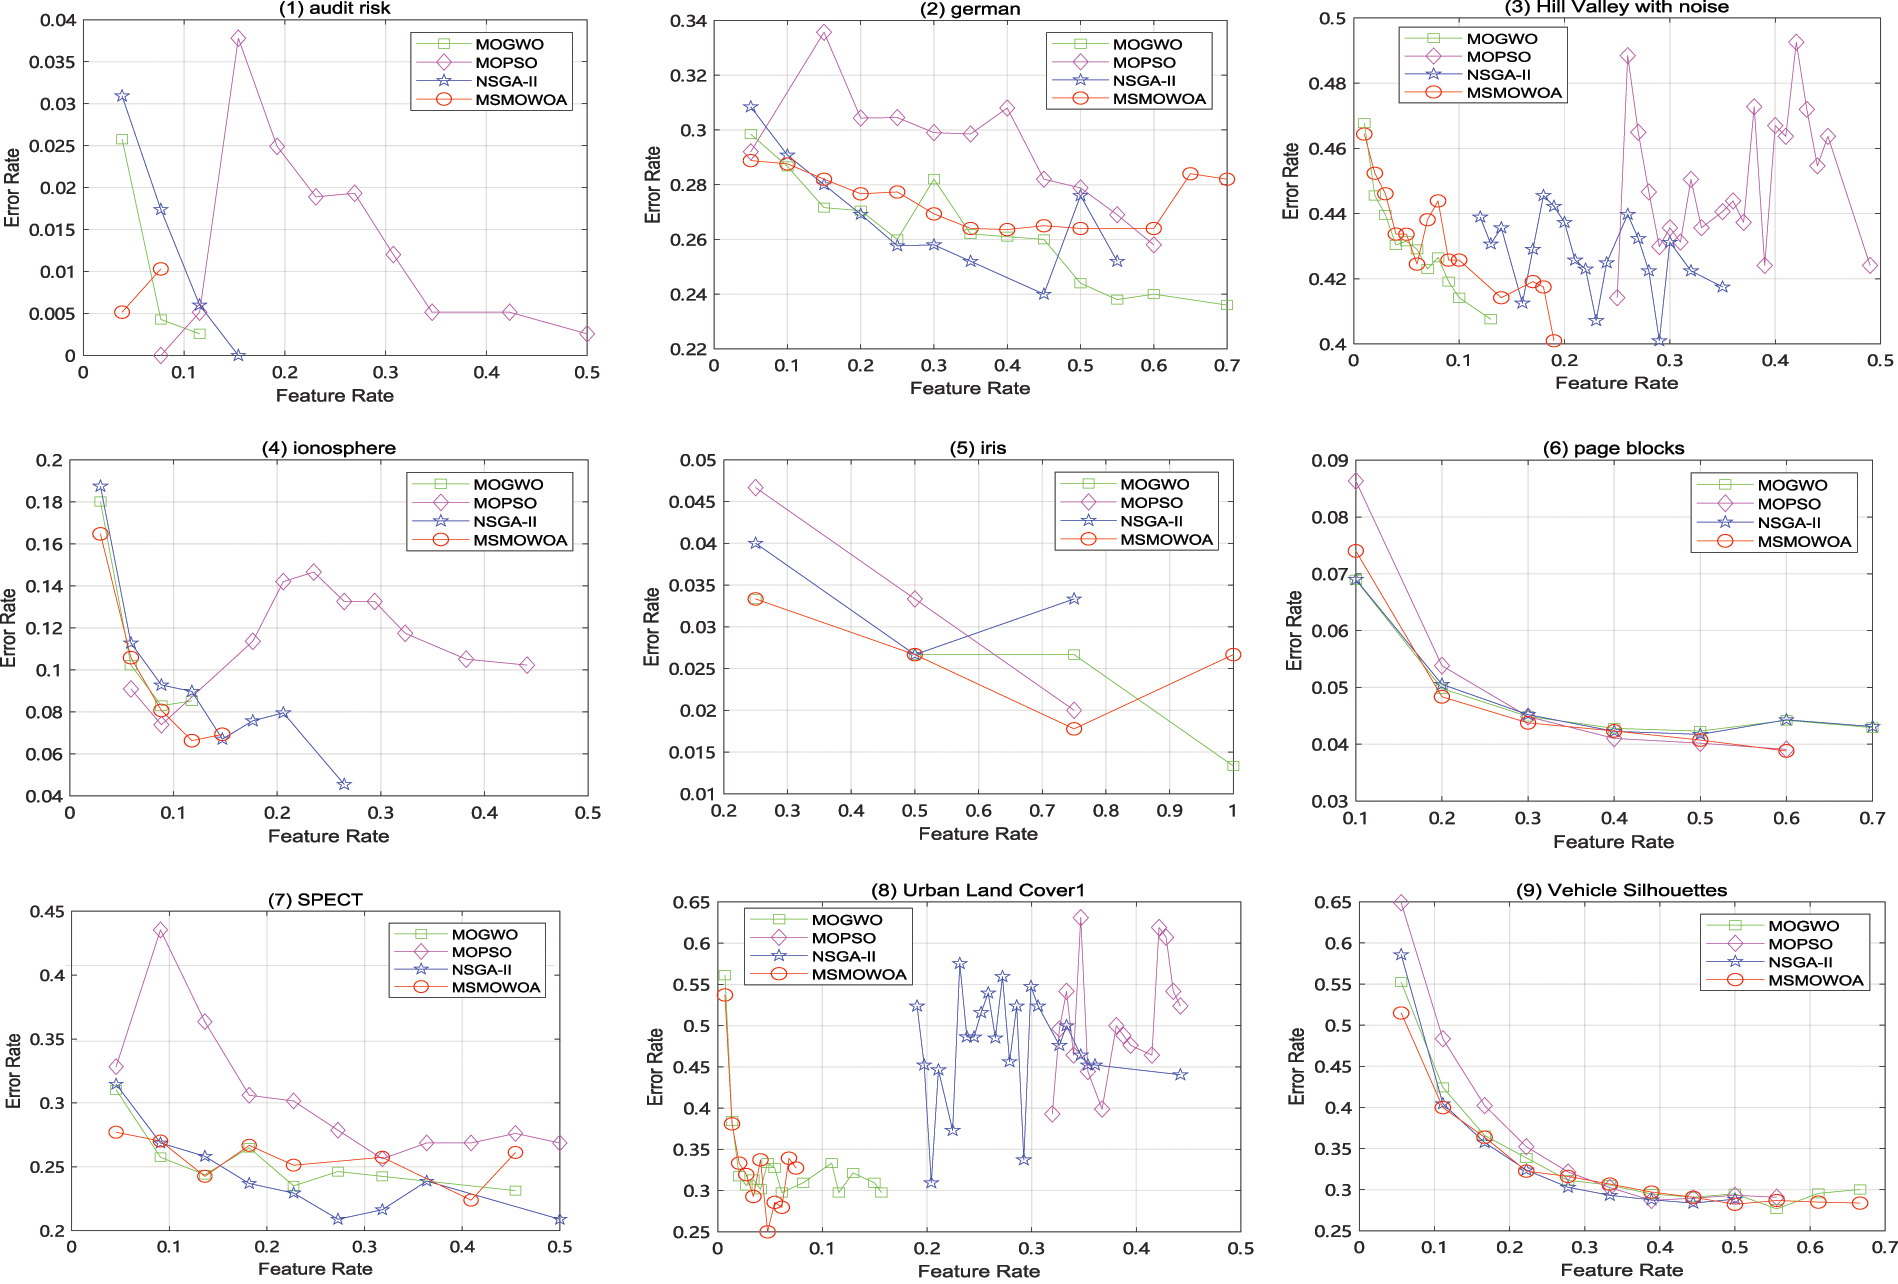
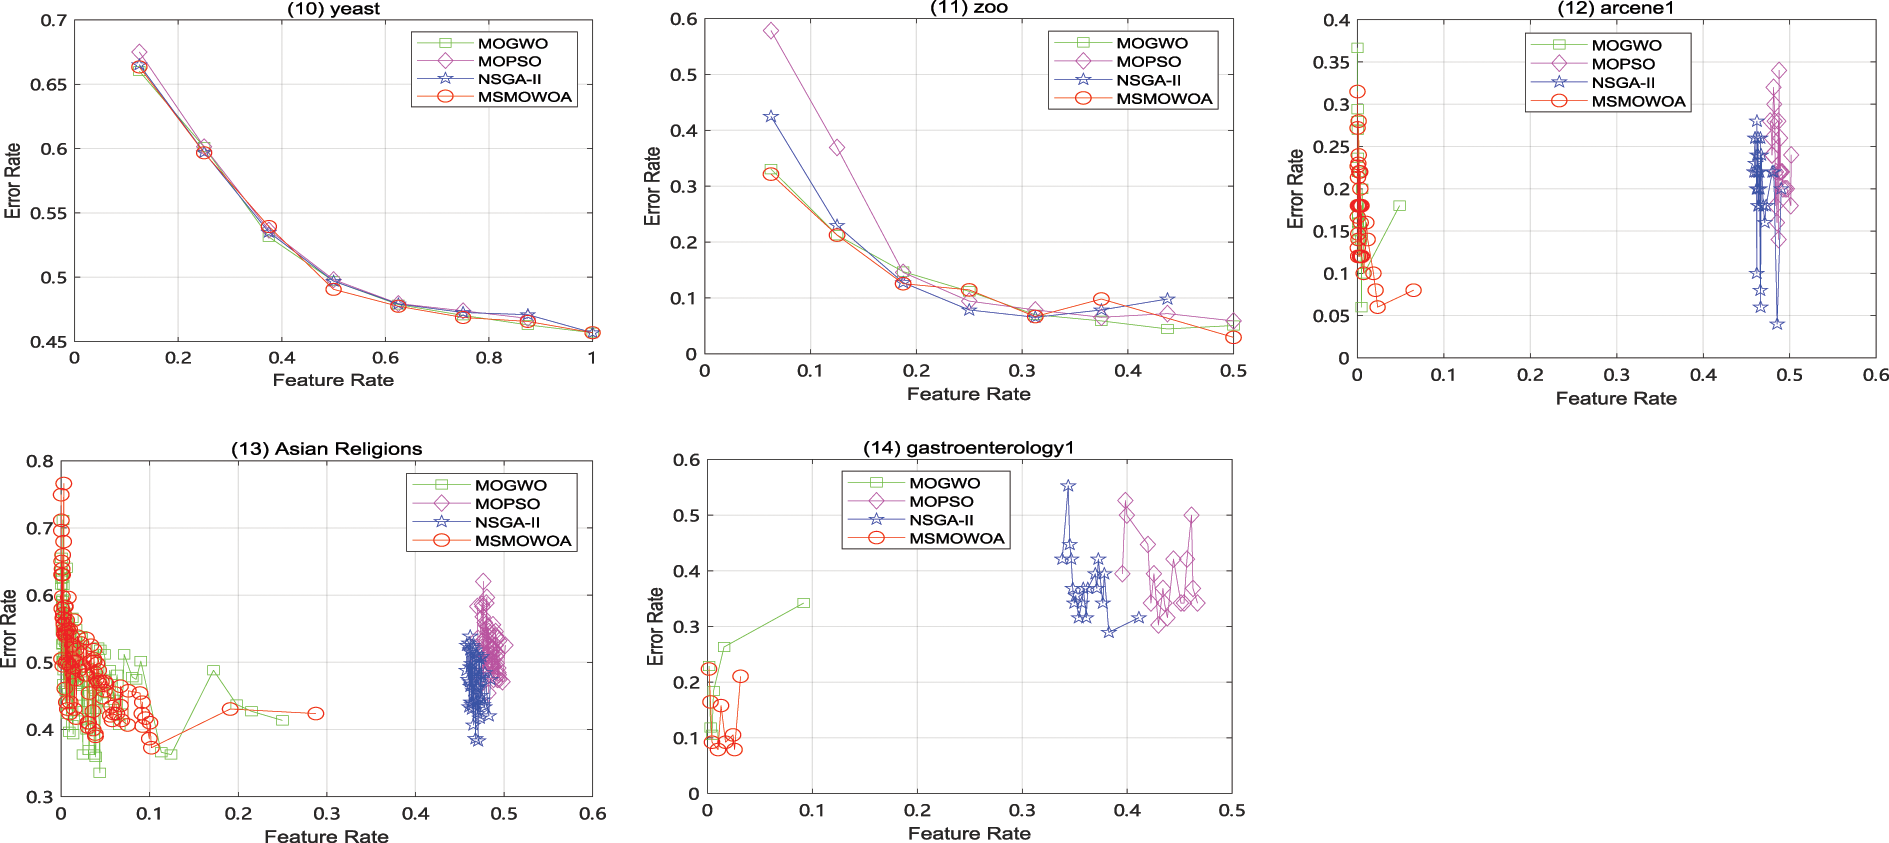
Figure 7: Average Pareto front obtained by MSMOWOA and others compared algorithms on 14 datasets
In order to more clearly show the performance of the proposed MSMOWOA, the Wilcoxon rank sum test and Friedman test are used to test statistical experimental results. The Wilcoxon rank sum test is performed with respect to HV indicator, which can simultaneously evaluate the convergence and diversity of the multi-objective optimization algorithm. Original hypothesis H0: there is no difference in the multi-objective whale algorithm before and after the improvement; New hypothesis H1: there is a significant difference in the multi-objective whale algorithm before and after the improvement. The significance level alpha is set at 0.05, and the results of Wilcoxon’s rank sum test are shown in Table 5.
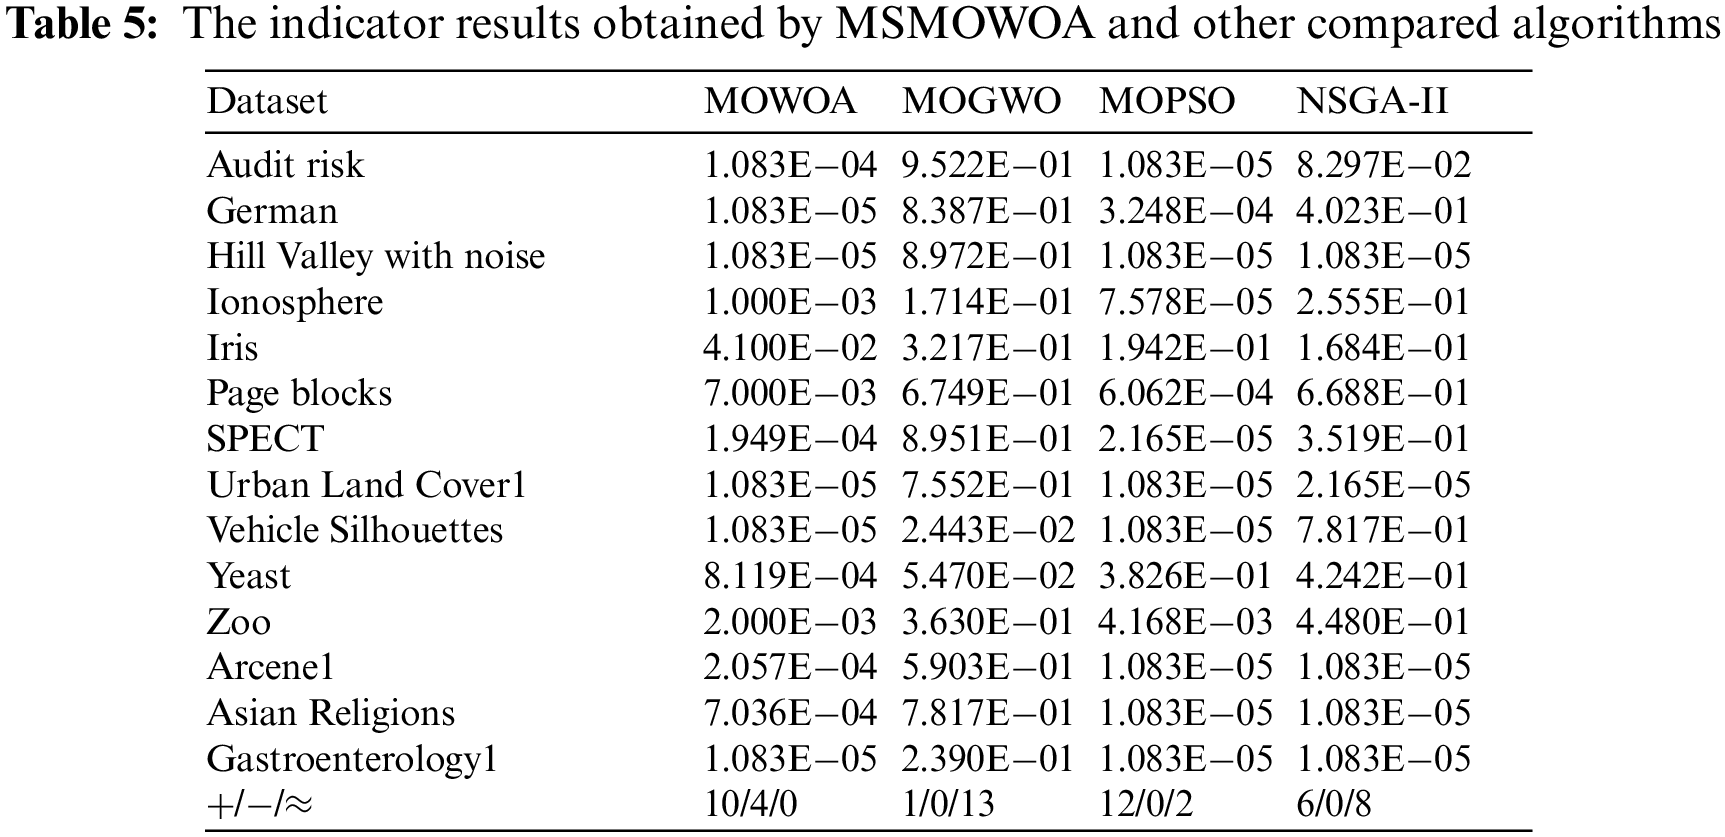
From Table 5, it is seen that the probability (p value) of Wilcoxon rank sum test production is less than 0.05 for all datasets. This indicates that the null hypothesis H0 is strongly rejected at a significance level of 0.05.Therefore, there are significant differences between the proposed multi-objective whale algorithm and the original multi-objective whale algorithm and other algorithms. Compared with MOWOA, MOPSO and NSGA-II, the HV obtained by the proposed MSMOWOA is statistically significant, and is not obtained by chance for the dataset used. However, for MOGWO, MSMOWOA did not gain significant advantages on most datasets, but MSMOWOA can obtain that the number of the best HV value is the most. The reason may be that the optimization strategy of GWO is integrated into the proposed MSMOWOA to improve performance.
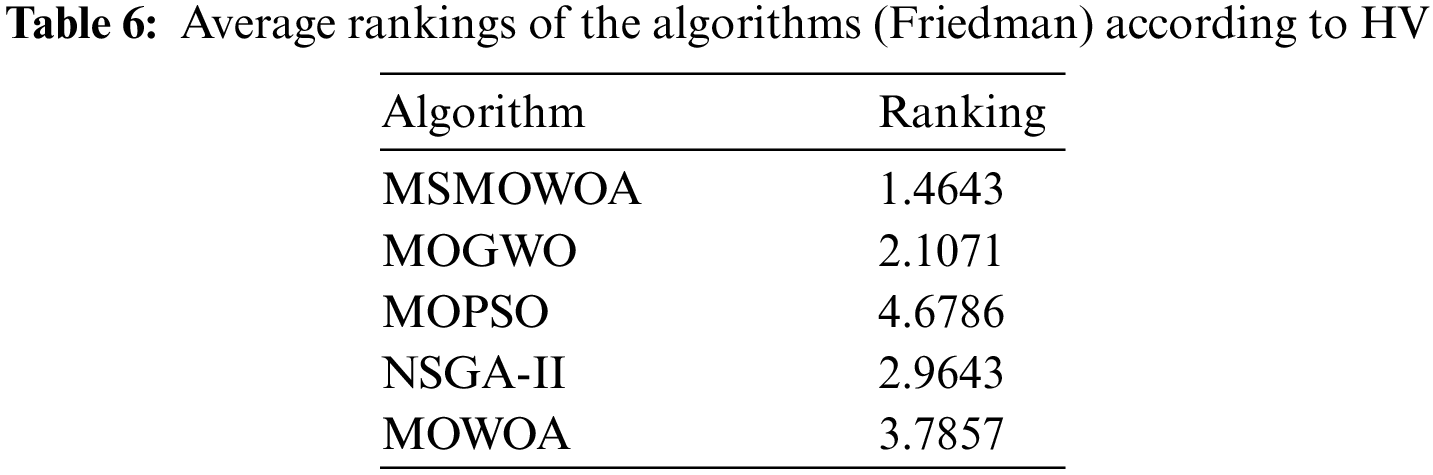
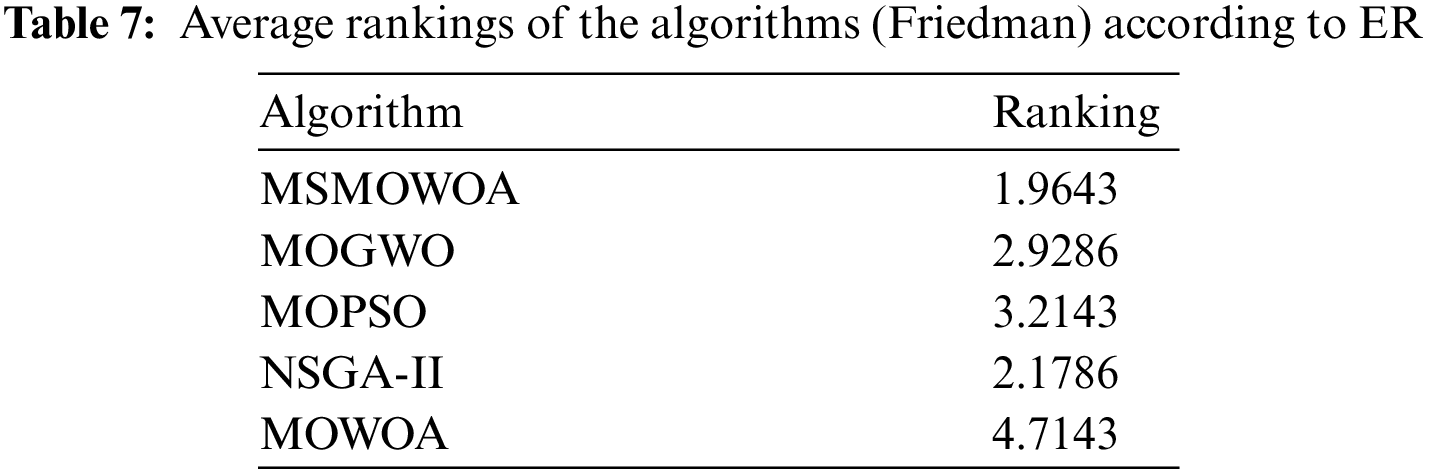
Friedman test is employed to verify the performance of MSMOWOA. The Friedman test is a nonparametric hypothesis test that can be used when comparing the performance of multiple sets of algorithms. The algorithm ranks the performance of each algorithm on various data sets and then determines whether each group of algorithms is truly significantly different by statistical ranking differences. Error rate and HV indicators both are used to verify the performance of MSMOWOA. The results are listed in Tables 6 and 7, respectively. From Table 6, it is seen that MSMOWOA can rank first place in terms of HV indicator. Likewise, from Table 7, it is seen that MSMOWOA also obtains first place in terms of error rate. Therefore, according to the results, MSMOWOA shows better potential compared to other multi-objective evolutionary algorithms.
In order to clearly illustrate the overall performance of MSMOWOA, three key indicators including error rate, feature rate, and HV are selected to compute their average rank on each dataset. The result is shown in Fig. 8. From Fig. 7, it is noted that MSMOWOA can obtain the best performance on most datasets compared to other algorithms. However, it is also seen that MSMOWOA obtain the worst performance on the Hill Valley with noise, Urban Land Cover1, and Asian Religions. The number of the worst performance obtained by MSMOWOA on all datasets is the fewest than that of other algorithms.
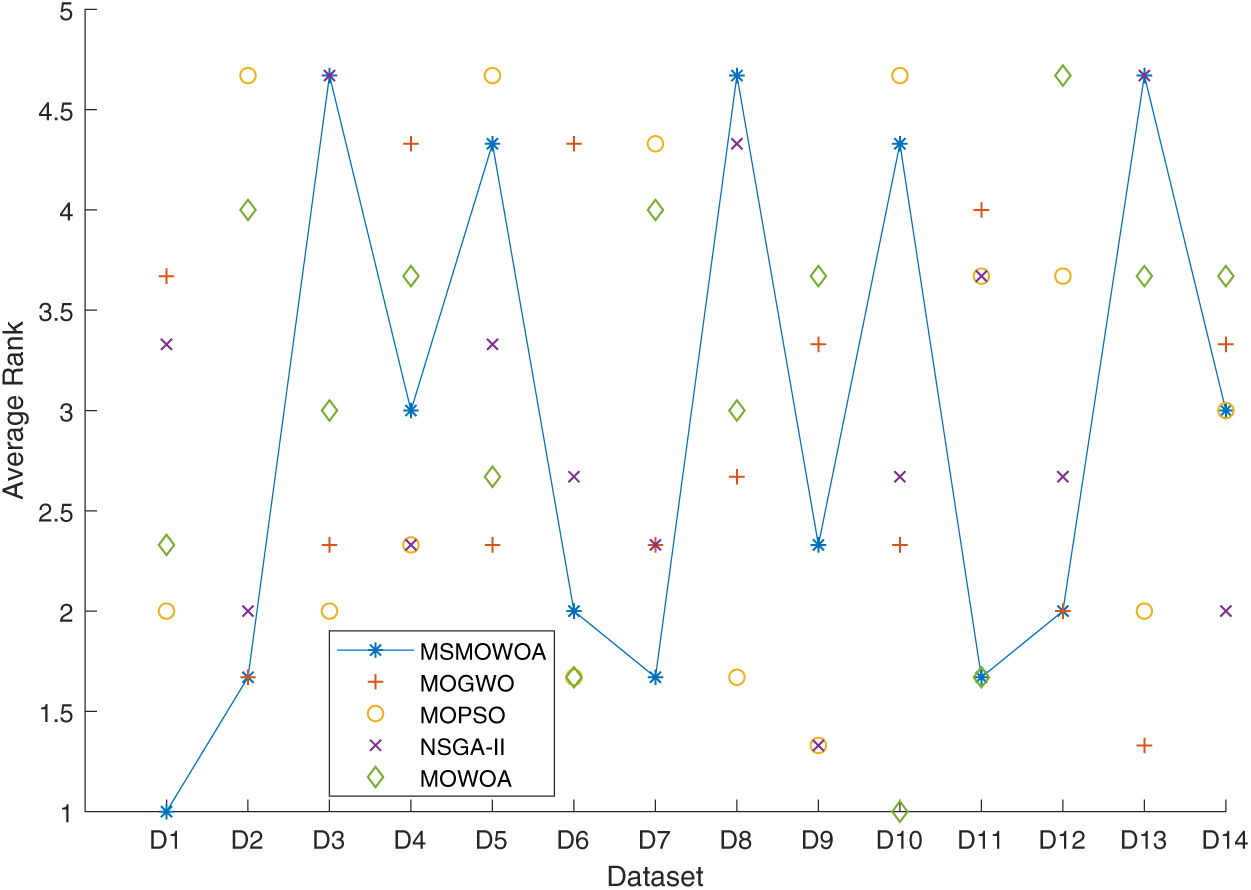
Figure 8: Average rank of each algorithm on all datasets in terms of error rate, feature rate, and HV indicators. D1 (audit risk), D2 (German), D3 (Hill Valley with noise), D4 (ionosphere), D5 (Iris), D6 (page blocks), D7 (SPECT), D8 (Urban Land Cover1), D9 (Vehicle Silhouettes), D10 (Vehicle Silhouettes), D11 (zoo), D12 (arcene1), D13 (Asian Religions) and D14 (gastroenterology1)
In this paper, a multi-strategy assisted multi-objective whale optimization algorithm (MSMOWOA) is proposed to solve the feature selection problem. The MOWOA algorithm is improved by adjusting the balance point between the exploration and exploitation stages, which reduces the proportion of whales searching for local optima during the development stage and improves the ability to find global optima. Additionally, a hybrid grey wolf optimization strategy is integrated to enhance local development capability while retaining global search ability. The use of Levy distribution random numbers further enables mutation of poorly performing individuals in the whale population, improving its ability to escape from local optima and enhancing its global search ability. Finally, an adaptive mutation strategy is added to increase the mutation probability of low-fitness individuals and accelerate convergence speed. MSMOWOA is compared with other multi-objective optimization algorithms such as MOWOA and MOPSO on 14 benchmark datasets, demonstrating significant improvements in evaluation metrics such as average error rate and hypervolume (HV).
However, Compared with the original MOWOA, MSMOWOA has a significantly higher time complexity due to the integration of the computationally expensive grey wolf algorithm and the addition of an adaptive mutation strategy. However, MSMOWOA still outperforms NSGA-II on most datasets and MOGWO on some datasets. To further improve the proposed MSMOWOA algorithm, reducing its time complexity is a feasible idea. Other spiral curves such as hyperbolic spiral [61] and Fermat’s spiral [62] can be introduced into the position updating mechanism to enable whales to converge faster towards the fish shoal (optimal solution). In addition, the performance of MSMOWOA algorithm on unbalanced datasets [63,64] needs further research. For example, cloning some samples and generating some samples can be considered to verify the performance of MSMOWOA.
Acknowledgement: The authors wish to express their appreciation to the reviewers for their helpful suggestions which greatly improved the presentation of this paper.
Funding Statement: This work was supported in part by the Natural Science Youth Foundation of Hebei Province under Grant F2019403207, in part by the PhD Research Startup Foundation of Hebei GEO University under Grant BQ2019055, in part by the Open Research Project of the Hubei Key Laboratory of Intelligent Geo-Information Processing under Grant KLIGIP-2021A06, in part by the Fundamental Research Funds for the Universities in Hebei Province under Grant QN202220, in part by the Science and Technology Research Project for Universities of Hebei under Grant ZD2020344, in part by the Guangxi Natural Science Fund General Project under Grant 2021GXNSFAA075029.
Author Contributions: Methodology: Chong Zhou; Formal analysis and investigation: Deng Yang; Writing-original draft preparation: Deng Yang; Writing-review and editing: Xuemeng Wei; Funding acquisition: Chong Zhou; Resources: Chong Zhou, Zhikun Chen, Zheng Zhang; Supervision: Chong Zhou.
Availability of Data and Materials: All data supporting the findings of this study are available within the paper. All datasets used in the paper can be accessed from http://archive.ics.uci.edu/.
Conflicts of Interest: The authors declare that they have no conflicts of interest to report regarding the present study.
References
1. Goel, T., Murugan, R., Mirjalili, S., Chakrabartty, D. K. (2022). Multi-COVID-Net: Multi-objective optimized network for COVID-19 diagnosis from chest X-ray images. Applied Soft Computing, 115, 108250. https://doi.org/10.1016/j.asoc.2021.108250 [Google Scholar] [PubMed] [CrossRef]
2. Hu, J., Heidari, A. A., Shou, Y., Ye, H., Wang, L. et al. (2022). Detection of COVID-19 severity using blood gas analysis parameters and Harris hawks optimized extreme learning machine. Computers in Biology and Medicine, 142, 105166. https://doi.org/10.1016/j.compbiomed.2021.105166 [Google Scholar] [PubMed] [CrossRef]
3. Htun, H. H., Biehl, M., Petkov, N. (2023). Survey of feature selection and extraction techniques for stock market prediction. Financial Innovation, 9(1), 26. https://doi.org/10.1186/s40854-022-00441-7 [Google Scholar] [PubMed] [CrossRef]
4. Aghdam, M. H., Ghasem-Aghaee, N., Basiri, M. E. (2009). Text feature selection using ant colony optimization. Expert Systems with Applications, 36(3), 6843–6853. https://doi.org/10.1016/j.eswa.2008.08.022 [Google Scholar] [CrossRef]
5. Gheyas, I. A., Smith, L. S. (2010). Feature subset selection in large dimensionality domains. Pattern Recognition, 43(1), 5–13. [Google Scholar]
6. Dash, M., Liu, H. (1997). Feature selection for classification. Intelligent Data Analysis, 1(3), 131–156. [Google Scholar]
7. Xue, B., Zhang, M., Browne, W. N., Yao, X. (2015). A survey on evolutionary computation approaches to feature selection. IEEE Transactions on Evolutionary Computation, 20(4), 606–626. [Google Scholar]
8. Ghasemi, F., Neysiani, B. S., Nematbakhsh, N. (2020). Feature selection in pre-diagnosis heart coronary artery disease detection: A heuristic approach for feature selection based on information gain ratio and Gini index. 2020 6th International Conference on Web Research (ICWR), IEEE. [Google Scholar]
9. Urbanowicz, R. J., Meeker, M., La Cava, W., Olson, R. S., Moore, J. H. (2018). Relief-based feature selection: Introduction and review. Journal of Biomedical Informatics, 85, 189–203. https://doi.org/10.1016/j.jbi.2018.07.014 [Google Scholar] [PubMed] [CrossRef]
10. Azhagusundari, B., Thanamani, A. S. (2013). Feature selection based on information gain. International Journal of Innovative Technology and Exploring Engineering (IJITEE), 2(2), 18–21. [Google Scholar]
11. Ranjan, N. M., Prasad, R. S. (2018). LFNN: Lion fuzzy neural network-based evolutionary model for text classification using context and sense based features. Applied Soft Computing, 71, 994–1008. https://doi.org/10.1016/j.asoc.2018.07.016 [Google Scholar] [CrossRef]
12. Reeves, S. J., Zhe, Z. (1999). Sequential algorithms for observation selection. IEEE Transactions on Signal Processing, 47(1), 123–132. https://doi.org/10.1109/78.738245 [Google Scholar] [CrossRef]
13. Kl, F., Kaya, Y., Yildirim, S. (2021). A novel multi population based particle swarm optimization for feature selection. Knowledge-Based Systems, 219(4), 106894. [Google Scholar]
14. Hu, X. M., Zhang, S. R., Li, M., Deng, J. D. (2021). Multimodal particle swarm optimization for feature selection. Applied Soft Computing, 113, 107887. [Google Scholar]
15. Nguyen, B. H., Xue, B., Andreae, P., Zhang, M. (2019). A new binary particle swarm optimization approach: Momentum and dynamic balance between exploration and exploitation. IEEE Transactions on Cybernetics, 51(2), 589–603. [Google Scholar]
16. Raymer, M. L., Punch, W. F., Goodman, E. D., Kuhn, L. A., Jain, A. K. (2000). Dimensionality reduction using genetic algorithms. IEEE Transactions on Evolutionary Computation, 4(2), 164–171. https://doi.org/10.1109/4235.850656 [Google Scholar] [CrossRef]
17. Qasim, O. S., Noori, N. M. (2021). A new hybrid algorithm based on binary gray wolf optimization and firefly algorithm for features selection. Asian-European Journal of Mathematics, 14(10), 2150172. [Google Scholar]
18. Al-Tashi, Q., Kadir, S. J. A., Rais, H. M., Mirjalili, S., Alhussian, H. (2019). Binary optimization using hybrid grey wolf optimization for feature selection. IEEE Access, 7, 39496–39508. [Google Scholar]
19. Hancer, E., Xue, B., Zhang, M., Karaboga, D., Akay, B. (2018). Pareto front feature selection based on artificial bee colony optimization. Information Sciences, 422, 462–479. https://doi.org/10.1016/j.ins.2017.09.028 [Google Scholar] [CrossRef]
20. Zorarpaci, E., Özel, S. A. (2016). A hybrid approach of differential evolution and artificial bee colony for feature selection. Expert Systems with Application, 62, 91–103. [Google Scholar]
21. Ma, B. J., Liu, S., Heidari, A. A. (2022). Multi-strategy ensemble binary hunger games search for feature selection. Knowledge-Based Systems, 248, 108787. https://doi.org/10.1016/j.knosys.2022.108787 [Google Scholar] [CrossRef]
22. Tubishat, M., Ja’afar, S., Alswaitti, M., Mirjalili, S., Idris, N. et al. (2021). Dynamic salp swarm algorithm for feature selection. Expert Systems with Applications, 164, 113873. [Google Scholar]
23. Aljarah, I., Habib, M., Faris, H., Al-Madi, N., Mirjalili, S. (2020). A dynamic locality multi-objective Salp swarm algorithm for feature selection. Computers & Industrial Engineering, 147, 106628. https://doi.org/10.1016/j.cie.2020.106628 [Google Scholar] [CrossRef]
24. Bandyopadhyay, R., Basu, A., Cuevas, E., Sarkar, R. (2021). Harris hawks optimisation with simulated annealing as a deep feature selection method for screening of COVID-19 CT-scans. Applied Soft Computing, 111, 107698. https://doi.org/10.1016/j.asoc.2021.107698 [Google Scholar] [PubMed] [CrossRef]
25. Long, W., Jiao, J., Xu, M., Tang, M., Wu, T. et al. (2022). Lens-imaging learning Harris hawks optimizer for global optimization and its application to feature selection. Expert Systems with Applications, 202, 117255. https://doi.org/10.1016/j.eswa.2022.117255 [Google Scholar] [CrossRef]
26. Houssein, E. H., Mahdy, M. A., Shebl, D., Manzoor, A., Sarkar, R. et al. (2022). An efficient slime Mould algorithm for solving multi-objective optimization problems. Expert Systems with Applications, 187, 115870. https://doi.org/10.1016/j.eswa.2021.115870 [Google Scholar] [CrossRef]
27. Ewees, A. A., Al-Qaness, M. A., Abualigah, L., Algamal, Z. Y., Oliva, D. et al. (2023). Enhanced feature selection technique using slime Mould algorithm: A case study on chemical data. Neural Computing and Applications, 35(4), 3307–3324. https://doi.org/10.1007/s00521-022-07852-8 [Google Scholar] [PubMed] [CrossRef]
28. Hu, J., Gui, W., Heidari, A. A., Cai, Z., Liang, G. et al. (2022). Dispersed foraging slime Mould algorithm: Continuous and binary variants for global optimization and wrapper-based feature selection. Knowledge-Based Systems, 237, 107761. https://doi.org/10.1016/j.knosys.2021.107761 [Google Scholar] [CrossRef]
29. Dokeroglu, T., Deniz, A., Kiziloz, H. E. (2022). A comprehensive survey on recent metaheuristics for feature selection. Neurocomputing, 494, 269–296. [Google Scholar]
30. Mirjalili, S., Lewis, A. (2016). The whale optimization algorithm. Advances in Engineering Software, 95, 51–67. https://doi.org/10.1016/j.advengsoft.2016.01.008 [Google Scholar] [CrossRef]
31. Got, A., Moussaoui, A., Zouache, D. (2021). Hybrid filter-wrapper feature selection using whale optimization algorithm: A multi-objective approach. Expert Systems with Applications, 183, 115312. https://doi.org/10.1016/j.eswa.2021.115312 [Google Scholar] [CrossRef]
32. Wang, J., Ye, M., Xiong, F., Qian, Y. (2021). Cross-scene hyperspectral feature selection via hybrid whale optimization algorithm with simulated annealing. IEEE Journal of Selected Topics in Applied Earth Observations and Remote Sensing, 44, 2473–2483. [Google Scholar]
33. Wang, J., Bei, J., Song, H., Zhang, H., Zhang, P. (2023). A whale optimization algorithm with combined mutation and removing similarity for global optimization and multilevel thresholding image segmentation. Applied Soft Computing, 137, 110130. https://doi.org/10.1016/j.asoc.2023.110130 [Google Scholar] [CrossRef]
34. Pudil, P., Novovičová, J., Kittler, J. (1994). Floating search methods in feature selection. Pattern Recognition Letters, 15(11), 1119–1125. https://doi.org/10.1016/0167-8655(94)90127-9 [Google Scholar] [CrossRef]
35. Caruana, R., Freitag, D. (1994). Greedy attribute selection. Proceedings of the Eleventh International Conference, pp. 28–36. Rutgers University, New Brunswick, NJ, USA. [Google Scholar]
36. Jović, A., Brkić, K., Bogunović, N. (2015). A review of feature selection methods with applications. 2015 38th International Convention on Information and Communication Technology, Electronics and Microelectronics (MIPRO), IEEE. [Google Scholar]
37. Tasci, G., Gun, M. V., Keles, T., Tasci, B., Barua, P. D. et al. (2023). QLBP: Dynamic patterns-based feature extraction functions for automatic detection of mental health and cognitive conditions using EEG signals. Chaos, Solitons & Fractals, 172, 113472. https://doi.org/10.1016/j.chaos.2023.113472 [Google Scholar] [CrossRef]
38. Hammouri, A. I., Mafarja, M., Al-Betar, M. A., Awadallah, M. A., Abu-Doush, I. (2020). An improved dragonfly algorithm for feature selection. Knowledge-Based Systems, 203, 106131. https://doi.org/10.1016/j.knosys.2020.106131 [Google Scholar] [CrossRef]
39. Dhiman, G., Oliva, D., Kaur, A., Singh, K. K., Vimal, S. et al. (2021). BEPO: A novel binary emperor penguin optimizer for automatic feature selection. Knowledge-Based Systems, 211, 106560. https://doi.org/10.1016/j.knosys.2020.106560 [Google Scholar] [CrossRef]
40. Oh, I. S., Lee, J. S., Moon, B. R. (2004). Hybrid genetic algorithms for feature selection. IEEE Transactions on Pattern Analysis and Machine Intelligence, 26(11), 1424–1437. https://doi.org/10.1109/TPAMI.2004.105 [Google Scholar] [PubMed] [CrossRef]
41. Liu, Y., Wang, G., Chen, H., Dong, H., Zhu, X. et al. (2011). An improved particle swarm optimization for feature selection. Journal of Bionic Engineering, 8(2), 191–200. https://doi.org/10.1016/S1672-6529(11)60020-6 [Google Scholar] [CrossRef]
42. Tran, B., Xue, B., Zhang, M. (2017). A new representation in PSO for discretization-based feature selection. IEEE Transactions on Cybernetics, 48(6), 1733–1746. [Google Scholar] [PubMed]
43. Too, J., Mirjalili, S. (2021). A hyper learning binary dragonfly algorithm for feature selection: A COVID-19 case study. Knowledge-Based Systems, 212, 106553. https://doi.org/10.1016/j.knosys.2020.106553 [Google Scholar] [CrossRef]
44. Hamdani, T. M., Won, J. M., Alimi, A. M., Karray, F. (2007). Multi-objective feature selection with NSGA II. ICANNGA 2007: Adaptive and Natural Computing Algorithms, pp 240–247. Warsaw, Poland. [Google Scholar]
45. Xue, B., Zhang, M., Browne, W. N. (2012). Particle swarm optimization for feature selection in classification: A multi-objective approach. IEEE Transactions on Cybernetics, 43(6), 1656–1671. [Google Scholar]
46. Han, F., Chen, W. T., Ling, Q. H., Han, H. (2021). Multi-objective particle swarm optimization with adaptive strategies for feature selection. Swarm and Evolutionary Computation, 62, 100847. https://doi.org/10.1016/j.swevo.2021.100847 [Google Scholar] [CrossRef]
47. Nouri-Moghaddam, B., Ghazanfari, M., Fathian, M. (2021). A novel multi-objective forest optimization algorithm for wrapper feature selection. Expert Systems with Applications, 175, 114737. https://doi.org/10.1016/j.eswa.2021.114737 [Google Scholar] [CrossRef]
48. Piri, J., Mohapatra, P., Pradhan, M. R., Acharya, B., Patra, T. K. (2021). A binary multi-objective chimp optimizer with dual archive for feature selection in the healthcare domain. IEEE Access, 10, 1756–1774. [Google Scholar]
49. Zhang, Y., Zhang, Y., Zhang, C., Zhou, C. (2022). Multiobjective Harris hawks optimization with associative learning and chaotic local search for feature selection. IEEE Access, 10, 72973–72987. https://doi.org/10.1109/ACCESS.2022.3189476 [Google Scholar] [CrossRef]
50. Wang, Z., Gao, S., Zhou, M., Sato, S., Cheng, J. et al. (2023). Information-theory-based nondominated sorting ant colony optimization for multiobjective feature selection in classification. IEEE Transactions on Cybernetics, 53(8), 5276–5289. https://doi.org/10.1109/TCYB.2022.3185554 [Google Scholar] [PubMed] [CrossRef]
51. Li, X., Fu, Q., Li, Q., Ding, W., Lin, F. et al. (2023). Multi-objective binary grey wolf optimization for feature selection based on guided mutation strategy. Applied Soft Computing, 145, 110558. https://doi.org/10.1016/j.asoc.2023.110558 [Google Scholar] [CrossRef]
52. Mafarja, M. M., Mirjalili, S. (2017). Hybrid whale optimization algorithm with simulated annealing for feature selection. Neurocomputing, 260, 302–312. https://doi.org/10.1016/j.neucom.2017.04.053 [Google Scholar] [CrossRef]
53. Hussien, A. G., Hassanien, A. E., Houssein, E. H., Bhattacharyya, S., Amin, M. (2019). S-shaped binary whale optimization algorithm for feature selection. In: Recent trends in signal and image processing: ISSIP 2017. Springer. [Google Scholar]
54. Mafarja, M., Mirjalili, S. (2018). Whale optimization approaches for wrapper feature selection. Applied Soft Computing, 62, 441–453. https://doi.org/10.1016/j.asoc.2017.11.006 [Google Scholar] [CrossRef]
55. Zheng, Y., Li, Y., Wang, G., Chen, Y., Xu, Q. et al. (2018). A novel hybrid algorithm for feature selection based on whale optimization algorithm. IEEE Access, 7, 14908–14923. [Google Scholar]
56. Agrawal, R., Kaur, B., Sharma, S. (2020). Quantum based whale optimization algorithm for wrapper feature selection. Applied Soft Computing, 89, 106092. https://doi.org/10.1016/j.asoc.2020.106092 [Google Scholar] [CrossRef]
57. Too, J., Mafarja, M., Mirjalili, S. (2021). Spatial bound whale optimization algorithm: An efficient high-dimensional feature selection approach. Neural Computing and Applications, 33, 16229–16250. https://doi.org/10.1007/s00521-021-06224-y [Google Scholar] [CrossRef]
58. Coello, C. A. C., Pulido, G. T., Lechuga, M. S. (2004). Handling multiple objectives with particle swarm optimization. IEEE Transactions on Evolutionary Computation, 8(3), 256–279. https://doi.org/10.1109/TEVC.2004.826067 [Google Scholar] [CrossRef]
59. Mirjalili, S., Saremi, S., Mirjalili, S. M., Coelho, L.d S. (2016). Multi-objective grey wolf optimizer: a novel algorithm for multi-criterion optimization. Expert Systems with Applications, 47, 106–119. [Google Scholar]
60. Deb, K., Pratap, A., Agarwal, S., Meyarivan, T. (2002). A fast and elitist multiobjective genetic algorithm: NSGA-II. IEEE Transactions on Evolutionary Computation, 6(2), 182–197. https://doi.org/10.1109/4235.996017 [Google Scholar] [CrossRef]
61. Weh, L. (2001). Hyperbolic spirals as surface structures in thin layers. Journal of Colloid and Interface Science, 235(2), 210–217. https://doi.org/10.1006/jcis.2000.7365 [Google Scholar] [PubMed] [CrossRef]
62. Zhao, H., Gu, F., Huang, Q. X., Garcia, J., Chen, Y. et al. (2016). Connected Fermat spirals for layered fabrication. ACM Transactions on Graphics, 35(4), 1–10. [Google Scholar]
63. Pei, W., Xue, B., Zhang, M., Shang, L., Yao, X. et al. (2023). A survey on unbalanced classification: How can evolutionary computation help? IEEE Transactions on Evolutionary Computation. https://doi.org/10.1109/TEVC.2023.3257230 [Google Scholar] [CrossRef]
64. Sun, L., Si, S., Ding, W., Wang, X., Xu, J. (2023). TFSFB: Two-stage feature selection via fusing fuzzy multi-neighborhood rough set with binary whale optimization for imbalanced data. Information Fusion, 95, 91–108. https://doi.org/10.1016/j.inffus.2023.02.016 [Google Scholar] [CrossRef]
Cite This Article
 Copyright © 2024 The Author(s). Published by Tech Science Press.
This work is licensed under a Creative Commons Attribution 4.0 International License , which permits unrestricted use, distribution, and reproduction in any medium, provided the original work is properly cited.
 Downloads
 Citation Tools